Embed Size (px)
Citation preview

23rd World Gas Conference, Amsterdam 2006
APPLICATION OF WET GAS METERING TECHNIQUES TO GAS PRODUCTION & ALLOCATION: FIELD CASES & WAY
FORWARD
Author
Jean-Paul Couput, TOTAL
FRANCE

ABSTRACT Oil & gas producers have to develop and transport gas in conditions that are more severe and
challenging than in the past. Such situations require that the operators be capable of producing gas at high pressure conditions, to transport it safely with associated liquid and water using long tie backs and to share production & transportation systems for obvious economical & environmental reasons.
The paper demonstrates how wet gas metering (WGM) techniques which offer the possibility
of directly measuring gas flow rates and liquid contents such as water, using in-line metering without separation, are becoming a key component in upstream, allowing to develop and produce marginal and high-water-depth fields.
The experience TOTAL has gained so far in subsea (Gulf of Mexico) and offshore gas field
development with wet gas metering techniques is presented. Focus is placed on available solutions, field implementation and operation, advantages and disadvantages. Applications for fiscal gas and liquid allocation as well as in real time production monitoring are described.
In conclusion, TOTAL’s views regarding the status of wet gas metering and how to reduce
gaps between dry gas metering & wet gas metering are presented through an overview of on-going R&D and standardization work.
Verwijderd: APPLICATION OF NORTH SEA FLOW MEASUREMENT WORKSHOP¶28TH -31ST OCTOBER 2003¶¶WET GAS METERING TECHNIQUES TO GAS PRODUCTION & ALLOCATION ALLOCATION ON THE CANYON EXPRESS PROJECT: FIELD CASES & WAY FORWARD ¶¶¶CHRIS COOLEY, TOTAL ¶JEAN-PAUL COUPUT, TOTAL ¶WINSOR LETTON, LETTON-HALL GROUP¶JAMES HALL, LETTON-HALL GROUP

TABLE OF CONTENTS
1. INTRODUCTION 2. CONTEXT & NEEDS 3. IN-LINE WET GAS METERING STRATEGY & SOLUTIONS 4. SUBSEA WET GAS METERING EXPERIENCE IN GAS & LIQUID ALLOCATION 5. TOPSIDE WET GAS METERING EXPERIENCE FORE RESERVOIR MONITORING &
PRODUCTION MANAGEMENT 6. WET GAS METERING DEVELOPMENT PERSPECTIVES 7. THE WAY FORWARD & CONCLUSIONS 8. REFERENCES

1. INTRODUCTION To comply with the increasing demand in gas, oil & gas production companies are now
developing gas & gas condensate fields which, for technical and / or economic reasons, were not accessible in the past using conventional techniques. This concerns, for example, offshore developments in harsh conditions, marginal field production and subsea developments under considerable water depths.
With its West Africa & Gulf of Mexico developments, TOTAL has pioneered in ultra deep water
subsea developments, which is expected to cover at least 30% of the increase in production for international oil & gas majors.
In this context, an urgent need for wet gas metering techniques applicable to the
measurement of wet gas mixed with liquids has emerged in the upstream area from wells to processing plants.
Such flow measurements are becoming more challenging than dry gas measurements due to
the combination of production constraints, additional functionality and contractual requirements for gas allocation. Gas flow rate measurements and detailed gas flow characterization, like liquid content, are becoming key elements in producing, allocating & transporting gas safely from wells to onshore or offshore processing installations.
Well-established techniques used for gas measurements in the vapour phase are obviously
limited when measuring & monitoring produced & transported wet gas streams comprising gas, water and hydrocarbon condensates.
The field implementation of new wet gas metering techniques is a reality which has now
allowed new gas resources to be developed & produced both subsea & topside, to deliver gas either to gas markets or to LNG plants.
This paper is a review of the metering needs and strategy. Some TOTAL field applications
using such wet gas meters (WGMs) are described as practical examples of successful implementation. How such meters are used for production monitoring & allocation will be developed. Several lessons that were learnt are also presented. Finally several results from ongoing R&D and development perspectives in industry & standardization will also be discussed.
2. CONTEXT & NEEDS Offshore gas production systems have been streamlined, from complex systems with many
surface installations (wellhead platform, central processing platform) to systems with minimum surface installations and maximum subsea facilities to access the gas. This is especially the case in high water depths and artic conditions. This change has also been driven by the concern for environmental impact.
This has resulted in schemes and long tie backs, where wells and fields are located far from
processing installations (up to hundreds of kilometres, in subsea wells & in pipelines where production from different reservoirs & owners is commingled and transported before any processing). The wet gas streams to be measured and monitored are multiphase fluids, with gas as the predominant phase as defined by ISO TC 193 WG3 Upstream area [1] but with significant amounts of liquids such as salty formation water, condensed water, liquid hydrocarbons with GVF(*) > 90% .
Verwijderd: ¶¶¶
Verwijderd: TGas flow measurements in the upstream area is now more and more challenging du thigh constraints due to development in extreme conditions . To …TOTAL…like other gas producers started to… …p…new …reserves… where installations are unmanned …gas …new high water depths …gas includinglike
Verwijderd: like Girassol Canyon Express with Aconcagua field in
Verwijderd: 
Verwijderd: Gas …are more and more… … supply to buyers… . In this challenging context , f…and …distant topside…sVerwijderd: is produced & transported in combination with…liquids like
Verwijderd: Such a mixture , called wet gas has geneated , …new …able to be used multiphase gas streams which are now applied in upstream developments …ing
Verwijderd: T…cases…can be…last … …
Verwijderd: and capability to measure accurately the gas with entrained liquids like condensate & water was required . 
Verwijderd: IN SEPTEMBER 2002, PRODUCTION FROM THE THREE FIELDS THAT TOGETHER FORM THE CANYON EXPRESS PROJECT - KING'S PEAK, ACONCAGUA, AND CAMDEN HILLS - WAS BEGUN. DRILLED IN RECORD WATER DEPTHS OF 2000 TO 2200 METERS IN THE EASTERN GULF OF MEXICO, EACH OF THE NINE WELLS WAS CONNECTED TO ONE OF TWO 12-INCH PIPELINES CARRYING THE COMMINGLED WET GAS Verwijderd: networks…dramatically …simpler installation…t…ah…new subsea projects but also by
Verwijderd: t…both … …) and
Verwijderd: Architecture = long tie backs , …,
Verwijderd: in which
Verwijderd:
... [3]
... [7]
... [4]
... [8]
... [5]
... [9]
... [1]
... [10]
... [2]
... [6]

(*) GVF is the gas volume flow rate, relative to the multiphase volume flow rate, at the
pressure and temperature prevailing in that section. The GVF is normally expressed as a fraction or percentage.
The flow regime expected in
such multiphase streams depends on the liquid content, the phase velocity and the pipe geometry. The attached flow map extracted from the NFOGM Handbook of Multiphase metering [2] shows typical flow regimes which may be encountered in wet gas meters in horizontal conditions: mist, annular, annular mist, wave…
0.01 0.1 1.0 10 100
0.1
1.0
10
100
0.01
Superficial gas velocity (m/s)
Superficial l iquid velocity(m/s)
Bubble
Slug
Stratified
Wave
Annular
Mist
PlugMist
As regards the measurements, wet-gas metering systems give flows and data for the following
purposes:
• Well & reservoir monitoring In most subsea cases, there is no specific test line to individually test wells. For topsides, the
replacement of the test separator by in-line compact metering systems for well testing / metering is necessary both to cutback CAPEX and OPEX and for environmental reasons. In addition to hydrocarbon measurements, detection of low water fractions in the range of 0.1% to 0.05% need to be considered with the possibility of differentiating between freshwater & saltwater to detect formation water breakthrough in gas well cases.
• Fiscal Allocation
The targets for gas have been dropping from 5% to 2%, depending on cases. For hydrocarbon liquids, targets depend on liquid value & quantity.
• Production management
In terms of operation, the challenge consists in producing economically and safely in multiphase conditions, at high pressure, low outside temperature and in high water depths, while meeting gas delivery requirements.
A specific point when producing &
exporting multiphase streams is flow assurance, which consists in managing all potential problems such as flow stabilization, hydrate prevention, corrosion & erosion. The prevention and remediation of hydrate formation requires the estimation of water quantities to optimise methanol injection and to stay within operational limits
Ideally, wet gas metering systems should give gas, water & condensate flow rates which can
be installed on topsides or subsea, and which can be operated with minimum intervention and maintenance. Freshwater - saltwater differentiation may be required for corrosion issues in large pipeline systems.
Hydrate Formation
Operational Limits
T
P
Water saturation
Verwijderd: . In most of the high water depths developments , all production wells are tie to production lines
Verwijderd: The stream ( wet gas ) to measure and monitor are multiphasic fluid with a gas predominant phase ( more than 90% in vol/vol as defined by ISO TC 193 WG3 Upstream area ) but with s like formation & condenaste and solids . Flow regime of such multiphase streams depend on liquid content , phase velocity and pipe geometry . The attached flow map extracted from the NFOGM Handbook of Multiphase metering is showing typical flow regimes which may appear in wet gas meters with horizonal conditions : mist , annular , annular mist , wa Tupstream ()
Verwijderd: :
Verwijderd: ¶the
Verwijderd: is
Verwijderd: to
Verwijderd: an dat same time to be able in such conditions ( huig pressure , low outside temperatire ) to manage
Verwijderd: efficiently all issues related to flow like hydrate prevention , corrosion & erosion . the capability to quantify water for methanol injection optimization is obviously a good justifiactionfor accurae water measurements in wet ags conditions
Verwijderd: ¶¶On the measurement point of view , the target is to measure & determine gas flow rates but also liquids contents with suitable accuracy for the following purposes¶¶<#>Production management ¶<#>Well & reservoir monitoring detect water breakthrough without specific test line for wells ¶Fiscal Allocation
The preferred design is an in-line full-bore system to give operators a “real-time picture” of the
flow, of minimum size and weight for easy retrievability in the case of a subsea installation.
3. IN-LINE WET GAS METERING STRATEGY & SOLUTIONS Several strategies using in-line wet gas metering systems can be now used, depending on the
application (topsides, subsea) and on the information required. The market offer [Table 1] has evolved from single-phase systems used on topside applications where frequent sampling and periodic calibration with a test separator is achievable to two-phase measuring systems and now three-phase wet gas metering systems, which are becoming the standard for subsea applications.
Measurements Required input Application
< 2000 Gas Liquid content Topside gas allocation 2000- 2003 Gas & liquids Water Liquid ratio Subsea gas allocation 2003- 2005 HC & water Condensate Gas ratio Subsea and topside well metering and
production management 2006 - 2007 Gas, Liquid &
water Topside and subsea allocation, well
metering and production management Table 1: In-line wet-gas metering systems
The first class corresponds to simple venturi meters with specific algorithms to correct the
measurement for the influence of liquid content. The second class corresponds to systems providing gas measurements and liquid
measurements (liquid or water). They use a combination of two different measurements: one differential pressure dP system and another system (dP, ultrasonic, vortex – for liquid, or microwave - for water).
The third class corresponds to true three-phase wet gas metering systems giving three-phase
measurement capability using venturi + dual gamma, venturi + dP + microwaves or another combination.
Verwijderd: 
Verwijderd: THE CAPABILITY TO DETECT WATER BREAKTHROUGH , TO QUANTIFY WATER FOR METHANOL INJECTION OPTIMIZATION & WITH WELL PERFORMANCE INDICATORS
Verwijderd: ¶Since a couple of years there are s
Verwijderd: a
Verwijderd: which in fact
Verwijderd: One can mesure one phase , two phase or 3 phses 
Verwijderd: Limitation
Verwijderd: to be input
Verwijderd: R
Verwijderd: not known
Verwijderd: GR to be input
Verwijderd: W
Verwijderd: etering
Verwijderd: onitoring
Verwijderd: pruduction
Verwijderd: correction
Verwijderd: do
Verwijderd: two pahse
Verwijderd: ing
Verwijderd: r
Verwijderd: systems :
Verwijderd: 2
Verwijderd: s
Verwijderd: for insdtance to derive gas & liquid , 1
Verwijderd: and o
Verwijderd: n
Verwijderd: meter or
Verwijderd: one
Verwijderd: one dP and one electictal system to dereive water
Verwijderd: third
Verwijderd: correspong to systems which a combine a
Verwijderd:
Verwijderd: pr
Verwijderd: gamma + elcticla

4. SUBSEA WET GAS METERING EXPERIENCES IN GAS & LIQU ID ALLOCATION [3, 4]
Aconcagua is a field operated by TOTAL, with wells drilled in record water depths of 2000 to
2200 meters in the Eastern Gulf of Mexico. It was developed in conjunction with King's Peak and Camden Hills fields, with different ownerships. The three fields that together form the Canyon Express Project began producing in September 2002.
Each of the nine wells is
connected to one of the two 12-inch pipelines carrying the commingled wet gas back to the Canyon Station platform for processing, 91 kilometres away. A metering solution / scheme consisting in one wet gas meter per well was chosen and agreed on by all operators as the only way to run the subsea gas allocation to determine ownership of gas and liquids.
At that time, dual-differential
DualStream II wet gas meters from ISA Solartron were the most advanced systems in terms of robustness & marinization.
The meter incorporates two
differential devices (wedge and Venturi) in a single meter. The difference between the two characteristic overread curves of the two dP systems can be used to derive the liquid fraction. The meters were installed in a jumper configuration. The transmitters have triple redundancy.
∆P2∆P1P1 T1
VENTURIVENTURI WEDGEWEDGEMIXERMIXER

A typical differential overread curve for a venturi meter is shown with the device
overreading gΦ plotted against the well-
known Lockhart-Martinelli parameter [5, 6]:
g
g
g
pYQm
Φ
∆=
ρ2
Where Qmg, ρg, ∆p, Y and Фg are respectively the gas mass flow rate, the gas density, the pressure drop along the device, a corrective coefficient relevant to the device and the overreading factor
gΦ accounting for the presence of liquid
Because the gas from all three fields is relatively "dry" (Lockhart-Martinelli parameter < 0.01,
GVF > 99%) and because the operating pressures are quite high (~ 250 bar) these devices had heretofore not been used in this area of application. Careful and thorough measurement testing and calibration were carried out at a reference facility based in San Antonio. The test programme for the meter was quite exhaustive, covering not only pressure variations but also liquid loading and, to some degree, liquid composition.
The relative uncertainties for gas flow measurement are generally less than 3% for all GVF,
and from less than 20% up to 99% GVF for liquid flow measurement. Even though the production from all Canyon Express fields was expected to be very dry gas,
each partner was keen to know the onset of water production from any well to optimise hydrate remediation and methanol injection. Combined liquid (water, methanol, and condensate) from any single well was not expected to exceed 20 m3 /MSm3 at startup.
Lessons More than 3 years of experience have allowed us to learn and develop useful practices. Differential -based wet gas meters for subsea allocation Differential flow meters can operate successfully subsea, even at record depths and have
been used for gas allocation. While some sensors have failed, the redundancy that was incorporated in each metering system has permitted them to function acceptably. There are some limitations to the accurate measurement of liquids (and water) especially at GVF > 99% which can result in some errors in the gas. This is not surprising as such meters determine the liquid content by calculating the overread difference of two differential devices. Such an overread is associated with a significant uncertainty [7] which generates errors. This has been solved by appropriate calibration procedures.
On-line calibration On line verification of the performance of each individual subsea allocation meter using the
meters on the Canyon Station platform as a reference has proved to be viable approach. A direct intervention on a meter would be extremely expensive and for contractual reasons, reductions in gas production should be avoided or minimized, where possible.
The method developed for Canyon Express involved careful calibration of individual meters
using difference methods. That is, while the flow through all the other meters on an individual flow line are maintained constant (or as nearly so as possible), flow through the meter being tested and the reference meter are observed at three or more flow rates ranging from full flow down to shut-in.
0
0.1
0.2
0.3
0.4
0.5
0.6
0.7
0.8
0.9
1
0 0.05 0.1 0.15 0.2 0.25 0.3 0.35 0.4 0.45
LockHart-Martinelli
Fra
ctio
n O
ver
-re
ad
Venturi Linear (Venturi)
Verwijderd: :

Data validation by imbalance monitoring Monitoring the imbalances between well data & topsides has proved to be a valuable tool
accepted by partners & authorities, for detecting any incorrect meter and for performing the necessary actions. For instance, when the 7-day balance check exceeded -3 %, prescribed actions were undertaken.
Well fluids and hydrates can alter differential -based wet gas meter performance In the Canyon Express case, the scale that formed on the pipe walls in and around certain
meters was identified as the source of the some imbalances observed on both flow lines. Operators must be prepared to recognize and deal with this possibility.
For WGMs used in subsea environments, it is essential to ensure that impulse lines from flow
to transmitters are protected against hydrate plugging and can be flushed if necessary. Flushing the capillary tubes with methanol is a fairly inexpensive capital expense compared to an ROV vessel intervention at $150K. On Canyon Express, methanol was continuously injected so hydrate plugging was not a concern. As it is likely that future projects similar to Canyon Express will experience situations where it is preferable to flow a well without injecting methanol in it (while protecting the flow line via an upstream well), it is recommended that heat transfer on future subsea meter capillaries be thoroughly reviewed and that heat tracing be considered.
Installation Topside meters need to be cleaned periodically, so it is realistic that subsea meters in harsher
environments next to the well will also need some form of cleaning or upgrade. Therefore, retrievability of wet gas flow meters also needs to be considered in the design, to allow the meter to be removed without major drawbacks & risks such as disconnecting the jumper.
Verwijderd: The use of these meters on the nine wells making up the Canyon Express Project is reviewed and discussed in detail. Their unusual performance is explained, and the route to an acceptable overall measurement experience is explored, including the manner in which successful allocation was achieved. Finally, several important lessons that were learned during the course of the project are presented.¶¶
5. TOPSIDE WET GAS METERING EXPERIENCE FOR RESERVOIR
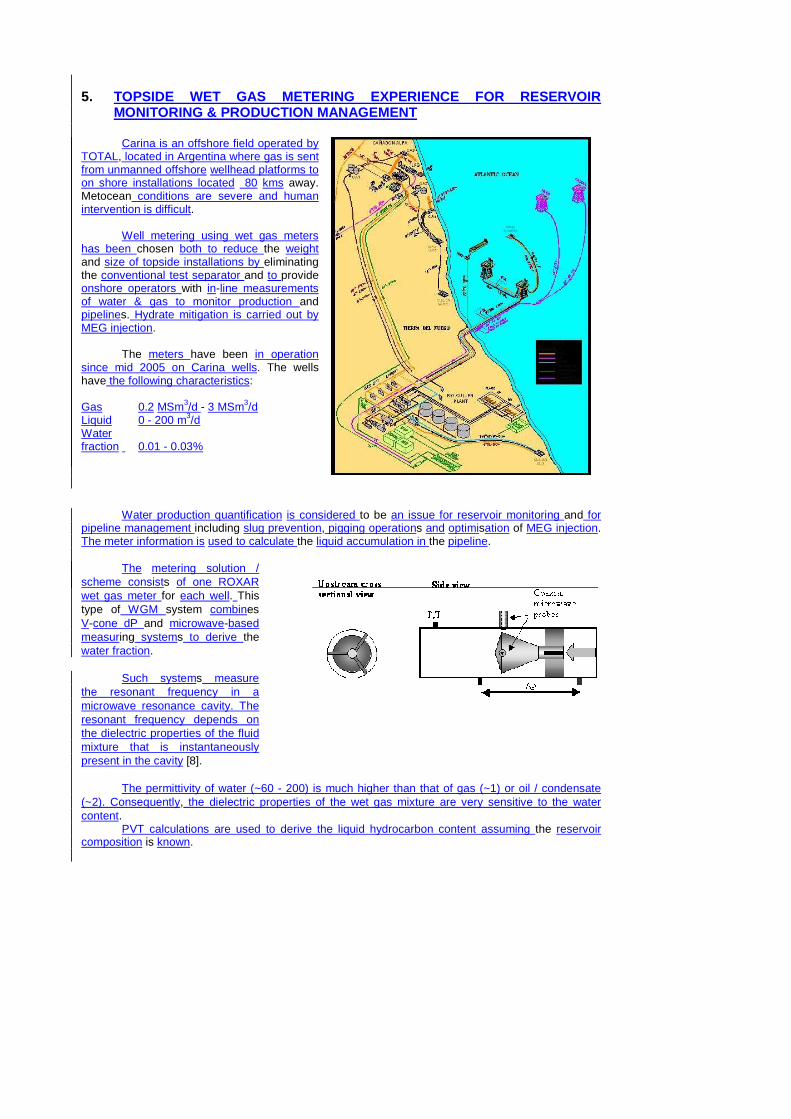
MONITORING & PRODUCTION MANAGEMENT Carina is an offshore field operated by
TOTAL, located in Argentina where gas is sent from unmanned offshore wellhead platforms to on shore installations located 80 kms away. Metocean conditions are severe and human intervention is difficult.
Well metering using wet gas meters
has been chosen both to reduce the weight and size of topside installations by eliminating the conventional test separator and to provide onshore operators with in-line measurements of water & gas to monitor production and pipelines. Hydrate mitigation is carried out by MEG injection.
The meters have been in operation
since mid 2005 on Carina wells. The wells have the following characteristics:
Gas 0.2 MSm3/d - 3 MSm3/d Liquid 0 - 200 m3/d Water fraction 0.01 - 0.03%
Water production quantification is considered to be an issue for reservoir monitoring and for pipeline management including slug prevention, pigging operations and optimisation of MEG injection. The meter information is used to calculate the liquid accumulation in the pipeline.
The metering solution /
scheme consists of one ROXAR wet gas meter for each well. This type of WGM system combines V-cone dP and microwave-based measuring systems to derive the water fraction.
Such systems measure
the resonant frequency in a microwave resonance cavity. The resonant frequency depends on the dielectric properties of the fluid mixture that is instantaneously present in the cavity [8].
The permittivity of water (~60 - 200) is much higher than that of gas (~1) or oil / condensate
(~2). Consequently, the dielectric properties of the wet gas mixture are very sensitive to the water content.
PVT calculations are used to derive the liquid hydrocarbon content assuming the reservoir composition is known.

Lessons WGMs have been found to give consistent gas results compared to onshore gas measuring
systems. Water detection performance & calibration A water calibration methodology has been developed using MEG injection port and recording
meter measurements. The expected performance
is 5% on the gas accuracy and 0.10% absolute on the water (range 0-2%) with a detection limit of 0.02%.
Water injection tests
performed by injecting a few cubic meters of water in gas flows of 30 000 actual cubic meters per day have demonstrated that water detection capability is within the 0.01% range.
6. WET GAS METERING DEVELOPMENT PERSPECTIVES A few wet gas metering issues such as those below still need to be addressed:
- wet gas meter behaviour & modelling to improve accuracy - new technology development to increase performance & functionality TOTAL has launched some specific R&D work [9] to improve the accuracy of differential wet
gas meters using venturi and is supporting industrial JIPs to develop performance & functionality of wet gas meters.
Regarding the first
point, experimental and modelling work performed by TOTAL on two-phase flow varying from annular to dispersed flow regime has established the limitations of correlations and models used to correct venturi meter gas mass flow rates according to the liquid content.
-4
-2
0
2
4
6
8
10
0.00 0.05 0.10 0.15 0.20 0.25
Xlm
Err
or (
%)
Murdock De Leeuw Droplets Model
Consequently, the claimed accuracy of published correlations cannot be generalized or
extrapolated and will not strictly apply without specific meter calibration.
Verwijderd: ¶¶Hydrate ¶Allocation ¶Water ¶Lessons
Verwijderd: ¶¶Hydrate ¶Allocation ¶Water ¶LESSONS METER EXPERIENCE¶¶THE CRUCIAL CHOICE OF WHICH SUBSEA ALLOCATION METERING DEVICE TO USE WAS MADE AROUND THE TIME OF PROJECT SANCTION IN THE FALL OF 2000. AT THAT TIME THE PRIMARY METHOD FOR WET GAS MEASUREMENT WAS USE OF VARIOUS DIFFERENTIAL METERS IN THE MANNER FIRST SUGGESTED BY MURDOCK [1]. ¶¶HOWEVER SOLARTRON ISA WAS IN THE PROCESS OF INTRODUCING THEIR MODIFIED DUAL-DIFFERENTIAL METER, THE DUALSTREAM II. EVEN THOUGH PRODUCTION FROM ALL CANYON EXPRESS FIELDS WAS EXPECTED TO BE VERY DRY GAS - TYPICAL LIQUID PRODUCTION WAS PREDICTED TO BE LESS THAN 1 BBL/MMSCF AT STARTUP - EACH PARTNER WAS KEEN TO KNOW THE ONSET OF WATER FROM ANY WELL. COMBINED LIQUID (WATER, METHANOL, AND CONDENSATE) FROM ANY SINGLE WELL WAS NOT EXPECTED TO EXCEED 4 BBL/MMSFD AT STARTUP. SINCE THE DUAL STREAM II HAD SHOWN THE POTENTIAL TO PROVIDE SUCH AN ESTIMATE [2] , AND Verwijderd: 2.1
Verwijderd: METER CALIBRATION¶¶THE HIGH-PRESSURE MULTIPHASE FLOW LOOP AT THE SOUTHWEST RESEARCH INSTITUTE (SWRI) OPENED FOR BUSINESS IN THE SUMMER OF 2001. AS STATED EARLIER, THE CANYON EXPRESS WORKING PRESSURE OF APPROXIMATELY 250 BAR WAS FAR GREATER THAN Verwijderd: :
... [11]
... [12]
Physical models based on flow regime morphology are very accurate when applicable. This is
the case for droplets & film models applied to venturi meter corrections. Such an approach has allowed to develop new correction algorithms which have been applied to some higher pressure configurations with errors of about +/-2%.
Concerning the technical solutions on the market, a few industrial WGM solutions have been
developed by several manufacturers and it should be acknowledged that there are still some drawbacks and limitations associated to available systems such as:
- most of systems are limited to two phases measurements - limitations in pressure range - limitations in liquid measurement sensitivity and accuracy - flow morphology dependency - no differentiation between formation water & condensed water For this reason, there are new players in the game who are proposing innovative approaches
to three-phase wet gas metering systems based on multidimensional measurements with higher accuracy (+/-1.5 % on the mass) and added functionalities like water salinity estimations. Another direction is the use of other measuring principles such as ultrasonic.
7. THE WAY FORWARD & CONCLUSIONS Clearly, it is now recognized by the upstream gas community that wet gas metering
techniques has encouraged the development and production of new gas reserves, especially in subsea and difficult environments.
The first generation of wet gas meters is already used successfully to perform allocation, to
monitor wells & reservoirs & to help operators optimise their well & pipeline operations (hydrate mitigation, flow performance, slug management...) by using in-line systems requiring minimum intervention.
This situation is expected to grow with the increasing gas demand and the need for the
development of new reserves with similar constraints. Developments in artic regions are typical examples where conditions require the use of such technologies.
In parallel to these new, challenging projects where advanced technologies can be applied
there is also the need to improve the recovery of all existing gas wells which start to produce liquids & water. Often the pressure can be significantly lower, which is not always an advantage, and the CAPEX constraints are greater in such cases.
Environmental concern will also be the driving force to developing and using wet gas metering
testing solutions requiring no flaring. TOTAL, who has been involved in wet gas metering solutions improvement and development
in the past few years, has anticipated an extension of such a domain with a target accuracy in the upstream area close to that obtained in dry gas for fiscal allocation (1%) and of course with more systems offering three-phase flow measurements for production and reservoir purposes. Such trends are already confirmed by new manufacturers on the market, through the acceptance for fiscal purposes by regulatory bodies [10] and through the recent publication of new standards and practices in wet gas metering and in wet gas allocation, by ISO [1], NOFGM [2] & API [11].
Verwijderd: :
Verwijderd: 

8. REFERENCES 1. ISO TC193 Natural gas – Upstream area, “Allocation of gas and condensate”, Technical report, July 2005 2. NOFGM (Norwegian Society for Oil and Gas Measurement, “Handbook of Multiphase Flow Metering”, March 2005 3. Cooley, C., Couput J-P, Winsor Letton, Hall J. Wet Gas Allocation on the Canyon Express Project North Sea Flow Measurement Workshop, October 2003 4. Singh, A., Hall, J., Letton, W. , Hall J., “Three years of Wet Gas Allocation on Canyon Express”, North Sea Flow Measurement Workshop, October 2005 5. Murdock, J.W., “Two Phase Flow Measurement with Orifices”, Journal of Basic Engineering, December 1962. 6 . de Leeuw, H., “Wet Gas Flow Measurement by Means of a Venturi Meter and a Tracer Technique”, North Sea Flow Measurement Workshop, Peebles, Scotland, October 1994. 7. Boko, J., Couput, J.-P., Escande, J., Gajan, P., and A. Strzelecki, “Wet Gas Metering with Venturi Meters in the Upstream Area: Further Results for the Correction Factor”, North Sea Flow Measurement Workshop, October 2001 8. Bo, O.L., Nyfors, E., Loland, T., and J.-P. Couput, “New Compact Wet Gas Meter Based on a Microwave Water Detection Technique and Differential Pressure Flow Measurement”, North Sea Flow Measurement Workshop, October 2002. 9 . J. Cazin, J., Couput, J-P , C. Dudézert, C., Escande, J., P. Gajan P., Lupeau A., Strzelecki A., “Lessons from wet gas flow metering systems using differential measurements devices: Testing and flow modelling results “, North Sea Flow Measurement Workshop, October 2005 10. DTI “Measurement guidelines – Wet gas measurements”, Guidance notes for petroleum measurement under petroleum regulations, December 2003
Verwijderd: Table 1. Multi-level calibration readings for well 305-2.¶¶¶¶Although there is no reference meter in the 305-2 line, if there were it would read zero flow when the well is shut in. Given this fact, and realizing that the differences in Qref can only be attributed to the true flow rate changes in 305-2, one has the data necessary to create a typical calibration curve. Flow through 305-2 is zero during shut-in, is (199-164) = 35 at half flow, and finally is (239-164) = 75 at full flow. Using these data, a calibration curve for the allocation meter on well 305-2 can be plotted as shown in Figure 9. ¶¶Re-arranging the terms in Equation (1), ¶¶
k
bQ
kQ ref −⋅= 1
(2)¶¶Here the reference readings are the inferred measurements given in the third column of Table 1. Using these data, the quantities k and b can be found.¶¶
230522305
230522305
−−−
−−
−
−=
QQk ref
(3)
93.35783575 =
−−=k
b = Q305− 2ref 1 − k ⋅ Q305(4)
44.23593.35 =⋅−=b¶¶Thus the equation used to correct the readings of the allocation meter on Well 305-2 is¶¶
93. 12305 +⋅= −−QQcorr(5)
¶Figure 10 shows how it is recommended the procedure
... [13]

Pagina 4: [1] Verwijderd Unknown
TGas flow measurements in the upstream area is now more and more challenging du thigh constraints due to development in extreme conditions . To
Pagina 4: [1] Verwijderd Unknown
TOTAL
Pagina 4: [1] Verwijderd Unknown
like other gas producers started to
Pagina 4: [1] Verwijderd Unknown
Pagina 4: [1] Verwijderd Unknown
p
Pagina 4: [1] Verwijderd Unknown
new
Pagina 4: [1] Verwijderd Unknown
reserves
Pagina 4: [1] Verwijderd Unknown
where installations are unmanned
Pagina 4: [1] Verwijderd Unknown
gas
Pagina 4: [1] Verwijderd Unknown
new high water depths
Pagina 4: [1] Verwijderd Unknown
gas
Pagina 4: [1] Verwijderd Unknown
includinglike
Pagina 4: [2] Verwijderd Unknown
like Girassol
Pagina 4: [2] Verwijderd Unknown
Canyon Express with Aconcagua field in
Pagina 4: [3] Verwijderd Unknown
Gas
Pagina 4: [3] Verwijderd Unknown
are more and more
Pagina 4: [3] Verwijderd Unknown
Pagina 4: [3] Verwijderd Unknown
supply to buyers
Pagina 4: [3] Verwijderd Unknown
. In this challenging context , f
Pagina 4: [3] Verwijderd Unknown
and
Pagina 4: [3] Verwijderd Unknown
distant
Pagina 4: [3] Verwijderd Unknown
topside
Pagina 4: [3] Verwijderd Unknown
s
Pagina 4: [4] Verwijderd Unknown
is produced & transported in combination with

Pagina 4: [4] Verwijderd Unknown
liquids like
Pagina 4: [5] Verwijderd Unknown
Such a mixture , called wet gas has geneated
Pagina 4: [5] Verwijderd Unknown
,
Pagina 4: [5] Verwijderd Unknown
new
Pagina 4: [5] Verwijderd Unknown
able to be used multiphase gas streams which are now applied in upstream developments
Pagina 4: [5] Verwijderd Unknown
ing
Pagina 4: [6] Verwijderd Unknown
T
Pagina 4: [6] Verwijderd Unknown
cases
Pagina 4: [6] Verwijderd Unknown
can be
Pagina 4: [6] Verwijderd Unknown
last
Pagina 4: [6] Verwijderd Unknown
Pagina 4: [6] Verwijderd Unknown
Pagina 4: [7] Verwijderd fr12846 19-1-2006 12:23:00
IN SEPTEMBER 2002, PRODUCTION FROM THE THREE FIELDS THAT TOGETHER FORM THE CANYON EXPRESS PROJECT - KING'S P EAK, ACONCAGUA, AND CAMDEN HILLS - WAS BEGUN. DRILLED IN RECORD WATER DEPTHS OF 2000 TO 2200 METERS IN THE EASTERN GULF OF MEXICO, EACH OF THE NINE WELLS WAS CONNECTED TO ONE OF TWO 12-INCH PIPELINES CARRYING THE COMMINGLED WET GAS BACK TO THE CANYON STATION PLATFORM FOR PROCESSING, A DISTANCE OF 91 KILOMETERS AWAY IN MAIN PASS BLOCK 261.
Pagina 4: [8] Verwijderd fr12846 24-1-2006 9:37:00
networks
Pagina 4: [8] Verwijderd fr12846 24-1-2006 9:36:00
dramatically
Pagina 4: [8] Verwijderd fr12846 24-1-2006 9:35:00
simpler
Pagina 4: [8] Verwijderd fr12846 24-1-2006 9:38:00
installation
Pagina 4: [8] Verwijderd fr12846 24-1-2006 9:41:00
t
Pagina 4: [8] Verwijderd fr12846 24-1-2006 9:41:00
ah
Pagina 4: [8] Verwijderd fr12846 24-1-2006 9:41:00
new subsea projects but also by more
Pagina 4: [8] Verwijderd fr12846 24-1-2006 9:42:00

t
Pagina 4: [8] Verwijderd fr12846 24-1-2006 9:42:00
Pagina 4: [9] Verwijderd fr12846 24-1-2006 9:42:00
t
Pagina 4: [9] Verwijderd fr12846 24-1-2006 9:44:00
both
Pagina 4: [9] Verwijderd fr12846 24-1-2006 9:43:00
Pagina 4: [9] Verwijderd fr12846 24-1-2006 9:44:00
) and
Pagina 4: [10] Verwijderd gggg 23-1-2006 0:16:00
Architecture = long tie backs ,
Pagina 4: [10] Verwijderd gggg 23-1-2006 0:20:00
,
Pagina 11: [11] Verwijderd fr12846 23-1-2006 16:17:00
Hydrate Allocation Water
LESSONS METER EXPERIENCE
THE CRUCIAL CHOICE OF WHICH SUBSEA ALLOCATION METER ING DEVICE TO USE WAS MADE AROUND THE TIME OF PROJECT SANCTION IN THE FALL OF 2000. AT THAT TIME THE PRIMARY METHOD FOR WET GA S MEASUREMENT WAS USE OF VARIOUS DIFFERENTIAL METERS IN THE MANNER FIRST SUGGESTED BY MURDOCK [1].
HOWEVER SOLARTRON ISA WAS IN THE PROCESS OF INTRODU CING THEIR MODIFIED DUAL-DIFFERENTIAL METER, THE DUALSTREAM II . EVEN THOUGH PRODUCTION FROM ALL CANYON EXPRESS FIELDS WA S EXPECTED TO BE VERY DRY GAS - TYPICAL LIQUID PRODUC TION WAS PREDICTED TO BE LESS THAN 1 BBL/MMSCF AT STARTUP - EACH PARTNER WAS KEEN TO KNOW THE ONSET OF WATER FROM ANY WELL. COMBINED LIQUID (WATER, METHANOL, AND CONDENSATE) FROM ANY S INGLE WELL WAS NOT EXPECTED TO EXCEED 4 BBL/MMSFD AT STARTUP. SINCE THE DUAL STREAM II HAD SHOWN THE POTENTIAL TO PROVIDE S UCH AN ESTIMATE [2], AND APPEARED TO BE UNIQUE AT THAT TIM E, IT WAS CHOSEN FOR THIS JOB.
IT WAS RECOGNIZED THAT CANYON EXPRESS WOULD TAKE TH E METER'S TECHNOLOGY INTO MEASUREMENT TERRITORY IN WHICH IT HAD NOT

BEEN TESTED HERETOFORE. NOT ONLY WAS THE WATER DEPT H FAR GREATER THAN THE DUALSTREAM II - OR ANY OTHER METER - HAD EVER BEEN TESTED, BUT THE PRESSURES OF 250 BAR AT THE ME ASUREMENT POINTS WOULD BE MUCH HIGHER. SO CAREFUL AND THOROUG H MEASUREMENT TESTING AND CALIBRATION AT A REFERENCE FACILITY WAS REQUIRED.
IT IS DIFFICULT TO OVERSTATE THE IMPORTANCE OF THE SUBSEA ALLOCATION METERS IN THE OPERATION OF CANYON EXPRES S. RAW CASH FLOW THROUGH THE SYSTEM IS SEVERAL MILLION DOL LARS EACH DAY. SMALL ERRORS IN MEASUREMENT CAN THUS BE FINANC IALLY DEVASTATING TO THE AFFECTED PARTNER, AND LARGE ERRO RS CATASTROPHIC.
Pagina 11: [12] Verwijderd fr12846 23-1-2006 16:25:00
METER CALIBRATION
THE HIGH-PRESSURE MULTIPHASE FLOW LOOP AT THE SOUTH WEST RESEARCH INSTITUTE (SWRI) OPENED FOR BUSINESS IN THE SUMMER OF 2001. AS STATED EARLIER, THE CANYON EXPRESS WORKING PRESSURE OF APPROXIMATELY 250 BAR WAS FAR GREATER THAN ANY A PPLICATION EXPERIENCED BY THE METER UP TO THAT POINT IN TIME. NOT ONLY ONLY WAS SWRI WAS ABLE TO ACHIEVE THIS PRESSURE, ; NO OT HER WET GAS CALIBRATION FACILITY OPERATED AT EVEN 50% OF THIS F IGURE. FINALLY, THE FACT THAT SWRI WAS CAPABLE OF CIRCULATING NATUR AL GAS, DECANE, METHANOL, AND WATER THROUGH THE METER AT VA RYING LIQUID LOADS, WAS ALSO UNIQUE. FOR THESE REASONS, I T WAS THE CLEAR CHOICE FOR CALIBRATION OF THE DUAL STREAM II METER AS PLANNED FOR CANYON EXPRESS.
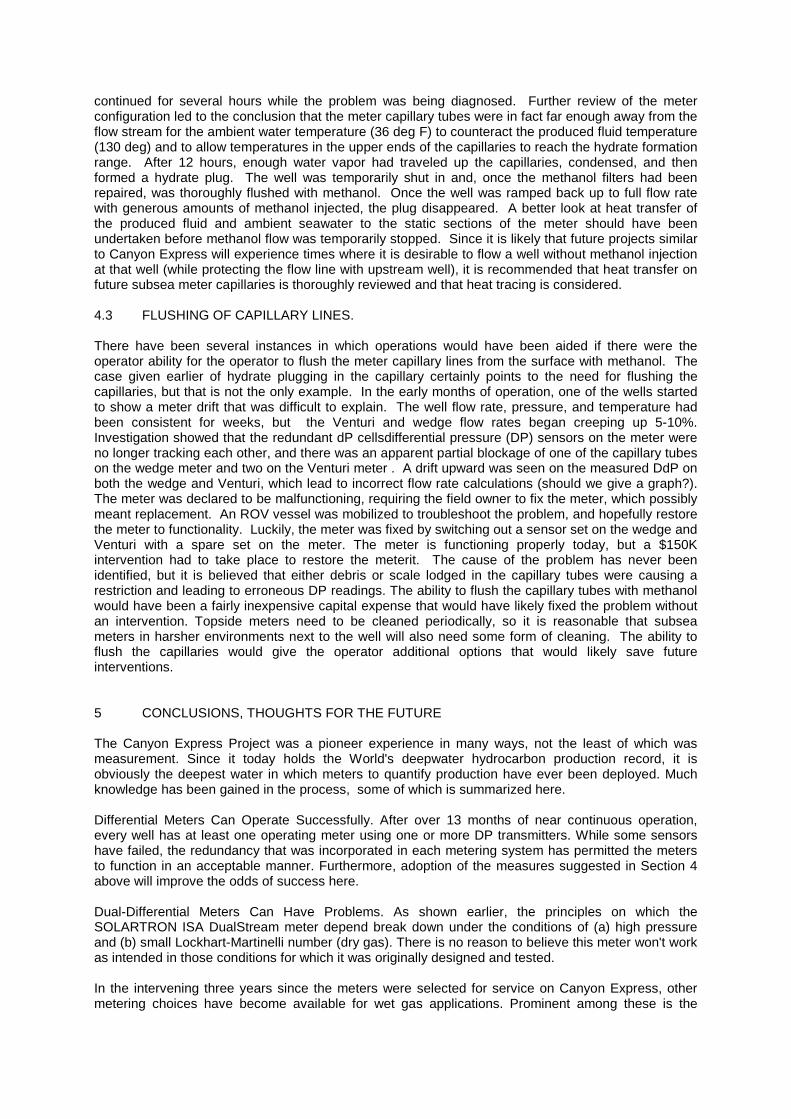
THE TEST PROGRAM FOR THE METER WAS QUITE EXHAUSTIVE , AND COVERED NOT ONLY VARIATIONS IN PRESSURE BUT ALSO LI QUID LOADING AND, TO SOME DEGREE, LIQUID COMPOSITION. TH E COMPOSITE RESULTS FOR THE TEST PROGRAM ARE SHOWN IN FIGURES 1 AND 2. PLOTTED AGAINST GAS VOLUME FRACTION, THE RELATIVE UNCERTAINTIES FOR GAS FLOW MEASUREMENT ARE GENERALL Y LESS THAN 3% FOR ALL GVF, AND FOR LIQUID FLOW MEASUREMEN T ARE LESS THAN 20% UP TO 99% GVF. ABOVE 99% GVF, WHERE THE CA NYON EXPRESS METERS WOULD OPERATE, THE LIQUID UNCERTAINT IES BLOOMED OUT TO AS MUCH AS 80%. THE METER’S PERFORMA NCE IN THIS REGION IS NOT ESPECIALLY SURPRISING. IT HAS OFTEN B EEN POINTED
OUT [5] THAT THE SIMPLE MURDOCK CORRECTION IS NOT S UFFICIENT TO PROPERLY MODEL THE FLOW MEASUREMENT PROCESS FOR VER Y LOW LOCKHART-MARTINELLI VALUES. IMPROVEMENT OF THE MODE LS USED FOR THE LOW-LIQUID RANGE WOULD CERTAINLY IMPROVE ME TER ACCURACY.
WHILE THIS THE CALIBRATION RESULTS THUS OBTAINED MI GHT BE CONSIDERED ALARMING, WHEN VIEWED IN THE CONTEXT OF DETECTION OF THE ONSET OF WATER PRODUCTION, IT WAS NOT CONSIDERED A CATASTROPHE.
2.2 METER PERFORMANCE
THE FIRST METERS WERE INSTALLED IN A JUMPER CONFIGU RATION ON THREE OF THE CANYON EXPRESS WELLS DURING THE BEGINN ING OF SEPTEMBER OF 2002. FIRST PRODUCTION OCCURRED IN MID-SEPTEMBER 2002, WITH ALL METERS INSTALLED AND ALL WELLS HAVIN G BEEN INITIALLY TESTED BY THE END OF OCTOBER 2002. SHAKEO UT OF EARLY PRODUCTION ISSUES CONTINUED THROUGH THE END OF 2002.
DURING THIS STARTUP PERIOD A GREAT DEAL OF ATTENTIO N WAS PAID TO FLOW RATES FROM THE WET GAS METERS, BOTH FOR LIQ UID AND GAS. ALTHOUGH FOR CANYON EXPRESS THE GAS IS BY FAR THE M ORE IMPORTANT COMPONENT, IN THIS EARLY TESTING, THE MET ER'S ESTIMATES OF LIQUID DREW MOST ATTENTION. WHEREAS AN ABSOLUTE MAXIMUM OF 100 - 200 BBL/D OF LIQUIDS (PRODUCTION P LUS INJECTED METHANOL) WAS EXPECTED THROUGH EACH METER, THE INIT IAL ESTIMATES BEING RETURNED BY THE METERS WERE FAR GRE ATER, IN SOME CASES AS MUCH AS 2000 BBL/D. SINCE EACH SEPARA TOR ON CANYON STATION IS CAPABLE OF HANDLING 1750 BBL/D AN D WAS SEEING NOWHERE NEAR THIS AMOUNT OF LIQUID, IT SEEMED CLEAR THAT SOMETHING WAS WRONG IN THE SUBSEA MEASUREMENT PROCE SS.
INITIALLY SUSPICIONS WERE DIRECTED TOWARD THE SENSO RS, IN PARTICULAR THE DIFFERENTIAL PRESSURE (DP) TRANSMITT ERS. IN MANY CASES WHERE EVERYTHING LOOKED CLOSE TO NORMAL IN TE RMS OF GAS FLOW RATE AGREEMENT BETWEEN THE TWO DIFFERENTIA L METERS (WEDGE AND VENTURI), ALL SIX DIFFERENTIAL PRESSURE SENSORS ON EACH METER (LOW & AND HIGH RANGE, TRIPLE REDUNDANCY ) APPEARED

TO BE FUNCTIONING CORRECTLY. THE AVERAGE DIFFERENT IAL PRESSURE OF EACH OF THE SIX SENSORS WAS WITHIN ABOU T 1% OF THEIR AVERAGE OF EACH OF THE SIX SENSORS.
THERE WERE, HOWEVER, INSTANCES WHERE THE REDUNDANCY WAS NOT SUFFICIENT TO PREVENT QUESTIONABLE MEASUREMENT. TH E MAJOR REDUNDANCY PROBLEM WAS THE FACT THAT THE LOW RANGE SENSORS WERE OFTEN SATURATED MUCH OF THE TIME. IT WAS NOT POSSIBLE TO RE-SCALE THEM REMOTELY. TWO OF THE THREE FIELDS UT ILIZED ONLY DUAL REDUNDANT SENSORS, THUS MAKING IT IMPORTANT TO SET STRICT LIMITS ON THE REQUIRED AGREEMENT BETWEEN A METER’S SENSORS BEFORE QUESTIONING THE DATA.
THERE WERE CASES WHERE THE CALCULATED FLOWRATES FRO M THE TWO DIFFERENTIAL DEVICES SHOWED SIGNIFICANT DIFFERE NCES ASND THE LINE PRESSURE WAS CHANGING. BECAUSE OF THE WEL L-KNOWN EFFECT OF LINE PRESSURE ON DIFFERENTIAL PRESSURE SE NSORS, THIS WAS INVESTIGATED AS A POSSIBLE CAUSE OF THE OBSERVE D PROBLEMS. A REVIEW OF THE CALIBRATION PROCEDURE AN D TEST REPORTS FOR THE INSTALLED DIFFERENTIAL PRESSURE SEN SORS FAILED TO UNCOVER ANY OBVIOUS ERRORS. SINCE THE ORIGINAL SENSOR CALIBRATION PROCEDURE CALLED FOR TESTING ONLY AT AT MOSPHERIC AND MAXIMUM PRESSURES, SIMILAR SENSORS WERE THEN TE STED AT INTERMEDIATE PRESSURES BY ADVANTICA TECHNOLOGY. TH ESE TESTS REVEALED ONLY A VERY SMALL LINE PRESSURE EFFECT FOR THESE “SMART” SENSORS.
THEREFORE IT WAS CONCLUDED THAT THESE POTENTIAL SOU RCES OF MEASUREMENT ERROR IN DP WERE UNLIKELY TO CAUSE PROB LEMS OF THE MAGNITUDE BEING OBSERVED IN THE CANYON EXPRESS METERS. HAVING RULED OUT SENSORS AS THE PROBLEM SOURCE, ONL Y THE APPLICATION OF THE METHODOLOGY REMAINED TO BE CONSI DERED.
2.3 RESOLUTION OF METER ISSUES
ANOTHER OF THE PRINCIPAL REASONS THE DUAL STREAM WA S SELECTED FOR CANYON EXPRESS WAS THE FALLBACK POSITI ON ITS COMPONENT METERS OFFERED IN CASE ITS PRIMARY OUTPUTS WERE SOMEHOW NOT USEABLE. INDEED, OF THE ALTERNATIVE DEV ICES

AVAILABLE AT THE TIME OF SELECTION, WET-GAS DIFFERE NTIAL METERS (VENTURI, ORIFICE, ETC.) WERE THE LEADING CANDIDATE S.
IT IS USEFUL TO LOOK AT THE PRINCIPLES USED BY THES E METERS AND TO RECOGNIZE HOW THE CANYON EXPRESS APPLICATION FIT S. IT IS WELL KNOWN THAT DIFFERENTIAL METERS OVER-READ THE TRUE G AS FLOW RATE WHEN LIQUIDS ARE PRESENT. A TYPICAL DIFFERENT IAL OVER-READ CURVE IS SHOWN IN FIGURE 3, WITH THE DEVICE OVER-READING PLOTTED AGAINST THE WELL-KNOWN LOCKHART-MARTINELLI PARAMETE R. THE EXACT SHAPE OF THE CURVE DEPENDS ON THE GEOMETRY OF THE METER, THE PROPERTIES OF THE FLUIDS PASSING THROUGH IT, AND THE PRESSURE IN THE PIPE, BUT IT IS LINEAR WITH RESPECT TO L-M, A MEASURE OF “WETNESS”.
THE SOLARTRON ISA DUAL STREAM II INCORPORATES TWO D IFFERENTIAL DEVICES IN A SINGLE METER, EACH WITH A DIFFERENT CH ARACTERISTIC OF THE TYPE SHOWN IN FIGURE 3. SOLARTRON ISA HAVE O BSERVED THAT THAT ONLY THE DIFFERENCE IN THE TWO CHARACTERISTIC OVER-READ CURVES IS REQUIRED IN THEIR ANALYSIS. IF THE SLOPE OF THE TYPICAL CHARACTERISTIC IN FIGURE 3 IS M, THEN THE SLOPE OF THE DIFFERENCE CHARACTERISTIC IS ∆∆∆∆M. AN EXAMPLE OF THIS DIFFERENCE CHARACTERISTIC IS SHOWN IN FIGURE 4, WHICH IS THAT RECORDED AT SWRI DURING THE CALIBRATION TESTS DISCUSSED EARLIER . AS DE LEEUW [3] SHOWED WITH RESPECT TO INDIVIDUAL DIFFERE NTIAL METERS, THE SLOPE OF THE DIFFERENCE CURVE DECREASES WITH PRESSURE. THIS WILL BE DISCUSSED IN MORE DETAIL LATER.
NOMINAL CANYON EXPRESS OPERATING PARAMETERS ARE:
MMSCFDQvg 50=
DAYBBLQvl /100= (INCLUDING METHANOL)
3/160 mkgg =ρ

3/800 mkgl =ρ
THESE PROPERTIES RESULT IN A NOMINAL RANGE OF LOCKH ART-MARTINELLI PARAMETERS OF .006 - .007.
THE FUNDAMENTAL TENET OF THE DUAL STREAM II METER I S THAT THE DIFFERENCE IN THE AMOUNT OF OVER-READING BETWEEN TH E TWO DEVICES IT INCORPORATES IS INDICATIVE OF THE WETNESS OF THE GAS, I.E. THE LOCKHART-MARTINELLI (L-M) PARAMETER. FOR G AS AS DRY AS THAT AT CANYON EXPRESS, THE OVER-READING OF THE IND IVIDUAL METERS AS WELL AS THE OVER-READING DIFFERENCE SHOUL D BE QUITE SMALL. FROM FIGURE 4 ONE OBSERVES THAT THE RELATIVE DIFFERENCE IN OVER-READING OF THE TWO METERS MUST BE LESS THAN .005 (0.5%) FOR THE L-M OF .007 CALCULATED ABOVE.
BUT THIS IS THE CRUX OF THE PROBLEM. ASKING THAT TW O DIFFERENTIAL METERS EACH ARE EACH ACCURATE TO WITHI N 0.2 - 0.3% IS DEMANDING FAR TOO MUCH. IT IS PROBABLY NOT REASONAB LE TO EXPECT THAT THE TWO DEVICES EXPOSED TO PRODUCTION CONDITIONS OVER LONG PERIODS OF TIME WILL BE ACCURATE TO ANY B ETTER THAN A FEW PERCENT, EITHER INDIVIDUALLY OR AS A DIFFERENCE .
CONSIDER THE CASE SHOWN IN FIGURE 5. THE DATA SHOWN ARE FROM ONE OF THE CANYON EXPRESS WELLS DURING THREE DAYS I N NOVEMBER 2002. SHOWN ARE THE GAS FLOWRATES CALCULATED FROM T HE WEDGE AND VENTURI METERS, THE DIFFERENCE BETWEEN THE WEDGE AND VENTURI FLOWRATES, AND THE ESTIMATED GAS AND LIQUID FLOWRATES FROM THE METER’S ALGORITHM.
FOR THIS FAIRLY PROLIFIC WELL WHICH PRODUCES JUST U NDER 50 MMSCFD, THE TWO METERS READ WITHIN 1 – 1.5% OF ONE ANOTHER. FOR TWO METERS WHICH HAVE BEEN UNATTENDED ON THE SEA FL OOR FOR SIX MONTHS, THIS DIFFERENCE ISN’T UNREASONABLE. HOW EVER IT IS SUFFICIENT TO CREATE AN ESTIMATED LIQUID RATE OF AB OUT 1 KG/SEC, OR 680 BBLD, ABOUT TEN TIMES THE TRUE RATE. ADDITIO NALLY, IT IS CLEAR THAT THIS ESTIMATE OF LIQUID RATE FROM THE ME TER ALGORITHM IS CORRELATED DIRECTLY TO THE DIFFERENCE BETWEEN THE VENTURI AND WEDGE READINGS. FURTHERMORE, BECAUS E THE ESTIMATE OF LIQUID PRODUCTION IS TOO HIGH, THE GAS RATE MUST BE

LOWER TO COMPENSATE, SO THE ESTIMATED GAS FLOW FROM THE ALGORITHM IS ALWAYS 4-6 MMSCFD TOO LOW.
IT SHOULD BE POINTED OUT THAT THE HIGH PRESSURE ENV IRONMENT EXACERBATES THE SITUATION BY FLATTENING OUT THE OVE R-READ CURVE. SHOWN IN FIGURE 6 IS A LOWER PRESSURE VERSION OF THE CHARACTERISTIC CURVE SHOWN IN FIGURE 4. THESE DATA TAKEN AT ABOUT 80 BAR SHOW A �M MORE THAN TWICE THAT OF THE 250-BAR DATA, A FACT THAT AMPLIFIES THE EFFECT OF ERRORS IN INDIVIDUAL METERS.
BASED ON THIS AND OTHER SIMILAR EXAMPLES, IT WAS CO NCLUDED THAT USING THE DUAL STREAM II WET GAS ALGORITHM WOU LD NOT BE APPROPRIATE FOR ALLOCATION OF GAS PRODUCTION FOR CA NYON EXPRESS, BUT THAT USING EITHER WEDGE OR VENTURI METERS FOR THIS PURPOSE SHOULD BE POSSIBLE.
3 CANYON EXPRESS ALLOCATION
[WE'LL HAVE TO ADDRESS THE INITIAL SIDE-STEPPING OF UNCERTAINTY-BASED ALLOCATION. DISCUSS HOW IT CAN CERTAINLY BE D ONE IN THE FUTURE ONCE WE HAVE THE PROPORTIONAL ALLOCATION ON FIRM FOOTING.]
ONCE THE DECISION WAS TAKEN TO DISCARD READINGS FRO M THE DUALSTREAM II ALGORITHM, AND INSTEAD TO USE EITHER THE DUAL STREAM'S WEDGE OR VENTURI METERS AS THE ALLOCATION DEVICE FOR GAS (AND USING GOR FOR CONDENSATE), THE PERFORMANCE OF THESE TWO METERS IN THE INDIVIDUAL WELLS CAME UNDER MUCH CLOSER SCRUTINY. GIVEN THE EXCEPTIONAL DRYNESS OF THE GAS, WITH LOCKHART-MARTINELLI PARAMETER LESS THAN .01, THE OV ER-READING OF THE VENTURI AND WEDGE METERS SHOULD BE QUITE LOW . INDEED, THE RESULTS FROM SWRI SUGGEST THAT NO MORE THAN 1-2 % SHOULD BE OBSERVED, AND EVEN THEN ALL METERS SHOULD OBSERV E SUCH A BIAS IN THE SAME DIRECTION, IF NOT BY THE SAME PREC ISE AMOUNT.

WHILE THE ISSUES OF THE SOLARTRON ISA DUAL STREAM I I METER WERE BEING WRESTLED, A MORE SINISTER PROBLEM WAS BEGINNI NG TO MANIFEST ITSELF. AS OF THE END OF 2002 THE OFFICIAL START-UP PERIOD WAS AT A CLOSE, AND ‘NORMAL’ OPERATIONS WERE TO BEGIN. UNFORTUNATELY, THE DIFFERENCE BETWEEN WHAT WAS BEIN G MEASURED ON THE SEA FLOOR AND WHAT WAS SEEN TOPSIDE WAS LARGE, AND AT TIMES CHANGING IN UNKNOWN WAYS.
3.1 TOPSIDE VERSUS SUBSEA COMPARISONS
FIGURE 7 ILLUSTRATES THE MAJOR ISSUE FACING CANYON EXPRESS AS THE SYSTEM CAME ON LINE EARLY IN 2003. THE WEDGE ME TERS FROM EACH OF THE SOLARTRON ISA DUAL STREAM METERS WERE C HOSEN OVER THE VENTURI METERS FOR THE GAS ALLOCATION, PRI MARILY BECAUSE DIFFERENTIAL PRESSURE SENSOR SATURATION ON THE VENTURIS OCCURRED AT A LOWER FLOW RATE. FURTHERMORE , IN ALL CASES WHERE THERE WAS NO SENSOR SATURATION IT WAS N OTED THAT THE WEDGE AND VENTURI TOTALS WERE OVER-READING THE TOPSIDES METER TOTALS BY VIRTUALLY THE SAME AMOUNT, MAKING T HE CE PARTNERS EVEN MORE COMFORTABLE WITH CHOICE OFCHOOSI NG THE WEDGE. USING THE WEDGE METERS, THE BALANCE ON BOTH FLOW LINES STAYED CONSISTENTLY BETWEEN 5-8% UNTIL MID-JANUARY OF 2003. NO ONE WAS PARTICULARLY PLEASED WITH THIS SITUATION, B UT SINCE IT SEEMED CONSISTENT, AND SINCE THERE WAS NO EVIDENCE THAT THE OVER-READING IN ANY ONE METER WAS MORE THAN ANY OTH ER, THE PARTNERS WERE WILLING TO ACCEPT THE ALLOCATIONS. H OWEVER, IN MID-JANUARY, THE IMBALANCE ON BOTH FLOW LINES BEGAN TO DRIFT TO THE 15-20% RANGE, INDICATING INCONSISTENCY AND RAIS ING EXPECTATIONSFUELING THE BELIEF THAT THERE THE OVER- READING WAS NOT AND EQUAL BIAS INAMONG THE METERS. CLEARLY SOMETHING NEEDED TO BE DONE TO UNDERSTAND HOW THE PROCESS WAS BEING CORRUPTED, AND TO IDENTIFY A WAY OUT OF THE PREDICA MENT.
AN EVENT THAT TOOK PLACE IN EARLY MARCH UNCOVERED A LIKELY SOURCE OF THE IMBALANCE PROBLEM CAUSING THE IMBALAN CE IN FLOW TOTALS. AN ROV RETRIEVED THE CHOKE FROM ONE OF THE WELLS, AND REVEALED WHAT MIGHT BE CALLED THE “SMOKING GUN”: TH E INSIDE OF THE CHOKE WAS COVERED WITH A THICK SCALE. A CAMERA LOOKING BACK INSIDE THE JUMPER TOWARD THE METER CONFIRMED T HE EXISTENCE OF SCALE ON THE WALLS OF THE JUMPER AND M ETER. SAMPLES OF THE SCALE REMOVED ARE SHOWN IN FIGURE 8. ONCE IT WAS RECOGNIZED AS A PROBLEM ON THE ONE WELL, IT WAS STR ONGLY SUSPECTED THAT 3 OR 4 OF THE OTHER WELLS WERE ALSO PRODUCING SCALE. CLEARLY, THE SCALE WAS IMPAIRING NOT ONLY TH E CHOKE’S

PROPER OPERATION, BUT ALSO THAT OF THE METER LOCATE D ONLY A FEW FEET METERS UPSTREAM.
IF THE METER ON THIS STREAM HAD INDEED EXPERIENCED A REDUCTION IN DIAMETER DUE TO A BUILDUP OF SCALE, THIS CHANGE OF GEOMETRY WOULD HAVE REDUCED THE BETA RATIO OF THE METER AND CAUSED A CORRESPONDING OVER-READING IN ITS RESPONSE. THE LAR GE DIFFERENCES BETWEEN THE VENTURI AND WEDGE CITED WERE LIKELY AN EFFECT OF SCALE IN SOME OF THE METERS, CAUSING T HE LARGE ERRORS IN LIQUID ESTIMATES. THE WORST RESULT OF TH E SCALE, THOUGH, WAS THE INCREASED ERROR IN GAS MEASUREMENT ERROR.
SINCE THIS HAD HAPPENED ON A SINGLE METER, COULD ON E BE SURE THAT ALL THE OTHER METERS IN THE SYSTEM WERE NOT AF FECTED? THE SCALE PRODUCTION WAS QUICKLY STOPPED BY SCALE INHIB ITOR INJECTION, BUT THE SCALE THAT HAD ALREADY FORMED CO ULD NOT BE REMOVED UNLESS WITHOUT A MULTI-MILLION DOLLAR INTER VENTION TOOK PLACE, AND EVEN THEN THERE WERE NO GUARANTEES THAT THE METER’S ORIGINAL GEOMETRY COULD BE RESTORED. IT WAS OBVIOUS THAT THIS WAS AN EXTREMELY SERIOUS PROBLEM, AND SOM ETHING HAD TO BE DONE.
3.2 CALIBRATION STRATEGY
WITH NINE METERS ON THE SEA FLOOR AND THE POSSIBILI TY THAT ALL MIGHT BE GIVING WRONG READINGS, IT WAS OF PARAMOUNT IMPORTANCE TO FIND A WAY TO VERIFY THE PERFORMANCE OF EACH DEVICE. GIVEN THAT (1) INTERVENTION TO REPLACE A ME TER WOULD BE ENORMOUSLY EXPENSIVE, AND (2) GAS PRODUCTION WAS SO PROLIFIC THAT ANY PROLONGED REDUCTION IN RATES MUST BE CONSI DERED ONLY AS A LAST RESORT, A CREATIVE WAY TO VERIFY AND, IF POSSIBLE, TO CALIBRATE EACH METER WAS NEEDED.
IT WAS DECIDED THAT ONLINE CALIBRATION OF INDIVIDUA L SUBSEA ALLOCATION METERS USING THE METERS ON THE CANYON ST ATION PLATFORM AS REFERENCE WAS A VIABLE APPROACH. MAKING THIS WORK WOULD NOT BE STRAIGHTFORWARD, SINCE THERE WERE 890-100 KM OF PIPELINE BETWEEN REFERENCE METERS AND EACH ME TER UNDER TEST. FURTHERMORE, THE FLOW THROUGH THE METER UNDER TEST

MUST BE COMMINGLED WITH THAT FROM SEVERAL OTHER MET ERS, SO THE PROCEDURE USED WHICH WOULD BE EMPLOYED COULD NO T BE THAT OF A CLASSICAL FLOW CALIBRATION.
THE METHOD DEVELOPED HERE FOR CANYON EXPRESS INVOLV ED CAREFUL CALIBRATION OF INDIVIDUAL METERS USING DIFF ERENCE METHODS. THAT IS, WHILE FLOW THROUGH ALL OTHER METE RS ON AN INDIVIDUAL FLOW LINE ARE HELD CONSTANT (OR AS NEARL Y SO AS POSSIBLE), FLOW THROUGH THE METER UNDER TEST AND TH E REFERENCE METER ARE OBSERVED AT THREE OR MORE FLOW RATES RANGING FROM FULL FLOW DOWN TO SHUT-IN. CHANGES IN THE FLOW OF THE OTHER METERS ON THE LINE MUST BE MONITORED AS W ELL, AND THE (TYPICALLY SMALL) DIFFERENCES ACCOUNTED FOR IN THE CALCULATIONS. ANY PRESSURE VARIATION MUST HAVE SETT LED IN ORDER TO PREVENT LINE PACKING FROM CORRUPTING THE R ESULTS.
FOR THIS ANALYSIS IT IS ASSUMED THAT THE RELATIONSH IP BETWEEN FLOW MEASURED AT THE REFERENCE METER AND THAT OBSER VED AT THE METER UNDER TEST IS
bQkQ ref +⋅= (1)
THE THREE OR MORE MEASUREMENT POINTS MADE ARE USED TO DETERMINE K (METER FACTOR) AND B (METER BIAS) . THE MEASUREMENTS MADE WHILE THE WELL IS FLOWING (NOT SHUT IN) DEFINE K, I.E. THE AMOUNT OF CHANGE IN REFERENCE READING CAUSED BY A G IVEN CHANGE IN THE READING OF THE METER UNDER TEST. HOWEVER THE METER BIAS CAN ONLY BE DETERMINED BY TAKING THE WEL L TO A SHUT-IN STATE.
IN A NORMAL CALIBRATION, THE POINTS TAKEN AT FULL A ND REDUCED FLOW WOULD BE SUFFICIENT TO DEFINE NOT ONLY THE MET ER FACTOR, BUT THE METER BIAS AS WELL. HOWEVER, IN THE PRESENT CASE THE FACT THAT OTHER WELLS ARE FLOWING INTO THE SAME LIN E PREVENTS PRELUDES THIS FROM HAPPENINGAS A POSSIBILITY. WITHO UT SOME OTHER INFORMATION, NOTHING IS KNOWN ABOUT THE ABSOL UTE FLOW THROUGH THE METER UNDER TEST, ONLY ITS RELATIVE FLO W RATE AS ESTIMATED FROM THE DIFFERENCE IN REFERENCE READINGS.

THE ADDITIONAL INFORMATION REQUIRED COMES FROM REDU CING THE FLOW THROUGH THE METER UNDER TEST DOWN TO SHUT-IN, AS DEMONSTRATED IN THE FOLLOWING EXAMPLE. IN TABLE 1, THE REFERENCE READINGS AND THOSE MEASURED BY THE METER ON THE WELL 305-2 ARE SHOWN IN THE FIRST TWO COLUMNS. IN T HIS EXAMPLE THE FIRST ROW OF DATA REPRESENTS FULL FLOW FROM 305 -2, THE SECOND ROW APPROXIMATELY 50%, AND THE THIRD ROW SHO WS THE REFERENCE METER READING DURING SHUT-IN.
Pagina 13: [13] Verwijderd Unknown
Table 1. Multi-level calibration readings for well 305-2. Although there is no reference meter in the 305-2 line, if there were it would read zero flow when the well is shut in. Given this fact, and realizing that the differences in Qref can only be attributed to the true flow rate changes in 305-2, one has the data necessary to create a typical calibration curve. Flow through 305-2 is zero during shut-in, is (199-164) = 35 at half flow, and finally is (239-164) = 75 at full flow. Using these data, a calibration curve for the allocation meter on well 305-2 can be plotted as shown in Figure 9. Re-arranging the terms in Equation (1),
k
bQ
kQ ref −⋅= 1
(2) Here the reference readings are the inferred measurements given in the third column of Table 1. Using these data, the quantities k and b can be found.
1230522305
1230522305
−−−−
−−
−
−=
QQk refref
(3)
93.3578
3575 =−−=k
b = Q305− 2ref 1 − k ⋅ Q305− 2−1 (4)
44.23593.35 =⋅−=b Thus the equation used to correct the readings of the allocation meter on Well 305-2 is
44.293. 12305 +⋅= −−QQcorr (5)
Figure 10 shows how it is recommended the procedure be performed. Measurement begins with a quiescent period of at least four hours wherein flow rates and pressures are all nearly constant. During this period, highlighted on the curve labeled “Separator”, the readings from each meter are averaged (integrated) and recorded. Then the flow for the meter under test (348-1) is choked back to a rate which is about 75% of that recorded at full flow, from about 58 to 42 MMSCFD. Although the 348-1 meter reaches a stable value quickly, it is several more hours before the reference meter has achieved
stability. Once there, the readings from the four allocation meters and the reference meter are individually averaged for several hours. Then the flow from 348-1 is reduced again, this time to roughly 50% of full flow, and the procedure described above is repeated. Finally, in addition to these three points the necessary shut-in point is taken using the same procedure. As was pointed out earlier, during the calibration of a meter the changes in flow rates of the other meters on the line must be recorded as well, and the (typically small) differences accounted for in the calculations. Since this accounting assumes the correct application of meter factors and biases for these meters, the total process is iterative. Finally, any pressure variations must have settled in order to prevent line packing from corrupting the results. Using the data collected in the exercise of Figure 10 results in the calibration curve shown in Figure 11. One of the benefits of having three flowing test points and a shut-in point is that the parameter R2 canould be calculated, providing an indicator of the linearity of the curve, with a value of 1.0 being perfectly linear. Though the bias in the 348-1 calibration is small, the meter factor in this case is anything but. The fact that the meter consistently measured 15% high was bad enough, but subsequent calibrations of other meters showed them to be over-reading by as much as 20-30%, thus demonstrating why developing such a procedure for Canyon Express was crucial. 3.3 RESULTS OF CALIBRATION IMPLEMENTATION The Q1 balance results shown in Figure 7 were poor enough that it was decided to try to usehoped that the new methods could be used to fix them. Unfortunately, the new methodology was only developed and ready for use in April. But the desire to improve the balance results for the first quarter was so great that a search for alternative schemes was begun. What was ultimately employed for the three months in question was a less-than-optimal implementation of the full calibration procedure. For most of the Canyon Express meters there was at least one period during the four months when the meter was shut in for testing of the subsea safety valve. When this occurred, if the other meters on that line were reasonably stable, a two-point calibration was could be employed. For some of the meters there was no such data available, so other less direct methods were employedtried. In spite of these problemsis, some useful data was available for each meter, although having only two calibration points meant that only a meter factor (no bias) could be found. When the meter factors thus derived were applied to the production data for the first quarter, the results obtained were those shown in Figure 12. Although the daily balance fluctuated from –4% to +8%, the composite balance was --0.59% on the east line and -0.72% on the west line over the three month period. Large daily fluctuations of thise type shown are normal when flow rates through the meters are varying as much as occurred during this period. Having dealt with the first quarter when there was no organized program for online meter calibration, attention was then turned to deriving meter factors and biases for each of the meters. Sequentially over a period of three weeks during April and May each of eight meters currently operational on the two flow lines was tested using the four-point method described earlier. Using these meter factors and biases on production data from the months of April and May yielded the results shown in Figure 13. Although the daily balances ranged from –5% to +5%, the balance over the two-month period was better than 1% on each of the two flow lines. RESULTS SINCE MAY Once the methodology for calibrating the allocation meters had been proved, the Canyon Express partners put procedures into place to take action should balances begin to drift beyond specific thresholds for protracted periods. Sure enough, after this practice began in May, alarms were triggered in early July indicating that the balance had wandered beyond acceptable limits. During the first five months of 2003, when several of the subsea meters were creating the imbalance conditions described earlier, the meters were nearly always reading high. After completing June in a

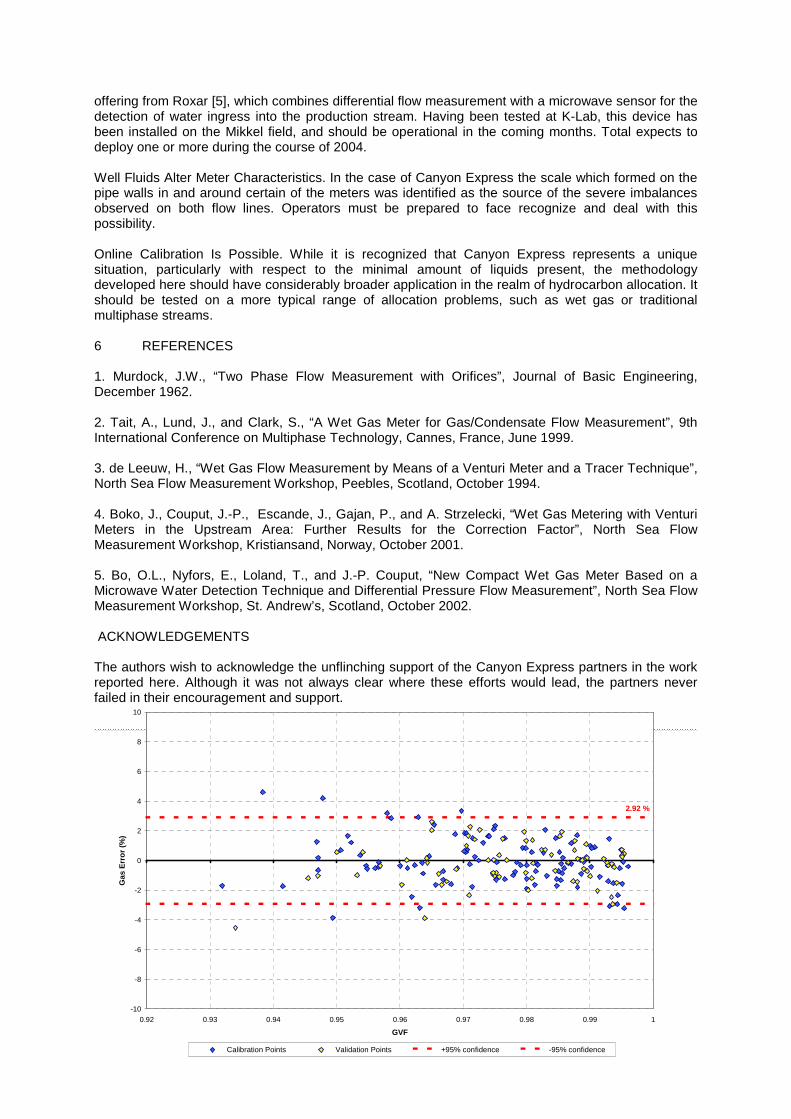
state of good balance, the July problem suggested one or more of the meters was moving in the other direction, i.e., it was under-reading flow based on the April-May calibrations. When the 7-day balance check exceeded -3 %, prescribed steps were undertaken to identify the well(s) and meter(s) responsible and perform the necessary actions. By the time the problem meter had been identified and re-calibration procedures initiated, the 7-day imbalance was almost -4%. A four-point calibration was performed on the errant meter, which showed its meter factor had changed from 0.74 to 0.89. The meter, which had been over-reading by more than 30%, was now only 12% high. Interestingly, this was the meter on Well 305-3, the one which had shown the large scale deposits when the intervention had been performed in March. What is believed happened is that, for whatever reason, some substantial part of the scale broke off the meter, thus increasing its effective diameter and beta ratio and reducing its differential pressure drop. Once the new meter factor and bias had been applied, the 7-day balance returned to 0.5% and has remained in the range of +/-1% ever since. INSTALLATION AND OPERATIONAL CONSIDERATIONS In addition to what was learned from a measurement perspective, the Canyon Express project was an excellent teacher in the design, installation, and operation of wet gas meters in extremely deep water. Listed below are several of the Lessons Learned from this demanding exercise. 4.1 Meter should be SsEPARATE METER FROM JUMPER. One of the biggest problems that occurred with the meter involved the installation of the meter and jumper. By incorporating the meter into the jumper from the tree to the flow line, it became necessary to remove the jumper if a meter malfunctioned. In the project phase it was reasoned that, although a jumper recovery is a difficult operation, it could be done if necessary. It was believed that the addition of connectors necessary to make the meter itself removable was a greater risk in the long term, since extra leak paths would be introduced. In actuality, the jumper installation proved much more difficult than expected because of the additional weight from the meter and its associated panels and devices. Of the nine jumpers installed, two were bent, one of which so badly that the meter had to be replaced. Because of the difficulty in installation, all field owners became reluctant to even to consider a jumper removal for fear of not being able to re-attach the jumperit. Because of this it is recommended that in future subsea wet gas flow meter (WGFM) installations, the design should allow for the meter to be removed without disconnecting the jumper. Though this definitely has its own risks and requires further study, it is believed that for a meter installed subsea, directly in front of a producing well, with no protection from scale, debris, etc., it will eventually be necessary to remove the meter, and thisit will be easier to do this if the meter is not integral to the jumper. 4.2 BETTER HEAT TRANSFER IN METER CAPILLARIES. All WGFM’s will have some sort of static sensing line tapped into the flow stream that will be used to sense temperature, static pressure, differential pressure, etc. It is essential to insure that these lines are protected from hydrate plugging. On Canyon Express, methanol was continuously injected so hydrate plugging was not a concern. Even without methanol injection at a well during steady state flow, it was felt that jumper and meter did not need methanol flow because the heat from the produced fluid was sufficient. While this is clearly true for the jumper, Canyon Express demonstrated that this was not necessarily true for the meter. In the early months of operation, Canyon Express experienced plugging in some of its subsea methanol filters, restricting the methanol injection at certain wells. As a boat was being mobilized to replace the filters, some wells continued to flow with barely enough methanol flow. Because it was best to flow the bulk of the methanol in each flowline at the farthest well, the decision was made to shut-in methanol flow at a well closer to the platform, thus diverting methanol to the well farthest from the platform well. When this was done, no effect was seen at the chosen well for 12 hours and the meter and jumper both appeared unaffected. However, aAfter 12 hours the Venturi flow rate at the well began drifting wildly from peak flow to low flow and back again, as shown in Figure 14. This
continued for several hours while the problem was being diagnosed. Further review of the meter configuration led to the conclusion that the meter capillary tubes were in fact far enough away from the flow stream for the ambient water temperature (36 deg F) to counteract the produced fluid temperature (130 deg) and to allow temperatures in the upper ends of the capillaries to reach the hydrate formation range. After 12 hours, enough water vapor had traveled up the capillaries, condensed, and then formed a hydrate plug. The well was temporarily shut in and, once the methanol filters had been repaired, was thoroughly flushed with methanol. Once the well was ramped back up to full flow rate with generous amounts of methanol injected, the plug disappeared. A better look at heat transfer of the produced fluid and ambient seawater to the static sections of the meter should have been undertaken before methanol flow was temporarily stopped. Since it is likely that future projects similar to Canyon Express will experience times where it is desirable to flow a well without methanol injection at that well (while protecting the flow line with upstream well), it is recommended that heat transfer on future subsea meter capillaries is thoroughly reviewed and that heat tracing is considered. 4.3 FLUSHING OF CAPILLARY LINES. There have been several instances in which operations would have been aided if there were the operator ability for the operator to flush the meter capillary lines from the surface with methanol. The case given earlier of hydrate plugging in the capillary certainly points to the need for flushing the capillaries, but that is not the only example. In the early months of operation, one of the wells started to show a meter drift that was difficult to explain. The well flow rate, pressure, and temperature had been consistent for weeks, but the Venturi and wedge flow rates began creeping up 5-10%. Investigation showed that the redundant dP cellsdifferential pressure (DP) sensors on the meter were no longer tracking each other, and there was an apparent partial blockage of one of the capillary tubes on the wedge meter and two on the Venturi meter . A drift upward was seen on the measured DdP on both the wedge and Venturi, which lead to incorrect flow rate calculations (should we give a graph?). The meter was declared to be malfunctioning, requiring the field owner to fix the meter, which possibly meant replacement. An ROV vessel was mobilized to troubleshoot the problem, and hopefully restore the meter to functionality. Luckily, the meter was fixed by switching out a sensor set on the wedge and Venturi with a spare set on the meter. The meter is functioning properly today, but a $150K intervention had to take place to restore the meterit. The cause of the problem has never been identified, but it is believed that either debris or scale lodged in the capillary tubes were causing a restriction and leading to erroneous DP readings. The ability to flush the capillary tubes with methanol would have been a fairly inexpensive capital expense that would have likely fixed the problem without an intervention. Topside meters need to be cleaned periodically, so it is reasonable that subsea meters in harsher environments next to the well will also need some form of cleaning. The ability to flush the capillaries would give the operator additional options that would likely save future interventions. 5 CONCLUSIONS, THOUGHTS FOR THE FUTURE The Canyon Express Project was a pioneer experience in many ways, not the least of which was measurement. Since it today holds the World's deepwater hydrocarbon production record, it is obviously the deepest water in which meters to quantify production have ever been deployed. Much knowledge has been gained in the process, some of which is summarized here. Differential Meters Can Operate Successfully. After over 13 months of near continuous operation, every well has at least one operating meter using one or more DP transmitters. While some sensors have failed, the redundancy that was incorporated in each metering system has permitted the meters to function in an acceptable manner. Furthermore, adoption of the measures suggested in Section 4 above will improve the odds of success here. Dual-Differential Meters Can Have Problems. As shown earlier, the principles on which the SOLARTRON ISA DualStream meter depend break down under the conditions of (a) high pressure and (b) small Lockhart-Martinelli number (dry gas). There is no reason to believe this meter won't work as intended in those conditions for which it was originally designed and tested. In the intervening three years since the meters were selected for service on Canyon Express, other metering choices have become available for wet gas applications. Prominent among these is the
offering from Roxar [5], which combines differential flow measurement with a microwave sensor for the detection of water ingress into the production stream. Having been tested at K-Lab, this device has been installed on the Mikkel field, and should be operational in the coming months. Total expects to deploy one or more during the course of 2004. Well Fluids Alter Meter Characteristics. In the case of Canyon Express the scale which formed on the pipe walls in and around certain of the meters was identified as the source of the severe imbalances observed on both flow lines. Operators must be prepared to face recognize and deal with this possibility. Online Calibration Is Possible. While it is recognized that Canyon Express represents a unique situation, particularly with respect to the minimal amount of liquids present, the methodology developed here should have considerably broader application in the realm of hydrocarbon allocation. It should be tested on a more typical range of allocation problems, such as wet gas or traditional multiphase streams. 6 REFERENCES 1. Murdock, J.W., “Two Phase Flow Measurement with Orifices”, Journal of Basic Engineering, December 1962. 2. Tait, A., Lund, J., and Clark, S., “A Wet Gas Meter for Gas/Condensate Flow Measurement”, 9th International Conference on Multiphase Technology, Cannes, France, June 1999. 3. de Leeuw, H., “Wet Gas Flow Measurement by Means of a Venturi Meter and a Tracer Technique”, North Sea Flow Measurement Workshop, Peebles, Scotland, October 1994. 4. Boko, J., Couput, J.-P., Escande, J., Gajan, P., and A. Strzelecki, “Wet Gas Metering with Venturi Meters in the Upstream Area: Further Results for the Correction Factor”, North Sea Flow Measurement Workshop, Kristiansand, Norway, October 2001. 5. Bo, O.L., Nyfors, E., Loland, T., and J.-P. Couput, “New Compact Wet Gas Meter Based on a Microwave Water Detection Technique and Differential Pressure Flow Measurement”, North Sea Flow Measurement Workshop, St. Andrew’s, Scotland, October 2002. ACKNOWLEDGEMENTS The authors wish to acknowledge the unflinching support of the Canyon Express partners in the work reported here. Although it was not always clear where these efforts would lead, the partners never failed in their encouragement and support.
Pagina-einde
2.92 %
-10
-8
-6
-4
-2
0
2
4
6
8
10
0.92 0.93 0.94 0.95 0.96 0.97 0.98 0.99 1
GVF
Gas
Err
or (
%)
Calibration Points Validation Points +95% confidence -95% confidence

Figure 1. Relative uncertainty in gas flow measurement over all tested pressures at SwRI Test Loop, July-August 2001.
Figure 2. Relative liquid measurement uncertainty over all tested pressures at SwRI Test Loop, July-
August 2001. Figure 3. Typical differential meter Over-Read Curve as a function of ‘wetness’.
-80
-60
-40
-20
0
20
40
60
80
100
0.92 0.93 0.94 0.95 0.96 0.97 0.98 0.99 1
GVF
Liqu
id E
rror
(%
)
Calibration Points Validation Points % Potential error on liq ref due to carryover that is undetectible by densitometer
0
0.1
0.2
0.3
0.4
0.5
0.6
0.7
0.8
0.9
1
0 0.05 0.1 0.15 0.2 0.25 0.3 0.35 0.4 0.45
LockHart-Martine lli
Fra
ctio
n O
ver-
read
Venturi Linear (Venturi)

Figure 4. Characteristic Difference in Over-Read Curve for ISA Dual Stream II meter recorded at 200-250 bar, SwRI,
Figure 5. Example of Dual Stream II operation on a Canyon Express well.
348-1 WGFM 11-17 thru 11-19
0
10
20
30
40
50
60
19-11-200223:57:32
19-11-200216:17:33
19-11-200208:17:32
19-11-200200:57:31
18-11-200217:07:32
18-11-200209:17:33
18-11-200201:37:32
17-11-200217:57:31
17-11-200209:57:31
Date
MM
scfd
0
0.5
1
1.5
2
2.5
3
LMF
(kg
/s),
Met
h ra
te (
gpm
)
Gas Flowrate Venturi - (W348_1) Gas Flowrate Wedge - (W348_1) Gas Flowrate WGFM - (W348_1)
Liquid Mass Flow - (W348_1) Meth Combined flowrates W348_1 venturi/wedge difference

Figure 6. Characteristic Difference in Over-Read Curve for ISA Dual Stream II meter recorded at 80 bar at SwRI.
Figure 7. Imbalance in daily totals for Canyon Express east and west flow lines during Q1 of 2003.
0.00%
5.00%
10.00%
15.00%
20.00%
25.00%
30.00%
1/1/
03
1/8/
03
1/15
/03
1/22
/03
1/29
/03
2/5/
03
2/12
/03
2/19
/03
2/26
/03
3/5/
03
3/12
/03
Date
Line
Imba
lanc
e
West Line Separator Error (Wedge) East Line Separator Error (Wedge)

Figure 8. Scale found inside flow line of Well 305-3 after intervention.
Figure 9. Calibration results obtained from data shown in Table 1.
Allocation Meter Calibration
-100
102030405060708090
-5 15 35 55 75 95
Flow Through Meter Under Test
Ref
eren
ce M
eter
Flo
w
Calibration Measurements Linear (Calibration Measurements)

Figure 10. Illustration of procedure used for online calibration of Canyon Express allocation flow meters.
Figure 11. Calibration curve for data shown in Figure 9.
y = 0.8657x - 1.8747
R2 = 0.9976
-10
0
10
20
30
40
50
60
-10 0 10 20 30 40 50 60 70
Measured Flow
Cor
rect
ed F
low
348-1 Calibration Data Least Squares Fit
0
10
20
30
40
50
60
70
80
90
100
13-0
5-20
0320
:43:
04
13-0
5-20
0318
:03:
03
13-0
5-20
0315
:13:
04
13-0
5-20
0312
:33:
03
13-0
5-20
0309
:43:
03
13-0
5-20
0306
:53:
04
13-0
5-20
0304
:13:
03
13-0
5-20
0301
:33:
03
12/5
/200
3 22
:53
12/5
/200
3 20
:13
12/5
/200
3 17
:33
12/5
/200
3 14
:53
12/5
/200
3 12
:03
12/5
/200
3 9:
23
12/5
/200
3 6:
43
12/5
/200
3 4:
03
12/5
/200
3 1:
13
11/5
/200
3 22
:23
Wed
ge F
low
rate
(M
MS
CF
/D)
0
50
100
150
200
250
Sep
arat
or F
low
rate
(M
MS
CF
/D)
305-3 348-2 348-1 305-4 Separator Averaging Period

Figure 12. Daily balance results for Canyon Express for the first quarter of 2003.
Figure 13. Daily imbalance in east and west flow lines during April-May 2003.
Q1 Imbalance for East and West Flowlines
-10.00
-5.00
0.00
5.00
10.001/
1/03
1/5/
03
1/9/
03
1/13
/03
1/17
/03
1/21
/03
1/25
/03
1/29
/03
2/2/
03
2/6/
03
2/10
/03
2/14
/03
2/18
/03
2/22
/03
2/26
/03
3/2/
03
3/6/
03
3/10
/03
3/14
/03
3/18
/03
3/22
/03
3/26
/03
3/30
/03
Date
Per
cent
Imba
lanc
e in
Flo
wlin
e
East Line Imbalance West Line Imbalance
April-May Imbalance for East and West Flowlines
-15.00
-10.00
-5.00
0.00
5.00
10.00
15.00
4/1/
03
4/5/
03
4/9/
03
4/13
/03
4/17
/03
4/21
/03
4/25
/03
4/29
/03
5/3/
03
5/7/
03
5/11
/03
5/15
/03
5/19
/03
5/23
/03
5/27
/03
5/31
/03
Date
Per
cent
Imba
lanc
e in
Flo
wlin
e
East Line Imbalance (%) West Line Imbalance (%)
Average East line Imbalance = 0.68%
Average West line Imbalance = -0.86%
Figure 14. Example of meter performance indicating hydrate plugging of sensor capillary tubes
0
100
200
300
400
500
600'2
002-
11-1
400
:04:
45.0
00'
'200
2-11
-14
16:4
4:46
.000
'
'200
2-11
-15
09:4
4:46
.000
'
'200
2-11
-16
03:1
7:31
.000
'
'200
2-11
-16
20:2
7:31
.000
'
'200
2-11
-17
13:3
7:32
.000
'
'200
2-11
-18
06:5
7:32
.000
'
'200
2-11
-19
00:4
7:32
.000
'
'200
2-11
-19
18:1
7:32
.000
'
'200
2-11
-20
11:1
7:33
.000
'
Mea
sure
d G
as F
low
rate
(M
Msc
fd)
305-3 Flowrate
Methanol flowrate stopped
Flowrate anomalies begin
Flowrate Drift
Well shut in to flush jumper and remove hydrate in WGFM
Well started back up with no meter problems