Embed Size (px)
Citation preview
Journal of Food Engineering 93 (2009) 127–133
Contents lists available at ScienceDirect
Journal of Food Engineering
journal homepage: www.elsevier .com/locate / j foodeng
Application of visible/near infrared spectroscopy and chemometric calibrationsfor variety discrimination of instant milk teas
Fei Liu, Xujun Ye *, Yong He *, Li WangCollege of Biosystems Engineering and Food Science, Zhejiang University, 268 Kaixuan Road, Hangzhou, Zhejiang 310029, China
a r t i c l e i n f o a b s t r a c t
Article history:Received 11 July 2008Received in revised form 15 December 2008Accepted 15 January 2009Available online 27 January 2009
Keywords:Visible and near infrared spectroscopyInstant milk teasVariety discriminationBack propagation neural networkLeast squares-support vector machine
0260-8774/$ - see front matter � 2009 Elsevier Ltd. Adoi:10.1016/j.jfoodeng.2009.01.004
* Corresponding authors. Tel./fax: +86 571 8697114E-mail address: [email protected] (Y. He).
Visible and near infrared (Vis/NIR) spectroscopy combined with back propagation neural network (BPNN)and least squares-support vector machine (LS-SVM) was investigated to implement the fast discrimina-tion of instant milk teas. Five brands of milk teas were obtained. The effective wavelengths (EWs) wereselected according to x-loading weights and regression coefficients by partial least squares (PLS) analysis.A total of 18 EWs were selected as the inputs of BPNN and LS-SVM models with a comparison of principalcomponents (PCs). The prediction precision and recognition ratio was 98.7% in validation set by both PCand EW models. The results indicated that the EWs reflected and represented the main characteristics ofmilk tea, and the variety discrimination was successfully implemented using Vis/NIR spectroscopy basedon BPNN and LS-SVM. The selected EWs would be helpful for the development of portable instrumentsfor commercial applications of variety and quality detection of milk teas.
� 2009 Elsevier Ltd. All rights reserved.
1. Introduction
The instant milk tea is a popular and nourishing solid beveragein the market. The constituents of instant milk tea powder are su-gar, instant tea powder, milk powder, non-dairy creamer and otheringredients such as flavouring and stabilizer. Some indirect reasonsindicated the popular of instant milk tea in China. Firstly, there aremany brands which are springing up in the market during severalyears in China. There are Chinese brands (Cici, Uloveit, Xiangpiaoo,Strong and so on) and foreign brands (Mocca, Nestlé, Lipton and soon). This indicated the large need of instant milk tea for people’sdaily life. Since Mocca, Nestlé and Lipton are world famous compa-nies and their products could be seen throughout the world, it indi-cated that instant milk tea might be also familiar with peoples inother countries. Secondly, there are many different tastes to meetdifferent people. These tastes of instant milk tea include originaltaste, lemon, mint, honey, vanilla, coffee, strawberry, chocolate,Taro, wheat, cataloup, adzuki been and so on. This indicated thatinstant milk tea satisfied people for their special taste requirement.Thirdly, there are different package ways such as instant milk teain bags, and milk tea in cups. The milk tea in cups supplies a lotof convenience for people. Nowadays, food safety and authenticityhave attracted considerable attention throughout the world. Thequality and prices of instant milk tea are different according to dif-ferent brands in the market. It is well known that the brand standfor the quality of the products. So adulteration and food authentic-
ll rights reserved.
3.
ity problems would arise from the competitive market for illegalcommercial benefits. Some adulteration in the products with goodquality might be sold in a lower price and cause unfair competi-tion. However, there is no simple and rapid method for the dis-crimination of different varieties of instant milk teas until now.The traditional method for the discrimination and adulterationdetection was to determine the quality and content of differentconstituents of milk tea, such as the determination of tea powder,milk quality, sugar content and other ingredients like catechin andiron. These detections are complex, time-consuming, laborious andnot convenient for fast discrimination. Hence, a fast discriminationand authenticity detection method was quite important for instantmilk tea. Nowadays, near infrared spectroscopy is widely appliedwith the characteristics of high speed, low cost and reliable detec-tion for quantitative and qualitative analysis in industries, such asagriculture, pharmaceuticals, food, textiles, cosmetics, and poly-mer production industry (Yan et al., 2005). The instant milk teais a complex food matrix, and the chemical constituents are quitecomplex. In the literature, some researchers had applied spectro-scopic techniques for the quality evaluation and discriminationof milk or tea separately. Borin et al. (2006) studied the commonadulterants in powdered milk by near infrared spectroscopy.Moros et al. (2007) evaluated the nutritional parameters in infantpowdered milk by Raman spectroscopy. Moros et al. (2005) studiedthe energetic values of fruit and milk-based beverages throughpartial least squares attenuated total reflectance Fourier transforminfrared spectrometry. Budínová et al. (1998) studied the authen-ticity of tea using infrared spectroscopy. Some other researches re-ported the qualitative identification of tea categories by near
128 F. Liu et al. / Journal of Food Engineering 93 (2009) 127–133
infrared spectroscopy (Zhao et al., 2006; Chen et al., 2006, 2007; Heet al., 2007). Li et al. (2007) studied the soluble solids content of teasoft drinks based on visible and near infrared (Vis/NIR) spectros-copy. Others reported the antioxidant capacity of green tea by nearinfrared spectroscopy (Zhang et al., 2004; Luypaert et al., 2003).But only a few literatures reported the quality evaluation of instantmilk tea. Ferruzzi and Green (2006) studied the catechins formmilk–tea by enzyme assisted extraction followed by high perfor-mance liquid chromatography (HPLC). Bai et al. (2004) used flameatomic absorption spectroscopy (FAAS) to determinate iron in milktea powder. However, there were few reports about fast varietydiscrimination of instant milk teas using visible and near infraredspectroscopy. The variety discrimination could be very helpful forthe food safety and adulteration detection.
The objective of this study is to investigate the feasibility ofusing Vis/NIR spectroscopy and chemometrics of back propagationneural network (BPNN) and least squares-support vector machine(LS-SVM) to discriminate different varieties of instant milk teas,and to validate the performance of selected effective wavelengths(EWs) of instant milk teas with comparison of principal compo-nents (PCs).
2. Materials and methods
2.1. Sample preparation
In this present, five brands of instant milk teas were purchasedin local market including Cici milk tea (Strong Group Co. Ltd.),Mocca royal milk tea (Mocca Food Co. Ltd.), Nestlé milk tea (Sociétédes Produits Nestlé SA), Xiangpiaoo milk tea (Xiangpiaopiao FoodCo. Ltd.), and Lipton milk tea (Unilever Foods Co. Ltd.). All fivebrands were original taste instant milk teas. In this experiment,Mocca, Nestlé and Lipton were milk tea in bags. Cici and Xiang-piaoo were milk tea in cups. For milk tea in bags (Mocca, Nestléand Lipton), a total of about 900 g (15 g for each bag) milk tea pow-ders were obtained for each brand, six containers (10 bags for eachcontainer) with three different lots were bought, and each lot orbatch was made in different producing times. For milk tea in cups(Cici and Xiangpiaoo), a total of about 960 g (32 g for each cup) forCici and 1500 g (50 g for each cup) for Xiangpiaoo were obtained,30 containers (1 cup for each container) with three different lotswere bought, and each lot or batch was made in different produc-ing times. There was no instruction in the bag or cup to indicate theportion of the raw materials. Complex procedure would be neededto determine the portion of raw materials, and it would be not dis-cussed in this paper. For study purpose, 10 w/v% of samples wereprepared in distilled water, which meant that 10 g milk tea powderwas dissolved by 100 ml distilled water. The milk tea samples werestirred till the powders were totally dissolved. The liquid milk teasamples were stored in the laboratory at a constant temperature of25 ± 1 �C to equalize the temperature. The sample number for eachvariety was 60, and a total of 300 liquid samples were prepared forfurther analysis. 225 instant milk tea samples (45 samples for eachvariety) were randomly selected for the calibration set, while theremaining 75 samples (15 for each variety) for the validation set.The ready-to-use liquid milk tea was churned up every 15 min toavoid any precipitation.
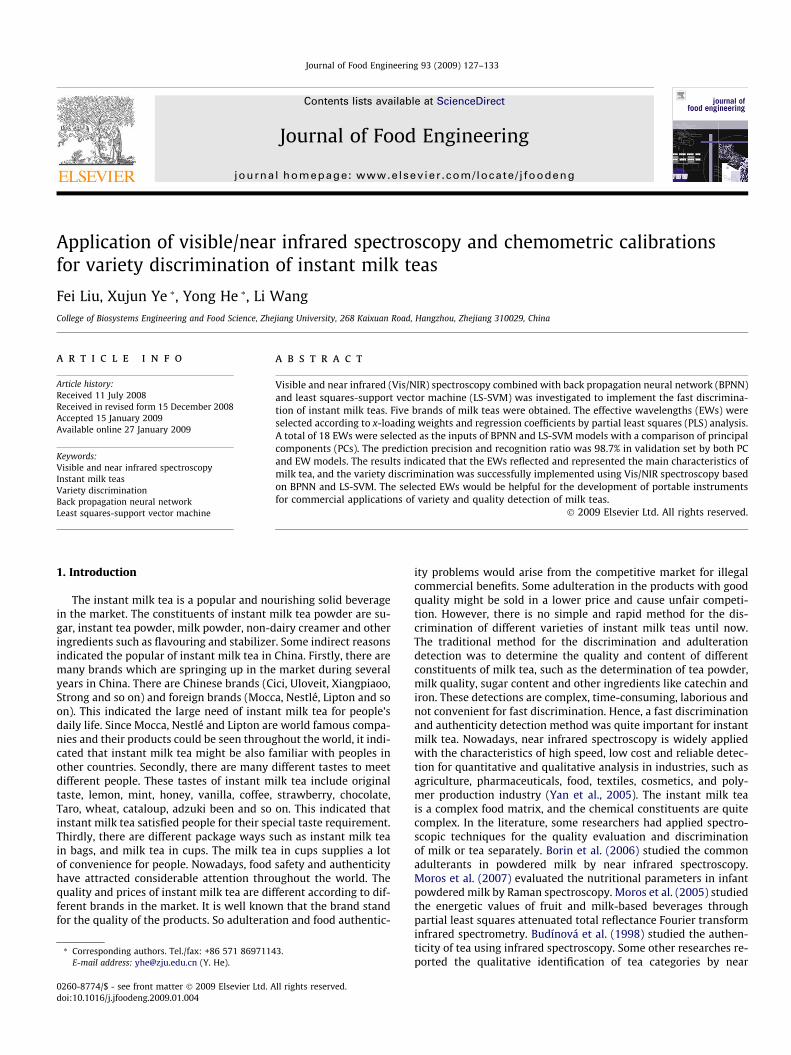
Fig. 1. The schematic diagram of instrument settlement.
2.2. Spectra acquisition and pretreatment
Before the spectra acquisition, the liquid milk tea was churnedup to prevent the sedimentation which might be existed at the bot-tom. The reflectance mode was applied in this study. For each sam-ple, two reflectance spectra were scanned by a handheld FieldSpecPro FR (325–1075 nm)/A110070, Trademarks of Analytical Spectral
Devices, Inc. (Analytical Spectral Devices, Boulder, USA). The lightsource consists of a Lowell pro-lam interior light source assem-ble/128,930 with Lowell pro-lam 14.5 V Bulb/128,690 tungstenhalogen bulb that could be used both in visible and near infraredregion. The field-of-view (FOV) of the spectroradiometer is 25�. Li-quid milk tea sample was placed in a cuvette. The spectroradiom-eter was placed at a height of approximately 100 mm and 45�angle away from the center of sample. The light source was placedat a height of approximately 250 mm 45� angle away from thesample. The schematic diagram of experimental settlement isshown in Fig. 1. The reflectance spectra from 325 to 1075 nm weremeasured at 1.5 nm intervals with an average reading of 30 scansfor each spectrum. Two spectra were collected for each sample andthe average spectrum of these two measurements was used in lateranalysis. All spectral data were stored in a computer and processedusing the RS3 software for Windows (Analytical Spectral Devices,Boulder, USA) designed with a Graphical User Interface. After thespectra acquisition, the sugar content was measured by an Abbe-benchtop refractometer (Model: WAY-2S, Shanghai Precision andScientific Instrument Co. Ltd., Shanghai, China). The refractive in-dex accuracy is ±0.0002 and the Brix (%) range is 0–95% with tem-perature correction.
The reflectance spectra were firstly transformed into ASCII for-mat by using the ASD ViewSpecPro software (Analytical SpectralDevices, Boulder, USA). Then two spectra for each sample wereaveraged into one spectrum and transformed by log (1/R) intoabsorbance spectrum. The pretreatments were implemented by‘‘The Unscrambler V 9.5” (CAMO As, Oslo, Norway). After some trialcomputations, the optimal smoothing way of moving average withthree segments was applied to decrease the noise. Standard normalvariate (SNV) was applied for light scatter correction and reducingthe changes of light path length (Barnes et al., 1989). To avoid lowsignal-to-noise ratio, only the region of wavelengths (400–1000 nm) were employed for the calculations.
2.3. Partial least squares analysis
Partial least squares (PLS) analysis is a commonly used chemo-metric method in the present NIR spectroscopy analysis. PLS anal-ysis can be performed to establish a regression model to relate thespectral data and variety characteristics of instant milk teas. That isbecause PLS considers simultaneously the variable matrix Y (vari-ety matrix) and the variable matrix X (spectral data) (Cen et al.,2006). PLS could be used as a way to extract the principal compo-nents as new eigenvectors of the original spectra in order to reducethe dimensionality and compress the original spectra data. The PCscould be used for scatter plots to observe the features of varietydistribution. From the scatter plots, the qualitative analysis of thevariety discrimination could be achieved. In the process of PLS cal-culation, full cross-validation was used to validate the quality and
F. Liu et al. / Journal of Food Engineering 93 (2009) 127–133 129
to prevent overfitting of calibration model. The effective wave-lengths describing the features of spectra for the identification ofvariety were proposed by x-loading weights and regression coeffi-cients. PLS loading weights were specific to PLS and expressed bythe information at each wavelength (X-variable) related to the var-iation in varieties (Y) summarized by the u-scores. U-scores sum-marize the variation in Y-space and part of the structure invariety (Y) which is explained by wavelength (X) along a givenPLS component. The loading weights were normalized, so that theirlengths could be interpreted as well as their directions. Wave-lengths (variables) with large loading weight values were impor-tant for the prediction of variety identification (Y). With similarfunction, regression coefficients were primarily used to check theeffects of different wavelengths (X-variables) in predicting the vari-ety (Y). Large absolute values indicate more influence and the sig-nificance for prediction of variety (Y). Both of these two factorshave a close relationship for the analysis of effective wavelengths(EWs). After the analysis of x-loading weights and regression coef-ficients, the selected EWs were used as the input eigenvectors ofBPNN and LS-SVM models.
2.4. Back propagation neural network
The basic error back propagation neural network (BPNN) is oneof the most popular neural network topologies. In this paper, theBPNN was employed as one of the calibration methods. The se-lected EWs as new eigenvectors obtained from x-loading weightsand regression coefficients were processed by the neural network.Simultaneously, the inputs with top three PCs were developed as acomparison model. The network output expresses the similaritythat an object corresponds with a training pattern, i.e., the dissim-ilarity between the desired (i.e. 0 or 1) and calculated network out-put is employed to adjust the weight factors between the neurons.Along with every process of a training pattern and adjustments ofthe weight factors, the difference between the desired and calcu-lated network output value, defined as the network output error,will gradually become less and less until it meets the desired value.One cycle through all the training patterns is defined as an epoch.Before the optimal accordance of the network output error isachieved for all training patterns, many epochs are required forthe back propagation. The transfer function of node takes the form:
f ðxÞ ¼ 11þ e�x=Q
: ð1Þ
In the function, Q is the parameter of function Sigmoid. BP neuralnetwork is a highly nonlinear mapping from input to output, i.e.Rn ? Rm, h(X) = Y. Taking a set for example, an input xi (xi2Rn) andthe output, there is a mapping g, where
gðxÞ ¼ yi with i ¼ 1;2; . . . ;n ð2Þ
Fig. 2. The sketch map of the structure of BP neural network.
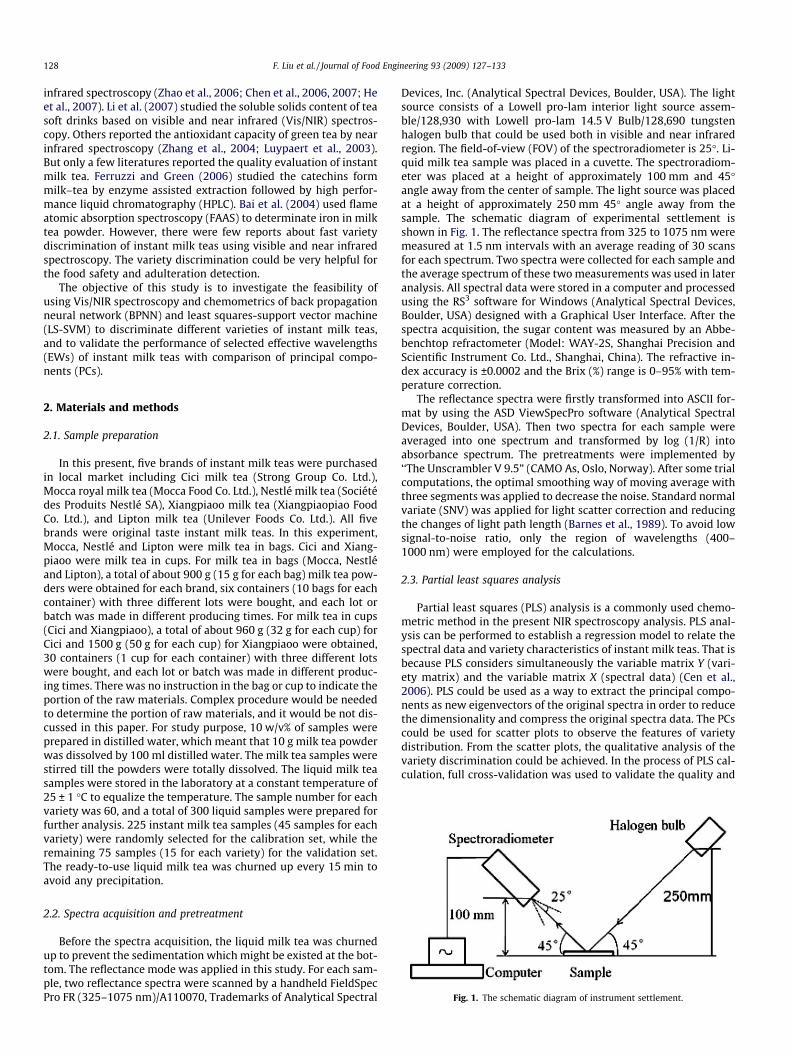
The aim is to find a mapping h that is the best approximation to g.The architecture of BP neural network with four layers is as fol-lowed in Fig. 2.
2.5. LS-SVM
Least squares-support vector machine (LS-SVM) is a new andattractive statistical learning method. LS-SVM has the capabilityof dealing with linear and nonlinear multivariate calibration andresolving these problems in a relatively fast way (Vapnik, 1995;Suykens and Vanderwalle, 1999). Moreover, SVM is capable oflearning in high-dimensional feature space with fewer trainingdata. It employs a set of linear equations instead of quadratic pro-gramming (QP) problems to obtain the support vectors (SVs). Thedetails of LS-SVM algorithm could be found in the literature (Chenet al., 2007; Guo et al., 2006). The LS-SVM regression model can beexpressed as:
yðxÞ ¼Xn
i¼1
aiKðx; xiÞ þ b ð3Þ
where K(x,xi) is the kernel function, ai is the Lagrange multiplierscalled support value, b is the bias term. Currently, there is no sys-tematic methodology for the selection of kernel function. However,compared with other feasible kernel functions, radial basis function(RBF) as a nonlinear function is a more compacted supported kerneland able to reduce the computational complexity of the trainingprocedure and give a good performance under general smoothnessassumptions (Wang et al., 2003). RBF function also can handle thenonlinear relationships between the spectra and target attributes.Thus, RBF kernel was recommended as the kernel function of LS-SVM in this paper. It can be expressed as follows:
Kðx; xiÞ ¼ expð�jjx� xijj2=ð2r2ÞÞ ð4Þ
where r is the kernel parameter. All the calculations were per-formed using MATLAB 7.0 (The Math Works, Natick, USA). The freeLS-SVM toolbox (LS-SVM v 1.5, Suykens, Leuven, Belgium) was ap-plied with MATLAB 7.0 to develop the calibration models.
3. Results and discussion
3.1. Spectral features and sugar content analysis
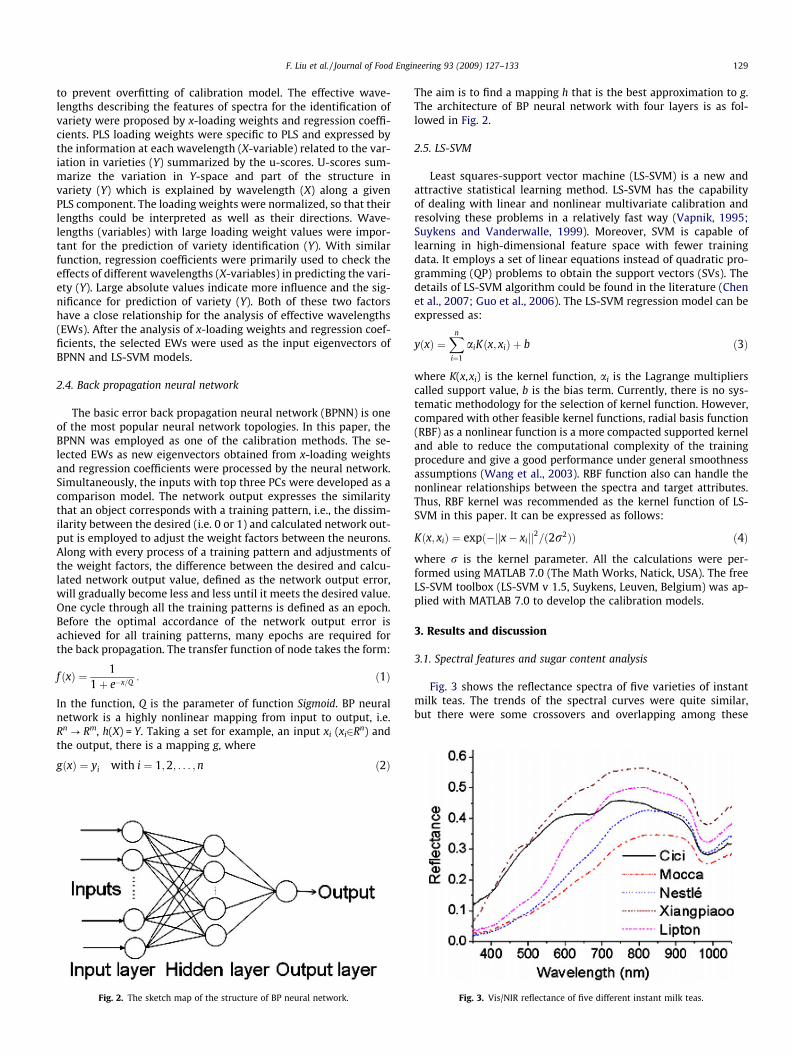
Fig. 3 shows the reflectance spectra of five varieties of instantmilk teas. The trends of the spectral curves were quite similar,but there were some crossovers and overlapping among these
Fig. 3. Vis/NIR reflectance of five different instant milk teas.
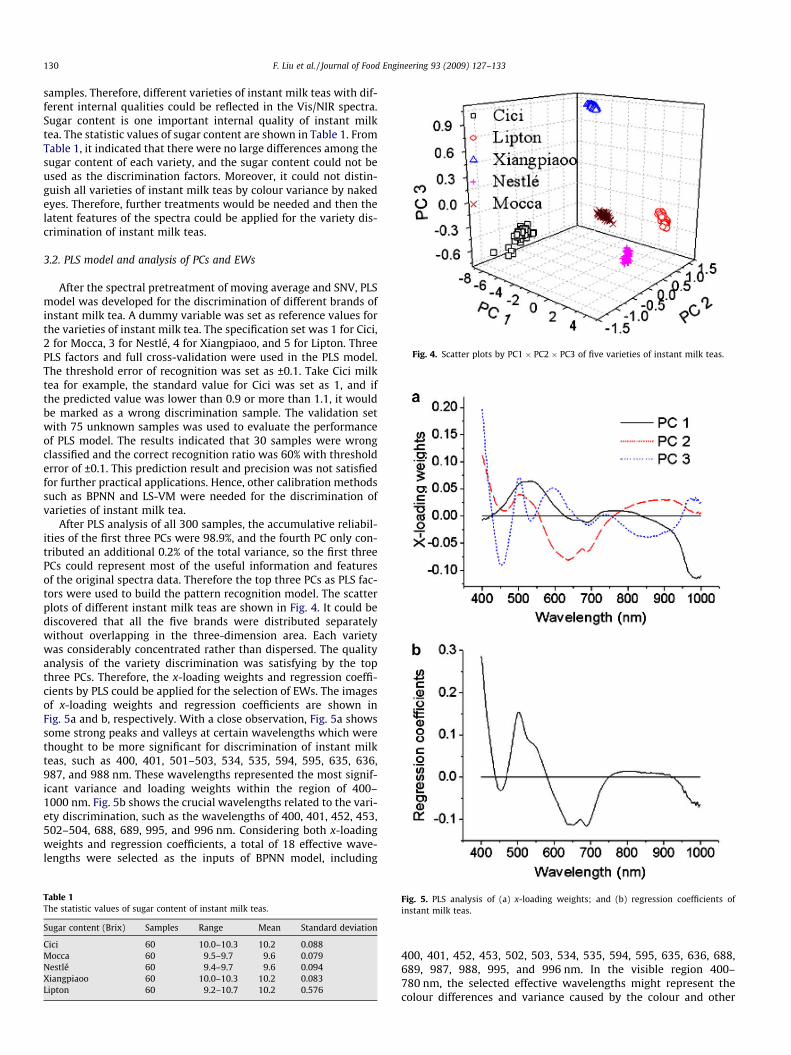
Fig. 4. Scatter plots by PC1 � PC2 � PC3 of five varieties of instant milk teas.
130 F. Liu et al. / Journal of Food Engineering 93 (2009) 127–133
samples. Therefore, different varieties of instant milk teas with dif-ferent internal qualities could be reflected in the Vis/NIR spectra.Sugar content is one important internal quality of instant milktea. The statistic values of sugar content are shown in Table 1. FromTable 1, it indicated that there were no large differences among thesugar content of each variety, and the sugar content could not beused as the discrimination factors. Moreover, it could not distin-guish all varieties of instant milk teas by colour variance by nakedeyes. Therefore, further treatments would be needed and then thelatent features of the spectra could be applied for the variety dis-crimination of instant milk teas.
3.2. PLS model and analysis of PCs and EWs
After the spectral pretreatment of moving average and SNV, PLSmodel was developed for the discrimination of different brands ofinstant milk tea. A dummy variable was set as reference values forthe varieties of instant milk tea. The specification set was 1 for Cici,2 for Mocca, 3 for Nestlé, 4 for Xiangpiaoo, and 5 for Lipton. ThreePLS factors and full cross-validation were used in the PLS model.The threshold error of recognition was set as ±0.1. Take Cici milktea for example, the standard value for Cici was set as 1, and ifthe predicted value was lower than 0.9 or more than 1.1, it wouldbe marked as a wrong discrimination sample. The validation setwith 75 unknown samples was used to evaluate the performanceof PLS model. The results indicated that 30 samples were wrongclassified and the correct recognition ratio was 60% with thresholderror of ±0.1. This prediction result and precision was not satisfiedfor further practical applications. Hence, other calibration methodssuch as BPNN and LS-VM were needed for the discrimination ofvarieties of instant milk tea.
After PLS analysis of all 300 samples, the accumulative reliabil-ities of the first three PCs were 98.9%, and the fourth PC only con-tributed an additional 0.2% of the total variance, so the first threePCs could represent most of the useful information and featuresof the original spectra data. Therefore the top three PCs as PLS fac-tors were used to build the pattern recognition model. The scatterplots of different instant milk teas are shown in Fig. 4. It could bediscovered that all the five brands were distributed separatelywithout overlapping in the three-dimension area. Each varietywas considerably concentrated rather than dispersed. The qualityanalysis of the variety discrimination was satisfying by the topthree PCs. Therefore, the x-loading weights and regression coeffi-cients by PLS could be applied for the selection of EWs. The imagesof x-loading weights and regression coefficients are shown inFig. 5a and b, respectively. With a close observation, Fig. 5a showssome strong peaks and valleys at certain wavelengths which werethought to be more significant for discrimination of instant milkteas, such as 400, 401, 501–503, 534, 535, 594, 595, 635, 636,987, and 988 nm. These wavelengths represented the most signif-icant variance and loading weights within the region of 400–1000 nm. Fig. 5b shows the crucial wavelengths related to the vari-ety discrimination, such as the wavelengths of 400, 401, 452, 453,502–504, 688, 689, 995, and 996 nm. Considering both x-loadingweights and regression coefficients, a total of 18 effective wave-lengths were selected as the inputs of BPNN model, including
Table 1The statistic values of sugar content of instant milk teas.
Sugar content (Brix) Samples Range Mean Standard deviation
Cici 60 10.0–10.3 10.2 0.088Mocca 60 9.5–9.7 9.6 0.079Nestlé 60 9.4–9.7 9.6 0.094Xiangpiaoo 60 10.0–10.3 10.2 0.083Lipton 60 9.2–10.7 10.2 0.576
Fig. 5. PLS analysis of (a) x-loading weights; and (b) regression coefficients ofinstant milk teas.
400, 401, 452, 453, 502, 503, 534, 535, 594, 595, 635, 636, 688,689, 987, 988, 995, and 996 nm. In the visible region 400–780 nm, the selected effective wavelengths might represent thecolour differences and variance caused by the colour and other
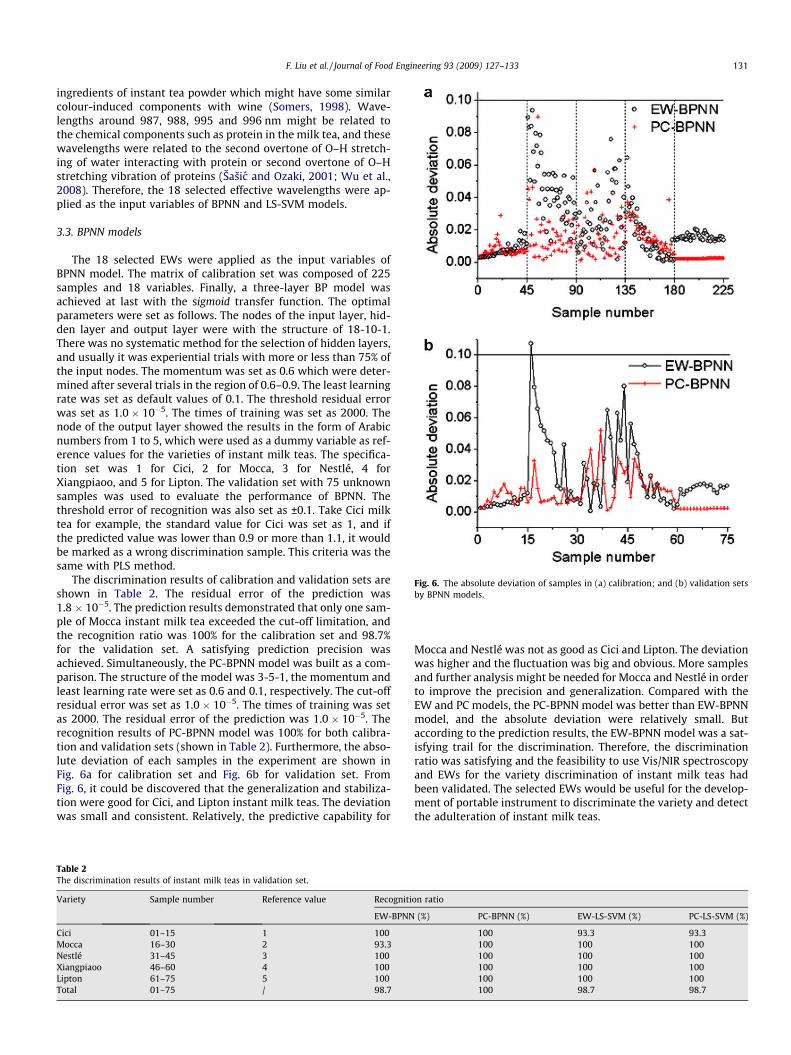
Fig. 6. The absolute deviation of samples in (a) calibration; and (b) validation setsby BPNN models.
F. Liu et al. / Journal of Food Engineering 93 (2009) 127–133 131
ingredients of instant tea powder which might have some similarcolour-induced components with wine (Somers, 1998). Wave-lengths around 987, 988, 995 and 996 nm might be related tothe chemical components such as protein in the milk tea, and thesewavelengths were related to the second overtone of O–H stretch-ing of water interacting with protein or second overtone of O–Hstretching vibration of proteins (Šašic and Ozaki, 2001; Wu et al.,2008). Therefore, the 18 selected effective wavelengths were ap-plied as the input variables of BPNN and LS-SVM models.
3.3. BPNN models
The 18 selected EWs were applied as the input variables ofBPNN model. The matrix of calibration set was composed of 225samples and 18 variables. Finally, a three-layer BP model wasachieved at last with the sigmoid transfer function. The optimalparameters were set as follows. The nodes of the input layer, hid-den layer and output layer were with the structure of 18-10-1.There was no systematic method for the selection of hidden layers,and usually it was experiential trials with more or less than 75% ofthe input nodes. The momentum was set as 0.6 which were deter-mined after several trials in the region of 0.6–0.9. The least learningrate was set as default values of 0.1. The threshold residual errorwas set as 1.0 � 10�5. The times of training was set as 2000. Thenode of the output layer showed the results in the form of Arabicnumbers from 1 to 5, which were used as a dummy variable as ref-erence values for the varieties of instant milk teas. The specifica-tion set was 1 for Cici, 2 for Mocca, 3 for Nestlé, 4 forXiangpiaoo, and 5 for Lipton. The validation set with 75 unknownsamples was used to evaluate the performance of BPNN. Thethreshold error of recognition was also set as ±0.1. Take Cici milktea for example, the standard value for Cici was set as 1, and ifthe predicted value was lower than 0.9 or more than 1.1, it wouldbe marked as a wrong discrimination sample. This criteria was thesame with PLS method.
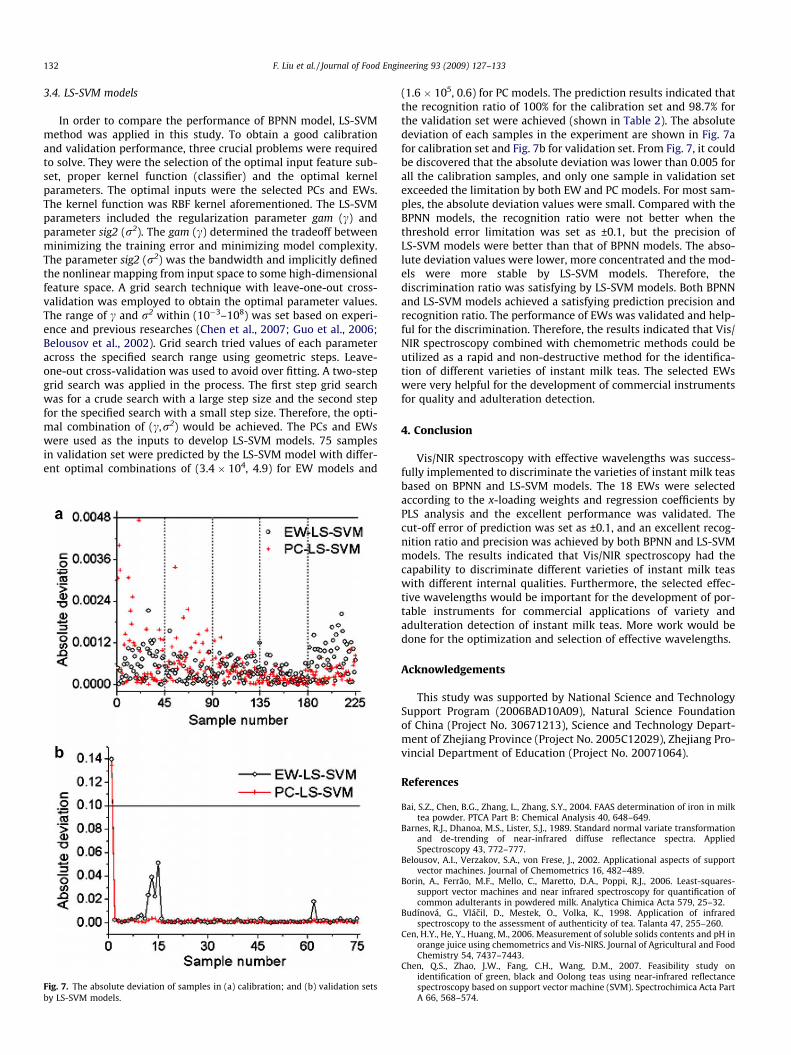
The discrimination results of calibration and validation sets areshown in Table 2. The residual error of the prediction was1.8 � 10�5. The prediction results demonstrated that only one sam-ple of Mocca instant milk tea exceeded the cut-off limitation, andthe recognition ratio was 100% for the calibration set and 98.7%for the validation set. A satisfying prediction precision wasachieved. Simultaneously, the PC-BPNN model was built as a com-parison. The structure of the model was 3-5-1, the momentum andleast learning rate were set as 0.6 and 0.1, respectively. The cut-offresidual error was set as 1.0 � 10�5. The times of training was setas 2000. The residual error of the prediction was 1.0 � 10�5. Therecognition results of PC-BPNN model was 100% for both calibra-tion and validation sets (shown in Table 2). Furthermore, the abso-lute deviation of each samples in the experiment are shown inFig. 6a for calibration set and Fig. 6b for validation set. FromFig. 6, it could be discovered that the generalization and stabiliza-tion were good for Cici, and Lipton instant milk teas. The deviationwas small and consistent. Relatively, the predictive capability for
Table 2The discrimination results of instant milk teas in validation set.
Variety Sample number Reference value Recogniti
EW-BPNN
Cici 01–15 1 100Mocca 16–30 2 93.3Nestlé 31–45 3 100Xiangpiaoo 46–60 4 100Lipton 61–75 5 100Total 01–75 / 98.7
Mocca and Nestlé was not as good as Cici and Lipton. The deviationwas higher and the fluctuation was big and obvious. More samplesand further analysis might be needed for Mocca and Nestlé in orderto improve the precision and generalization. Compared with theEW and PC models, the PC-BPNN model was better than EW-BPNNmodel, and the absolute deviation were relatively small. Butaccording to the prediction results, the EW-BPNN model was a sat-isfying trail for the discrimination. Therefore, the discriminationratio was satisfying and the feasibility to use Vis/NIR spectroscopyand EWs for the variety discrimination of instant milk teas hadbeen validated. The selected EWs would be useful for the develop-ment of portable instrument to discriminate the variety and detectthe adulteration of instant milk teas.
on ratio
(%) PC-BPNN (%) EW-LS-SVM (%) PC-LS-SVM (%)
100 93.3 93.3100 100 100100 100 100100 100 100100 100 100100 98.7 98.7
132 F. Liu et al. / Journal of Food Engineering 93 (2009) 127–133
3.4. LS-SVM models
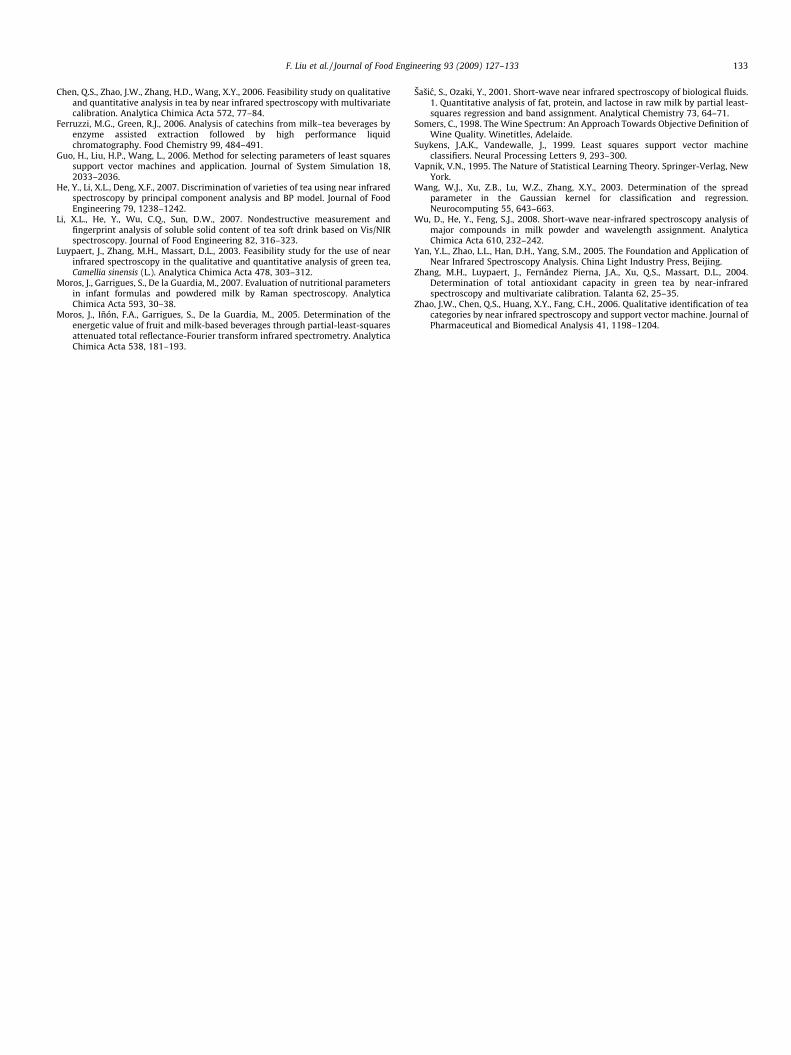
In order to compare the performance of BPNN model, LS-SVMmethod was applied in this study. To obtain a good calibrationand validation performance, three crucial problems were requiredto solve. They were the selection of the optimal input feature sub-set, proper kernel function (classifier) and the optimal kernelparameters. The optimal inputs were the selected PCs and EWs.The kernel function was RBF kernel aforementioned. The LS-SVMparameters included the regularization parameter gam (c) andparameter sig2 (r2). The gam (c) determined the tradeoff betweenminimizing the training error and minimizing model complexity.The parameter sig2 (r2) was the bandwidth and implicitly definedthe nonlinear mapping from input space to some high-dimensionalfeature space. A grid search technique with leave-one-out cross-validation was employed to obtain the optimal parameter values.The range of c and r2 within (10�3–108) was set based on experi-ence and previous researches (Chen et al., 2007; Guo et al., 2006;Belousov et al., 2002). Grid search tried values of each parameteracross the specified search range using geometric steps. Leave-one-out cross-validation was used to avoid over fitting. A two-stepgrid search was applied in the process. The first step grid searchwas for a crude search with a large step size and the second stepfor the specified search with a small step size. Therefore, the opti-mal combination of (c,r2) would be achieved. The PCs and EWswere used as the inputs to develop LS-SVM models. 75 samplesin validation set were predicted by the LS-SVM model with differ-ent optimal combinations of (3.4 � 104, 4.9) for EW models and
Fig. 7. The absolute deviation of samples in (a) calibration; and (b) validation setsby LS-SVM models.
(1.6 � 105, 0.6) for PC models. The prediction results indicated thatthe recognition ratio of 100% for the calibration set and 98.7% forthe validation set were achieved (shown in Table 2). The absolutedeviation of each samples in the experiment are shown in Fig. 7afor calibration set and Fig. 7b for validation set. From Fig. 7, it couldbe discovered that the absolute deviation was lower than 0.005 forall the calibration samples, and only one sample in validation setexceeded the limitation by both EW and PC models. For most sam-ples, the absolute deviation values were small. Compared with theBPNN models, the recognition ratio were not better when thethreshold error limitation was set as ±0.1, but the precision ofLS-SVM models were better than that of BPNN models. The abso-lute deviation values were lower, more concentrated and the mod-els were more stable by LS-SVM models. Therefore, thediscrimination ratio was satisfying by LS-SVM models. Both BPNNand LS-SVM models achieved a satisfying prediction precision andrecognition ratio. The performance of EWs was validated and help-ful for the discrimination. Therefore, the results indicated that Vis/NIR spectroscopy combined with chemometric methods could beutilized as a rapid and non-destructive method for the identifica-tion of different varieties of instant milk teas. The selected EWswere very helpful for the development of commercial instrumentsfor quality and adulteration detection.
4. Conclusion
Vis/NIR spectroscopy with effective wavelengths was success-fully implemented to discriminate the varieties of instant milk teasbased on BPNN and LS-SVM models. The 18 EWs were selectedaccording to the x-loading weights and regression coefficients byPLS analysis and the excellent performance was validated. Thecut-off error of prediction was set as ±0.1, and an excellent recog-nition ratio and precision was achieved by both BPNN and LS-SVMmodels. The results indicated that Vis/NIR spectroscopy had thecapability to discriminate different varieties of instant milk teaswith different internal qualities. Furthermore, the selected effec-tive wavelengths would be important for the development of por-table instruments for commercial applications of variety andadulteration detection of instant milk teas. More work would bedone for the optimization and selection of effective wavelengths.
Acknowledgements
This study was supported by National Science and TechnologySupport Program (2006BAD10A09), Natural Science Foundationof China (Project No. 30671213), Science and Technology Depart-ment of Zhejiang Province (Project No. 2005C12029), Zhejiang Pro-vincial Department of Education (Project No. 20071064).
References
Bai, S.Z., Chen, B.G., Zhang, L., Zhang, S.Y., 2004. FAAS determination of iron in milktea powder. PTCA Part B: Chemical Analysis 40, 648–649.
Barnes, R.J., Dhanoa, M.S., Lister, S.J., 1989. Standard normal variate transformationand de-trending of near-infrared diffuse reflectance spectra. AppliedSpectroscopy 43, 772–777.
Belousov, A.I., Verzakov, S.A., von Frese, J., 2002. Applicational aspects of supportvector machines. Journal of Chemometrics 16, 482–489.
Borin, A., Ferrão, M.F., Mello, C., Maretto, D.A., Poppi, R.J., 2006. Least-squares-support vector machines and near infrared spectroscopy for quantification ofcommon adulterants in powdered milk. Analytica Chimica Acta 579, 25–32.
Budínová, G., Vlácil, D., Mestek, O., Volka, K., 1998. Application of infraredspectroscopy to the assessment of authenticity of tea. Talanta 47, 255–260.
Cen, H.Y., He, Y., Huang, M., 2006. Measurement of soluble solids contents and pH inorange juice using chemometrics and Vis-NIRS. Journal of Agricultural and FoodChemistry 54, 7437–7443.
Chen, Q.S., Zhao, J.W., Fang, C.H., Wang, D.M., 2007. Feasibility study onidentification of green, black and Oolong teas using near-infrared reflectancespectroscopy based on support vector machine (SVM). Spectrochimica Acta PartA 66, 568–574.
F. Liu et al. / Journal of Food Engineering 93 (2009) 127–133 133
Chen, Q.S., Zhao, J.W., Zhang, H.D., Wang, X.Y., 2006. Feasibility study on qualitativeand quantitative analysis in tea by near infrared spectroscopy with multivariatecalibration. Analytica Chimica Acta 572, 77–84.
Ferruzzi, M.G., Green, R.J., 2006. Analysis of catechins from milk–tea beverages byenzyme assisted extraction followed by high performance liquidchromatography. Food Chemistry 99, 484–491.
Guo, H., Liu, H.P., Wang, L., 2006. Method for selecting parameters of least squaressupport vector machines and application. Journal of System Simulation 18,2033–2036.
He, Y., Li, X.L., Deng, X.F., 2007. Discrimination of varieties of tea using near infraredspectroscopy by principal component analysis and BP model. Journal of FoodEngineering 79, 1238–1242.
Li, X.L., He, Y., Wu, C.Q., Sun, D.W., 2007. Nondestructive measurement andfingerprint analysis of soluble solid content of tea soft drink based on Vis/NIRspectroscopy. Journal of Food Engineering 82, 316–323.
Luypaert, J., Zhang, M.H., Massart, D.L., 2003. Feasibility study for the use of nearinfrared spectroscopy in the qualitative and quantitative analysis of green tea,Camellia sinensis (L.). Analytica Chimica Acta 478, 303–312.
Moros, J., Garrigues, S., De la Guardia, M., 2007. Evaluation of nutritional parametersin infant formulas and powdered milk by Raman spectroscopy. AnalyticaChimica Acta 593, 30–38.
Moros, J., Iñón, F.A., Garrigues, S., De la Guardia, M., 2005. Determination of theenergetic value of fruit and milk-based beverages through partial-least-squaresattenuated total reflectance-Fourier transform infrared spectrometry. AnalyticaChimica Acta 538, 181–193.
Šašic, S., Ozaki, Y., 2001. Short-wave near infrared spectroscopy of biological fluids.1. Quantitative analysis of fat, protein, and lactose in raw milk by partial least-squares regression and band assignment. Analytical Chemistry 73, 64–71.
Somers, C., 1998. The Wine Spectrum: An Approach Towards Objective Definition ofWine Quality. Winetitles, Adelaide.
Suykens, J.A.K., Vandewalle, J., 1999. Least squares support vector machineclassifiers. Neural Processing Letters 9, 293–300.
Vapnik, V.N., 1995. The Nature of Statistical Learning Theory. Springer-Verlag, NewYork.
Wang, W.J., Xu, Z.B., Lu, W.Z., Zhang, X.Y., 2003. Determination of the spreadparameter in the Gaussian kernel for classification and regression.Neurocomputing 55, 643–663.
Wu, D., He, Y., Feng, S.J., 2008. Short-wave near-infrared spectroscopy analysis ofmajor compounds in milk powder and wavelength assignment. AnalyticaChimica Acta 610, 232–242.
Yan, Y.L., Zhao, L.L., Han, D.H., Yang, S.M., 2005. The Foundation and Application ofNear Infrared Spectroscopy Analysis. China Light Industry Press, Beijing.
Zhang, M.H., Luypaert, J., Fernández Pierna, J.A., Xu, Q.S., Massart, D.L., 2004.Determination of total antioxidant capacity in green tea by near-infraredspectroscopy and multivariate calibration. Talanta 62, 25–35.
Zhao, J.W., Chen, Q.S., Huang, X.Y., Fang, C.H., 2006. Qualitative identification of teacategories by near infrared spectroscopy and support vector machine. Journal ofPharmaceutical and Biomedical Analysis 41, 1198–1204.