Embed Size (px)
Citation preview
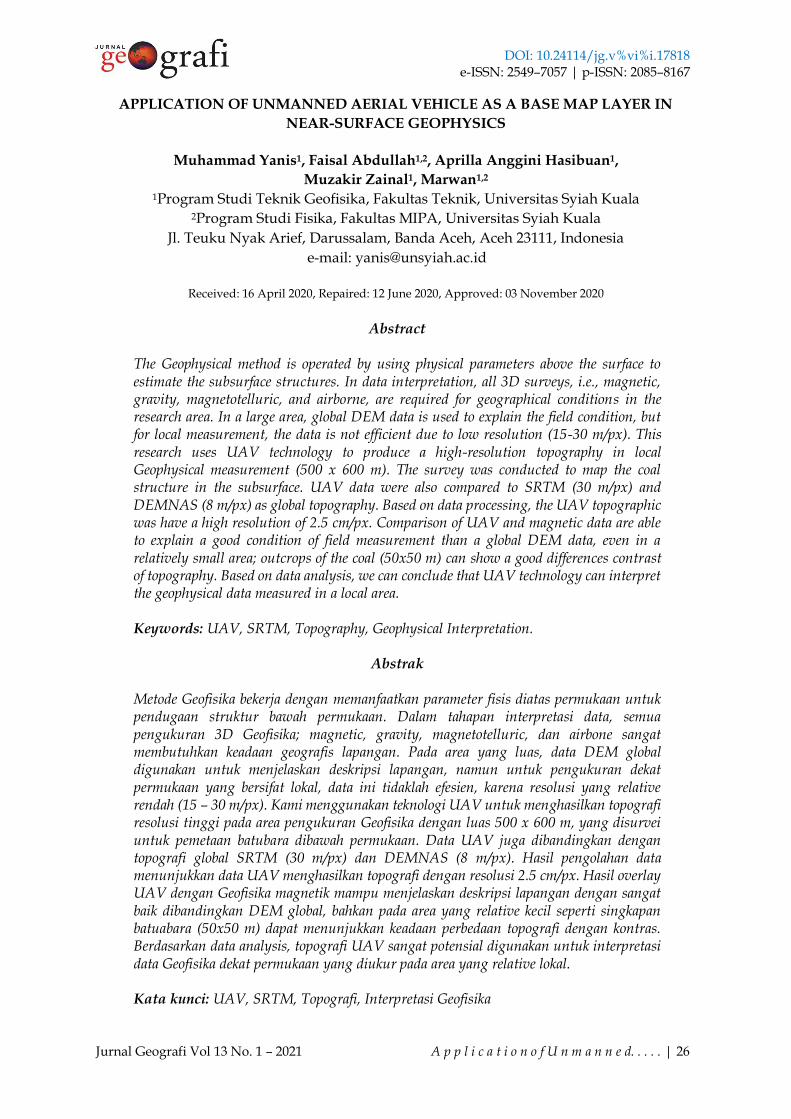
DOI: 10.24114/jg.v%vi%i.17818 e-ISSN: 2549–7057 | p-ISSN: 2085–8167
Jurnal Geografi Vol 13 No. 1 – 2021 A p p l i c a t i o n o f U n m a n n e d. . . . . | 26
APPLICATION OF UNMANNED AERIAL VEHICLE AS A BASE MAP LAYER IN
NEAR-SURFACE GEOPHYSICS
Muhammad Yanis1, Faisal Abdullah1,2, Aprilla Anggini Hasibuan1,
Muzakir Zainal1, Marwan1,2 1Program Studi Teknik Geofisika, Fakultas Teknik, Universitas Syiah Kuala
2Program Studi Fisika, Fakultas MIPA, Universitas Syiah Kuala
Jl. Teuku Nyak Arief, Darussalam, Banda Aceh, Aceh 23111, Indonesia e-mail: [email protected]
Received: 16 April 2020, Repaired: 12 June 2020, Approved: 03 November 2020
Abstract
The Geophysical method is operated by using physical parameters above the surface to estimate the subsurface structures. In data interpretation, all 3D surveys, i.e., magnetic, gravity, magnetotelluric, and airborne, are required for geographical conditions in the research area. In a large area, global DEM data is used to explain the field condition, but for local measurement, the data is not efficient due to low resolution (15-30 m/px). This research uses UAV technology to produce a high-resolution topography in local Geophysical measurement (500 x 600 m). The survey was conducted to map the coal structure in the subsurface. UAV data were also compared to SRTM (30 m/px) and DEMNAS (8 m/px) as global topography. Based on data processing, the UAV topographic was have a high resolution of 2.5 cm/px. Comparison of UAV and magnetic data are able to explain a good condition of field measurement than a global DEM data, even in a relatively small area; outcrops of the coal (50x50 m) can show a good differences contrast of topography. Based on data analysis, we can conclude that UAV technology can interpret the geophysical data measured in a local area. Keywords: UAV, SRTM, Topography, Geophysical Interpretation.
Abstrak
Metode Geofisika bekerja dengan memanfaatkan parameter fisis diatas permukaan untuk pendugaan struktur bawah permukaan. Dalam tahapan interpretasi data, semua pengukuran 3D Geofisika; magnetic, gravity, magnetotelluric, dan airbone sangat membutuhkan keadaan geografis lapangan. Pada area yang luas, data DEM global digunakan untuk menjelaskan deskripsi lapangan, namun untuk pengukuran dekat permukaan yang bersifat lokal, data ini tidaklah efesien, karena resolusi yang relative rendah (15 – 30 m/px). Kami menggunakan teknologi UAV untuk menghasilkan topografi resolusi tinggi pada area pengukuran Geofisika dengan luas 500 x 600 m, yang disurvei untuk pemetaan batubara dibawah permukaan. Data UAV juga dibandingkan dengan topografi global SRTM (30 m/px) dan DEMNAS (8 m/px). Hasil pengolahan data menunjukkan data UAV menghasilkan topografi dengan resolusi 2.5 cm/px. Hasil overlay UAV dengan Geofisika magnetik mampu menjelaskan deskripsi lapangan dengan sangat baik dibandingkan DEM global, bahkan pada area yang relative kecil seperti singkapan batuabara (50x50 m) dapat menunjukkan keadaan perbedaan topografi dengan kontras. Berdasarkan data analysis, topografi UAV sangat potensial digunakan untuk interpretasi data Geofisika dekat permukaan yang diukur pada area yang relative lokal. Kata kunci: UAV, SRTM, Topografi, Interpretasi Geofisika
DOI: 10.24114/jg.v%vi%i.17818 e-ISSN: 2549–7057 | p-ISSN: 2085–8167
Jurnal Geografi Vol 13 No. 1 – 2021 A p p l i c a t i o n o f U n m a n n e d. . . . . | 27
INTRODUCTION
Application of geophysical methods
always requires geographical data to explain
the field survey's condition as a geological
object, outcrops, and elevation to facilitate
the geophysical data interpretation
(Masoud, 2011). The topographic data from
the Digital elevation model (DEM) has been
used to study various phenomena in earth
science; such as mapping of geological
structures (Masoud and Koike, 2006),
geomorphology (Bailey et al., 2007),
hydrogeology (Valeriano et al., 2006), and
also used in natural hazard studies as floods,
earthquake, and tsunamis event (Sander,
2007). Furthermore, the topographic data
also becomes the main parameter in the
geophysical survey, usually used as a base
map in magnetic, gravity measurements,
and seismological studies. The topographic
has been the standard technique for
presenting the field data (Yanis et al., 2019;
Umar et al., 2018).
Information of spatial geography can
be made using the satellite observation data,
which may be represented in two
dimensions of the earth's surface.
Kalaivanan (2014) states the Shuttle Radar
Topographic Mission (SRTM) is a useful
satellite image used to describe topographic
conditions in an area with a resolution of 30
m. For regional measurements (>1000 km2),
the SRTM data is applicable. For residual
<1000 km2, the data is not useful because the
relative data distribution is less, and large
spatial resolution did not represent the
geographical conditions of the survey area—
for example, the near-surface geophysics
measured in an area of 500 m x 600 m.
Moreover, the residual topography is always
needed in the near-surface data, which not
be solved by global topography. Actually,
there are various types of high-resolution
satellites available on the internet, such as
GeoEye, IKONOS, SPOT-5, and Terra-
ASTER. The satellite data has a resolution of
0.46 meters for 1 pixel, but the data is high at
an economical cost and cannot freely access.
The relatively expensive data becomes a
problem in near-surface geophysics. In
contrast, the other factors of the satellite data
are a cloud cover, dependence on data
providers, and the time or location data,
which is not flexible (Shofiyanti, 2011).
Moreover, to obtain a high-resolution of
topography that provides a representative of
the local geographic survey area, a
technology of aerial photography is used
from drone equipment or Unmanned Aerial
Vehicle. UAV technology is increasingly
applied in several geological investigations
(Blistan, 2016). UAV applications can be
paired with high-resolution digital cameras
that can produce a digital orthophoto, DEM,
Digital Terrain Model (DTM), Digital
Surface Model; (DSM), and 3D models of the
geological objects. This system is very useful
for many topographic mapping, especially
for residual areas that can reduce the time-
consuming and economical cost. The UAV is
also possible to be measured in cloud-free
conditions that affected the results of
topographic data (Ahmad et al. 2008).
UAV applications have been widely
used in various aspects; for example, Chi et
al. (2016) to produce high topographic maps
of the Errn river flow in Tainan, Taiwan, and
also Mancini et al. (2013) have used hex
copter-type UAVs for observation of sand
dunes in the area of the North Adriatic coast
in Ravenna, Italy, these topographic data are
beneficial for use in a smaller or local study
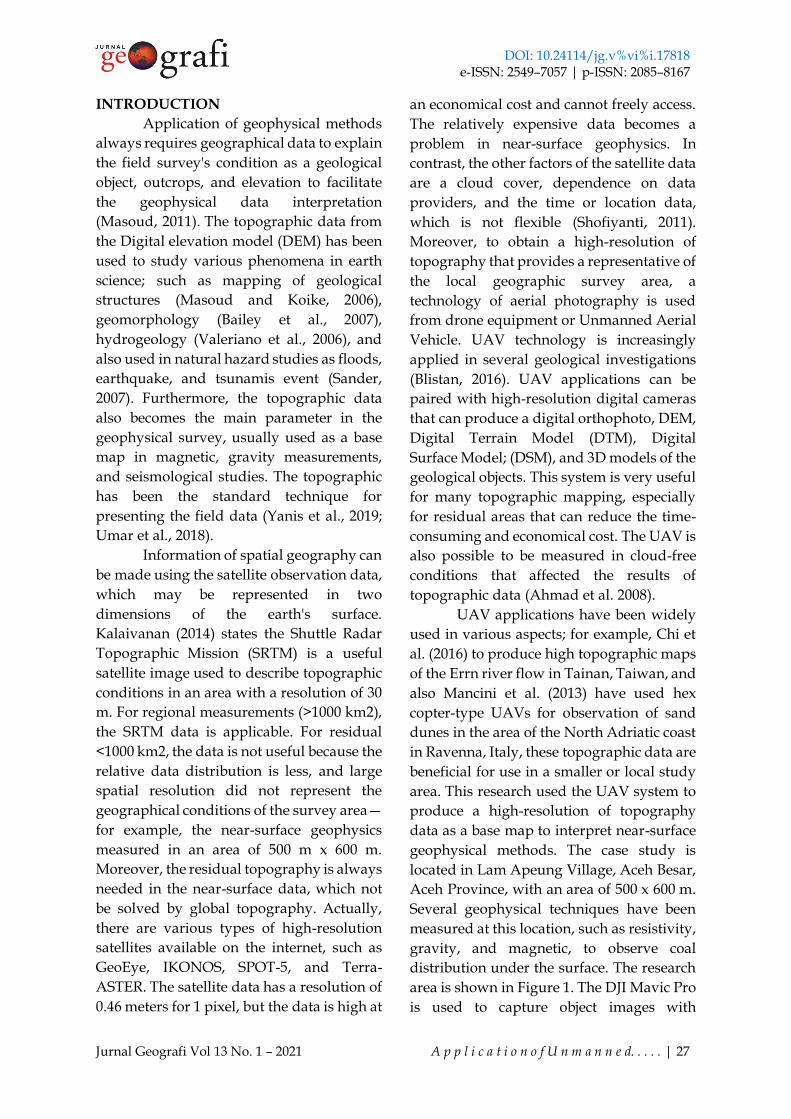
area. This research used the UAV system to
produce a high-resolution of topography
data as a base map to interpret near-surface
geophysical methods. The case study is
located in Lam Apeung Village, Aceh Besar,
Aceh Province, with an area of 500 x 600 m.
Several geophysical techniques have been
measured at this location, such as resistivity,
gravity, and magnetic, to observe coal
distribution under the surface. The research
area is shown in Figure 1. The DJI Mavic Pro
is used to capture object images with
DOI: 10.24114/jg.v%vi%i.17818 e-ISSN: 2549–7057 | p-ISSN: 2085–8167
Jurnal Geografi Vol 13 No. 1 – 2021 A p p l i c a t i o n o f U n m a n n e d. . . . . | 28
overlapping for 80 - 100%. This equipment
has a camera resolution of 12 MP, which is
possible to produce a spatial resolution of
0.15-0.25 m/px for a flight distance of 100 m.
Besides, for data comparison, the UAV
system will be compared with a global
topography such as SRTM (30 m/px) and
DEMNAS (8 m/px) data.
Figure 1. (a) The research location is in Lam Apeng Village, Aceh Besar; ± 50 km from Banda
Aceh. (b) Shows a UAV flight route of 500x600 m area. The red box is the measurement area
for the geophysical method, while the red circle is the location for the coal outcrop shown in
Figure (c).
METHOD AND DATA OBSERVATION Digital Elevation Model (DEM) is a
technique to store topographic data into the X coordinates as a latitude function. The Y coordinates as longitude and Z coordinates as height (mostly in mean sea level unit or MSL), representing the topographic condition from the survey area. The DEM in this research was derived from a UAV made by the DJI Mavic Pro as a multicopter drone type. In order to cover the entire measurement area (as shown by the red box in Figure 1.c), the drone was flown at an altitude of 100 meters and controlled through the Pix4D mapper application. The flight had successfully obtained 630 photos covering an area of 500 x 600 meters square, with a duration of ± 15 minutes. The specific instruments used in the flight are shown in
Table 1. The photos were processed using an open-source software Drone Mappers with SFM (structure from motion) technique. The software is able to model objects from two-dimensional images into three-dimensional shapes. The images were then processed using high-quality settings that included aligning photos, building the dense cloud, and mesh to generate the DEM data and orthomosaics from all pictures. In order to obtain the comprehensive results, the data obtained from the UAV will be compared with Shuttle Radar Topography Mission (SRTM) satellites and National DEM data, which can be accessed free of charge.
The SRTM data were downloaded from the USGS website earthexplorer.usgs.gov with a resolution of
DOI: 10.24114/jg.v%vi%i.17818 e-ISSN: 2549–7057 | p-ISSN: 2085–8167
Jurnal Geografi Vol 13 No. 1 – 2021 A p p l i c a t i o n O f U n m a n n e d. . . . . | 29
30 m, while the National DEM data were downloaded from the BIG website tides.big.go.id/DEMNAS with a resolution of 8 m/px. The SRTM data is obtained through the Space Shuttle Endeavor satellite, equipped with two antenna panels. This satellite was flown in 2000 with an altitude of 233 km and a tilt of 57 degrees. Endeavor
orbits Earth 16 times each day during its 11-day mission, completing 176 orbits. SRTM has managed to collect radar data of more than 80% of the earth's land surface between 60 ° North latitude and 56 ° South latitude with data points every one arc-second about 30 meters (Masoud and Koike, 2011).
Table 1. Instruments of the research
No Instrument Specifications
1 Drone Mavic Pro Platinum Dimension 305 x 204 x 85 mm
Wight 743 gram
Speed 65 km/hours
Max Flight time 27 minutes
Resolution 4000 x 3000
C4K: 4096×2160 24p
4K:3840×2160 24/25/30p
2.7K:2720x153024/25/30p
FHD:1920×1080
ISO
Sensor
Operating Temperature Range
Satellite Positioning Systems
Maximum Takeoff Altitude
100 – 1600
1/2.3” (CMOS), Effective
piksels:12.35M
32° to 104° F (0° to 40° C)
GPS / GLONASS
16404 feet (5000 m)
2 Software Pix4D Mapper version
3 Drone Mapper Desktop photogrammetry software. Processing of orthomosaic, DEM, DTM, and Point Cloud Generation
Source: DJI Release Note, 2018
The SRTM and DEMNAS data were
then processed and cropped to have the
same area as with the UAV data set. The data
then converted into a hillshade using the 3D
Analyst toolbox in ArcGIS 10.5 software by
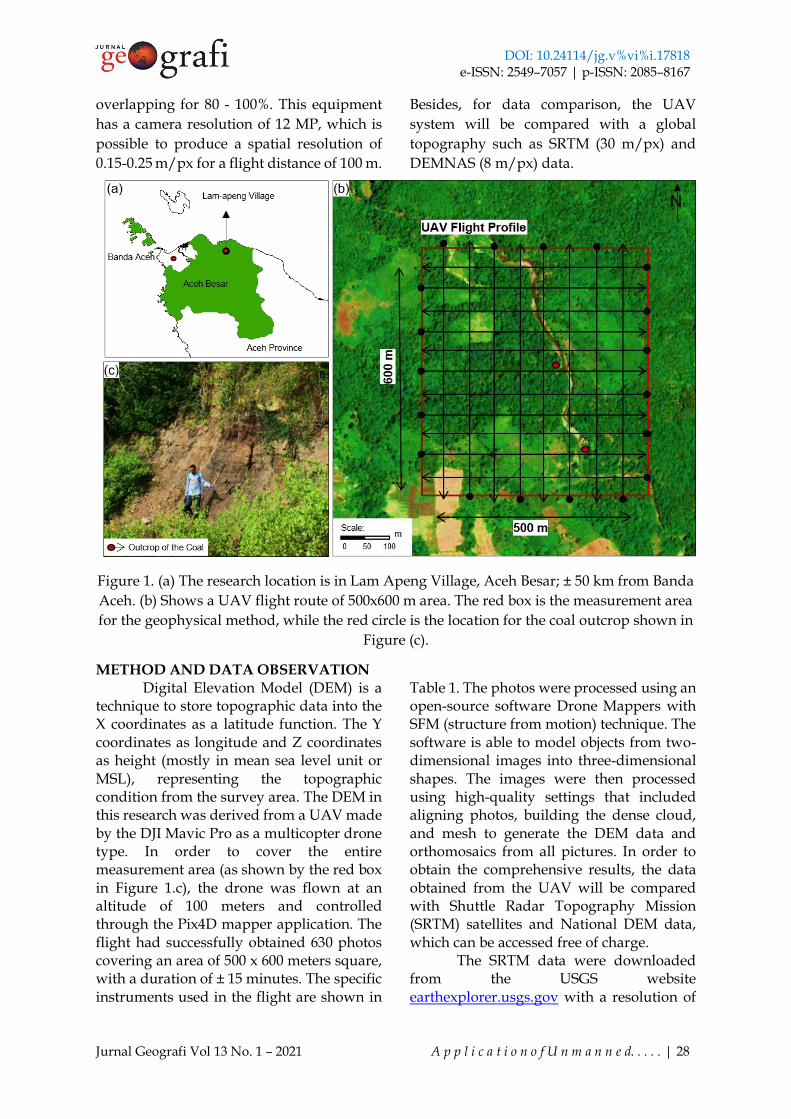
ESRI. Specifically, the flow chart of the UAV
data processing and satellite topography is
shown in Figure 2. The hillshade is the
provision of different angles of light so that
it is useful for sharpening the visualization
of a surface to display a more representative
image. The purpose of a hillshade process is
to get a 3D effect of images so that the relief
shape is visible, making the visual
appearance of an object more visible. The
DEMNAS data with better resolution (8
meters/px) is built from several satellites,
such as IFSAR (5 m resolution), TERRASAR-
X (5 m resolution), and ALOS PALSAR
(11.25m resolution) and additional mass
point data from stereo-plotting. The spatial
resolution of DEMNAS is 0.27-arcsecond
using the EGM 2008 vertical datum. If the
unit is converted to meters, the value is
approximately 8.33 m/px. Sumatra's
validation results show that the accuracy of
DEMNAS is better than the high data model
formed from the mass point, spot height,
and breakline (BIG, 2014).
DOI: 10.24114/jg.v%vi%i.17818 e-ISSN: 2549–7057 | p-ISSN: 2085–8167
Jurnal Geografi Vol 13 No. 1 – 2021 A p p l i c a t i o n O f U n m a n n e d. . . . . | 30
Figure 2. Flow chart of the topography comparison from the UAV instrument and satellite
data (SRTM and DEMNAS) as a base map in measuring magnetic geophysical data.
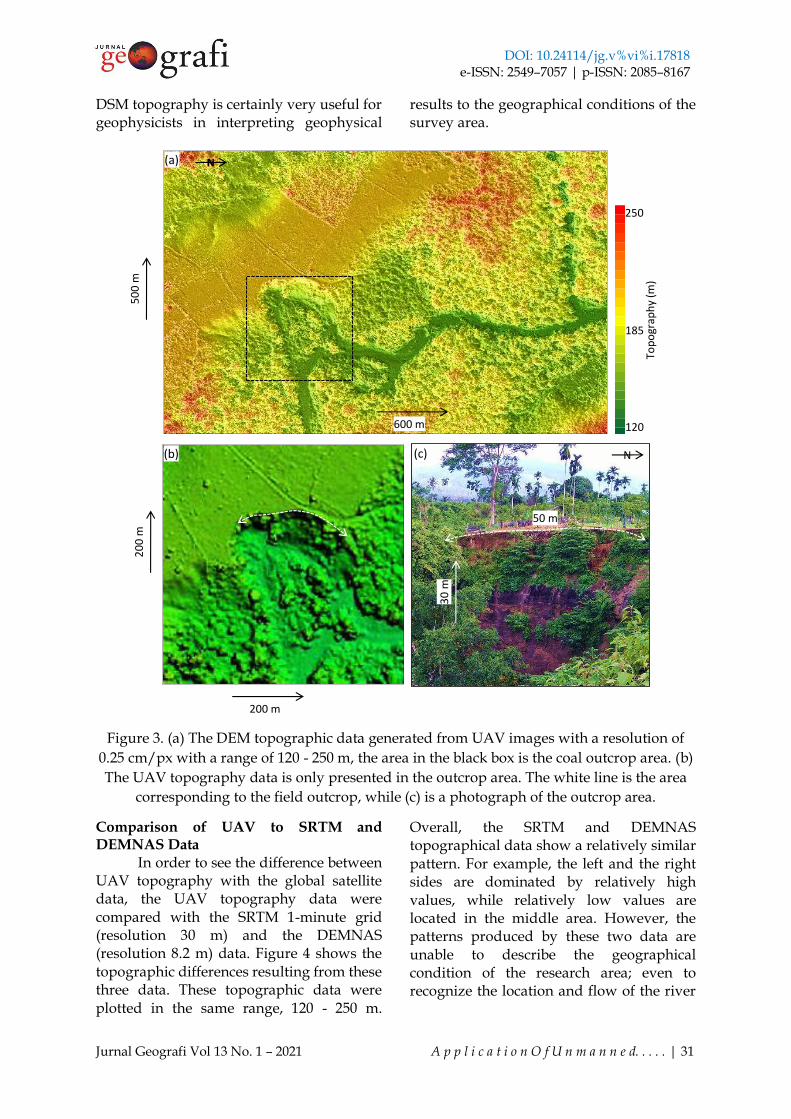
RESULTS AND DISCUSSION The processing results of 630 UAV
data to become the topographic data in the form of a Digital Terrain Model (DTM), Digital Surface Model (DSM), and orthomozaik show that the difference between these two elevation data lies in the height assumption generated by DTM without following the object's height. In contrast, the calculation of digital elevation on the DSM follows the object's height above the surface (Vallet et al., 2011). However, in this study, the DTM data was not used because it had a lower resolution than the DSM elevation. Figure 3 shows DSM topographical data with 500 x 600 meter square in a coal area in Lam Apeng Village, District of Aceh Besar, Aceh Province. Overall, the topographic values obtained are in the range of 120 - 250 m. The relatively low values are located in river areas, while high values are in community plantation areas. Besides being able to distinguish the location of the river from the surrounding conditions,
the data can also recognize the boundaries of the community's rice fields because the topographic data has a resolution of 2.5 cm/px, which is generated by combining 630 images with a quality of 20 MP (4000 x 3000 pixels).
Besides, the UAV topography data can clearly show the coal outcrop area with a width of 50 m and a difference in height of up to 30 m, as shown in Figure 3.b. This is verified through documentation in the field outcrop area (Figure 3.c). Simultaneously, a survey of several geophysical methods was carried out, such as magnetic, gravity and resistivity surveys, to estimate the structure of the coal below the surface. According to Marwan et al. (2019), the area's geological structures are generally dominated by rocks originating from volcanic eruptions, namely the Lam Teuba formation. This formation consists of volcanic rocks from andesite to dacite, pumice breccia, tuffs, agglomerates, and young volcanic deposits. Apart from geological information, this high-resolution
Aerial Survey UAV
DJI Mavic Pro Platinum
Satellite
SRTM and DEMNAS
Image Processing
Align Photo
Build Dense Cloud
Build Mesh
Interpolation
Orthomozaik
Aerial Photography
Build Texture
Digital Surface Model
Digital Terrain Model
Fill and Hill shade using
ArcGIS Platform
Comparison of the UAV
topography to SRTM
and DEMNAS
Digital Surface Model Slope Analysis
The topography is overlaid to geomagnetic
data acquired to mapping the coal area.
Magnetic intensity anomaly
overlaid with UAV and SRTM as
a base maps data
DOI: 10.24114/jg.v%vi%i.17818 e-ISSN: 2549–7057 | p-ISSN: 2085–8167
Jurnal Geografi Vol 13 No. 1 – 2021 A p p l i c a t i o n O f U n m a n n e d. . . . . | 31
DSM topography is certainly very useful for geophysicists in interpreting geophysical
results to the geographical conditions of the survey area.
Figure 3. (a) The DEM topographic data generated from UAV images with a resolution of
0.25 cm/px with a range of 120 - 250 m, the area in the black box is the coal outcrop area. (b)
The UAV topography data is only presented in the outcrop area. The white line is the area
corresponding to the field outcrop, while (c) is a photograph of the outcrop area.
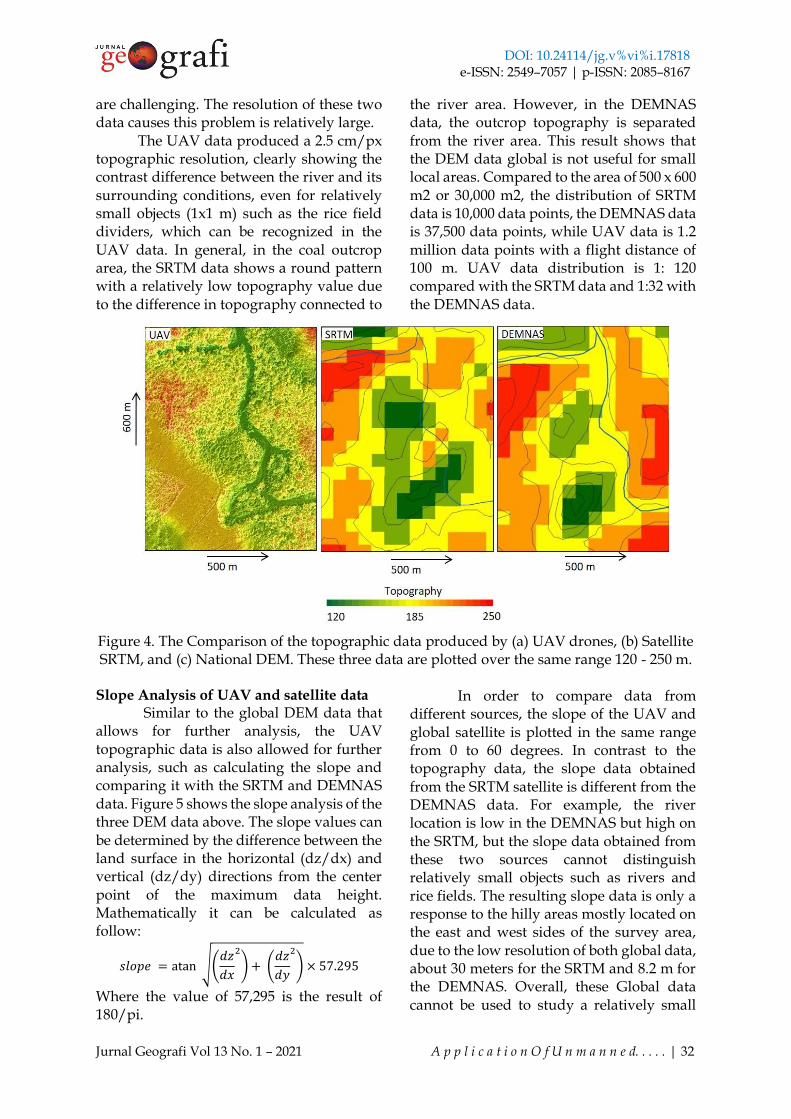
Comparison of UAV to SRTM and DEMNAS Data
In order to see the difference between UAV topography with the global satellite data, the UAV topography data were compared with the SRTM 1-minute grid (resolution 30 m) and the DEMNAS (resolution 8.2 m) data. Figure 4 shows the topographic differences resulting from these three data. These topographic data were plotted in the same range, 120 - 250 m.
Overall, the SRTM and DEMNAS topographical data show a relatively similar pattern. For example, the left and the right sides are dominated by relatively high values, while relatively low values are located in the middle area. However, the patterns produced by these two data are unable to describe the geographical condition of the research area; even to recognize the location and flow of the river
200 m
20
0 m
N
600 m
50
0 m
120
185
250
Top
ogr
aph
y (m
)
(a)
(b)
N
(c)
50 m
30
m
DOI: 10.24114/jg.v%vi%i.17818 e-ISSN: 2549–7057 | p-ISSN: 2085–8167
Jurnal Geografi Vol 13 No. 1 – 2021 A p p l i c a t i o n O f U n m a n n e d. . . . . | 32
are challenging. The resolution of these two data causes this problem is relatively large.
The UAV data produced a 2.5 cm/px topographic resolution, clearly showing the contrast difference between the river and its surrounding conditions, even for relatively small objects (1x1 m) such as the rice field dividers, which can be recognized in the UAV data. In general, in the coal outcrop area, the SRTM data shows a round pattern with a relatively low topography value due to the difference in topography connected to
the river area. However, in the DEMNAS data, the outcrop topography is separated from the river area. This result shows that the DEM data global is not useful for small local areas. Compared to the area of 500 x 600 m2 or 30,000 m2, the distribution of SRTM data is 10,000 data points, the DEMNAS data is 37,500 data points, while UAV data is 1.2 million data points with a flight distance of 100 m. UAV data distribution is 1: 120 compared with the SRTM data and 1:32 with the DEMNAS data.
Figure 4. The Comparison of the topographic data produced by (a) UAV drones, (b) Satellite SRTM, and (c) National DEM. These three data are plotted over the same range 120 - 250 m.
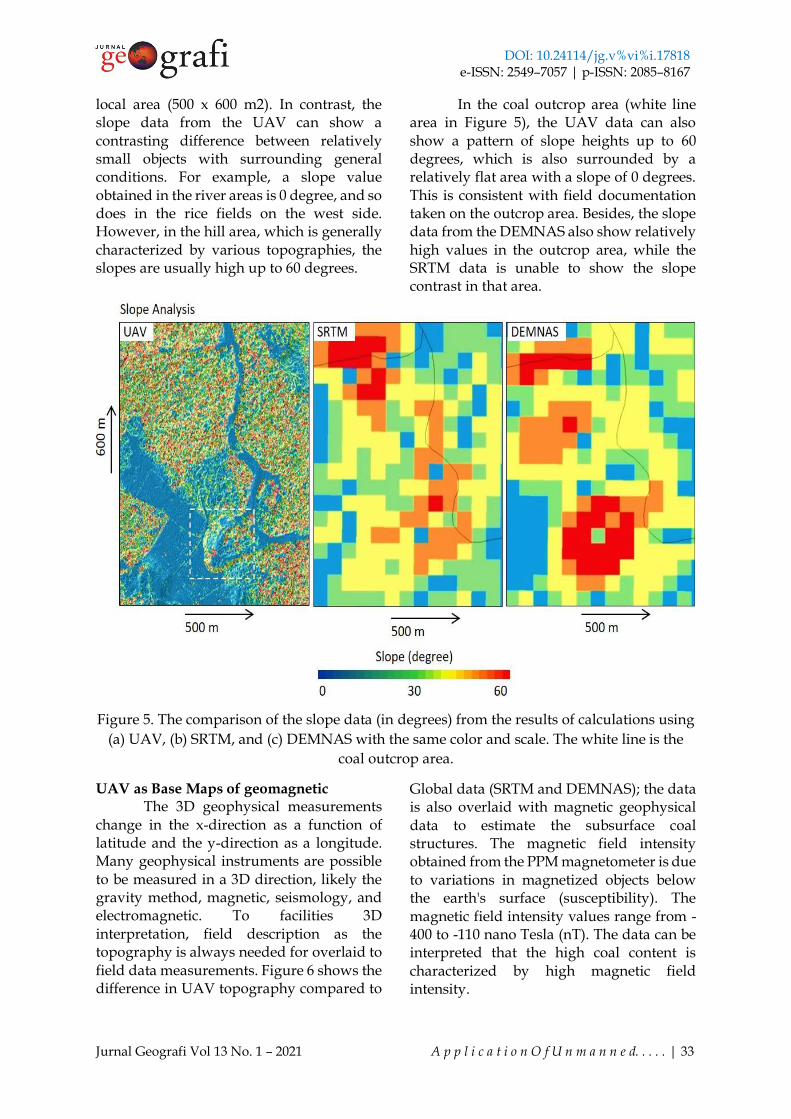
Slope Analysis of UAV and satellite data
Similar to the global DEM data that allows for further analysis, the UAV topographic data is also allowed for further analysis, such as calculating the slope and comparing it with the SRTM and DEMNAS data. Figure 5 shows the slope analysis of the three DEM data above. The slope values can be determined by the difference between the land surface in the horizontal (dz/dx) and vertical (dz/dy) directions from the center point of the maximum data height. Mathematically it can be calculated as follow:
𝑠𝑙𝑜𝑝𝑒 = atan √(𝑑𝑧
𝑑𝑥
2
) + (𝑑𝑧
𝑑𝑦
2
) × 57.295
Where the value of 57,295 is the result of 180/pi.
In order to compare data from
different sources, the slope of the UAV and global satellite is plotted in the same range from 0 to 60 degrees. In contrast to the topography data, the slope data obtained from the SRTM satellite is different from the DEMNAS data. For example, the river location is low in the DEMNAS but high on the SRTM, but the slope data obtained from these two sources cannot distinguish relatively small objects such as rivers and rice fields. The resulting slope data is only a response to the hilly areas mostly located on the east and west sides of the survey area, due to the low resolution of both global data, about 30 meters for the SRTM and 8.2 m for the DEMNAS. Overall, these Global data cannot be used to study a relatively small
DOI: 10.24114/jg.v%vi%i.17818 e-ISSN: 2549–7057 | p-ISSN: 2085–8167
Jurnal Geografi Vol 13 No. 1 – 2021 A p p l i c a t i o n O f U n m a n n e d. . . . . | 33
local area (500 x 600 m2). In contrast, the slope data from the UAV can show a contrasting difference between relatively small objects with surrounding general conditions. For example, a slope value obtained in the river areas is 0 degree, and so does in the rice fields on the west side. However, in the hill area, which is generally characterized by various topographies, the slopes are usually high up to 60 degrees.
In the coal outcrop area (white line area in Figure 5), the UAV data can also show a pattern of slope heights up to 60 degrees, which is also surrounded by a relatively flat area with a slope of 0 degrees. This is consistent with field documentation taken on the outcrop area. Besides, the slope data from the DEMNAS also show relatively high values in the outcrop area, while the SRTM data is unable to show the slope contrast in that area.
Figure 5. The comparison of the slope data (in degrees) from the results of calculations using
(a) UAV, (b) SRTM, and (c) DEMNAS with the same color and scale. The white line is the
coal outcrop area.
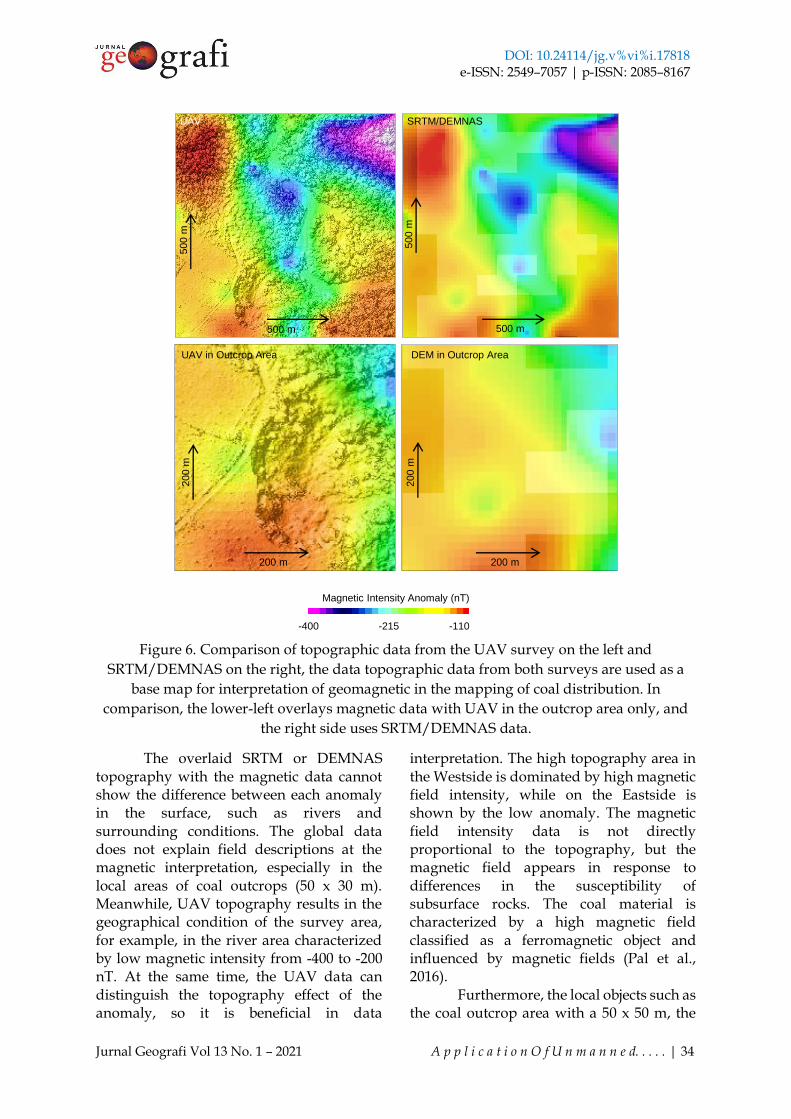
UAV as Base Maps of geomagnetic The 3D geophysical measurements
change in the x-direction as a function of latitude and the y-direction as a longitude. Many geophysical instruments are possible to be measured in a 3D direction, likely the gravity method, magnetic, seismology, and electromagnetic. To facilities 3D interpretation, field description as the topography is always needed for overlaid to field data measurements. Figure 6 shows the difference in UAV topography compared to
Global data (SRTM and DEMNAS); the data is also overlaid with magnetic geophysical data to estimate the subsurface coal structures. The magnetic field intensity obtained from the PPM magnetometer is due to variations in magnetized objects below the earth's surface (susceptibility). The magnetic field intensity values range from -400 to -110 nano Tesla (nT). The data can be interpreted that the high coal content is characterized by high magnetic field intensity.
DOI: 10.24114/jg.v%vi%i.17818 e-ISSN: 2549–7057 | p-ISSN: 2085–8167
Jurnal Geografi Vol 13 No. 1 – 2021 A p p l i c a t i o n O f U n m a n n e d. . . . . | 34
Figure 6. Comparison of topographic data from the UAV survey on the left and
SRTM/DEMNAS on the right, the data topographic data from both surveys are used as a
base map for interpretation of geomagnetic in the mapping of coal distribution. In
comparison, the lower-left overlays magnetic data with UAV in the outcrop area only, and
the right side uses SRTM/DEMNAS data.
The overlaid SRTM or DEMNAS topography with the magnetic data cannot show the difference between each anomaly in the surface, such as rivers and surrounding conditions. The global data does not explain field descriptions at the magnetic interpretation, especially in the local areas of coal outcrops (50 x 30 m). Meanwhile, UAV topography results in the geographical condition of the survey area, for example, in the river area characterized by low magnetic intensity from -400 to -200 nT. At the same time, the UAV data can distinguish the topography effect of the anomaly, so it is beneficial in data
interpretation. The high topography area in the Westside is dominated by high magnetic field intensity, while on the Eastside is shown by the low anomaly. The magnetic field intensity data is not directly proportional to the topography, but the magnetic field appears in response to differences in the susceptibility of subsurface rocks. The coal material is characterized by a high magnetic field classified as a ferromagnetic object and influenced by magnetic fields (Pal et al., 2016).
Furthermore, the local objects such as the coal outcrop area with a 50 x 50 m, the
UAV SRTM/DEMNAS
500 m
500 m
500 m
-400 -215 -110
Magnetic Intensity Anomaly (nT)
UAV in Outcrop Area
200 m
200 m
500 m
DEM in Outcrop Area
200 m
200 m
DOI: 10.24114/jg.v%vi%i.17818 e-ISSN: 2549–7057 | p-ISSN: 2085–8167
Jurnal Geografi Vol 13 No. 1 – 2021 A p p l i c a t i o n O f U n m a n n e d. . . . . | 35
UAV topography is also able to provide the geographical conditions of the measurement area. It will be helped the geophysicists to interpret the magnetic intensity with the topographic information as the site description. Based on data analysis and comparing to global DEM, it can be concluded the UAV topography is very potential to be used as base maps in presenting the geophysical data, this is due to the high resolution of the data, namely 2.5 cm/px for a flying altitude of 100 m above the surface.
CONCLUSION
Topography has become a standard parameter for studying various geological phenomena in seismology and geophysical methods that have used topography as a base map to determine the field description in data interpretation. For regional studies, the global DEM is relatively often used, while in the local studies, the global data are not useful to apply. In the research, we have used the UAV system to produce a high resolution of topography data (2.5 cm/px). The UAV is used to obtain the topography covering the magnetic survey as a near-surface geophysical method for mapping the sub-surface’s coal volume. For data comparison, we also compared the UAV data with global DEM, namely SRTM (30 m/px) and DEMNAS (8.25 m/px). The UAV system performed the topographic data in the DSM, DTM, and orthomozaik images based on processing, which has to combine 630 frames into one image. The DSM shows the topography of the research area is in the range of 120 to 250 m. The UAV topography can also be used for slope analysis that ranges from 0 - 60 degrees. UAV data overlay with a total magnetic field intensity (nT) from magnetic measurement shows the topography can be used as a base map. The topography is useful for explaining a field description in the interpretation of near-surface structure for geophysical study, even in more local areas such as rivers with dimensions of 2x2 m, hills (100x100 m), and coal outcrops (50 x 50 m) can be mapped very well.
ACKNOWLEDGMENT
We would like to thanks students of the Geophysics Engineering Tour (GET) 2018 who contributed to the data collection. We also thank Badrul Munir as a laboratory assistant who also helped a lot in field observation.
REFERENCE LIST Ahmad, M. J., Ahmad, A., and Kanniah, K.
(2018). Large Scale Topography Mapping Based on Unmanned Aerial Vehicle and Aerial Photogrammetric Technique. Department of Geoinformation, Faculty of Geoinformation & Real Estate Universiti Teknologi Malaysia. IOP Conf. Series: Earth and Environmental Science: 169.
Bailey, J.E., Self, S., Wooller, L.K. And MouginisMark, P.J. (2007). Discrimination of Fluvial and Eolian Features on Large Ignimbrite Sheets Around La Pacana Caldera, Chile, Using Landsat And Srtm-Derived Dem. Remote Sensing of Environment, 108, Pp. 24–41.
Blistan, P., Kovanic, L., Zeliznakova, V., Palkova, J. (2016). Using UAV photogrammetry to document rock outcrops.Acta Montan. Slovaca, 21, 154–161.
Chi, Y., Ya-Fen Lee, Shang-En Tsai. (2006). Study on High Accuracy Topographic Mapping via UAV-based Images. IOP Conference Series: Earth and Environmental Science.
DJI (2018), Mavic Pro Release Notes, 2018. Gurugnanam. B and Kalaivanan. K. (2014).
Analysis Of Digital Elevation Model Of Kolli Hill, South India Using Shuttle Radar Topography Mission Data And GIS Techniques, International Journal Of Scientific Research, Volume: 3, Issue: 6. ISSN No: 2319-3484.
Mancini, F., Dubbini, M., Gatteli, M., Stecchi, F., Fabbri, S. and Gabbianelli, G. (2013). Using Unmanned Aerial Vehicles (UAV) for High-Resolution Reconstruction of Topography: The Structure from Motion Approach on
DOI: 10.24114/jg.v%vi%i.17818 e-ISSN: 2549–7057 | p-ISSN: 2085–8167
Jurnal Geografi Vol 13 No. 1 – 2021 A p p l i c a t i o n O f U n m a n n e d. . . . . | 36
Coastal Environments. Remote Sens. 2013, 5, 6880-6898; doi:10.3390/rs5126880.
Marwan, Yanis,M , Idroes R and Ismail, N, (2019). 2D inversion and Static Shift of MT and TEM Data for Imaging the Geothermal Resources of Seulawah Agam Volcano, Indonesia., Internasional Journal of GEOMATE. Vol 17, Issue 62,pp. 173-180.
Masoud, A. and Koike, K. (2006). Tectonic Architecture through Landsat-7 Etmþ/Srtmdem-Derived Lineaments and Relationships To The Hydrogeologic Settings In Siwaregion, Nw Egypt. Journal of African Earth Sciences, 45, Pp. 467–477.
Masoud, A. and Koike, K. (2011). Autodetection and integration of tectonically significant lineaments from SRTM DEM and remotely-sensed geophysical data. ISPRS Journal of Photogrammetry and Remote Sensing, 66.6: 818-832.
Muksin, U., Bauer, K., Muzli, M., Ryberg, T., Nurdin, I., Masturiyono, M., & Weber, M. (2019). AcehSeis project provides insights into the detailed seismicity distribution and relation to fault structures in Central Aceh, Northern Sumatra. Journal of Asian Earth Sciences, 171, 20-27.
Pal, S. K., Vaish, J., Kumar, S., & Bharti, A. K. (2016). Coal fire mapping of East Basuria Colliery, Jharia coalfield using vertical derivative technique of magnetic data. Journal of Earth System Science, 125(1), 165-178.
Sanders, B. F. (2007). Evaluation of On-Line Dems for Flood Inundation Modeling. Advances in Water Resources, 30, Pp. 1831–1843.
Shofiyanti, R. (2011). Teknologi Pesawat Tanpa Awak Untuk Pemetaan dan Pemantauan Tanaman dan Lahan Pertanian. Informatika Pertanian, Vol. 20 No.2, Desember 2011 : 58 – 64.
USGS. (2015). Landsat 8 (L8) Data Users handbook, [online], dari: https://landsat.usgs.gov/documents/
Landsat8DataUsersHandbook.pdf. [3 Februari 2017].
Valeriano, M.M., Kuplich, T.M., Storino, M., Amaral, B.D., Mendes Jr, J.N. And Lima, D. J. (2006). Modeling Small Watersheds In Brazilian Amazonia With Shuttle Radar Topographic Mission-90 M Data. Computer and Geosciences, 32, Pp. 1169–1181.
Vallet, J., F. Panissod, C. Strecha, dan M. Tracol. (2011). Photogrammetric Performance of an Ultra Light Weight Swinglet, International Archives of the Photogrametri, Remote Sensing and spatial Information Science, Zurich, Swiss.
Van Zyl, J. J. (2001). The Shuttle Radar Topography Mission (SRTM): a
breakthrough in remote sensing of topography. Acta Astronautica,
48(5-12), 559-565. Watt, J., Ponce, D., Parsons, T., & Hart, P.
(2016). Missing link between the Hayward and Rodgers Creek faults. Science advances, 2(10), e1601441.
Yanis, M., Marwan. (2019, November). The potential use of satellite gravity data for oil prospecting in Tanimbar Basin, Eastern Indonesia. In IOP Conference Series: Earth and Environmental Science (Vol. 364, No. 1, p. 012032). IOP Publishing.
Yanis, M., Marwan. Dan Kamalia, N. (2020). Aplikasi Satellite GEOSAT dan ERS sebagai metode alternatif Pengukuran Gravity Ground pada cekungan Hidrokarbon di Pulau Timur. Majalah Geografi Indonesia, 33(2), 1-9.
Zainal, M., Yanis, M., Darisma, D., & Ismail, N. (2019, November). The determination of depth anomaly in archaeo-magnetic using an Euler deconvolution: Case study in Kuta Lubok fortress. In IOP Conference Series: Earth and Environmental Science (Vol. 364, No. 1, p. 012034). IOP Publishing.
Zhao, Q., Xu, X., Forsberg, R., & Strykowski, G. (2018). Improvement of downward continuation values of airborne gravity data in Taiwan. Remote Sensing, 10(12), 1951.