Embed Size (px)
Citation preview
Application of Total Quality Management (TQM)
and Statistical Process Control (SPC) in Improving
Business Competitiveness for Manufacturing
Organizations
IgnatioMadanhire, and Charles Mbohwa
Abstract---The success of TQM and SPC as a boost to business
competitiveness has had its own share of controversies. Many organizations all over the world have embarked on the TQM journey, with their process under statistical control, to achieve increased competitiveness, some recorded success while others regretted ever embarking on such a journey. The purpose of this research study is to
determine if the myth of TQM and SPC in enhancing business competitiveness is true for Zimbabwean manufacturing organizations.
Keywords--Quality, competitiveness, TQM, manufacturing,
SPC
I. INTRODUCTION
RGANIZATIONS all over the world have embarked on
use of TQM to beat competitive forces in terms of
business aspects. Quality award recipients have shown
better results than comparable „average companies‟, Eriksson
and Hansson (2003), thus making TQM an efficient means of
navigating the increasing competitiveness of a borderless
world. With the ever increasing business world competition,
survival and existence deepens on how organizations are set to
increase and sustain their competitive advantage. Some of the ways of achieving competition advantage include, but not
limited to, cost reductions, shortening of process and
marketing response times, maintenance of good cordial
relationships with suppliers and the continuous improvement
of both products and processes.
II. LITERATURE REVIEW
With high exposure to the global markets, the consumer of
today is thus exerting intense demand for high quality goods at
low prices. In order to survive in such markets it is therefore
rational for any manufacturing company that wishes to be
competitive in the globalized market place to focus on
production that is of consistently accepted high quality, offered
at competitive pricing level. Hence, the manufacturing firms
seek to adopt and implement a set of tried and tested business
management practices.
Ignatio Madanhire
is with Dept of Mechanical, Faculty of Engineering of
Engineering, University of Zimbabwe, Harare, Zimbabwe (Phone: +263 712
453 451, email: [email protected] ) Charles Mbohwa is with Dept of Quality and Operations Management,
Faculty of Engineering and The Built Environment, University of
Johannesburg, Auckland Park 2006, South Africa (Phone: +27 782071516,
email:[email protected]
One form of operation management practices is TQM which
has received great attention in the last decades (Jung and Wang,
cited in Salaheldin, 2009).
TQM has become a pervasive element of business strategy,
allowing companies to accurately monitor, control, analyse,
manage and improve their processes, in real time, thus allowing them to make corrective actions which would result
in the enhancement of their competitive advantages.
From whatever angle TQM is looked at, the point of
emphasis is customer satisfaction through continued
improvement of products and services. According to Deming,
quality is a continuous quality improvement process towards
predictable degree of non variability and dependability
(Oakland, 2003:4). Juran defined quality as “fitness for use.”
meaning “every person in the organization must be involved in
the effort to make products or services that are fit for use‟‟
(Oakland, 2003:4). Crosby defined quality as conformance to requirements (Oakland, 2003:4). His focus has been on zero
defects and doing it right the first time. Ishikawa also
emphasized importance of total quality control to improve
organizational performance, this meant, quality does not only
mean the quality of products, but also of after sales service,
quality of management, the company itself and the human life.
Feigenbaum defined total quality as a continuous work
processes, starting with customer requirements and ending
with customer‟s satisfaction. (Oakland, 2003:4).
The creation of the total quality management philosophy is
generally attributed to Dr. W. Edwards Deming (1900-1993).
Together with Shewhart, a statistician, Deming came up and introduced a statistically controlled management into the
Japanese ailing manufacturing sector. Statistical process
control (SPC) provided a way of determining when variations
exist in a process, thus triggering process intervention. In
Japan many manufacturing companies embraced the technique
of SPC with great success for tackling quality related problems,
thus allowing the country to become an influential force in
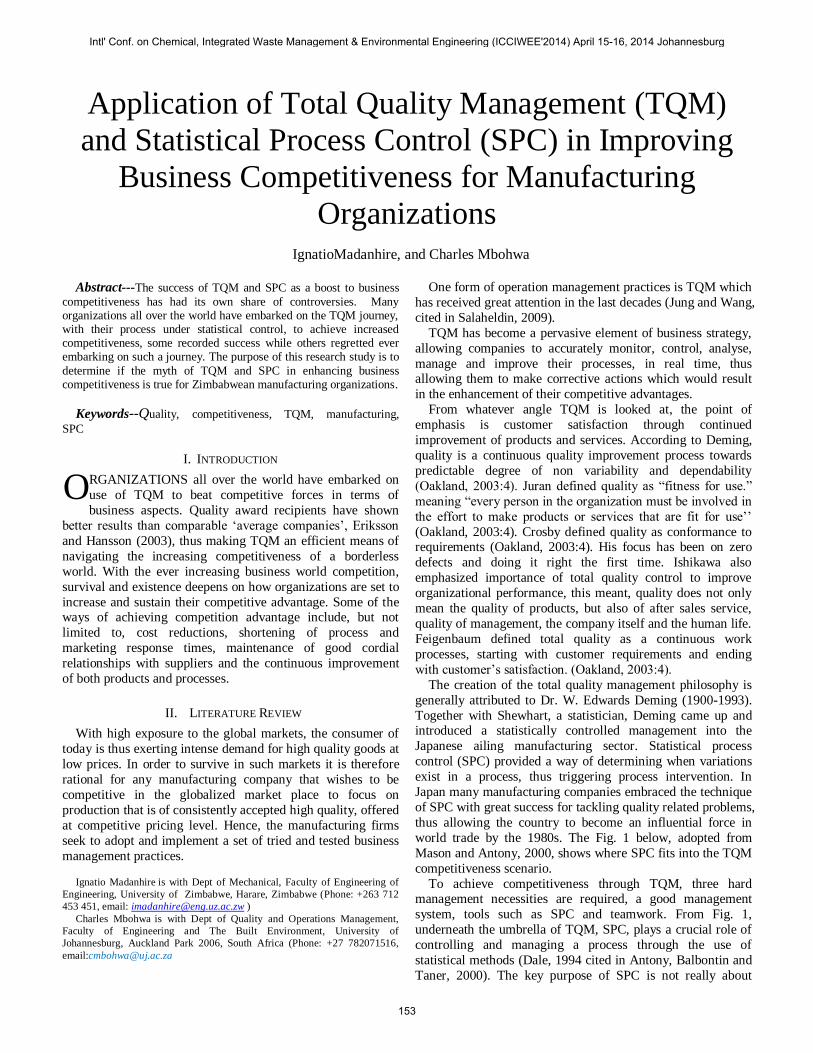
world trade by the 1980s. The Fig. 1 below, adopted from
Mason and Antony, 2000, shows where SPC fits into the TQM
competitiveness scenario.
To achieve competitiveness through TQM, three hard management necessities are required, a good management
system, tools such as SPC and teamwork. From Fig. 1,
underneath the umbrella of TQM, SPC, plays a crucial role of
controlling and managing a process through the use of
statistical methods (Dale, 1994 cited in Antony, Balbontin and
Taner, 2000). The key purpose of SPC is not really about
O
Intl' Conf. on Chemical, Integrated Waste Management & Environmental Engineering (ICCIWEE'2014) April 15-16, 2014 Johannesburg
153
statistics or control, it is about improving business
competiveness, by eliminating causes of process variation.
Fig. 1 SPC and TQM relationship to competitiveness
SPC is a strategy for reducing variability, the cause of most quality problems (Oakland 2003). SPC is a statistical
technique that is widely used to ensure that the process meet
standards (Heizer and Render, 2008:222). To be able to predict
performance and determine the process ability to meet
customer expectations, the process is first expected to be
brought into statistical control by detecting and eliminating assignable causes of variation. Process control is vital and SPC
should form a vital component part of a company-wide
adoption of „total quality‟ and act as the focal point of never-
ending improvement in business performance (Oakland
2003:16). Kanji (2002), says “it is difficult to measure the
performance of an organization, nevertheless it is crucial for an
organization‟‟. Kanji (2002) further pointed out that, “we must
measure, to be able to take the right actions‟‟. What is
important to an organization should be measured, with both
hard and soft measurements (Kanji, 2002:7). According to
Bourne, Neely, Mills and Platts (cited Franco-Santos,
Kennerly, Micheli, Martinez, Marr, Bernard, Gray and Neely 2007), BPM refers to the use of a multi-dimensional set of
performance measures for the planning and management of a
business”. Maisel (cited in Franco- Santos et al, 2007) stated
that a BPM system enables an enterprise to plan, measure, and
control its performance and helps ensure that business
activities are aligned with business strategies to achieve
desired business result. Traditionally business performance
measures have been derived from cost accounting information
often based on outdated and arbitrary principles (Oakland,
2004: 136). This had little motivation to support quality
management and, in some cases, actually inhibit continuous improvement because they are unable to map onto process
performance. BPM measures can be classified as financial or
non financial.
III. JUSTIFICATION OF STUDY
Locally based, Zimbabwe manufacturing entities continue to
face viability challenges and competition from cheap imports
finding their way into the country through porous borders (CZI
report, 2012). Business with better competitive strategies will live to see the next day. Few would argue that meeting both
increasing global competition and increased customer demand
have become extremely important challenges facing many
manufacturing companies. In an economy faced with high
liquidity constraints, lack of long term financing for industrial
recapitalization, deteriorating infrastructure, policy
inconsistence as well as uncertainty in the business
environment (CZI report, 2012). From the CZI report of 2012, the Zimbabwean
manufacturing sector has continued to face problems, and
among them is a high production cost emanating from lack of
export competitiveness on the international market. The low
drive in competitiveness has had a negative impact on capacity
utilization. The same report has indicated that failure to meet
quality requirements of international buyers, has been one
reason why some local manufacturing companies have failed
to prevail on the market.
IV. METHODOLOGY
The population of interest in this study was the
manufacturing companies, who had some TQM systems
running or those at an advanced stage of quality management
systems implementation. A sample of 15 firms, of various
sizes, was randomly selected from a total of 28 who were
meeting the criterion. The firms were drawn from five major
cities of the country. A manager familiar with TQM program
and six employees were surveyed in each firm. Primary data
was collected through mail using a questionnaire, a discrete five point-scale likert scale with end points of strongly
disagree (=1) and strongly agree (=5). Statistical secondary
data, as supplied by the sample companies was also used to
measure the effectiveness of TQM in achieving business
competitiveness for the organisations.
V. DATA ANALYSIS
For this research, data was analysed for trends and
conclusions were also made based on the analysis of numeric data, thus both inferential and descriptive statistics were used
in this research.
A. Data validity and reliability
The two major types of validity used in this research are,
content validity, and construct validity. Content validity was
subjectively judged by the researcher. To address content validity in this study, a thorough review of available TQM and
SPC literature together with business performance
measurement were conducted. Furthermore, the original
questionnaire was submitted to business and TQM experts to
get an expert opinion on the content of the questionnaire. The
construct validity describes how the investigation as an entity
can be generalized in an appropriate way. This study was
based on a theoretical framework that is built on well-known
TQM gurus, thus allowing the work to be generalized.
B. Results and discussion
Process Optimization
i) Production waste
Production waste analysis was done to ascertain how much
TQM can contribute to the reduction of production waste, and,
how much of raw materials is converted into the final product.
Intl' Conf. on Chemical, Integrated Waste Management & Environmental Engineering (ICCIWEE'2014) April 15-16, 2014 Johannesburg
154
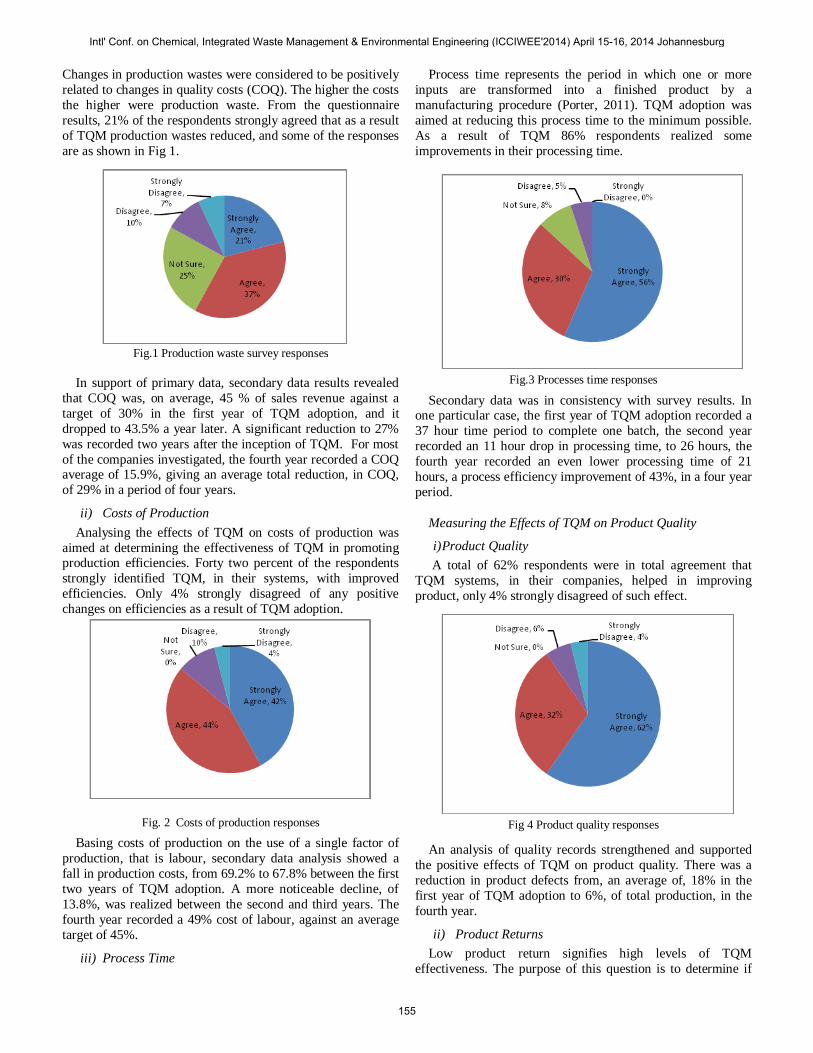
Changes in production wastes were considered to be positively
related to changes in quality costs (COQ). The higher the costs
the higher were production waste. From the questionnaire
results, 21% of the respondents strongly agreed that as a result
of TQM production wastes reduced, and some of the responses
are as shown in Fig 1.
Fig.1 Production waste survey responses
In support of primary data, secondary data results revealed
that COQ was, on average, 45 % of sales revenue against a
target of 30% in the first year of TQM adoption, and it
dropped to 43.5% a year later. A significant reduction to 27%
was recorded two years after the inception of TQM. For most
of the companies investigated, the fourth year recorded a COQ average of 15.9%, giving an average total reduction, in COQ,
of 29% in a period of four years.
ii) Costs of Production
Analysing the effects of TQM on costs of production was
aimed at determining the effectiveness of TQM in promoting production efficiencies. Forty two percent of the respondents
strongly identified TQM, in their systems, with improved
efficiencies. Only 4% strongly disagreed of any positive
changes on efficiencies as a result of TQM adoption.
Fig. 2 Costs of production responses
Basing costs of production on the use of a single factor of
production, that is labour, secondary data analysis showed a
fall in production costs, from 69.2% to 67.8% between the first
two years of TQM adoption. A more noticeable decline, of
13.8%, was realized between the second and third years. The
fourth year recorded a 49% cost of labour, against an average
target of 45%.
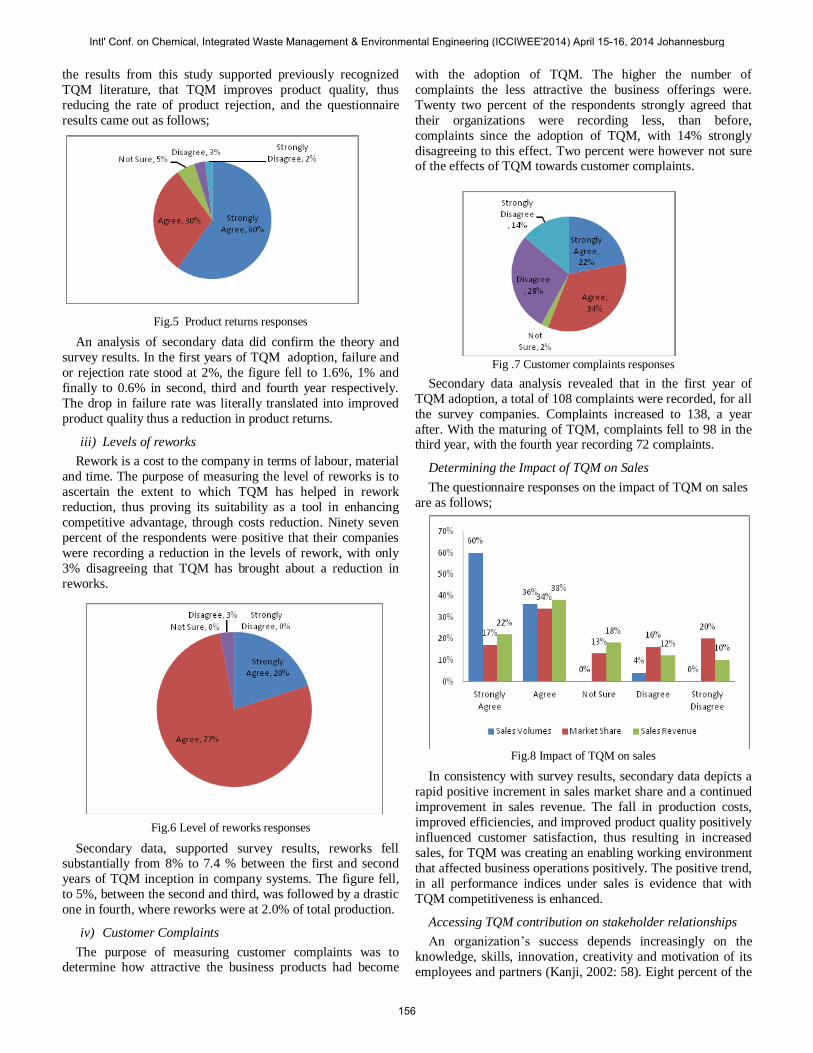
iii) Process Time
Process time represents the period in which one or more
inputs are transformed into a finished product by a
manufacturing procedure (Porter, 2011). TQM adoption was
aimed at reducing this process time to the minimum possible.
As a result of TQM 86% respondents realized some
improvements in their processing time.
Fig.3 Processes time responses
Secondary data was in consistency with survey results. In one particular case, the first year of TQM adoption recorded a
37 hour time period to complete one batch, the second year
recorded an 11 hour drop in processing time, to 26 hours, the
fourth year recorded an even lower processing time of 21
hours, a process efficiency improvement of 43%, in a four year
period.
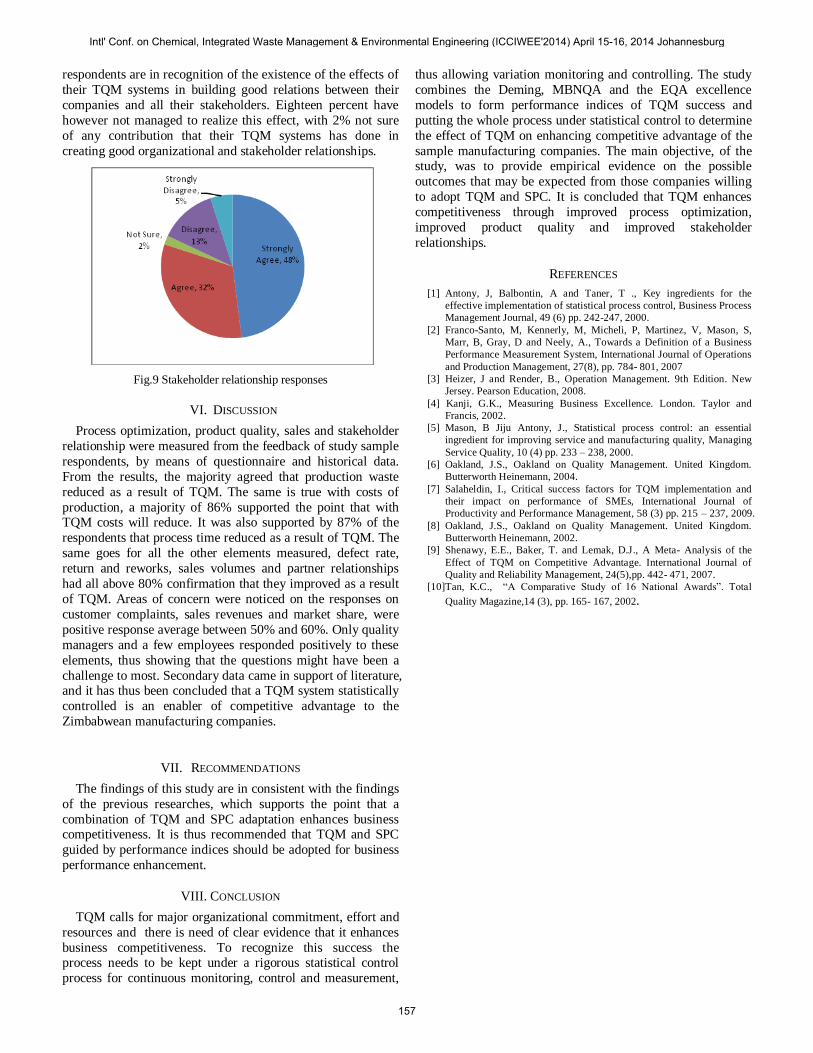
Measuring the Effects of TQM on Product Quality
i) Product Quality
A total of 62% respondents were in total agreement that
TQM systems, in their companies, helped in improving
product, only 4% strongly disagreed of such effect.
Fig 4 Product quality responses
An analysis of quality records strengthened and supported
the positive effects of TQM on product quality. There was a
reduction in product defects from, an average of, 18% in the
first year of TQM adoption to 6%, of total production, in the
fourth year.
ii) Product Returns
Low product return signifies high levels of TQM
effectiveness. The purpose of this question is to determine if
Intl' Conf. on Chemical, Integrated Waste Management & Environmental Engineering (ICCIWEE'2014) April 15-16, 2014 Johannesburg
155
the results from this study supported previously recognized
TQM literature, that TQM improves product quality, thus
reducing the rate of product rejection, and the questionnaire
results came out as follows;
Fig.5 Product returns responses
An analysis of secondary data did confirm the theory and
survey results. In the first years of TQM adoption, failure and
or rejection rate stood at 2%, the figure fell to 1.6%, 1% and
finally to 0.6% in second, third and fourth year respectively.
The drop in failure rate was literally translated into improved
product quality thus a reduction in product returns.
iii) Levels of reworks
Rework is a cost to the company in terms of labour, material
and time. The purpose of measuring the level of reworks is to
ascertain the extent to which TQM has helped in rework
reduction, thus proving its suitability as a tool in enhancing
competitive advantage, through costs reduction. Ninety seven
percent of the respondents were positive that their companies
were recording a reduction in the levels of rework, with only
3% disagreeing that TQM has brought about a reduction in
reworks.
Fig.6 Level of reworks responses
Secondary data, supported survey results, reworks fell substantially from 8% to 7.4 % between the first and second
years of TQM inception in company systems. The figure fell,
to 5%, between the second and third, was followed by a drastic
one in fourth, where reworks were at 2.0% of total production.
iv) Customer Complaints
The purpose of measuring customer complaints was to determine how attractive the business products had become
with the adoption of TQM. The higher the number of
complaints the less attractive the business offerings were.
Twenty two percent of the respondents strongly agreed that
their organizations were recording less, than before,
complaints since the adoption of TQM, with 14% strongly
disagreeing to this effect. Two percent were however not sure of the effects of TQM towards customer complaints.
Fig .7 Customer complaints responses
Secondary data analysis revealed that in the first year of
TQM adoption, a total of 108 complaints were recorded, for all
the survey companies. Complaints increased to 138, a year
after. With the maturing of TQM, complaints fell to 98 in the third year, with the fourth year recording 72 complaints.
Determining the Impact of TQM on Sales
The questionnaire responses on the impact of TQM on sales
are as follows;
Fig.8 Impact of TQM on sales
In consistency with survey results, secondary data depicts a
rapid positive increment in sales market share and a continued
improvement in sales revenue. The fall in production costs,
improved efficiencies, and improved product quality positively
influenced customer satisfaction, thus resulting in increased
sales, for TQM was creating an enabling working environment
that affected business operations positively. The positive trend,
in all performance indices under sales is evidence that with
TQM competitiveness is enhanced.
Accessing TQM contribution on stakeholder relationships
An organization‟s success depends increasingly on the
knowledge, skills, innovation, creativity and motivation of its
employees and partners (Kanji, 2002: 58). Eight percent of the
Intl' Conf. on Chemical, Integrated Waste Management & Environmental Engineering (ICCIWEE'2014) April 15-16, 2014 Johannesburg
156
respondents are in recognition of the existence of the effects of
their TQM systems in building good relations between their
companies and all their stakeholders. Eighteen percent have
however not managed to realize this effect, with 2% not sure
of any contribution that their TQM systems has done in
creating good organizational and stakeholder relationships.
Fig.9 Stakeholder relationship responses
VI. DISCUSSION
Process optimization, product quality, sales and stakeholder
relationship were measured from the feedback of study sample
respondents, by means of questionnaire and historical data.
From the results, the majority agreed that production waste
reduced as a result of TQM. The same is true with costs of
production, a majority of 86% supported the point that with TQM costs will reduce. It was also supported by 87% of the
respondents that process time reduced as a result of TQM. The
same goes for all the other elements measured, defect rate,
return and reworks, sales volumes and partner relationships
had all above 80% confirmation that they improved as a result
of TQM. Areas of concern were noticed on the responses on
customer complaints, sales revenues and market share, were
positive response average between 50% and 60%. Only quality
managers and a few employees responded positively to these
elements, thus showing that the questions might have been a
challenge to most. Secondary data came in support of literature, and it has thus been concluded that a TQM system statistically
controlled is an enabler of competitive advantage to the
Zimbabwean manufacturing companies.
VII. RECOMMENDATIONS
The findings of this study are in consistent with the findings
of the previous researches, which supports the point that a
combination of TQM and SPC adaptation enhances business competitiveness. It is thus recommended that TQM and SPC
guided by performance indices should be adopted for business
performance enhancement.
VIII. CONCLUSION
TQM calls for major organizational commitment, effort and
resources and there is need of clear evidence that it enhances
business competitiveness. To recognize this success the process needs to be kept under a rigorous statistical control
process for continuous monitoring, control and measurement,
thus allowing variation monitoring and controlling. The study
combines the Deming, MBNQA and the EQA excellence
models to form performance indices of TQM success and
putting the whole process under statistical control to determine
the effect of TQM on enhancing competitive advantage of the
sample manufacturing companies. The main objective, of the study, was to provide empirical evidence on the possible
outcomes that may be expected from those companies willing
to adopt TQM and SPC. It is concluded that TQM enhances
competitiveness through improved process optimization,
improved product quality and improved stakeholder
relationships.
REFERENCES
[1] Antony, J, Balbontin, A and Taner, T ., Key ingredients for the
effective implementation of statistical process control, Business Process
Management Journal, 49 (6) pp. 242-247, 2000.
[2] Franco-Santo, M, Kennerly, M, Micheli, P, Martinez, V, Mason, S,
Marr, B, Gray, D and Neely, A., Towards a Definition of a Business
Performance Measurement System, International Journal of Operations
and Production Management, 27(8), pp. 784- 801, 2007
[3] Heizer, J and Render, B., Operation Management. 9th Edition. New
Jersey. Pearson Education, 2008.
[4] Kanji, G.K., Measuring Business Excellence. London. Taylor and
Francis, 2002.
[5] Mason, B Jiju Antony, J., Statistical process control: an essential
ingredient for improving service and manufacturing quality, Managing
Service Quality, 10 (4) pp. 233 – 238, 2000.
[6] Oakland, J.S., Oakland on Quality Management. United Kingdom.
Butterworth Heinemann, 2004.
[7] Salaheldin, I., Critical success factors for TQM implementation and
their impact on performance of SMEs, International Journal of
Productivity and Performance Management, 58 (3) pp. 215 – 237, 2009.
[8] Oakland, J.S., Oakland on Quality Management. United Kingdom.
Butterworth Heinemann, 2002.
[9] Shenawy, E.E., Baker, T. and Lemak, D.J., A Meta- Analysis of the
Effect of TQM on Competitive Advantage. International Journal of
Quality and Reliability Management, 24(5),pp. 442- 471, 2007.
[10]Tan, K.C., “A Comparative Study of 16 National Awards”. Total
Quality Magazine,14 (3), pp. 165- 167, 2002.
Intl' Conf. on Chemical, Integrated Waste Management & Environmental Engineering (ICCIWEE'2014) April 15-16, 2014 Johannesburg
157


![Evaluation of Hypolipidemic Activity of Ionidium ...psrcentre.org/images/extraimages/20 314022.pdf · nations [2]. Since synthetic drugs are shown more side effects, clinical importance](https://img.pdfslide.us/doc/110x75/5fa58a62ce04ef74dd4bc0be/evaluation-of-hypolipidemic-activity-of-ionidium-314022pdf-nations-2-since.jpg)