Embed Size (px)
Citation preview

Application of the UVA Dependability Assessment Methodology to Digital
Reactor Protection Systems
June 22, 2010
For ORNL
Presented by:
Carl R. Elks
Center For Safety Critical Systems University of Virginia Department of ECE Charlottesville, VA.

Overview of the Methodology
Carl Elks

3 3
Current Situation: Digital I&C
• Issues
– New digital technologies and more complex applications are being introduced into the nuclear industry
– The new technologies can provide both operational improvement and increased reliability and safety, if implemented properly
• The advantages this new technology comes at a price.
• Significant challenges
– Increased complexity Impedes understanding
– Potentially new failure modes How do we Know them
– Fundamentally different behavior from analog system Continuous vs Discrete.
• Ever-increasing use of these new digital technologies and complex applications requires effective, objective, and repeatable review processes.
– Tools and methodologies needed for independently evaluating new applications.

Aim of the Methodology
• A means to validate and verify objectively the dependability attributes of a digital I&C system
– Support the estimation of quantitative metrics
– Support the evaluation of qualitative attributes
– Support modeling activities (PRA, Reliability, and
Safety)
• Rigorous in it’s foundation
• Strive for practicality and utility.
• Provide useful information to assessors, vendors, and
regulators concerning the safety and reliability attributes
of a digital I&C system.

Technical Goals of the Methodology
• Develop, Apply and improve a safety and reliability assessment methodology for digital and computer based I&C systems
– Consider the integrated hardware/software system
– Consider bus and network technology issues that may effect
safety
– Consider how different modeling methods can be accommodated.
• Develop modeling, simulation, and fault injection techniques that
support the assessment methodology
• Document the quantitative and qualitative results that can be
obtained through application of the assessment process, and provide
the technical basis upon which NRC can establish the regulatory
guidance.
• Develop tools that support the practical implementation of
the assessment methodology

6
Analytical
Models
System
Metrics
Worst Case
Estimates
Expert
Opinion
Analytical
Models
Physical
Prototypes
Simulation
Models
Critical
Parameters
Statistical
Models
Reliability, Safety,
Steady State Safety, etc.
Markov, Fault
Tree, simulation, Formal.
Coverage, Failure
Rates, Latencies, etc.
Estimated Parameters
Parameter Estimation
Functional View of the Methodology
Fault Injection Domain
Dependability Estimate
Revised parameters Target I&C Safety Level
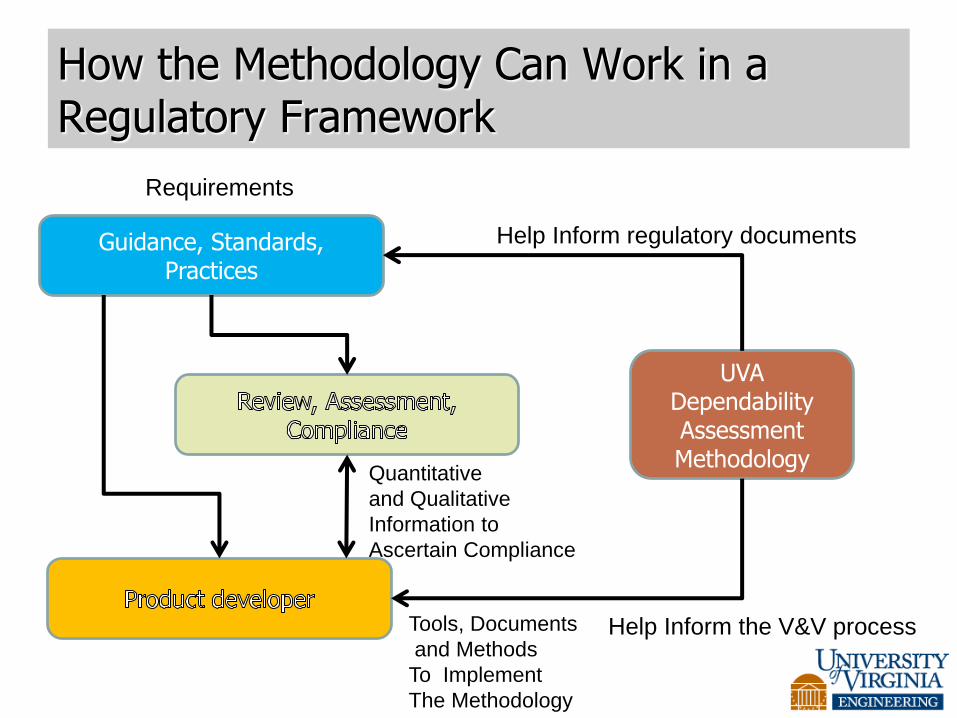
How the Methodology Can Work in a Regulatory Framework
Guidance, Standards, Practices
UVA Dependability Assessment Methodology
Requirements
Help Inform regulatory documents
Quantitative
and Qualitative
Information to
Ascertain Compliance
Tools, Documents
and Methods
To Implement
The Methodology
Help Inform the V&V process

Big Picture of the Fault Injection Process
location
Value
Sampling
Experiment 1( ai, i, li , ti, fmi)
List of Experiments
Sampled fault space
Experiment 2( ai, i, li , ti, fmi)
Experiment 3( ai, i, li , ti, fmi)
Experiment n( ai, i, li , ti, fmi)
R set: Event Space
Set of Covered
faults
Set uncovered
faults
Set of no-
response
faults
Fault Space
Statistical analysis
Coverage
Estimation

Fault Coverage Basics
• where C^ is the point estimate for the system fault coverage, and n is the number of fault injection experiment.
• From Equation 1 we can see that the estimation of fault coverage via fault injection is dependent on five parameters: – Fault type, Location, Time, Duration, and Workload profile
• These parameters are dependent experiment attributes of the fault injection process.
1
1ˆ ( , , , , )in
i i i i m
i
C y t l fn
The point estimate for the system fault coverage is obtained

11
Coverage Example in a Markov Model
Operational State
Failed detected State
Failed Undetected State
(1-C) C Safe States
Fault coverage, C , is the conditional probability that a system correctly
handles a fault, given that a fault has occurred.

Overview of the Benchmark Architecture Basic architectural principles. • A federated distributed fault tolerant system
– Channelized, symmetric, quasi asynchronous operation.
– Cyclic prioritized static real time scheduler OS.
– Safety functions utilize both application dependent and application independent fault tolerance features.
– Highly configurable for different applications.
• Channels are coupled by Profibus DP network.
– Event triggered, token passing network.
– Worst case bounded operation wrt token management.
– Non deterministic messaging service.
• Fault tolerance is achieved through several forms of redundancy and self monitoring.
• Fault containment and isolation is typically at the channel level

Platform Architecture

RPS Functional Diagram
Hot Leg Pressure
• Similar for other signals
• Last OR gate output sent to
Reactor trip alarm on one
CPU
14

Fault Injection Environment
• Uses LabVIEW 8.6 Development Tool
• Coordinates the following functions
• analog and digital data acquisition
• external system reset
• initiation of fault injection campaign
• signal-level corruption
• data logging and analysis
15

FIE Design Goals
09AE-0177

FIE Architecture
09AE-0177
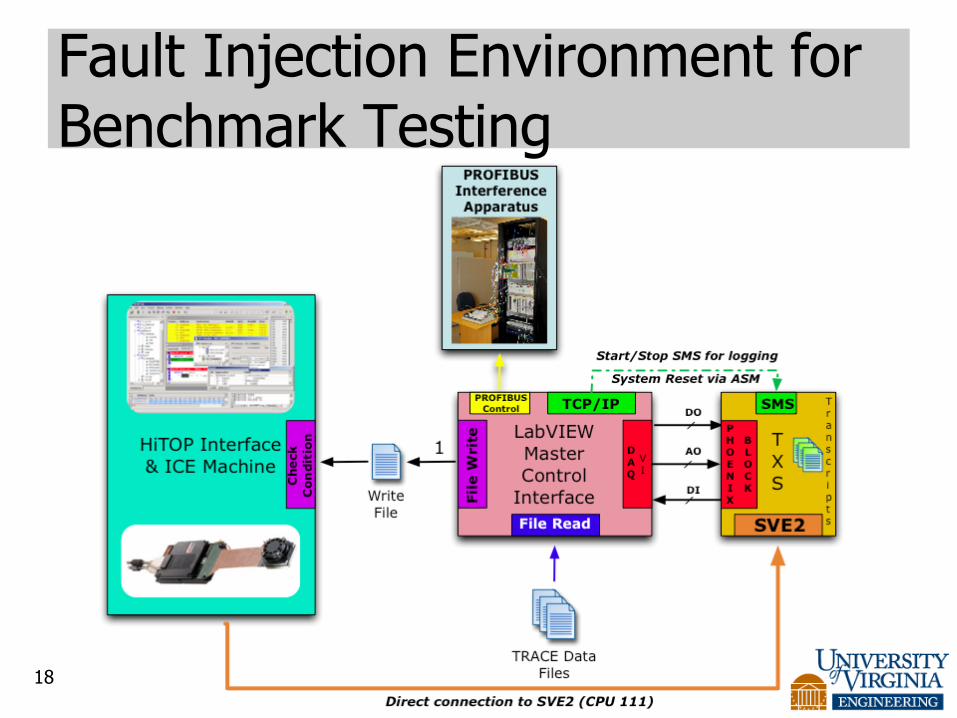
Fault Injection Environment for Benchmark Testing
18

19

Processor Fault Injection Analysis and Results.
Carl Elks and Nishant George
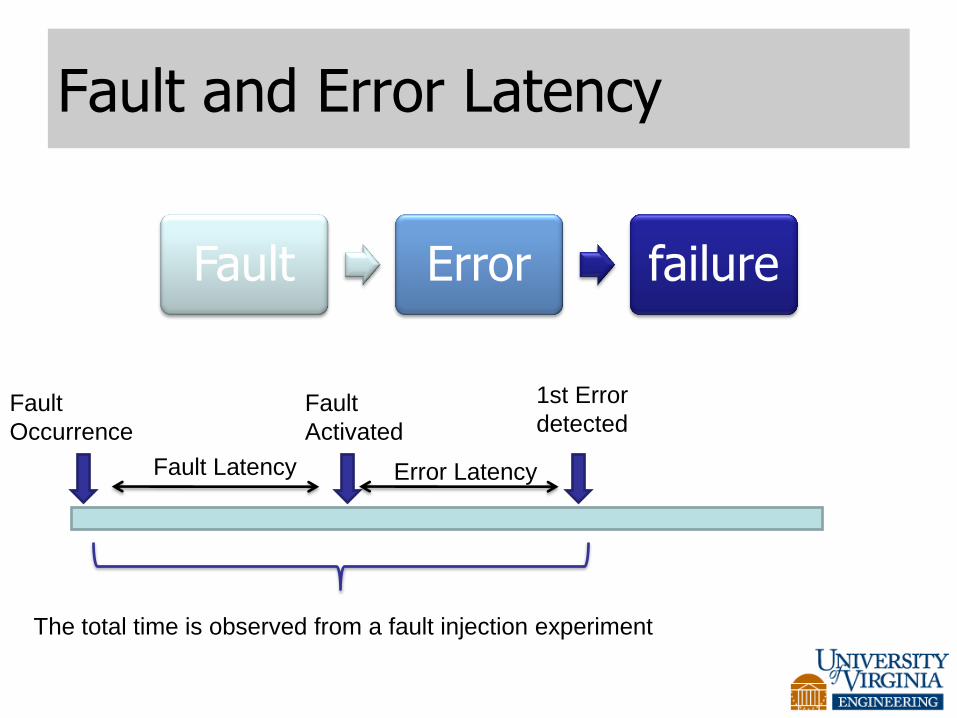
Fault and Error Latency
Fault Error failure
Fault
Occurrence
Fault
Activated
1st Error
detected
Fault Latency Error Latency
The total time is observed from a fault injection experiment

Nature of faults injected
• Faults injected into neighborhood of
possible alarm trip events
• Faults injected into
– Locations in app. map
– Locations from analyses LOCA Event

Smoothed Distribution, Latency of First Response
(Memory Fault Injections)
~Bimodal with mean = 597ms & 10.4s,
variance = 410ms & 240ms
0
50
100
150
200
250
300
350
400
450
500
0 2000 4000 6000 8000 10000 12000
Latency
Co
un
t

Smoothed Distribution, Latency of First Response
(Register Fault Injections)
mean = 1003ms, SD = 328ms, variance = 108ms
0
10
20
30
40
50
60
70
80
90
100
0 500 1000 1500 2000 2500 3000 3500
Latency
Co
un
t

Crash latency
-1000
1000
3000
5000
7000
9000
11000
13000
0 100 200 300 400 500
Late
ncy (
ms)
Injected Variables
Latency of CPU Crash
(time of earliest detection of CPU 111 crash as seen by
other CPUs)

Inconsistency of Error Detection
0
500
1000
1500
2000
2500
3000
CPU 122 CPU 123 CPU 124
Nu
mb
er o
f error m
essag
es m
issed
# Missed error messages from CPU 111 detected by atleast one other CPU
(out of 5280 experiments)

Coverage and Error Detection Latency Statistics for Processor Fault Injections
Location Point Estimate of C
Variance Of C
Confidence Bounds of C
Mean Error latency
Total fault Injections
No response faults
Memory .999697 9.1883x 10⁻⁸ .999102<C<1.0
Bimodal Mean with 597ms and 10.4 s.
5274 1975
Registers .9998 1.39 x 10⁻⁶ .9965 <C <1.0
1003 ms 14701 622
1- partial set of register fault injections.
Profibus Fault Injection and Results
Marko Miklo, Carl Elks, and Ron Williams

Fault Injection Approach
• Inject faults to induce specific failure modes – failure mode driven fault injection.
– Known faults that will cause Token to be corrupted and rejected by the receiving Master station
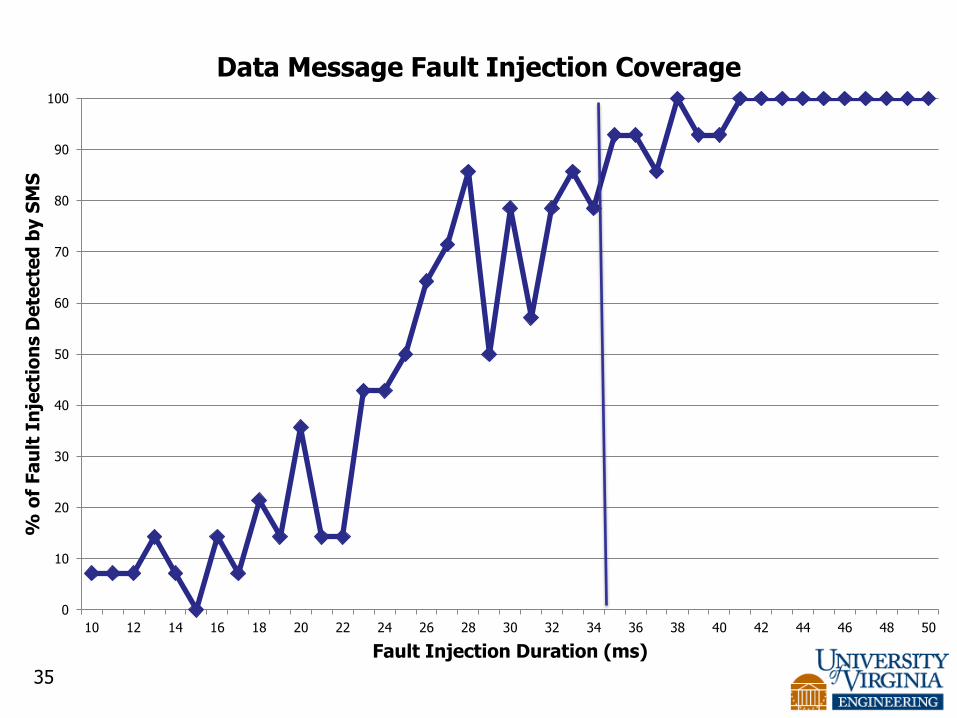
– Data Message fault injection increases the “Length” field of the message
• Preserves all the data, tricking the receiving controller
• Data passed to the next layer -> we don’t know what happens then
– Observe behavior and response of the network
– Measure the timeout after each Token loss
• These are the problems that we simulated in our fault injections
29

Covering Faults
• Fault/Error Model encompasses
– Misbehaving Profibus controller
– Faulty Profibus transceivers
– Faulty links
30

Profibus Fault Injection Functional Representation
31
Profibus
Receiver Logic
Analyzer
Observed Signal
Traffic Analysis Software
Custom Hardware
(FPGA)
Interference Circuit Corrupt
Custom logic detects received bit patterns in real time and generates control for timing and application of Profibus corruption
Corrupt

34
0
10
20
30
40
50
60
70
80
90
100
10 12 14 16 18 20 22 24 26 28 30 32 34 36 38 40 42 44 46 48 50
% o
f Fa
ult
In
jecti
on
s D
ete
cte
d b
y S
MS
Fault Injection Duration (ms)
Token Fault Injection Coverage
35
0
10
20
30
40
50
60
70
80
90
100
10 12 14 16 18 20 22 24 26 28 30 32 34 36 38 40 42 44 46 48 50
% o
f Fa
ult
In
jecti
on
s D
ete
cte
d b
y S
MS
Fault Injection Duration (ms)
Data Message Fault Injection Coverage
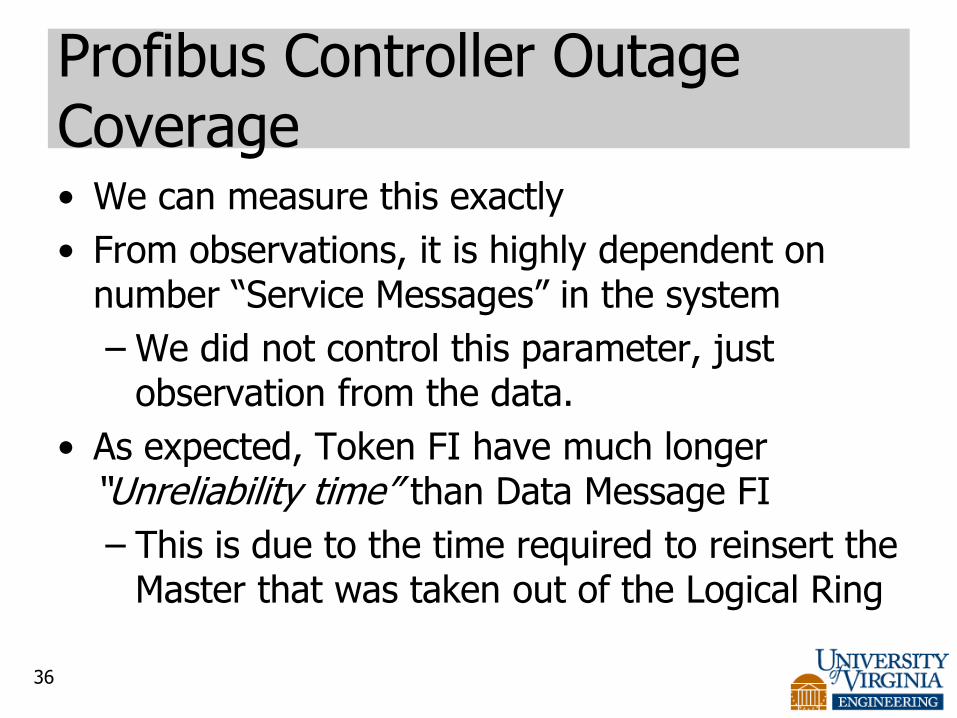
Profibus Controller Outage Coverage • We can measure this exactly
• From observations, it is highly dependent on number “Service Messages” in the system
– We did not control this parameter, just observation from the data.
• As expected, Token FI have much longer “Unreliability time” than Data Message FI
– This is due to the time required to reinsert the Master that was taken out of the Logical Ring
36

37
# Service Msgs Token FI (ms) Message FI (ms)
0 1,531.51 756.68
1 7,244.86 2,639.03
2 11,607.72 8,644.00
3 22,548.86 18,745.29
4 22,376.83 17,014.75
5 19,454.00 22,053.00
0
5,000
10,000
15,000
20,000
25,000
0 1 2 3 4 5
Un
reli
ab
le S
tate
Du
rati
on
(m
s)
Number of Service Messages
Token FI vs Message FI Outage Coverage
Token FI Message FI

Significant Findings to Date
• Methodology was successfully deployed.
• Methodology aided us (significantly) in understanding how the Benchmark fault tolerance and safety features work in real time.
• Fault injection campaigns produced results that were used to estimate critical parameters in the availability, reliability and safety models.
• Some of the results could not have been predicted or anticipated ahead of time with traditional testing. (results are still preliminary) – Bimodal error latency distribution
– Service message impact on profibus controller outage (still trying to figure why this is).
– Error perception inconsistencies
• Benchmark main fault tolerance features appear to be robust to the faults we injected into the system.
• A few bugs found in SPACE development tool.
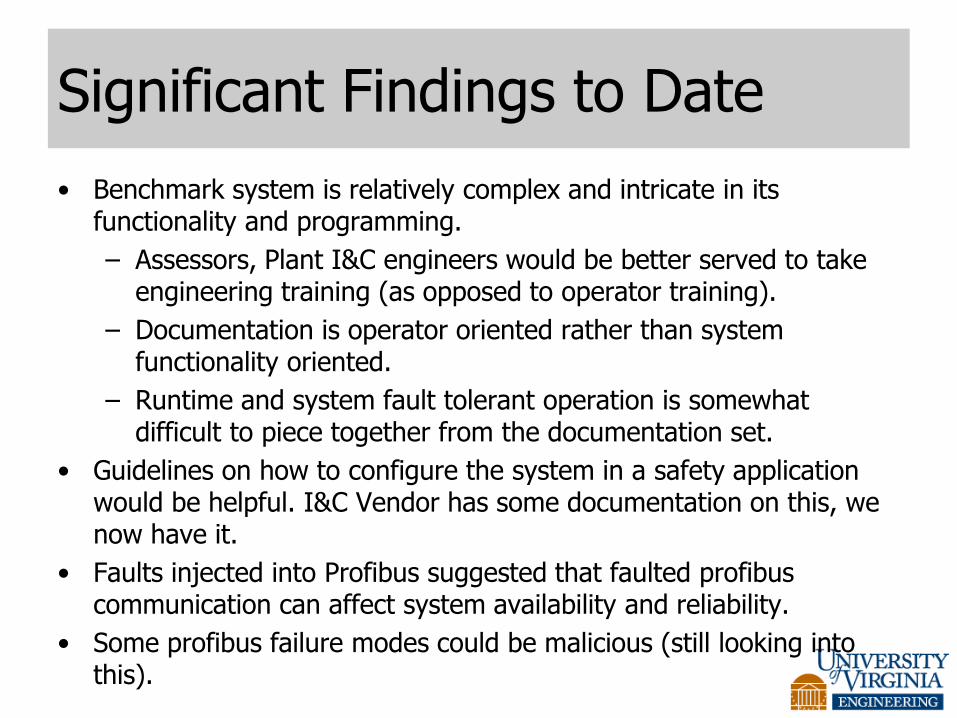
Significant Findings to Date
• Benchmark system is relatively complex and intricate in its functionality and programming.
– Assessors, Plant I&C engineers would be better served to take engineering training (as opposed to operator training).
– Documentation is operator oriented rather than system functionality oriented.
– Runtime and system fault tolerant operation is somewhat difficult to piece together from the documentation set.
• Guidelines on how to configure the system in a safety application would be helpful. I&C Vendor has some documentation on this, we now have it.
• Faults injected into Profibus suggested that faulted profibus communication can affect system availability and reliability.
• Some profibus failure modes could be malicious (still looking into this).
What’s next?
• Triconex system is on deck.
– A different system architecture, will stress the methodology in different ways.
• NUREG is top priority.
• Have I&C Vendor’s feedback on the preliminary testing results.
• Many lessons learned along the way.

Long term
• It’s clear that open source tools to enable both vendors and regulators to leverage the methodology are paramount.
– A set of tools to allow assessors and regulators to analyze, trend and access fault injection data from the vendors.
– A set of open-source tools to allow the vendors to implement and integrate the methodology into their testing and V&V processes.
• Invensys and I&C Vendor both seem to agree that this would be helpful.
• We are already moving toward a direction of “tool boxes” in our methodology.