Embed Size (px)
Citation preview

General rights Copyright and moral rights for the publications made accessible in the public portal are retained by the authors and/or other copyright owners and it is a condition of accessing publications that users recognise and abide by the legal requirements associated with these rights.
Users may download and print one copy of any publication from the public portal for the purpose of private study or research.
You may not further distribute the material or use it for any profit-making activity or commercial gain
You may freely distribute the URL identifying the publication in the public portal If you believe that this document breaches copyright please contact us providing details, and we will remove access to the work immediately and investigate your claim.
Downloaded from orbit.dtu.dk on: Dec 01, 2021
Application of the group contribution volume translated Peng-Robinson equation ofstate to new commercial refrigerant mixtures
Bell, I. H.; Welliquet, J.; Mondejar, M. E.; Bazyleva, A.; Quoilin, S.; Haglind, F.
Published in:International Journal of Refrigeration
Link to article, DOI:10.1016/j.ijrefrig.2019.04.014
Publication date:2019
Document VersionPeer reviewed version
Link back to DTU Orbit
Citation (APA):Bell, I. H., Welliquet, J., Mondejar, M. E., Bazyleva, A., Quoilin, S., & Haglind, F. (2019). Application of the groupcontribution volume translated Peng-Robinson equation of state to new commercial refrigerant mixtures.International Journal of Refrigeration, 103, 316-328. https://doi.org/10.1016/j.ijrefrig.2019.04.014

Accepted Manuscript
Application of the group contribution volume translatedPeng-Robinson equation of state to new commercial refrigerantmixtures
I.H. Bell, J. Welliquet, M.E. Mondejar, A. Bazyleva, S. Quoilin,F. Haglind
PII: S0140-7007(19)30170-7DOI: https://doi.org/10.1016/j.ijrefrig.2019.04.014Reference: JIJR 4362
To appear in: International Journal of Refrigeration
Received date: 17 December 2018Revised date: 15 April 2019Accepted date: 15 April 2019
Please cite this article as: I.H. Bell, J. Welliquet, M.E. Mondejar, A. Bazyleva, S. Quoilin, F. Haglind,Application of the group contribution volume translated Peng-Robinson equation of stateto new commercial refrigerant mixtures, International Journal of Refrigeration (2019), doi:https://doi.org/10.1016/j.ijrefrig.2019.04.014
This is a PDF file of an unedited manuscript that has been accepted for publication. As a serviceto our customers we are providing this early version of the manuscript. The manuscript will undergocopyediting, typesetting, and review of the resulting proof before it is published in its final form. Pleasenote that during the production process errors may be discovered which could affect the content, andall legal disclaimers that apply to the journal pertain.

ACCEPTED MANUSCRIPT
ACCEPTED MANUSCRIP
T
Application of the group contribution volume translated Peng-Robinsonequation of state to new commercial refrigerant mixturesI
I. H. Bella,∗, J. Welliquetb, M. E. Mondejarc, A. Bazylevaa, S. Quoilind, F. Haglindc
aApplied Chemicals and Materials Division, National Institute of Standards and Technology, Boulder, CO 80305, USAbEnergy Systems Research Unit, University of Liege, Liege, Belgium
cDepartment of Mechanical Engineering, Technical University of Denmark, Building 403, 2800 Kongens Lyngby, DenmarkdDepartment of Mechanical Engineering, KU Leuven, Geel. Kleinhoefstraat 4. 2440 Geel, Belgium
Abstract
This work evaluates the performance of the group contribution volume translated Peng-Robinson model whenpredicting the vapor-liquid equilibrium and single phase densities of 28 commercial refrigerant mixtures withlow global warming potential and zero ozone depletion potential. Cubic equations of state, and particularlythe Peng-Robinson equation of state, are widely used in the refrigeration industry due to their easy applica-bility for new substances, and their low computational time, although generally lower prediction accuraciesmust be expected compared to multiparameter equations of state. The group contribution volume translatedPeng-Robinson equation of state combines the Peng-Robinson equation of state with a new attraction term,improved mixing rules using a group contribution approach, and volume translation. The results are comparedwith the estimates obtained using the non translated Peng-Robinson equation of state, and a multiparameterequation of state.
Keywords: Cubic equation of state, Peng-Robinson, GC-VTPR, UNIFAC, refrigerant mixtures.
IContribution of the National Institute of Standards andTechnology, not subject to copyright in the US
∗Corresponding authorEmail addresses: [email protected] (I. H. Bell),
[email protected] (J. Welliquet),[email protected] (M. E. Mondejar),[email protected] (A. Bazyleva),[email protected] (S. Quoilin),[email protected] (F. Haglind)
Preprint submitted to International Journal of Refrigeration April 29, 2019

ACCEPTED MANUSCRIPT
ACCEPTED MANUSCRIP
T
1
NomenclatureSymbolsa attraction parameter, J m3 mol−2
b repulsion parameter, m3 mol−1
α temperature dependence of attraction termp pressure, PaT temperature, Kf fugacity, Pag molar Gibbs energy, J mol−1
v molar volume, m3 mol−1
ρ molar density, mol m−3
R ideal gas constant, 8.31446 J K−1 mol−1
µ chemical potential, J mol−1
ω acentric factorγ activity coefficientθ area fractionψ group interaction parameterφ segment fractionr molecular van der Waals volumeq molecular surface areax molar fractionSubscripts/Superscriptscorr correctedr reducedc critical pointEoS estimate of equation of stateexp experimental valuecalc calculated valueE excess propertyR residual propertyAbbreviationsRD relative deviationCOST cost functionEoS equation of statecEoS cubic equation of statePR Peng-RobinsonSRK Soave-Redlich-KwongHEOS Helmholtz-based multiparameter equation of stateGC-VTPR group contribution volume translated Peng-Robinson
2
2

ACCEPTED MANUSCRIPT
ACCEPTED MANUSCRIP
T
1. Introduction1
The current search for sustainable and environmentally-2
friendly refrigerants is driven by the recent approval3
of increasingly restrictive regulations that limit the4
use of substances with high global warming poten-5
tial (GWP), and the need to maintain high process6
efficiencies. In this context, mixtures containing new7
refrigerants with low GWP are of special importance,8
since their use offers new degrees of freedom that9
allow for the optimization of their composition to10
tune their properties. However, experimental data11
of the thermophysical properties of new refrigerants12
are scarce, and it is even scarcer for their mixtures.13
The lack of experimental data makes it unfeasible to14
develop complex multiparameter equations of state15
(EoSs) (such as those available in the state of the art16
thermophysical property library REFPROP (Lemmon17
et al., 2018)) and to ensure high accuracy of the pre-18
dictions. This fact introduces additional uncertainty19
in the prediction of the performance of new refriger-20
ants, and the evaluation of their prospects as future21
replacement refrigerants. In this context it is essen-22
tial to develop mixture models that, requiring little23
to no experimental data of the novel refrigerants, are24
able to estimate their thermophysical behavior with25
sufficient accuracy.26
Cubic equations of state (cEoS) have been widely27
used in the simulation of chemical industrial pro-28
cesses and in the oil extraction industry because they29
require only a very general knowledge of the fluid30
molecule and allow for fast computational times. Al-31
though it is well known that cEoS fail in the predic-32
tion of liquid densities, and near the critical point,33
as well as in the prediction of properties of polar34
substances, a number of new cEoS have been devel-35
oped in order to improve their accuracy for specific36
cases. However, when used for the estimation of37
mixture properties, cEoS require the use of mixing38
rules that contain parameters which are commonly39
fitted from experimental data for specific fluids. This40
can represent a problem when one or more of the41
mixture components is a relatively newly introduced42
substance for which there are minimal experimental43
measurements.44
In principle, there are two types of mixing rules45
for cEoS, which are the van der Waals mixing rules,46
and the excess Gibbs energy mixing rules. van der47
Waals mixing rules use the composition and mix-48
ing parameters, which are fitted to experimental data,49
to estimate the attractive and repulsive terms of the50
cEoS. The excess Gibbs energy mixing rules inte-51
grate activity coefficient models into the cEoS, thus52
allowing for an improved estimation of the vapor-53
liquid equilibrium properties, especially for polar flu-54
ids. In order to extend the use of either of these mix-55
ing models to new refrigerants, it is necessary to be56
able to predict the mixing parameters or the activ-57
ity coefficients based on a general knowledge of the58
molecule.59
The group contribution volume translated Peng60
Robinson equation of state (GC-VTPR EoS) was first61
proposed by Ahlers and Gmehling (2002a; 2002b)62
with the aim of developing a universal, simple and63
accurate way of estimating the thermophysical be-64
havior of both polar and non-polar fluids. In its orig-65
inal form, the GC-VTPR EoS combined the Twu-66
alpha function for the attraction term (Twu et al.,67
1995), the volume translation as proposed by Peneloux68
et al. (1982), and the modified UNIFAC model (Fre-69
denslund et al., 1975) for the mixing rule. In this70
way, a general method was introduced to express the71
interaction between the molecules in the mixture, based72
only on a functional group contribution approach.73
With this method, it was not necessary to fit the mix-74
ing parameter for each possible molecule pair of newly75
developed mixtures for which no experimental data76
was available. Moreover, the volume translation pro-77
vided a correction to the saturated liquid volume, which78
is one of the weaknesses of cubic EoS. A similar ap-79
proach was presented by Jaubert and Mutelet (2004),80
who presented the PPR78 EoS as a combination of81
the Peng-Robinson EoS with a group contribution82
method for the estimation of the mixing parameters83
using a van Laar type activity-coefficient model.84
A number of works have been published on the85
3

ACCEPTED MANUSCRIPT
ACCEPTED MANUSCRIP
T
use of the GC-VTPR EoS, most of them focused on1
the prediction of different mixtures of organic com-2
pounds (e.g. alkanes, alcohols, acids) (Schmid and3
Gmehling, 2016), showing good agreement with ex-4
perimental results. However, the ability of the GC-5
VTPR EoS to reproduce the properties of refrigerant6
mixtures, including new halogenated olefins, has not7
been studied so far. Only Qian et al. (2017) consid-8
ered refrigerants in their extension of the work of the9
PPR78 EoS to predict the mixing parameters of some10
HFOs blends. Nevertheless, not all the functional11
groups needed to define the refrigerants considered12
in this work were defined in Qian et al. (2017), and13
the considered mixing rule was the classical van der14
Waals rule.15
This work presents an assessment of the accuracy16
of the GC-VTPR EoS to predict the saturation prop-17
erties of a number of commercial refrigerant mix-18
tures with low GWP and zero ozone depletion poten-19
tial (ODP). The predictive capacity of the GC-VTPR20
EoS is analyzed over different pressure and temper-21
ature ranges, and is compared with that of the con-22
ventional Peng-Robinson equation of state (PR EoS),23
the translated Peng-Robinson equation of state (PR+24
EoS), and a multi-parameter Helmholtz-energy-explicit25
EoS (HEOS). The objectives of this work are:26
• To quantify the accuracy of the GC-VTPR EoS27
when predicting the saturated pressures and sat-28
urated liquid and vapor densities of the selected29
refrigerant mixtures.30
• To present the fitted values of the interaction31
parameters of the modified UNIFAC needed32
for the representation of a number of refriger-33
ants in the GC-VTPR model.34
• To provide the research and the industrial com-35
munity with an assessment on the suitability of36
GC-VTPR EoS for the study of new refriger-37
ant mixtures.38
• To describe in detail the algorithm used for fit-39
ting the interaction parameters.40
This work presents a number of novel contribu-41
tions. First, the ability of the GC-VTPR EoS to pre-42
dict the behavior of refrigerant mixtures containing43
the new low-GWP hydrofluoroolefins, dimethyl ether,44
hydrofluorocarbons, and hydrocarbons, was thoroughly45
evaluated. Second, the values of the group surface ar-46
eas of the UNIFAC model that were missing for spe-47
cific functional groups were fitted based on the com-48
plete dataset of available experimental data. Third,49
indications on the use of the GC-VTPR EoS for the50
studied mixtures, based on the analyzed relative de-51
viations of the predictions for the evaluated proper-52
ties, are given.53
The outline of this paper is as follows: in Sec-54
tion 2, the55
GC-VTPR EoS is introduced. In Section 3 the binary56
mixtures analyzed in this work are selected based on57
their importance for the industry. Section 4 explains58
the methods used to fit the parameters of the mixing59
model. Section 5 presents the results of the predic-60
tions of the GC-VTPR EoS for different properties,61
and selected mixtures. Concluding remarks are given62
in Section 6.63
2. Thermodynamic Modeling64
2.1. Cubic equations of state65
An EoS relates a number of thermodynamic vari-66
ables, defining the state of a substance so that any67
other thermodynamic property can be derived from68
it. A cEoS, normally expressed in a pressure-explicit69
form, gives the pressure of a fluid p as a function70
of the temperature T and molar volume v, and can71
be expressed as a polynomial of the third order in72
the molar volume. This type of equation is gener-73
ally referred to as p − v − T EoS and links the liquid74
and vapor phases with a single equation (Frey et al.,75
2007).76
The first cubic equation of state was developed by77
van der Waals (1873), and is expressed as follows:78
(p +
av2
)(v − b) = RT (1)
4

ACCEPTED MANUSCRIPT
ACCEPTED MANUSCRIP
T
where the a and b parameters are functions of the1
critical pressure and critical temperature of the fluid,2
and R is the ideal gas constant. The parameter a is3
called the attraction term, and b is the covolume (or4
effective molecular volume) as they account, respec-5
tively, for the attraction and repulsion forces between6
the molecules of the fluid. One of the main advan-7
tages of this EoS, which is shared by many other8
cEoS, is that only the knowledge of the critical tem-9
perature Tc and critical pressure pc are required to10
define the model; these properties are frequently tab-11
ulated in handbooks and databases for a large number12
of substances.13
Since the publication of this first cEoS, a number14
of modifications have been applied to the model in15
order to improve its prediction ability (Valderrama,16
2003; Wei and Sadus, 2000; Lopez-Echeverry et al.,17
2017). Most of these improvements modify the at-18
traction term a and the repulsion term b and express19
them as functions of other variables. One of the most20
important modifications consists of the addition of a21
temperature dependent function to the attractive term,22
the so-called alpha function. In this way, the pa-23
rameter a is generally expressed as a constant part24
ac (a function only of tabulated critical parameters25
of the fluid) multiplied by a temperature dependent26
term α(Tr), where Tr is the reduced temperature Tr =27
T/Tc. Examples of equations applying a temperature-28
dependent attraction term are the Soave-Redlich-Kwong29
(SRK) EoS (Soave, 1972), and the Peng-Robinson30
(PR) EoS (Peng and Robinson, 1976).31
2.1.1. Peng-Robinson equation of state32
As described in Poling et al. (2001), the fam-33
ily tree of cEoS can be cast into a common struc-34
ture, where the different modifications of the attrac-35
tion term are tabulated with adjustable parameters.36
Bell and Jager (2016) carried out a similar exercise,37
for the SRK EoS, PR EoS, and the van der Waals38
EoS, with the aim of expressing the analytic deriva-39
tives of these EoS in a form compatible with the multi-40
parameter Helmholtz-energy-explicit EoS. In this frame-41
work, the cEoS is expressed in the following form:42
p =RT
v − b− a(T )
(v + ∆1b)(v + ∆2b)(2)
where ∆1 and ∆2 are different for each EoS, being43
∆1 = 1 +√
2 and ∆2 = 1 − √2 for the PR EoS.44
The PR EoS is a modification of the SRK EoS that45
allows for better predictions of molar volumes in the46
liquid region and a better representation of the vapor-47
liquid equilibrium for many mixtures (Valderrama,48
2003). These features have made the PR EoS into49
one of the most used cEoS today. Although other50
cEoS have been developed, none has demonstrated a51
clear general advantage in thermodynamic property52
predictions (Frey et al., 2007).53
The PR EoS for a pure fluid, expressed explicitly54
in terms of pressure, has the following form:55
p =RT
v − b− acα(Tr, ω)
v(v + b) + b(v − b)(3)
where the parameters are expressed as follows:56
ac = 0.45724
(R2T 2
c
pc
)(4)
b = 0.07780
(RTc
pc
)(5)
α(Tr, ω) =[1 + m(ω)
(1 −
√Tr
)]2(6)
where the term m is a function of the acentric factorand is given as follows (for ω ≤ 0.491):
m(ω) = 0.37464 + 1.54226ω − 0.26992ω2. (7)
For ω > 0.491, the alternative form in Peng and57
Robinson (1976) is recommended.58
The parameters ac and b as defined here are fluid59
dependent. In the case of fluid mixtures, a mixing60
rule is necessary. See the work by Valderrama (2003)61
for a list of common mixing rules. The classical mix-62
ing rule is that of van der Waals, which can be aug-63
mented by one (ki j) or two (ki j and li j) adjustable pa-64
rameters. These parameters need to be fitted to ex-65
perimental data for each fluid pair. In the scope of66
this work, the van der Waals mixing rule without ad-67
5

ACCEPTED MANUSCRIPT
ACCEPTED MANUSCRIP
T
justable parameters (equivalent to ki j = 0 and li j = 0)1
is used for the Peng-Robinson (PR) model:2
ac =∑
i
∑
j
xix jai j; ai j =√
ac,iac, j (8)
b =∑
i
∑
j
xix jbi j; bi j =bi + b j
2(9)
2.2. Volume translation3
As mentioned in the previous section, cEoS gen-4
erally yield poor predictions of liquid phase densi-5
ties. For instance, the conventional PR EoS yields6
errors of more than 17% in the prediction of the den-7
sity of ordinary water at 298 K and 1 bar. A standard8
approach to address this problem is to apply a correc-9
tion to the liquid volume, which has nearly no impact10
on the gas region volumes.11
The correction (or translation) term c, which is12
applied as in vcorr = vEoS + c equals the difference be-13
tween the predicted and experimental saturated liq-14
uid molar volumes at the reduced temperature Tr =15
0.7 (Schmid and Gmehling, 2012) as:16
c =(vexp − vcEoS
)∣∣∣∣Tr=0.7
. (10)
Based on this term, the volume translated Peng-17
Robinson equation of state (PR+ EoS) can be rewrit-18
ten as:19
p =RT
v + c − b− acα(Tr, ω)
(v + c)(v + c + b) + b(v + c − b).
(11)This approach yields good results, although tem-20
perature dependent volume translations could also be21
used in order to enhance the accuracy near the criti-22
cal point, or for specific fluids (Ji and Lempe, 1997).23
The work of Jaubert et al. (2016) and Privat et al.24
(2016) investigates the impact of volume translation25
on the other thermodynamic properties that can be26
obtained from an equation of state.27
2.3. The group contribution volume translated Peng-28
Robinson equation of state29
The modification of the PR EoS proposed by Ahlers30
and Gmehling(2002a; 2002b) consists of a combi-31
nation of several of the above mentioned improve-32
ments, with the aim of developing a universal, ac-33
curate model for the prediction of thermophysical34
properties of fluids. This modification is, in fact a35
group contribution volume translated version of the36
PR EoS, and will be referred to as GC-VTPR EoS in37
this manuscript for simplicity.38
As explained in the previous section, this new39
EoS applies a constant translation to the molar vol-40
ume to improve the accuracy of the predictions in the41
liquid region. Moreover, the attraction term used is42
the one presented by Twu et al. (1991), which is ex-43
pressed as follows:44
α(Tr, ω) = T N(M−1)r exp
[L(1 − Tr
MN)], (12)
where the parameters L,M and N have to be fit45
experimentally for each pure substance. The values46
of these parameters for the fluids considered in this47
work can be found in Appendix A. Although the48
use of the Mathias-Copeman alpha function (Math-49
ias and Copeman, 1983) could be also a possibility,50
the consistency checks of Le Guennec et al. (2016a)51
suggest that the Twu alpha function should be pre-52
ferred.53
Finally, the group contribution part of the EoS54
comes from the use of the UNIFAC group contribu-55
tion method to predict the activity coefficients of the56
excess Gibbs energy mixing rule. In this sense, while57
a simple arithmetic mixing rule is used for the covol-58
ume b, as shown in Eqs. 13 and 14, a mixing rule,59
which is based on the Gibbs energy, is used for the at-60
tractive term a as in Eq. (15) (Schmid and Gmehling,61
2012; Chen et al., 2002):62
b =∑
i
∑
j
xix jbi j (13)
6

ACCEPTED MANUSCRIPT
ACCEPTED MANUSCRIP
T
bi j =
b
34ii + b
34j j
2
43
(14)
a(Tr, ω) = b∑
i
xiaii
bii+
gE,R
−0.53087 J mol−1. (15)
The prediction of the residual part of the Gibbs1
energy gE,R by a group contribution approach will be2
further discussed in detail in the next section. To con-3
clude, the mixing rule used for the volume translation4
parameter c is given as follows:5
c =∑
i
xici. (16)
2.3.1. The Universal Quasichemical Functional Group6
Activity Coefficients7
The residual part of the excess Gibbs energy from8
Eq. (15) is defined through the activity coefficients as9
follows:10
gE,R = RT∑
i
xi ln γRi , (17)
Here gE,R represents the excess molar Gibbs en-11
ergy and γRi is the residual part of the activity coeffi-12
cient of component i. The universal functional activ-13
ity coefficient (UNIFAC) is a semiempirical method14
that predicts activity coefficients of fluids, based on15
their molecular structure, by using contributions for16
each of the interactions between pairs of structural17
groups in non-electrolyte systems, which are fitted to18
experimental data (Poling et al., 2001). The UNIFAC19
group contribution model was develop to predict the20
vapor-liquid equilibrium of mixtures, by consider-21
ing them as mixtures of structural groups, instead22
of mixtures of components. This approach lead to23
a general formulation that allowed the estimation of24
the vapor-liquid equilibrium of most of the systems25
of commercial interest.26
The value of the activity coefficient of a given27
component in a mixture can be decomposed into a28
combinatorial and a residual part as in Eq. 18 (Poling29
et al., 2001):30
ln γi = ln γCi + ln γR
i (18)
The combinatorial part is defined as:31
ln γCi = ln
φi
xi+
z2
qi lnθi
φi+ li − φi
xi
∑
j
x jl j (19)
li =z2
(ri − qi) − (ri − 1) . (20)
Here xi is the molar fraction of the component32
i, z refers to the coordination number (usually equal33
to 10), φi is the segment fraction, θi is the area frac-34
tion, ri is the molecular van der Waals volume, and35
qi is the molecular surface area. Each of the last four36
variables are defined as follows:37
θi =qixi∑j q jx j
(21)38
φi =rixi∑j r jx j
(22)39
ri =∑
k
v(i)k Rk (23)40
qi =∑
k
v(i)k Qk, (24)41
where v(i)k is the number of groups of type k in42
molecule i. The van der Waals volume Rk and surface43
area Qk are tabulated for a wide range of structural44
groups in Poling et al. (2001, Table 8.23).45
The residual part of the activity coefficient is ex-46
pressed as:47
ln γRi =
∑
k
v(i)k
(ln Γk − ln Γ
(i)k
)(25)
where Γk is the residual activity coefficient of group48
k, and Γ(i)k is the pure fluid group residual activity co-49
efficient of group k (the residual activity coefficient50
of group k in a reference solution containing only51
molecules of type i). These residuals can be obtained52
from Eq. (28), as:53
7
ACCEPTED MANUSCRIPT
ACCEPTED MANUSCRIP
T
ln Γk = Qk
1 − ln
∑
m
θmψmk
−∑
m
θmψmk∑n θnψnm
(26)
θm =QmXm∑n QnXn
(27)
ψmn = exp
(−amn + bmnT + cmnT 2
T
), (28)
Here θm is the area fraction of group m, ψmn is the1
group interaction parameter, Xm is the mole fraction2
of the group m in the mixture, and amn, bmn and cmn3
are group interaction parameters obtained by fitting4
experimental data and are tabulated in databases.5
3. Selected mixtures6
The Air-Conditioning, Heating, and Refrigera-7
tion Institute (AHRI) has recently identified a num-8
ber of mixtures of hydrofluorocarbons (HFCs) and9
hydrofluoroolefins (HFO) to replace the HFCs with10
high GWP that are currently in use (e.g., R-134a,11
R-404A, R-410A 1). These proposed mixtures con-12
tain at least two of the following pure refrigerants:13
R-32, R-125, R-134a, R-152a, R-1234yf, n-butane,14
isobutane, and dimethyl ether. Following this recom-15
mendation, several commercial mixtures containing16
these components are available in the market (Mota-17
Babiloni et al., 2015):18
• R-134a + R-1234yf: D-4Y, XP-1019
• R-32 + R-1234yf: D2Y60, DR-520
Several commercial refrigerant families such as R-21
407 (R-32/R-125/R-134a), R-417 (R-125/R-134a/n-22
butane), R-422 (R-125/R-134a/isobutane), and R-45123
(R-1234yf/R-134a) are relevant for refrigeration and24
heat pump applications. Moreover, the use of hydro-25
carbons as refrigerants is regaining interest as they26
comply with the recent environmental regulations on27
1The refrigerant nomenclature used in this work corre-sponds to the ASHRAE 34 standard (ASHRAE, 2016); the ISO817 standard ISO 817:2014 (en) is substantially similar.
GWP, while having a low cost, though they do in-28
troduce some flammability concerns. The flammable29
compound dimethyl ether (DME) has also been pro-30
posed as an alternative refrigerant given its good heat31
transfer properties, high availability and low GWP32
(Ben Adamson and Airah, 1998).33
In this work, we selected a set of binary mix-34
tures for the evaluation of the performance of the35
GC-VTPR EoS based on the aforementioned recom-36
mendations, and on the availability of experimental37
data. The selected mixtures are summarized in Ta-38
ble 1, and comprise a set of binary mixtures contain-39
ing the above mentioned components, with variable40
compositions.41
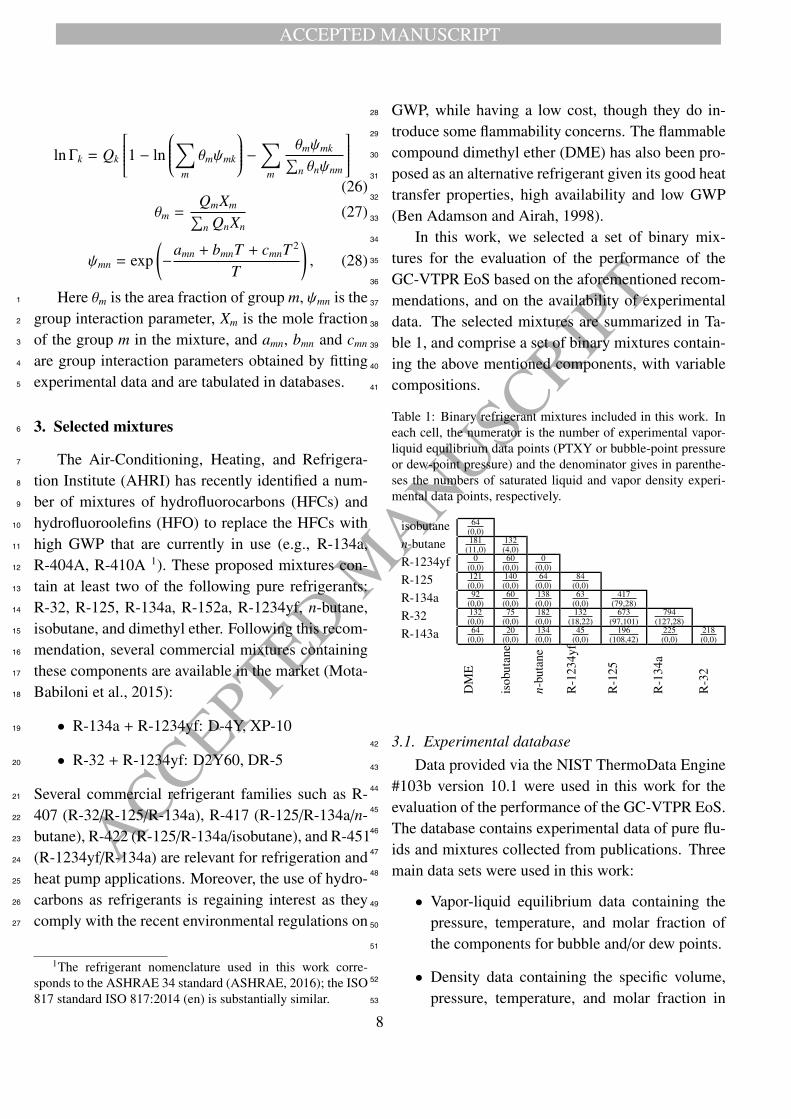
Table 1: Binary refrigerant mixtures included in this work. Ineach cell, the numerator is the number of experimental vapor-liquid equilibrium data points (PTXY or bubble-point pressureor dew-point pressure) and the denominator gives in parenthe-ses the numbers of saturated liquid and vapor density experi-mental data points, respectively.
isobutane 64(0,0)
n-butane 181(11,0)
132(4,0)
R-1234yf 0(0,0)
60(0,0)
0(0,0)
R-125 121(0,0)
140(0,0)
64(0,0)
84(0,0)
R-134a 92(0,0)
60(0,0)
138(0,0)
63(0,0)
417(79,28)
R-32 132(0,0)
75(0,0)
182(0,0)
132(18,22)
673(97,101)
794(127,28)
R-143a 64(0,0)
20(0,0)
134(0,0)
45(0,0)
196(108,42)
225(0,0)
218(0,0)
DM
E
isob
utan
e
n-bu
tane
R-1
234y
f
R-1
25
R-1
34a
R-3
2
3.1. Experimental database42
Data provided via the NIST ThermoData Engine43
#103b version 10.1 were used in this work for the44
evaluation of the performance of the GC-VTPR EoS.45
The database contains experimental data of pure flu-46
ids and mixtures collected from publications. Three47
main data sets were used in this work:48
• Vapor-liquid equilibrium data containing the49
pressure, temperature, and molar fraction of50
the components for bubble and/or dew points.51
• Density data containing the specific volume,52
pressure, temperature, and molar fraction in53
8

ACCEPTED MANUSCRIPT
ACCEPTED MANUSCRIP
T
the liquid and/or gas phase, as well as for bub-1
ble and/or dew points.2
• Pure fluid saturated liquid density data, for the3
computation of the volume translation term c4
of Eq. (16).5
4. Parameter fitting for the GC-VTPR EoS6
In order to estimate the activity coefficients for7
each selected mixture according to Eqs. (18) to (28),8
it is first necessary to decompose each of the com-9
ponents into structural groups that are covered by10
the database of group parameters. In this work, the11
group decomposition was inspired by the groups de-12
fined by Gmehling (1985), for which the revised and13
updated UNIFAC parameters are available. The re-14
frigerant R-32 could not be decomposed through the15
use of the available groups, and was therefore given16
its own group. The group decompositions of the con-17
sidered fluids are described in Table 2, and once spec-18
ified, were not changed.19
The group normalized surface area Qk for each20
of the k groups can in theory be calculated by ab21
initio approaches in which an isosurface of the elec-22
tron density distribution is used to define the surface23
area of a group. This exercise only yields approx-24
imate values for the surface area of a group due to25
the impact of the intramolecular group-group inter-26
actions. Nonetheless, the surface areas obtained by27
this method are theoretically based, and as such, are28
constrained to yield a self-consistent formulation for29
the group surface areas. In our study we obtained30
initial guesses for the group surface area from the31
group surface areas given in Poling et al.(2001). The32
values we used are in Table 3. For the groups that33
are not in Poling et al. ( – HCF2, – CFH2, CF2H2,34
and – CF=CH2), the group surface areas were cal-35
culated by an additive scheme as detailed in the sup-36
plemental material that was based on the numerical37
values of group surface areas of Bondi (1968). This38
method provides the values of the van der Waals sur-39
face areas of the groups in cm2/mol, which are con-40
verted to normalized surface areas Qk by dividing by41
Table 2: Molecules and secondary group decomposition of thecomponents of the studied mixtures, derived from the groupdecompositions of Gmehling (1985). The group indices corre-spond to the subgroup indices sgi and are defined in Table 3.
Component Formula Molecule Secondary groups∑
i
counti · sgii
n-butane C4H10 C C C C H
H
H
H
H
H
H
H
H
H 2 · (1) + 2 · (2)
isobutane C4H10 C
CH
HH
CH
HH
C
HH
H
H
3 · (1) + 1 · (3)
R-143a C2F3H3 C C H
H
H
F
F
F 1 · (4) + 1 · (1)
R-125 C2F5H C C H
F
F
F
F
F 1 · (4) + 1 · (5)
R-134a C2F4H2 C C H
F
H
F
F
F 1 · (4) + 1 · (6)
R-1234yf C3F4H2 CC
F
C
H
HF
FF
1 · (4) + 1 · (8)
R-32 CF2H2 C H
F
H
F 1 · (7)
DME C2H6O C
H
H
H O C H
H
H
1 · (1) + 1 · (9)
9

ACCEPTED MANUSCRIPT
ACCEPTED MANUSCRIP
T
the surface area of a standard segment (a methylene1
group in polymethylene) given as 2.5×109 cm2/mol2
(Abrams and Prausnitz, 1975, Appendix B). Previous3
works (Schmid and Gmehling, 2012, 2016; Schmid4
et al., 2014) suggest that the best approach to de-5
termine the group surface areas is empirical fitting,6
but we did not follow that recommendation because7
some of the Qk values obtained with empirical fitting8
can be non-physical if not properly constrained.9
4.1. Fitting algorithm10
In the fitting campaign, only vapor-liquid equi-librium data for which the composition of both of theco-existing phases were known were considered. Forphases in equilibrium, the chemical potential of allcomponents in all phases must be equal. The equal-ity of chemical potentials can be expressed as:
µ′i(T, p, ~x′) = µ′′i (T, p, ~x′′), (29)
where µ′i and µ′′i are the chemical potentials of speciesi in the saturated liquid and vapor, respectively, and~x′ and ~x′′ are the compositions of the liquid and va-por phases, respectively. This equality can be shown(Kunz et al., 2007, pp. 58-59) to be equal to theequality of fugacity coefficients times their respec-tive mole fraction, as:
x′iϕ′i(T, p, ~x′) = x′′i ϕ
′′i (T, p, ~x′′) (30)
which is equivalent (from fi = xi pϕi) to the fugacitiesof all components in all phases being equal, as:
f ′i (T, p, ~x′) = f ′′i (T, p, ~x′′). (31)
The goal of the optimizer is then to best satisfythe phase equilibrium conditions for all of the exper-imental data points by adjusting the group surfaceareas and interaction parameters. For the k-th exper-imental data point, we have the expense contribution
as follows:
e2k =
1∑
i=0
[lnϕ′i(T, p, ~x′) − lnϕ′′i (T, p, ~x′′) − ln
(~x′′i~x′i
)]2
.
(32)The cost function to be minimized by modifying thegroup-group interaction parameters is the summationof the weighted expense contributions as:
COST(~ai j, ~a ji) =∑
k
wkek (33)
The optimization of the adjustable parameters is11
carried out as a global optimization problem. The12
research domain of global optimization is vast, span-13
ning several fields of study. Our experiments showed14
that the quality of the parameter values obtained is15
quite sensitive to the precise method of optimization16
employed. After experimenting with several opti-17
mization approaches, we settled on the use of dif-18
ferential evolution (Storn and Price, 1997), one of19
the global optimization techniques that has found the20
broadest application. This stochastic optimization21
methodology can be readily understood and imple-22
mented in only a handful of lines of code. In dif-23
ferential evolution, the initial domains of each of the24
adjustable parameters must be specified. The bounds25
on the interaction parameters ai j and a ji were set to26
[-1000,1000] for each variable. The parameters bi j,27
b ji, ci j, and c ji were not fit because doing so dramat-28
ically increased the challenge of the optimization,29
without a straightforward uniform improvement of30
the model. The weights on the data sets were de-31
termined to balance the weight per binary pair; per-32
binary-pair weights were set such that each binary33
pair contributed to the cost function and systems with34
extensive data (e.g., R-32 + R-125) did not totally35
dominate the cost function. Table B.5 in Appendix B36
collects the values of the interaction parameters amn37
of Eq. (28).38
xx.39
10

ACCEPTED MANUSCRIPT
ACCEPTED MANUSCRIP
T
Table 3: Group surface areas for each group. The values innormal font were directly obtained from Poling et al. (2001)and the values in bold font were obtained from the additivescheme detailed in the supplemental material based on the workof Bondi (1968).
Group number UNIFACMain Subgroup Formula Q [-]
1 – CH3 0.8481 2 – CH2 – 0.540
3 – CH< 0.228
4 – CF3 1.3802 5 – HCF2 1.108
6 – CFH2 0.980
3 7 CF2H2 1.420
4 8 – CF=CH2 1.428
5 9 – OCH3 1.088
5. Results1
In this section, the performance of the GC-VTPR2
EoS is compared to experimental data and to other3
equations of state. These comparison EoS are the ref-4
erence multi-fluid equation of state, as implemented5
in NIST REFPROP (Lemmon et al., 2018) library6
and the Peng-Robinson EoS without volume transla-7
tion. For the PR EoS, the implementation of Cool-8
Prop (Bell et al., 2014) is used. This analysis al-9
lows for a comparison of the performance of the GC-10
VTPR EoS with that of the most accurate mixture11
models available in the literature. The comparison12
presented in this section is performed in terms of rel-13
ative deviations from the experimental data. The per-14
centage relative deviation of an EoS prediction of a15
parameter χ with respect to the experimental value is16
defined as follows:17
RD = 100 ×(χcalc − χexp
χexp
)(34)
The results in this section begin with a discus-18
sion of the fidelity of the model to the experimental19
vapor-liquid equilibrium data of the mixture. As de-20
scribed in the literature (Jaubert et al., 2016; Privat21
et al., 2016) and as discussed above, the addition of22
Peneloux-style volume translation does not shift the23
phase equilibrium, and therefore, the effects of the24
GC-VTPR model on the VLE data representation can25
be considered in two parts: i) the impact of the fitted26
parameters on the representation of the VLE data ii)27
the volume-translated VLE data for the equilibrium28
phase densities.29
All the figures depicting the percentage RD for30
the different properties and for all the studied mix-31
tures are available in the Supporting Information. In32
the following sections, only the most representative33
figures for each case are shown. These figures are34
classified into three types depending on the way RD35
are depicted, and are explained below:36
• Violin plots: the distribution of the deviation37
in a similar manner to a histogram. The lower38
and upper bars represent the minimal and max-39
imal values, respectively. The middle bar rep-40
resents the median.41
• Composition dependency plots: the relative de-42
viation versus the molar fraction of the first43
component of the mixture, which allows for an44
assessment of how the composition affects the45
accuracy of the EoS mixing rule.46
• Temperature dependency plots: they represent47
the influence of temperature on the RD, in or-48
der to show potential temperature effects on49
the accuracy of the EoS.50
5.1. Vapor-Liquid Equilibrium51
Figure 1 and Fig. 2 present the pressure-composition52
isotherms for the mixtures R-125 + R-134a and isobu-53
tane + R-134a, respectively, as illustrative cases. Ad-54
ditional results for all the binary mixtures considered55
are available in the Supporting Information. The pre-56
dicted values of the bubble and dew pressures for the57
mixture R-125 + R-134a are in good agreement with58
the available experimental values over the entire tem-59
perature range. However, a different behavior can be60
observed for the mixture isobutane + R-134a. This61
11

ACCEPTED MANUSCRIPT
ACCEPTED MANUSCRIP
T
mixture was chosen as a representative of the predic-1
tive performance of the GC-VTPR EoS, as it presents2
azeotropic behavior at low molar fractions of isobu-3
tane. As it can be seen, while the predicted values4
at high temperatures match reasonably well the ex-5
perimental bubble point data, the calculated values6
at low temperatures underestimate the bubble point7
pressure near the azeotrope.8
The strength of the thermodynamic correction that9
the excess Gibbs energy contribution must provide10
is highly dependent on the similarity of the compo-11
nents forming the binary mixture and whether the12
mixture is likely to form azeotropes. In the case13
of n-butane + isobutane, for instance, all groups in14
the mixture are in the first (mgi=1) main group, and15
therefore, the excess Gibbs contribution gE is by def-16
inition zero. On the other hand, for binary mixtures17
that have cross-main-group binary interactions (isobu-18
tane + R-134a), the excess Gibbs energy contribu-19
tion shifts the mixture thermodynamics. Figure 220
demonstrates that the model is able to capture strong21
positive-pressure azeotropes (which occur frequently22
in binary mixtures of refrigerant-like fluids).23
0.0 0.2 0.4 0.6 0.8 1.0x (mole fraction R-125)
100
p (M
Pa)
Figure 1: Selected pressure-composition isotherms (253.1,273.1, 293.1, 313.1, 333.1 K) for the mixture R-125 + R-134aversus the mole fraction of R-125 with the GC-VTPR model inthis work: • bubble point experimental data; ◦ dew point exper-imental data; calculated bubble point; calculated dewpoint. Experimental data points are taken from the literature(Kleemiss, 1997; Kato and Nishiumi, 2006; Higuchi and Hi-gashi, 1995; Benmansour and Richon, 1999; Widiatmo et al.,1997; Nagel and Bier, 1995; Holcomb et al., 1998; Higashi,1999a; Kobayashi and Nishiumi, 1998; Kim and Park, 1999;Nishiumi and Ohno, 2000)
0.0 0.2 0.4 0.6 0.8 1.0x (mole fraction isobutane)
100
p (M
Pa)
Figure 2: Selected pressure-composition isotherms (293.66,303.2 323.2 K) for the mixture isobutane + R-134a versus themole fraction of isobutane with the GC-VTPR model in thiswork: • experimental bubble point; ◦ experimental dew point;
calculated bubble point; calculated dew point. Ex-perimental data points are taken from the literature (Lim et al.,2000; Bobbo et al., 1998)
Any PTXY experimental VLE measurement for24
which the compositions of both of the co-existing25
phases, temperature, and pressure are known can be26
12

ACCEPTED MANUSCRIPT
ACCEPTED MANUSCRIP
T
also be considered as two separate measurements,1
one for which the mixture is at the bubble-point (the2
liquid mixture at the bulk composition is in equilib-3
rium with the incipient vapor phase), and another4
at the dew point (the gaseous mixture at the bulk5
composition is in equilibrium with the incipient liq-6
uid phase). Therefore, although the fitting campaign7
considered only PTXY data, the analysis of the mix-8
ture models considers bubble point and dew point9
data individually. Here we consider the binary mix-10
ture of DME + n-butane as an illustrative case of11
the analysis of the phase equilibrium pressures. We12
compare the model predictions of phase equilibrium13
pressure with those of Peng-Robinson, and the ref-14
erence multiparameter model implemented in the in-15
dustry standard NIST REFPROP library (Lemmon16
et al., 2018).17
Although deviations in pressure are commonly18
presented in the literature (and will be here also), the19
deviation in phase equilibrium pressure is an imper-20
fect metric to capture the “goodness” of the model.21
This is because as the VLE isotherms become very22
steep (|dp/dx| becomes large along the VLE isotherm),23
it is no longer relevant to talk about deviations in24
pressure; it is better to talk about the orthogonal dis-25
tance of the experimental data point from the VLE26
isotherm. Nonetheless, the deviation in pressure is27
an accessible metric for “quality-of-fit”, and partic-28
ularly for mixtures with slender VLE “lenses”, pres-29
sure deviations are meaningful.30
Figure 3 and Fig. 4 present the results for the31
mixture of isobutane + R-125; this is one of the mix-32
tures with the largest worst-case relative deviations33
in saturation pressure (with some bubble-point pres-34
sure deviations greater than 30%). Figure 3 presents35
pressure-composition isotherms for the mixture isobu-36
tane + R-125 and in Fig. 4, the relative deviations for37
the bubble-point and dew-point pressures are shown38
for each of the EOS, as well as the composition and39
temperature dependence of the deviations of the mod-40
els. One challenge with this mixture is that all the41
available PTXY data used to fit this mixture model42
were above 293 K, therefore the poor fidelity of this43
model for temperatures below 293 K should not be44
considered as indictment of the general modeling ap-45
proach, rather a demonstration of the challenges to46
obtain the correct extrapolation behavior. For bubble-47
point pressures (left side of the figure), the mean ab-48
solute error for REFPROP is smallest in magnitude49
(2.8%), followed by GC-VTPR (9.2%) and Peng-50
Robinson (28.7%). The pure fluid endpoints at x1 =51
0 and x1 = 1 are governed by the behavior of the α52
function and the Twu parameters; for a pure fluid the53
UNIFAC contribution is zero.54
At low temperatures, all of the mixture models55
deviate strongly from the experimental data. This56
can be partially explained by the data that were in-57
cluded in the fitting of the interaction parameters in58
NIST REFPROP. The binary interaction parameters59
fit for isobutane + R-125 in NIST REFPROP (βT =1.0,60
γT =0.90538, βV=1.0, γV=1.0036) were obtained in61
2002, and all of the experimental data at tempera-62
tures below 293 K were collected in 2007 in the pub-63
lication of Chen et al. (2007). This result highlights64
as well that although the mixture models in NIST65
REFPROP are in general the most accurate available66
in the literature, they are only as reliable as the exper-67
imental data that were available at the time the model68
was developed. The conventional Peng-Robinson EoS69
also demonstrates significant deviations from the ex-70
perimental data. For the dew-point pressures (right71
side of the figure), the mean error for REFPROP is72
smallest in magnitude (1.2 %), followed by GC-VTPR73
(4.0 %) and Peng-Robinson(18.2 %). Figure 3 shows74
a few of the isotherms, highlighting that the largest75
deviations are at low temperatures, below the range76
where the PTXY data needed for model fitting in this77
work are available.78
13
ACCEPTED MANUSCRIPT
ACCEPTED MANUSCRIP
T0.0 0.2 0.4 0.6 0.8 1.0x (mole fraction isobutane)
10-1
100
p (M
Pa)
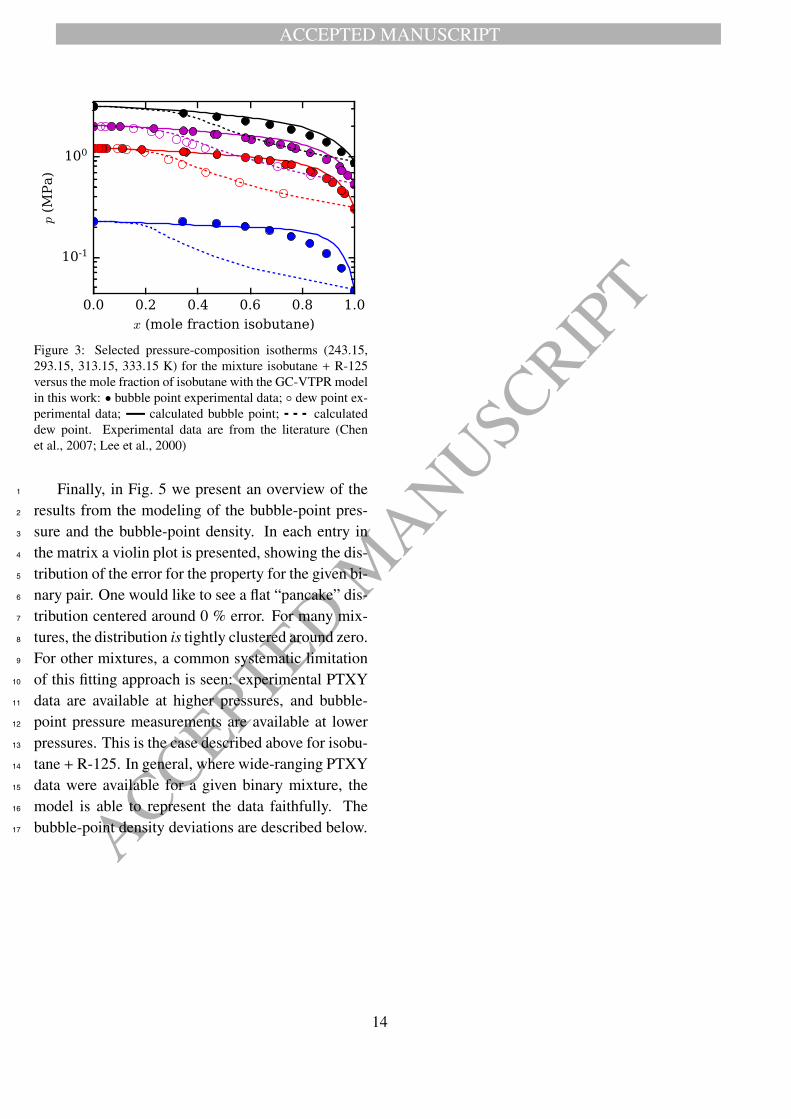
Figure 3: Selected pressure-composition isotherms (243.15,293.15, 313.15, 333.15 K) for the mixture isobutane + R-125versus the mole fraction of isobutane with the GC-VTPR modelin this work: • bubble point experimental data; ◦ dew point ex-perimental data; calculated bubble point; calculateddew point. Experimental data are from the literature (Chenet al., 2007; Lee et al., 2000)
Finally, in Fig. 5 we present an overview of the1
results from the modeling of the bubble-point pres-2
sure and the bubble-point density. In each entry in3
the matrix a violin plot is presented, showing the dis-4
tribution of the error for the property for the given bi-5
nary pair. One would like to see a flat “pancake” dis-6
tribution centered around 0 % error. For many mix-7
tures, the distribution is tightly clustered around zero.8
For other mixtures, a common systematic limitation9
of this fitting approach is seen: experimental PTXY10
data are available at higher pressures, and bubble-11
point pressure measurements are available at lower12
pressures. This is the case described above for isobu-13
tane + R-125. In general, where wide-ranging PTXY14
data were available for a given binary mixture, the15
model is able to represent the data faithfully. The16
bubble-point density deviations are described below.17
14

ACCEPTED MANUSCRIPT
ACCEPTED MANUSCRIP
T
REFPROP GC-VTPR PR6040200
204060
100×
(pca
lc−p
exp)/p
exp (%
) bubble
REFPROP GC-VTPR PR30
20
10
0
10
100×
(pca
lc−p
exp)/p
exp (%
) dew
240 260 280 300 320 340T (K)
100
10203040
100×
(pca
lc−p
exp)/p
exp (%
)
290 295 300 305 310 315T (K)
8
4
0
4
8
12
100×
(pca
lc−p
exp)/p
exp (%
)
0.0 0.2 0.4 0.6 0.8 1.0x (mole fraction isobutane)
100
10203040
100×
(pca
lc−p
exp)/p
exp (%
)
0.0 0.2 0.4 0.6 0.8 1.0x (mole fraction isobutane)
8
4
0
4
8
12
100×
(pca
lc−p
exp)/p
exp (%
)
Figure 4: Deviation plots in saturation pressure for the mixture isobutane(1) + R-125(2) versus the mole fraction of isobutane andthe temperature with the GC-VTPR model in this work. Experimental data are from the literature (Lee et al., 2000; Chen et al.,2007). Markers are given by ◦: REFPROP, +: GC-VTPR. The lower and upper bars in the violin plots represent the minimal andmaximal values, respectively; the middle bar represents the median.
15

ACCEPTED MANUSCRIPT
ACCEPTED MANUSCRIP
T
20100
1020
DM
E
N.D. N.D. N.D. N.D. N.D. N.D.
20100
1020
isob
utan
e
N.D. N.D. N.D. N.D. N.D.
20100
1020
n-b
utan
e
N.D. N.D. N.D. N.D. N.D.
20100
1020
R-1
234y
f
N.D. N.D. N.D. N.D. N.D.
20100
1020
R-1
25
20100
1020
R-1
34a
N.D.
20100
1020
R-1
43a
N.D.
DME
20100
1020
R-3
2
isobutane n-butane R-1234yf R-125 R-134a R-143a R-32
↓ pbubble ↓
↑ ρbubble ↑
Figure 5: An overview of the goodness of fit for each binary pair, with violin plots shown for the deviations of bubble-pointpressure and bubble-point density for the GC-VTPR model of this work as compared with the experimental data from the literature,as reported in ThermoDataEngine (details in the supplemental material). An entry of “N.D.” indicates that no experimental data areavailable for the mixture.
16

ACCEPTED MANUSCRIPT
ACCEPTED MANUSCRIP
T
5.2. Pure Fluid Saturated Liquid Densities1
The calculation of the volume translation param-2
eter for the i-th component ci, defined in Eq. (10),3
was extended to mixtures through the use of a linear4
mole fraction weighting rule, as indicated in Eq. (16).5
Experimental values of the saturated liquid density at6
exactly Tr = 0.7 are in general not available, there-7
fore the saturated liquid density at Tr = 0.7 was8
obtained through the use of a saturated liquid den-9
sity ancillary equation, as in Outcalt and McLinden10
(1995), of the form ρl = a1 + a2τβ1 + a3τ
β2 + a4τβ3 +11
a5τ43 + a6τ
2 + a7τ3 + a8τ
4, where the coefficients β1:312
and a1:8 were fitted to experimental liquid density13
data of the pure fluids. The translation term for each14
pure fluid ci, was obtained by calculating the density15
at a reduced temperature of Tr = T/Tc = 0.7, as in16
ci =(vcalc − vanc,i
)∣∣∣Tr=0.7
.17
Figure 6 shows the percentage relative deviations18
between the densities obtained with the fitted value19
of ci for n-butane, and the experimental densities.20
The densities calculated by the non-volume-translated21
Peng-Robinson model are also shown for compari-22
son purposes. As expected, after applying volume23
translation, the deviations for the saturated liquid den-24
sity at Tr = 0.7 is near zero. The deviations in sat-25
urated liquid density are less than 0.5% in the tem-26
perature range 0.6Tc to 0.8Tc. Equivalent figures for27
the rest of the pure fluids can be found in the sup-28
porting material; the reduced specific densities and29
the volume translation terms ci obtained through this30
process are also available in the supporting material.31
5.3. Mixture Saturated Liquid Densities32
In general, VLE density data for refrigerant mix-33
tures are much less common than bubble-point and34
dew-point pressure data. This scarcity is largely driven35
by the difficulty of carrying out phase equilibrium36
density measurements as compared with vapor-liquid37
equilibrium measurements. As a result, there are38
only seven binary mixtures with any bubble-point39
density measurements. Figure 5 shows the same kind40
of violin plots as were generated for the bubble-point41
pressure. There are many systems with no phase42
100 150 200 250 300 350 400 450T (K)
10
5
0
5
10
100×
(ρca
lc−ρ
exp)/ρ
exp (%
)
Peng-Robinson (no V.T.)
GC-VTPR
Buecker
0.2 0.4 0.6 0.8 1.0Tr = T/Tc
Figure 6: Relative deviations of the saturated liquid densitiesof n-butane from the multiparameter EOS of Buecker and Wag-ner (2006), GC-VTPR and PR compared with the experimentaldata from the literature (Dana et al., 1926; Coffin and Maass,1928; Kay, 1940; Benoliel, 1941; Carney, 1942a,b; Legatskiet al., 1942; Cragoe, 1943; Olds et al., 1944; Prengle et al.,1948; Klosek and McKinley, 1968; Sliwinski, 1969; Haynesand Hiza, 1976; McClune, 1976; Haynes and Hiza, 1977; Cal-ado et al., 1978; Orrit and Laupretre, 1978; Thompson andMiller, 1980; Hsu et al., 1985; Kaminishi et al., 1988; Niesen,1989; Vasserman et al., 1989; Holcomb et al., 1995; Kumagaiand Takahashi, 1995; Dahlhoff et al., 2000; Glos et al., 2004;Kayukawa et al., 2005; Miyamoto and Uematsu, 2007).
17

ACCEPTED MANUSCRIPT
ACCEPTED MANUSCRIP
T
equilibrium density measurements. In general, bubble-1
point density measurements are carried out prior to2
dew-point density measurements for a given mixture,3
therefore there are only 5 systems for which any dew-4
point density measurements are available. Only the5
bubble-point density deviation plots are shown in this6
figure.7
The deviations in bubble-point density are in gen-8
eral larger in relative terms than the deviations in9
bubble-point pressure; this is a result of a number10
of compounding errors. The first error contribution11
arises from the UNIFAC contribution; if the UNIFAC12
contribution shifts the phase equilibrium in a dele-13
terious direction, the non-volume-translated equilib-14
rium densities may also be perturbed. The volume15
translation is then applied after the phase equilibrium16
calculation, but as is evident in Fig. 6, the volume17
translation has a rather small range in reduced tem-18
perature where it is particularly effective. For state19
points away from Tr = 0.7 for the pure fluids in the20
mixture, the volume translation does not necessarily21
compensate in the appropriate direction. The poor22
matching of volume translation constants for pure23
fluids in the mixture can be especially problematic24
for mixtures where the critical temperatures of the25
components are very different, although for the re-26
frigerant mixtures studied in this work the critical27
temperatures are relatively similar. The inclusion of28
Peneloux-style volume translation does not always29
improve the representation of liquid-phase densities,30
and at low and high temperatures, the volume trans-31
lation can significantly degrade the prediction of liquid-32
like densities. On the other hand, much of the interest33
for industrial applications is in the temperature range34
near 0.7Tc, so volume translation can be worthwhile35
depending on the particulars of the modeling prob-36
lem to be solved.37
Figure 7 shows deviation plots for the bubble-38
point densities for the mixture of R-143a + R-125.39
This is a mixture with one of the worst representa-40
tions of the bubble-point densities in Fig. 5, so it is41
instructive to better understand this system. The pri-42
mary reason for the poor representation of the phase43
equilibrium densities is that the available densities44
are not in the vicinity of 0.7Tc of the pure compo-45
nents, the temperature at which the volume transla-46
tion has been tuned. The deviations in bubble-point47
density increase as the temperature increases away48
from 0.7Tc of the pure components, while there is49
minimal dependence on the composition of the mix-50
ture. Other authors (Le Guennec et al., 2016b) also51
note that away from the point at which the volume52
translation has been tuned the representation of den-53
sities is significantly worse.54
6. Conclusions55
In this work, the group contribution volume trans-56
lated Peng Robinson equation of state (GC-VTPR57
EoS) was applied to a set of constituent fluids form-58
ing commercial refrigerant mixtures. The accuracy59
of this equation of state was evaluated by analyzing60
the relative deviations of the estimated values versus61
experimental data of saturation pressures and satu-62
rated liquid and vapor densities. The performance63
of the GC-VTPR EoS was also compared to that of64
the standard Peng-Robinson equation of state and the65
multi-fluid Helmholtz energy equation of state im-66
plemented in NIST REFPROP 10(Lemmon et al., 2018).67
This comparison allowed for an analysis of the po-68
tential improvements in cubic equations of state through69
the use of volume translation and an excess Gibbs en-70
ergy group contribution term.71
Based on the results of this analysis, the follow-72
ing conclusions were drawn:73
• The GC-VTPR EoS yields competitive accu-74
racy with NIST REFPROP for the saturation75
pressure of mixtures containing components with76
similar molecular structure. As the difference77
between the molecular structure of the com-78
ponents increases, the GC-VTPR EoS tends to79
yield larger deviations than REFPROP. This is80
observed also for the Peng-Robinson EoS.81
• The predicted liquid density values are strongly82
influenced by the application of volume trans-83
18

ACCEPTED MANUSCRIPT
ACCEPTED MANUSCRIP
T
REFPROP GC-VTPR PR50403020100
10
100×
(ρca
lc−ρ
exp)/ρ
exp (%
) bubble
REFPROP GC-VTPR PR6040200
204060
100×
(ρca
lc−ρ
exp)/ρ
exp (%
) dew
220 240 260 280 300 320 340 360T (K)
25201510505
100×
(ρca
lc−ρ
exp)/ρ
exp (%
)
0.7T
c,1
0.7T
c,2
220 240 260 280 300 320 340 360T (K)
64202468
1012
100×
(ρca
lc−ρ
exp)/ρ
exp (%
)
0.7T
c,1
0.7T
c,2
0.0 0.2 0.4 0.6 0.8 1.0x (mole fraction R-143a)
25201510505
100×
(ρca
lc−ρ
exp)/ρ
exp (%
)
0.0 0.2 0.4 0.6 0.8 1.0x (mole fraction R-143a)
64202468
1012
100×
(ρca
lc−ρ
exp)/ρ
exp (%
)
Figure 7: Deviation plots in saturation densities for the mixture R-143a (1) + R-125 (2) versus the mole fraction of R-143a and thetemperature with the models investigated in this work. Markers are given by ◦: REFPROP, +: GC-VTPR. Experimental data pointsfor which the vapor-liquid equilibrium calculations failed are not shown. The lower and upper bars in the violin plots represent theminimal and maximal values, respectively; the middle bar represents the median. Experimental data are from the literature (Ikedaand Higashi, 1995; Widiatmo et al., 1995; Fujimine et al., 1999; Higashi, 1999b; Kishizawa et al., 1999; Uchida et al., 1999).
19

ACCEPTED MANUSCRIPT
ACCEPTED MANUSCRIP
T
lation; this is by design as the volume trans-1
lation is intended to “repair” the saturated liq-2
uid densities. This volume translation parame-3
ter may benefit from a temperature dependence4
and an improved mixing rule that considers the5
size difference between the molecules.6
• The GC-VTPR EoS evaluated in this work of-7
fers competitive results in terms of accuracy8
with other EoS and could be used for the study9
of new refrigerant mixtures for which insuffi-10
cient experimental data are available to fit the11
highly accurate (and complicated) fluid mod-12
els used in NIST REFPROP. Moreover, im-13
provement of the volume translation and mix-14
ing rules provides opportunities to further im-15
prove the accuracy of this modeling framework.16
7. Acknowledgements17
The authors thank Jorrit Wronski (IPU) for cod-18
ing support, Jens Abildskov (DTU) for the discus-19
sions on the fitting of activity coefficients. Jonathan20
Welliquet thanks the Erasmus+ project who provided21
financial support for his internship at DTU. Maria E.22
Mondejar acknowledges the financial support from23
the European Union’s Horizon 2020 research and in-24
novation programme with a Marie Skłodowska-Curie25
Fellowship under grant agreement No 704201 with26
the project NanoORC (www.nanoorc.mek.dtu.dk).27
Appendix A. Parameters for the Twu α function28
The parameters L, M and N for the Twu α func-29
tion (see Eq. 12) were optimized and tabulated by30
Bell et al. (2018) for 2570 fluids. Table A.4 presents31
the values of the parameters used in this work.32
Appendix B. Interaction parameters for the term33
amn.34
The interaction parameters amn for Eq. (28) are35
collected in Table B.5. The parameters for a45 and36
a54 are unknown (and set to zero) because these groups37
Table A.4: Consistent coefficients for the Twu α function forthe fluids considered in this work. All coefficients have beentaken from the work of Bell et al. (2018)
Fluid L M N
n-butane 0.4652 0.8475 1.2010isobutane 1.1121 0.9991 0.5440R-143a 0.2450 0.8491 2.1298R-125 1.0845 0.9986 0.7413R-134a 0.3064 0.8298 2.0112R-1234yf 0.1659 0.8437 2.6526R-32 0.3436 0.8546 1.7906DME 0.8312 0.8881 0.7446
were not present in any of the experimental data in-38
cluded in this study.39
Table B.5: Interaction parameters amn in K.
mgi n=1 2 3 4 5
m = 1 0 197.06 268.17 69.746 17.4762 2.2679 0 -9.3253 -96.001 -330.513 75.107 29.518 0 83.803 -78.7994 -4.7829 269.44 206.02 0 05 540.81 999.99 35.719 0 0
References40
Abrams, D. S., Prausnitz, J. M., 1975. Statistical Thermody-41
namics of Liquid Mixtures: A New Expression for the Ex-42
cess Gibbs Energy of Partly or Completely Miscible Sys-43
tems. AIChE J. 21 (1), 116–128.44
Ahlers, J., Gmehling, J., 2002a. Development of a universal45
group contribution equation of state. 2. Prediction of vapor-46
liquid equilibria for asymmetric systems. Ind. Eng. Chem.47
Res. 41 (14), 3489–3498.48
Ahlers, J., Gmehling, J., 2002b. Development of a universal49
group contribution equation of state III. Prediction of vapor-50
liquid equilibria, excess enthalpies, and activity coefficients51
at infinite dilution with the VTPR model. Ind. Eng. Chem.52
Res. 41 (23), 5890–5899.53
ASHRAE, 2016. ANSI/ASHRAE Standard 34-2016 Designa-54
tion and Safety Classification of Refrigerants.55
Bell, I. H., Jager, A., 2016. Helmholtz Energy Transformations56
of Common Cubic Equations of State for Use with Pure Flu-57
ids and Mixtures. J. Res. Nat. Inst. Stand. Technol. 121, 238.58
Bell, I. H., Satyro, M., Lemmon, E. W., 2018. Consistent Twu59
Parameters for More than 2500 Pure Fluids from Critically60
Evaluated Experimental Data. J. Chem. Eng. Data.61
20

ACCEPTED MANUSCRIPT
ACCEPTED MANUSCRIP
T
Bell, I. H., Wronski, J., Quoilin, S., Lemort, V., 2014. Pure and1
Pseudo-pure Fluid Thermophysical Property Evaluation and2
the Open-Source Thermophysical Property Library Cool-3
Prop. Ind. Eng. Chem. Res. 53 (6), 2498–2508.4
Ben Adamson, B., Airah, M., 1998. Dimethyl ether as an R125
replacement. In: Proceeding of IIF-IIR conference (Com-6
missions B1, B2, E1 and E2), Osslo, Norway. pp. 610–17.7
Benmansour, S., Richon, D., 1999. Vapor-Liquid Equilibria8
and Densities of the Binary Refrigerant Mixture Composed9
of Pentafluoroethane (R 125) and 1,1,1,2-Tetrafluoroethane10
(R 134a) at Temperatures Between 253 K and 303 K and11
Pressures up to 20 MPa (10402 data points). Experimental12
Data and Correlations,. ELDATA: The International Elec-13
tronic Journal of Physico-Chemical Data 5, 117–126.14
Benoliel, R. W., 1941. Some Physical Constants of Seven Four-15
Carbon-Atom Hydrocarbons and Neopentane. Ph.D. thesis,16
Pennsylvania State University.17
Bobbo, S., Stryjek, R., Elvassore, N., Bertucco, A., 1998. A re-18
circulation apparatus for vapor-liquid equilibrium measure-19
ments of refrigerants. Binary mixtures of R600a, R134a and20
R236fa. Fluid Phase Equilib. 150-151, 343–352.21
Bondi, A., 1968. Physical Properties of Molecular Liquids,22
Crystals, and Glasses. Wiley, New York.23
Buecker, D., Wagner, W., 2006. Reference Equations of State24
for the Thermodynamic Properties of Fluid Phase n-Butane25
and Isobutane. J. Phys. Chem. Ref. Data 35 (2), 929–1019.26
Calado, J. C. G., McLure, I. A., Soares, V. A. M., 1978. Sur-27
face Tension for Octafluorocyclobutane, n-Butane and their28
Mixtures from 233 K to 254 K, and Vapor Pressure, Excess29
Gibbs Function, and Excess Volume for the Mixtures at 23330
K. Fluid Phase Equilib. 2, 199–213.31
Carney, B. R., 1942a. Density of Liquified Petroleum Gas Hy-32
drocarbons. Hydrocarbon Process. 21, 274.33
Carney, B. R., 1942b. Density of Liquified Petroleum Gas Hy-34
drocarbons, Their Mixtures and Three Natural Gasolines.35
Hydrocarbon Process. 21, 84.36
Chen, J., Fischer, K., Gmehling, J., 2002. Modification of37
PSRK mixing rules and results for vapor-liquid equilibria,38
enthalpy of mixing and activity coefficients at infinite dilu-39
tion. Fluid Phase Equilib. 200 (2), 411–429.40
Chen, J.-X., Chen, Z., Hu, P., Jiang, B., Li, Z.-H., 2007. Vapor-41
Liquid Equilibria for the Binary System Pentafluoroethane42
(HFC-125) + Isobutane (HC-600a) at Temperatures from43
(243.15 to 333.15) K. J. Chem. Eng. Data 52, 2159–2162.44
Coffin, C. C., Maass, O., 1928. The Preparation and Physical45
Properties of .alpha.-,.beta.- and .gamma.-Butylene and Nor-46
mal and Isobutane. J. Am. Chem. Soc. 50, 1427–1437.47
Cragoe, C. S., 1943. Tech. Rep. LC-736, Natl. Bur. Stand. (U.48
S.).49
Dahlhoff, G., Pfennig, A., Hammer, H., Oorschot, M. v., 2000.50
Vapor-Liquid Equilibria in Quaternary Mixtures of Dimethyl51
Ether + n-Butane + Ethanol + Water. J. Chem. Eng. Data 45,52
887–892.53
Dana, L. I., Jenkins, A. C., Burdick, H. E., Timm, R. C.,54
1926. Thermodynamic Properties of Butane, Isobutane, and55
Propane. Refrig. Eng. 12, 387.56
Fredenslund, A., Jones, R. L., Prausnitz, J. M., 1975. Group-57
contribution estimation of activity coefficients in nonideal58
liquid mixtures. AIChE Journal 21 (6), 1086–1099.59
Frey, K., Augustine, C., Ciccolini, R. P., Paap, S., Modell, M.,60
Tester, J., 2007. Volume translation in equations of state as a61
means of accurate property estimation. Fluid Phase Equilib.62
260 (2), 316–325.63
Fujimine, T., Sato, H., Watanabe, K., 1999. Bubble-Point Pres-64
sures and Saturated- and Compressed-Liquid Densities of65
the Binary R-125 + R-143a System. Int. J. Thermophys. 20,66
911–922.67
Glos, S., Kleinrahm, R., Wagner, W., 2004. Measurement of68
the (p,.rho.,T) relation of propane, propylene, n-butane, and69
isobutane in the temperature range from (95 to 340) K at70
pressures up to 12 MPa using an accurate two-sinker den-71
simeter. J. Chem. Thermodyn. 36, 1037–1059.72
Gmehling, J., 1985. Dortmund Data Bank-Basis for the devel-73
opment of prediction methods. CODATA Bulletin (58), 56–74
64.75
Haynes, W. M., Hiza, M. J., 1976. Orthobaric liquid densities76
of normal butane from 135 to 300 K as determined with a77
magnetic suspension densimeter. Adv. Cryog. Eng. 21, 516–78
21.79
Haynes, W. M., Hiza, M. J., 1977. Measurements of the Ortho-80
baric Liquid Densities of Methane, Ethane, Propane, Isobu-81
tane, and Normal Butane. J. Chem. Thermodyn. 9, 179–187.82
Higashi, Y., 1999a. Vapor- Liquid Equilibrium, Coexistence83
Curve, and Critical Locus for Pentafluoroethane + 1,1,1,2-84
Tetrafluoroethane (R125/R134a). J. Chem. Eng. Data 44,85
328–332.86
Higashi, Y., 1999b. Vapor-Liquid Equilibrium, Coexistence87
Curve, and Critical Locus for Pentafluoroethane + 1,1,1-88
Trifluoroethane (R125/R143a). J. Chem. Eng. Data 44, 333–89
337.90
Higuchi, M., Higashi, Y., 1995. Measurements of the Vapor-91
Liquid Equilibrium for Binary R-125/134a,. In: Proc. 16th92
Japan Symp. Thermophys. Prop. pp. 5–8.93
Holcomb, C., Magee, J. W., Scott, J. L., Outcalt, S. L., Haynes,94
W. M., 1998. Selected Thermodynamic Properties for Mix-95
tures of R-32 R-125 R-134A R-143A R-41 R-290 and R-96
744. Tech. Rep. Technical Note 1397, NIST.97
Holcomb, C. D., Magee, J. W., Haynes, W. M., 1995. Gas Pro-98
cessors Association Project. Tech. Rep. 916, Research Re-99
port RR-147.100
Hsu, J., Nagarajan, N., Robinson Jr., R. L., 1985. Equilibrium101
Phase Compositions, Phase Densities and Interfacial Ten-102
21

ACCEPTED MANUSCRIPT
ACCEPTED MANUSCRIP
T
sions for CO2 + Hydrocarbon Systems. 1. CO2 + n-Butane.1
J. Chem. Eng. Data 30, 485–491.2
Ikeda, T., Higashi, Y., 1995. Determination of the critical pa-3
rameters for new refrigerant R-507 and R-407C. In: 16th4
Japan Symp. Thermophys. Prop. pp. 169–172.5
ISO 817:2014(en), 2000. Refrigerants – Designation and safety6
classification. Standard, International Organization for Stan-7
dardization, Geneva, CH.8
Jaubert, J.-N., Mutelet, F., 2004. Vle predictions with the peng–9
robinson equation of state and temperature dependent kij cal-10
culated through a group contribution method. Fluid Phase11
Equilibria 224 (2), 285–304.12
Jaubert, J.-N., Privat, R., Guennec, Y. L., Coniglio, L., 2016.13
Note on the properties altered by application of a Peneloux–14
type volume translation to an equation of state. Fluid Phase15
Equilib. 419, 88–95.16
Ji, W.-R., Lempe, D., 1997. Density improvement of the SRK17
equation of state. Fluid Phase Equilibria 130 (1-2), 49–63.18
Kaminishi, G.-I., Yokoyama, C., Takahashi, S., 1988. Saturated19
liquid densities of n-butane-isobutane, n-butane-propane,20
isobutane-propane and n-butane-isobutane-propane mix-21
tures. Sekiyu Gakkaishi 31, 433–8.22
Kato, R., Nishiumi, H., 2006. Vapor liquid equilibria and criti-23
cal loci of binary and ternary systems composed of CH2F2,24
C2HF5 and C2H2F4. Fluid Phase Equilib. 249, 140–146.25
Kay, W. B., 1940. Pressure-Volume-Temperature Relations for26
n-Butane. Ind. Eng. Chem. 32, 358–360.27
Kayukawa, Y., Hasumoto, M., Kano, Y., Watanabe, K., 2005.28
Liquid-Phase Thermodynamic Properties for Propane (1), n-29
Butane (2), and Isobutane (3). J. Chem. Eng. Data 50, 556–30
564.31
Kim, C. N., Park, Y. M., 1999. Vapor-liquid equilibrium of32
HFC-32/134 a and HFC-125/134a systems. Int. J. Thermo-33
phys. 20, 519–530.34
Kishizawa, G., Sato, H., Watanabe, K., 1999. Measurements of35
Saturation Densities in Critical Region and Critical Loci for36
Binary R-32/125 and R-125/143a Systems. Int. J. Thermo-37
phys. 20, 923–932.38
Kleemiss, M., 1997. Fortschrittsberichte VDI: Thermodynamic39
Properties of Two Ternary Refrigerant Mixtures: Measure-40
ments and Equations of State. Tech. Rep. Reihe 19 Nr. 98,41
VDI Verlag GmbH.42
Klosek, J., McKinley, C., 1968. Densities of LNG and of Loq43
Molecular Weight Hydrocarbons. In: Proc. First Int. Confer-44
ence on LNG.45
Kobayashi, M., Nishiumi, H., 1998. Vapor-liquid equilibria46
for the pure, binary and ternary systems containing HFC32,47
HFC125 and HFC134a. Fluid Phase Equilib. 144, 191–202.48
Kumagai, A., Takahashi, S., 1995. Viscosity and density of liq-49
uid mixtures of n-alkanes with squalane. Int. J. Thermophys.50
16, 773–779.51
Kunz, O., Klimeck, R., Wagner, W., Jaeschke, M., 2007.52
The GERG-2004 Wide-Range Equation of State for Natu-53
ral Gases and Other Mixtures. VDI Verlag GmbH.54
Le Guennec, Y., Lasala, S., Privat, R., Jaubert, J. N., 2016a.55
A consistency test for alpha-functions of cubic equations of56
state. Fluid Phase Equilib. 427, 513–538.57
Le Guennec, Y., Privat, R., Jaubert, J.-N., 2016b. Development58
of the translated-consistent tc-PR and tc-RK cubic equations59
of state for a safe and accurate prediction of Volumetric, en-60
ergetic and saturation properties of pure compounds in the61
sub- and super-critical domains. Fluid Phase Equilibria 429,62
301–312.63
Lee, B. G., Park, J. Y., Lim, J. S., Lee, Y. W., Lee, C. H., 2000.64
Vapor-liquid equilibria for isobutane + pentafluoroethane65
(HFC-125) at 293.15 to 313.15 K and + 1,1,1,2,3,3,3-66
heptafluoropropane (HFC-227ea) at 303.15 to 323.15 K. J.67
Chem. Eng. Data 45, 760–763.68
Legatski, T., Nelson, W., Dean, M., Fruit, L., 1942. Densities69
of Liquefied Petroleum Gases,. Ind. Eng. Chem. 34, 1240–70
1243.71
Lemmon, E. W., Bell, I. H., Huber, M. L., McLinden, M. O.,72
2018. NIST Standard Reference Database 23: Reference73
Fluid Thermodynamic and Transport Properties-REFPROP,74
Version 10.0, National Institute of Standards and Technol-75
ogy. http://www.nist.gov/srd/nist23.cfm.76
Lim, J. S., Park, J. Y., Lee, B. G., Lee, Y. W., Kim, J. D., 2000.77
Reply to Comments by Stanislaw K. Malanowski and Ro-78
man Stryjek on J. Chem. Eng. Data 1999, 44, 1226-1230. J.79
Chem. Eng. Data 45, 1219–1221.80
Lopez-Echeverry, J. S., Reif-Acherman, S., Araujo-Lopez, E.,81
2017. Peng-Robinson equation of state: 40 years through82
cubics. Fluid Phase Equilib. 447, 39–71.83
Mathias, P. M., Copeman, T. W., 1983. Extension of the Peng-84
Robinson equation of state to complex mixtures: evaluation85
of the various forms of the local composition concept. Fluid86
Phase Equilib. 13, 91–108.87
McClune, C. R., 1976. Measurements of the Densities of Liq-88
uefied Hydrocarbons from 93 to 173 K. Cryogenics 16, 289–89
95.90
Miyamoto, H., Uematsu, M., 2007. Measurements of vapour91
pressures and saturated-liquid densities for n-butane at T =92
(280 to 424) K. J. Chem. Thermodyn. 39, 827–832.93
Mota-Babiloni, A., Navarro-Esbrı, J., Barragan-Cervera, A.,94
Moles, F., Peris, B., 2015. Analysis based on EU Regulation95
No 517/2014 of new HFC/HFO mixtures as alternatives of96
high GWP refrigerants in refrigeration and HVAC systems.97
Int. J. Refrig 52, 21–31.98
Nagel, M., Bier, K., 1995. Vapor-liquid equilibrium of ternary99
mixtures of the refrigerants R32, R125 and R134a. Int. J.100
Refrig. 18, 534–43.101
Niesen, V. G., 1989. (Vapor + liquid) equilibria and coexisting102
22

ACCEPTED MANUSCRIPT
ACCEPTED MANUSCRIP
T
densities of (carbon dioxide + n-butane) at 311 to 395 K. J.1
Chem. Thermodyn. 21, 915–923.2
Nishiumi, H., Ohno, T., 2000. High Pressure Vapor-liquid Equi-3
libria and Critical Loci for the HFC125-HFC134a System.4
Korean J. Chem. Eng. 17, 668–671.5
Olds, R. H., Reamer, H. H., Sage, B. H., Lacey, W. N., 1944.6
Phase Equilibria in Hydrocarbon Systems. Volumetric Be-7
haviour of n-Butane. Ind. Eng. Chem. 36, 282.8
Orrit, J. E., Laupretre, J. M., 1978. Density of liquefied natural9
gas components. Adv. Cryog. Eng. 23, 573.10
Outcalt, S., McLinden, M. O., 1995. Equations of State for the11
Thermodynamic Properties of R32 ( Difluoromethane ) and12
R 125 ( Pentafluoroethane ). Int. J. Thermophys. 32 (I).13
Peneloux, A., Rauzy, E., Freze, R., 1982. A consistent correc-14
tion for Redlich-Kwong-Soave Volumes. Fluid Phase Equi-15
lib. 8 (1), 7–23.16
Peng, D.-Y., Robinson, D. B., 1976. A New Two-Constant17
Equation of State. Ind. Eng. Chem. Fundam. 15 (1), 59–64.18
Poling, B. E., Prausnitz, J. M., O’Connell, J. P., 2001. The Prop-19
erties of Gases and Liquids, 5th edition. McGraw Hill.20
Prengle, H. W., Greenhaus, L. R., York, R., 1948. Thermody-21
namic properties of n-Butane. Chem. Eng. Prog. 44, 863–8.22
Privat, R., Jaubert, J.-N., Guennec, Y. L., 2016. Incorporation23
of a volume translation in an equation of state for fluid mix-24
tures: which combining rule? which effect on properties of25
mixing? Fluid Phase Equilib. 427, 414–420.26
Qian, J.-W., Privat, R., Jaubert, J.-N., Coquelet, C., Ramjuger-27
nath, D., 2017. Fluid-phase-equilibrium prediction of28
fluorocompound-containing binary systems with the predic-29
tive e-ppr78 model. International Journal of Refrigeration30
73, 65 – 90.31
URL http://www.sciencedirect.com/science/32
article/pii/S014070071630293633
Schmid, B., Gmehling, J., 2012. Revised parameters and typi-34
cal results of the VTPR group contribution equation of state.35
Fluid Phase Equilib. 317, 110–126.36
Schmid, B., Gmehling, J., 2016. Present status of the group37
contribution equation of state VTPR and typical applications38
for process development. Fluid Phase Equilib. 425, 443–450.39
Schmid, B., Schedemann, A., Gmehling, J., 2014. Extension of40
the VTPR group contribution equation of state: Group in-41
teraction parameters for additional 192 group combinations42
and typical results. Ind. Eng. Chem. Res. 53 (8), 3393–3405.43
Sliwinski, P., 1969. The lorentz-lorenz function of gaseous and44
liquid ethane, propane and butane. Z. Phys. Chem. (Munich)45
63, 263–79.46
Soave, G., 1972. Equilibrium Constants from a Modified47
Redlich-Kwong Equation of State. Chem. Eng. Sci. 27,48
1197–1203.49
Storn, R., Price, K., 1997. Differential Evolution – A Simple50
and Efficient Heuristic for global Optimization over Contin-51
uous Spaces. J. Global Opt. 11.52
Thompson, R. T., Miller, R. C., 1980. Densities and Dieletric53
Constants of LPG Components and Mixtures at Cryogenic54
Storage Conditions. Adv. Cryog. Eng. 26, 698.55
Twu, C. H., Bluck, D., Cunningham, J. R., Coon, J. E., 1991. A56
cubic equation of state with a new alpha function and a new57
mixing rule. Fluid Phase Equilib. 69, 33–50.58
Twu, C. H., Coon, J. E., Cunningham, J. R., 1995. A new gen-59
eralized alpha function for a cubic equation of state Part 1.60
Peng-Robinson equation. Fluid Phase Equilib. 105 (1), 49–61
59.62
Uchida, H., Sato, H., Watanabe, K., 1999. Measurements of63
Gaseous PVTx Properties and Saturated Vapor Densities of64
Refrigerant Mixture R-125+R-143a. Int. J. Thermophys. 20,65
97–106.66
Valderrama, J. O., 2003. The State of the Cubic Equations of67
State. Ind. Eng. Chem. Res. 42 (8), 1603–1618.68
van der Waals, J. D., 1873. Over de Continuiteit van den Gas-69
en Vloeistoftoestand. Ph.D. thesis, University of Leiden.70
Vasserman, A. A., Khasilev, I. P., Cymarnyi, V. A., 1989. Ta-71
bles of recommended data. N-butane. Pressure and density72
of liquid and gas at saturation. Tech. Rep. 604-kk, VNIIKI.73
Wei, Y. S., Sadus, R. J., 2000. Equations of State for the Calcu-74
lation of Fluid-Phase Equilibria. AIChE J. 46 (1), 169–196.75
Widiatmo, J. V., Fujimine, T., Sato, H., Watanabe, K.,76
1997. Liquid Densities of Alternative Refrigerants Blended77
with Difluoromethane, Pentafluoroethane, and 1,1,1,2-78
Tetrafluoroethane. J. Chem. Eng. Data 42, 270–277.79
Widiatmo, J. V., Sato, H., Watanabe, K., 1995. Bubble-point80
pressures and liquid densities of binary R-125 + R-143a sys-81
tem. Int. J. Thermophys. 16, 801–810.82
23


![DEFINED CONTRIBUTION VOLUME SUBMITTER PLAN AND … · defined contribution volume submitter plan and trust basic plan document [dc-bpd #04]](https://img.pdfslide.us/doc/110x75/5b1609387f8b9a00708c8279/defined-contribution-volume-submitter-plan-and-defined-contribution-volume-submitter.jpg)