Embed Size (px)
Citation preview

Application of the Cement Hydration Equation in self-compacting concrete’s compressive strength
N. Anagnostopoulos, A. Gergiadis & K. K. Sideris
Laboratory of Building Materials, Democritus University of Thrace, Greece
Abstract
The development of the compressive strength of different self-compacting concretes is experimentally investigated in this research. The self compacting concretes belonged to different strength classes C20/25, C25/30, C30/37 and C35/45. A total of eight mixtures with different cements and different types of aggregates were produced. For comparison reasons additional conventionally vibrated concretes (NCC) of the same strength classes were also produced with the same cements and aggregates. The compressive strength of all mixtures was studied with the help of the cement hydration equation. The hydration number p was determined using the hydration criterion of mortar’s compressive strength. The compressive strength equations were therefore set up for all SCC and NCC produced and their compressive strength values at different hydration ages up to 15 years were calculated. The results indicate that in the case of SCC of all tested classes their compressive strength was significantly increased after the age of 7 days. This increase was much higher than the one measured on conventional concretes of the same strength class. It seems therefore that self compacting concretes produced with limestone filler have a significantly high safety coefficient, regarding the increase of their compressive strength at the late hydration ages. Keywords: self compacting concrete, cement hydration equation, compressive strength, limestone filler, aggregates.
© 2007 WIT PressWIT Transactions on Modelling and Simulation, Vol 46, www.witpress.com, ISSN 1743-355X (on-line)
Computational Methods and Experimental Measurements XIII 655
doi:10.2495/CMEM070651

1 Introduction
Self compacting concrete is the latest achievement in the concrete technology ground. It is about a concrete which can be self consolidated without the use of any mechanical means, by its own weight exclusively. In that way the use of energy spending and noisy consolidation mechanisms can be avoided, while at the same time, due to decreased noise, better personnel communication is established. The convenience of flow and self consolidation, that the new concrete has, leads to brief placing and setting (RILEM [1]). In conclusion due to thorough consolidation SCC mixtures appear to have increased durability and as a result better reinforced concrete quality (Sideris and Sideris [2, 3]). Despite the extensive researches that have taken place in the last decade in order to clarify the new material behavior, the growth of its strength in due time has not yet been searched. At the same time the use of greater fine material quantities which are added in the case of SCC, has led to different hydration rate, especially during the first days, resulting to complications as far as the empiric determination of the strength mixture class is concerned (fracture f7/f28). For the reasons mentioned above, on the present paper the compressive strength growth of SCC of different strength classes, which have been produced by Greek materials, is studied. At the same time for comparison matters conventional concretes of the same strength class were produced. The compressive strength growth was studied using the implementation of the Cement Hydration Equation that was used in all mixtures
2 Experimental program
There have been produced SCC mixtures of different strength classes such as C20/25, C25/30, C30/37 and C35/45. The coarse aggregates used for mixture production were limestone and siliceous, while only limestone filler was used. Two different cement types of the same class were used (CEM II 42.5N) originated from Athens and Thessalonica. The one originated from Athens was used for mixture production using limestone aggregates which have been sent from a quarry in Attica, whereas the cement from Thessalonica was used for mixture production using siliceous aggregates from a quarry in Xanthi. In that way the image of the local cement market can better be simulated. The mixture production and the check of their rheological characteristics took place according to the European Guidelines for Self-Compacting Concrete: Specification, Production and Use [4]. At the same time conventional concretes have been produced in all strength classes with the same cement and aggregate proportion as in SCC. A total of eight SCC mixtures and eight conventional concretes were studied. For each concrete 150mm and 100mm (edge) cubes were prepared. The first specimens were used for the compressive strength assessment in 28 days, whereas the others were used for the compressive strength assessment in 2, 7, 21, 28, 60, 90 and 180 days. The mix proportions, their rheological features and their compressive strength in the age of 28 days are respectively listed in the following tables.
© 2007 WIT PressWIT Transactions on Modelling and Simulation, Vol 46, www.witpress.com, ISSN 1743-355X (on-line)
656 Computational Methods and Experimental Measurements XIII

Table 1: (a) Mix design characteristics of conventional concretes (NCC) produced with limestone aggregates; (b) Mix design characteristics of conventional concretes (NCC) produced with siliceous aggregates; (c) Mix design characteristics of self-compacting concretes (SCC) produced with limestone aggregates; (d) Mix design characteristics of self-compacting concretes (SCC) produced with siliceous aggregates.
(a)
Mixture Proportions
NCC 20/25 Limestone
NCC 25/30 Limestone
NCC 30/37 Limestone
NCC 35/45 Limestone
Cement (IIΑ/Μ42.5N) 280 325 370 450
Silica Fume - - - - Silicate
natural Sand - - - -
Limestone crushed Sand 1022 940 870 805
Aggregates 880 927 955 940 Water 186 183 185 185
W/Paste 0,66 0,56 0,50 0,41 Superpl/zer 1% 1% 1% 1% Slump (cm) 19 19 20 20 fc,28 (Mpa) 29,3 36 52,7 56,7
(b)
Mixture
Proportions NCC 20/25 Siliceous
NCC 25/30 Siliceous
NCC 30/37 Siliceous
NCC 35/45 Siliceous
Cement (IIΑ/Μ42.5N) 330 350 430 430
Silica Fume - - - 20 Silicate
natural Sand 430 280 530 510
Limestone crushed Sand 655 610 385 385
Aggregates 760 850 760 510 Water 212 200 200 160
W/Paste 0,64 0,57 0,47 0,50 Superpl/zer 1% 1% 1% 1% Slump (cm) 20 19 18 17 fc,28 (Mpa) 30,6 41,6 47,3 53
© 2007 WIT PressWIT Transactions on Modelling and Simulation, Vol 46, www.witpress.com, ISSN 1743-355X (on-line)
Computational Methods and Experimental Measurements XIII 657

Table 1: Continued.
(c)
Mixture Proportions
SCC 20/25 Limestone
SCC 25/30 Limestone
SCC 30/37 Limestone
SCC 35/45 Limestone
Cement (IIΑ/Μ42.5N) 301,6 336 374 435
Silica Fume - - - 20 Limestone Filler 184,2 136 104 100 Siliceous Sand - - - -
Limestone Sand 861,6 916 898 808 Aggregates 800 800 800 800
Water 186,8 173,6 180,6 192,2 W/Paste 0,62 0,52 0,48 0,42
Superpl/zer 1,27% 1,63% 1,88% 1,51% Slump Flow (cm) 75,5 75,5 77 76 L-Box (H2/H1) 0,92 0,88 0,88 0,86 V-funnel (sec) 6,5 10,5 10 13,16
J-ring (cm) 0,5 0,5 0,5 0,5 fc,28 (Mpa) 35,8 48,3 50 55,3
(d)
Mixture
Proportions SCC 20/25 Siliceous
SCC 25/30 Siliceous
SCC 30/37 Siliceous
SCC 35/45 Siliceous
Cement (IIΑ/Μ42.5N) 337,2 353,4 432 435,8
Silica Fume - - - 20 Limestone Filler 206 144 120 100 Siliceous Sand 808 897,6 808 807,2
Limestone Sand - - - - Aggregates 800 800 800 800
Water 187,6 171,7 189,4 192,2 W/Paste 0,56 0,49 0,44 0,44
Superpl/zer 1,61% 1,85% 1,88% 1,51% Slump Flow (cm) 77,5 71,5 77 70 L-Box (H2/H1) 0,97 0,8 0,93 0,85 V-funnel (sec) 6 11,47 7,25 6,78
J-ring (cm) 0,5 0,5 0,6 0,5 fc,28 (Mpa) 36,5 47,3 52,9 58,3
3 Hydration equation of cements
The cement hydration equation came forward for the first time in 1993 by Sideris [5]. The two phases of hydration (first and second phase) expressed by a hydration criterion K, are represented by straight lines in the coordinate system
© 2007 WIT PressWIT Transactions on Modelling and Simulation, Vol 46, www.witpress.com, ISSN 1743-355X (on-line)
658 Computational Methods and Experimental Measurements XIII

(K - (1/t) p). The quantitative expression of hydration in relation to time t is given by the equation:
( )ptbKK /1×±= ∞ or
( ) ptbKK −∞ ×±= /1 (1)
where:
Κ = Hydration Criterion. Κ∞= Constant variable (intersection of the line with the y-coordinate). b = Line slope. t = Hydration time (days), (t>>0). Final hydration time = 15 years for
curing temperatures of 5 - 60 oC and adequate relative humidity >90 %.
p = Hydration number of the cement used for mixture production. This coefficient depends only on the chemical cement composition.
The term hydration criterion envelopes any given established hydration criterion, of cement or concrete hydration, the way it is analyzed by Sideris and Sideris [2]. In the case of the compressive concrete strength criterion (fc) the general equation (1) transforms to
pc tbff −
∞ ×−= (2)
The application of the hydration equation procedure is analytically presented by Sideris and Sideris [3]. According to this procedure the hydration equations of the produced self compacting and conventional mixtures were determined. The hydration number p was defined in mortar specimens. The values which came up from coefficient p were later on used for linear correlation among fcmeas-t-p pairs (where fcmeas is the measured values of the concretes under study and t-p the corresponding hydration age (in days) raised in minus p) in order to define the compressive strength equations of the sixteen concretes which are under study. The procedure is presented suggestively in table 2 for the case of self compacting concretes using cement originated from Athens and limestone aggregates. The hydration equations of all mixtures the way the came up after the process mentioned above are listed in table 3. The graph of these equations is a straight line in the diagram of fc-t-p
, where fc stands for compressive strength (measured in Mpa) and t-p
stands for the modified time scale (t in days and p the hydration number of cement and the other cementitious materials which were used for this specific concrete production). By using these equations, one can achieve the calculation of the compressive strength which concrete mixtures develop in any age until the hydration end (15 years or 5475 days). These values are named as measured compressive strength values (fc,calc) and do not really differ from the experimental fc,meas values.
© 2007 WIT PressWIT Transactions on Modelling and Simulation, Vol 46, www.witpress.com, ISSN 1743-355X (on-line)
Computational Methods and Experimental Measurements XIII 659

Table 2: (a) Hydration equations of self-compacting concretes with CEM II 42.5N and limestone aggregates-strength class C20/25; (b) Hydration equations of self-compacting concretes with CEM II 42.5N and limestone aggregates-strength class C25/30; (c) Hydration equations of self-compacting concretes with CEM II 42.5N and limestone aggregates-strength class C30/37; (d) Hydration equations of self-compacting concretes with CEM II 42.5N and limestone aggregates-strength class C35/45.
(a) SCC-C20/25 Limestone
Hydration Age t (days)
2 7 21 28 90 180 365 730 5475
fc(meas) (MPa) 13,67 24,33 35,33 36,2 36,5 38,27
t-0.424 0,745 0,438 0,275 0,24 0,148 0,111 0,082 0,061 0,026
13,7 24,3 35,3 36,2 36,5 38,3
0,745 0,438 0,275 0,24 0,148 0,111
Hydration number: p = 0,424. Correlation coefficient: r = 0.980979.Standard deviation: s = 2,11145 (%)
Lin
ear
corr
elat
ion
amon
g th
e va
lues
of
fcm
eas –
t-0.4
24
Hydrations equation: fc(calc) = 43.9982 – 40.6362*t-0.424 MPa, t≥2
fc(calc) 13.70 26.19 32.82 34.1 37.97 39.5 40.67 41.52 42.94
(b) SCC-C25/30 Limestone
Hydration Age t (days)
2 7 21 28 90 180 365 730 5475
fc(meas) (MPa) 17 32,5 ---- 47,2 50,2 52,4
t-0.381 0,768 0,477 0,281 0,18 0,138 0,106 0,0811 0,0376
17 32,5 ---- 47,2 50,2 52,4
0,768 0,477 0,314 0,281 0,18 0,138
Hydration number: p = 0,381 Relation coefficient: r = 0.9959.Standard deviation s = 1,554476 (%)
Lin
ear
corr
elat
ion
amon
g th
e va
lues
of
fcm
eas -
t-0.3
81
Hydrations equation: fc(calc) = 61,0937 – 57,6024*t-0.381 MPa, t≥2
fc(calc) 16,86 33,65 43,03 44,91 50,7 53,13 55,0 56,4 58,93
© 2007 WIT PressWIT Transactions on Modelling and Simulation, Vol 46, www.witpress.com, ISSN 1743-355X (on-line)
660 Computational Methods and Experimental Measurements XIII
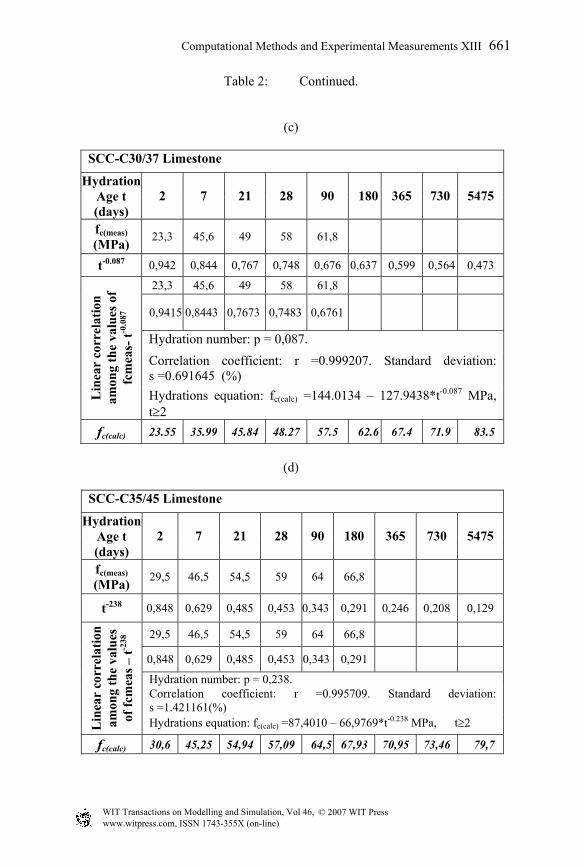
Table 2: Continued.
(c)
SCC-C30/37 Limestone
Hydration Age t (days)
2 7 21 28 90 180 365 730 5475
fc(meas) (MPa) 23,3 45,6 49 58 61,8
t-0.087 0,942 0,844 0,767 0,748 0,676 0,637 0,599 0,564 0,473
23,3 45,6 49 58 61,8
0,9415 0,8443 0,7673 0,7483 0,6761
Hydration number: p = 0,087. Correlation coefficient: r =0.999207. Standard deviation: s =0.691645 (%)
Lin
ear
corr
elat
ion
amon
g th
e va
lues
of
fcm
eas-
t-0.0
87
Hydrations equation: fc(calc) =144.0134 – 127.9438*t-0.087 MPa, t≥2
fc(calc) 23.55 35.99 45.84 48.27 57.5 62.6 67.4 71.9 83.5
(d)
SCC-C35/45 Limestone
Hydration Age t (days)
2 7 21 28 90 180 365 730 5475
fc(meas) (MPa) 29,5 46,5 54,5 59 64 66,8
t-238 0,848 0,629 0,485 0,453 0,343 0,291 0,246 0,208 0,129
29,5 46,5 54,5 59 64 66,8
0,848 0,629 0,485 0,453 0,343 0,291
Hydration number: p = 0,238. Correlation coefficient: r =0.995709. Standard deviation: s =1.421161(%)
Lin
ear
corr
elat
ion
amon
g th
e va
lues
of
fcm
eas –
t-238
Hydrations equation: fc(calc) =87,4010 – 66,9769*t-0.238 MPa, t≥2
fc(calc) 30,6 45,25 54,94 57,09 64,5 67,93 70,95 73,46 79,7
© 2007 WIT PressWIT Transactions on Modelling and Simulation, Vol 46, www.witpress.com, ISSN 1743-355X (on-line)
Computational Methods and Experimental Measurements XIII 661

Table 3: Hydration equations of self compacting (SCC) and conventional (NCC) concretes a) with CEM II 42.5N from Athens and limestone aggregates (L) and b) with CEM II 42.5N from Thessalonica and siliceous aggregates (S)
SCC-20/25 L fc(calc) = 43.9982 – 40.6362*t-0.424, r = 0.980979,s = 2,111445 SCC-25/30 L fc(calc) =61,0937 – 57,6024*t-0.381, r = 0.9959,s = 1,554476 SCC-30/37 L fc(calc) =144.0134 – 127.9438*t-0.087, r =0.999207,s =0.691645 SCC-35/45 L fc(calc) =87,4010 – 66,9769*t-0.238, r =0.995709,s =1.421161 SCC-20/25 S fc(calc) = 75,4647 – 62,4647*t-0.224, r = 0.994447,s = 1,471585 SCC-25/30 S fc(calc) = 69,3884 – 44,0293*t-0.253, r = 0.986597,s = 1,700644 SCC-30/37 S fc(calc) =82,9112 – 70,3783*t-0.298, r =0.991974,s =2.355236 SCC-35/45 S fc(calc) =85,9980 – 64,8322*t-0.238, r =0.993301, s =1.716112 NCC-20/25 L fc(calc) = 33,2357 – 27,6425*t-0.422, r = 0.986239,s = 1,213672 NCC-25/30 L fc(calc) = 38,1373 – 15,88879*t-0.422, r = 0.975240,s = 1,58887 NCC-30/37 L fc(calc) = 65,4272 – 61,6919*t-0.422, r =0.997443,s =1,331999 NCC-35/45 L fc(calc) = 77,2356 – 57,7096*t-0.238, r =0.993134,s =1.774112 NCC-20/25 S fc(calc) = 51,0120 – 42,4016*t-0.36, r = 0.989084,s = 1,626802 NCC-25/30 S fc(calc) = 52,4366 – 34,8214*t-0.36, r = 0.999773,s = 0,127685 NCC-30/37 S fc(calc) = 57,5746 – 26,8129*t-0.36, r =0.990374,s =1,077980 NCC-35/45 S fc(calc) = 77,6585 – 64,6109*t-0.236, r =0.989448,s =2,152820
4 Results and analysis
The equation graphs from Table 3 are presented for all mixtures produced in Figure 1. The mixture compressive strength alteration is comparably presented for self compacting (SCC) and conventional (NCC) concretes of all strength classes in Figure 2. The diagrams were drawn using the measured compressive strength values (fccalc) as they were calculated from the corresponding hydration equations. While studying those diagrams one can realise the alternation in the compressive strength development which self compacting mixtures have. Even though these mixtures were produced with the same cement quantity and similar w/c number compared to conventional concretes of the same strength class (table 1), they appear to have different compressive strength development, especially after the age of 7 days. This is mainly attributed to better grain placement from which the paste consists of: The use of great quantities of fine material (limestone filler) has as a result the filling of the gaps which are created after the formation of calcium-siliceous hydrous and finally the decrease in the active porosity of self compacting concretes (De Schutter et al. [6], Audenaert and De Schutter [7], Träghård and De Schutter [8], Audenaert et al. [9], Popee and De Schutter [10], Audenaert et al. [11]). This phenomenon leads to increased compressive strength of self compacting concretes. This increase gains is significance after the age of 7 days.
© 2007 WIT PressWIT Transactions on Modelling and Simulation, Vol 46, www.witpress.com, ISSN 1743-355X (on-line)
662 Computational Methods and Experimental Measurements XIII

0 0.2 0.4 0.6 0.8 1
0
20
40
60
80
100
SCC 20/25 Limestone
SCC 25/30 LimestoneSCC 30/37 LimestoneSCC 35/45 Limestone t-p
f c (M
Pa)
0 0.2 0.4 0.6 0.8 1
0
20
40
60
80
SCC 20/25 Siliceous
SCC 25/30 SiliceousSCC 30/37 SiliceousSCC 35/45 Siliceous
f c (M
Pa)
t-p
(a) (b)
0 0.2 0.4 0.6 0.8 1
0
20
40
60
80NCC 20/25 LimestoneNCC 25/30 LimestoneNCC 30/37 LimestoneNCC 35/45 Limestone
f c (M
Pa)
t-p
0 0.2 0.4 0.6 0.8 1
0
20
40
60
80
f c (M
Pa)
t-p
NCC 20/25 Siliceous
NCC 25/30 SiliceousNCC 30/37 SiliceousNCC 35/45 Siliceous
(c) (d)
Figure 1: Hydration equations of a) SCC concretes using limestone aggregates, b) SCC using siliceous aggregates, c) NCC concretes using limestone aggregates and d) NCC using siliceous aggregates in the modified time scale t-p (p values from Table 3).
The ratio of the compressive strength in the age of 7 days to the strength in the age of 28 days and 15 years (5475 days) as well as the degree of hydration at the ages of 7, 28, 365 and 5475 days are presented for all mixtures in Table 4. The calculations took place with reference to measured values of the mixture compressive strength in every age (fc, calc), which were defined by the equations in Table 3.
© 2007 WIT PressWIT Transactions on Modelling and Simulation, Vol 46, www.witpress.com, ISSN 1743-355X (on-line)
Computational Methods and Experimental Measurements XIII 663

0
20
40
60
80SCC-C20/25 Limestone
SCC-C25/30 Limestone
NCC-C25/30 Limestone
NCC-C20/25 Limestone
28 days 1 year 15 years
f c (M
Pa)
0
20
40
60
80
100SCC-C30/37 Limestone
NCC-C35/45 Limestone
NCC-C35/45 Limestone
NCC-C30/37 Limestone
28 days 1 year 15 years
f c (M
Pa)
(a) (b)
0
20
40
60
80
SCC-C20/25 Siliceous
SCC-C25/30 Siliceous
NCC-C25/30 Siliceous
NCC-C20/25 Siliceous
28 days 1 year 15 years
f c (M
Pa)
0
20
40
60
80
SCC-C30/37 Siliceous
SCC-C35/45 Siliceous
NCC-C35/45 Siliceous
NCC-C30/37 SIliceous
28 days 1 year 15 years
f c (M
Pa)
(c) (d)
Figure 2: Comparable diagrams of the compressive strength development of a) SCC and NCC concretes C20/25 και C25/30 using limestone aggregates, b) SCC and NCC concretes C30/37 και C35/45 using limestone aggregates, c) SCC and ΝCC concretes C20/25 και C25/30 using siliceous aggregates and d) SCC and ΝCC concretes C30/37 και C35/45 using siliceous aggregates
After studying Table 4, the difference in the development of self compacting concretes’ strength among 7 and 28 days, as well as in later ages (365 days and 15 years), becomes more than clear. Ratios f7/f28 and f7/f5475 are lesser in SCCs compared to NCC of the same strength class, which as a fact indicates that the increase of the compressive strength after the age of 7 days is greater in SCCs compared to NCCs of the same strength class. Indeed the compressive strength of the SCCs in the age of 28 days appears to be greater from 26 to 61%
© 2007 WIT PressWIT Transactions on Modelling and Simulation, Vol 46, www.witpress.com, ISSN 1743-355X (on-line)
664 Computational Methods and Experimental Measurements XIII

compared to the strength of 7 days when the corresponding increase percentage in NCCs is in the order of magnitude of 19-31%. The respective percentages for the age of one year vary among 55 and 74% for the SCCs and 36 to 57% for NCCs. For the final hydration age (15 years) the respective percentages are 63 to 110% for SCCs and only 41 to 70% for NCCs.
Table 4: Ratios f7/f28 and f7/f5475, degree of hydration at the ages of 7, 28, 365 and 5475 days for all produced mixtures.
f7/f28 f7/f5475 α7 α28 α365 α5475
SCC20/25 L 0,76833 0,61015 0,61015 0,79413 0,94714 1,00 SCC25/30 L 0,62347 0,47514 0,47514 0,76209 0,93331 1,00 SCC30/37 L 0,7456 0,500 0,500 0,67116 0,87013 1.00 SCC35/45 L 0,79261 0,57446 0,57446 0,72477 0,9007 1,00 SCC20/25 S 0,76489 0,52832 0,52832 0,69072 0,88581 1,00 SCC25/30 S 0,84219 0,65963 0,65963 0,78323 0,92376 1,00 SCC30/37 S 0,76351 0,56136 0,56136 0,73351 0,91341 1,00 SCC35/45 S 0,79773 0,58109 0,58109 0,72842 0,90156 1,00 NCC20/25 L 0,7963 0,64831 0,64831 0,81415 0,95231 1,00 NCC25/30 L 0,83513 0,70505 0,70505 0,84424 0,95912 1,00 NCC30/37 L 0,76143 0,60031 0,60031 0,7884 0,9453 1,00 NCC35/45 L 0,80047 0,58625 0,58625 0,73238 0,90344 1,00 NCC20/25 S 0,78394 0,61051 0,61051 0,77877 0,93583 1,00 NCC25/30 S 0,83783 0,69014 0,69014 0,82373 0,94865 1,00 NCC30/37 S 0,89434 0,78549 0,78549 0,87828 0,96451 1,00 NCC35/45 S 0,7640 0,53252 0,53252 0,69702 0,89043 1,00
In every case SCCs appear to have greater increase in their compressive strength when compared with NCC of the same strength class. The greater increase percentages appear in strength classes such as C20/25 and C25/30 due to greater limestone filler quantity that is added to the mixture. On the other hand, when the case is self compacting concretes of high strength class such as C35/45 then no limestone filler is used. Even though these mixtures developed higher strength compared to the corresponding conventional C35/45, they didn’t really differ in the f7/f28 and f7/f5475 ratios or in the degree of hydration in the ages of 7, 28 and 365 days. More than significant is the increase in the mixture compressive strength after the age of 28 days. It is well known that the strength in that particular age is the one which is taken into consideration about the structural calculations. But in structures the sum of the planning loads are really taken into consideration in ages not less than one year. This variation (f365-f28) indicates a security coefficient for structures. Compressive strength in the age of one year increases in SCC mixtures by 20 to 30% compared to the 28 days strength, when the corresponding percentage for NCCs is among 13 and 23%. If the security coefficient (f365-f28) for the same strength class concretes is examined using the
© 2007 WIT PressWIT Transactions on Modelling and Simulation, Vol 46, www.witpress.com, ISSN 1743-355X (on-line)
Computational Methods and Experimental Measurements XIII 665

equations of Table 4, it will become clear that it is every time by 25 to 40% greater for the case of SCC mixtures. It can then be said that the different development rate as far as strength is concerned, after the age of 28 days gives to self compacting concrete mixtures an extra security coefficient.
5 Conclusions
Self compacting concrete mixtures which are produced with limestone filler appear to have difference in compressive strength in the age of 7 days. Not only the f7/f28 and f7/f5475 ratios but also the degree of hydration at the ages of 7, 28 and 365 days are lesser compared to the same number in conventional concretes of the same strength class which were produced with the same cement amount and the same w/c ratio. This fact is independent of the strength class, the cement origin and the aggregates type (limestone or siliceous). The compressive strength development in later ages indicates an extra security coefficient for these mixtures. For the production of self compacting concretes of high strength class such as C35/45 no limestone filler amount was used. Even though these mixtures developed grater strength compared to the corresponding conventional concretes, they did not really differ in the f7/f28 and f7/f5475 ratios nor in their hydration degrees at the ages of 7, 28 and 365 days. After all it seems that the addition of limestone filler is the main reason which caused the different rate in the compressive strength development of self compacting concretes in later ages.
References
[1] RILEM (1999): Self-Compacting Concrete”, State of the art Report of RILEM Technical Committee 174-SCC, Skarendahl Å. and Petersson Ö. Editors, p.154.
[2] Sideris K., Sideris K.K. (2003a): Ten Years Cement Hydration Equation and its Applications to Chemistry and Physics of cement paste, mortar and concrete, Xanthi 2003, ISBN 960-343-722-0. Chapter 1: Ten Years Cement Hydration Equation, p. 1-24.
[3] Sideris K., Sideris K.K. (2003b): Ten Years Cement Hydration Equation and its Applications to Chemistry and Physics of cement paste, mortar and concrete, Xanthi 2003, ISBN 960-343-722-0. Chapter 2: Application procedures of Cement Hydration Equation, p. 25-38.
[4] ΒIBM, CEMBUREAU, EFCA, EFNARC, ERMCO (2005): European Guidelines for Self-Compacting Concrete: Specification, Production and Use, May 2005, downloadable from www.efnarc.org
[5] Sideris K. (1993) The cement hydration equation, Zement-Kalk-Gips, 12 (1993), Edition B, pp. E337-E344.
[6] De Schutter, G., Audenaert, K., Boel, V., Vandewalle L., Dupont, D., Heirman, G., Vantomme, J., D’Hemricourt, J. (2003). Transport properties in self consolidating concrete and relation with durability: Overview of a Belgian research project”, Proc., Third Int. Symp. on SCC,
© 2007 WIT PressWIT Transactions on Modelling and Simulation, Vol 46, www.witpress.com, ISSN 1743-355X (on-line)
666 Computational Methods and Experimental Measurements XIII

RILEM, Reykjavik, Iceland, Wallenik O. and Nielsson I. Editors, 799-807.
[7] Audenaert K., Boel, V., De Schutter, G. (2003). Water permeability of self-consolidating concrete, Proc., 11th Int. Congr. Chem. of Cem., Durban, South Africa, Grieve G. and Owens G. Editors, 1574-1584.
[8] Träghård, Jan. (1999): Microstructural features and related properties of self-consolidating concrete”, Proc. First Int. Symp. on SCC, RILEM, Stockholm, Sweden, Skarendahl Å. And Petersson ö. Editors, 175-186
[9] Audenaert, K., De Schutter, G. (2003). Chloride penetration in self consolidating concrete, Proc., Third Int. Symp. on SCC, RILEM, Reykjavik, Iceland, 818-825.
[10] Popee, A-M., De Schutter, G. (2005). Creep and Shrinkage of self-consolidating concrete”, Proc., Design Performance and Use of SCC, Changsha, Hunan, China, Yu Z., Shi C., Khayat K.H. and Xie Y. Editors, 329-336.
[11] Audenaert, K., Boel, V., De Schutter, G. (2005). Chloride penetration in self-consolidating concrete by cyclic immersion”, Proc., Design Performance and Use of SCC, Changsha, Hunan, China, Yu Z., Shi C., Khayat K.H. and Xie Y. Editors, 355-362.
© 2007 WIT PressWIT Transactions on Modelling and Simulation, Vol 46, www.witpress.com, ISSN 1743-355X (on-line)
Computational Methods and Experimental Measurements XIII 667