Embed Size (px)
Citation preview

NOTE: This one-hour presentation was one of two prepared for the undergraduate students’ conference during the “Geoscience Africa 2004” Conference organized by the Geological Society of South Africa in Johannesburg, July 8-16, 2004. They were part of the didactic portion of the conference to stimulate undergraduate geology students from many parts of the African continent.
Application of spontaneous potential profiles for exploration of gold-rich epithermal low sulphidation veins in a humid region
Alberto Lobo-Guerrero
Economic Geology Research Institute, University of the Witwatersrand, Private Bag 3, WITS 2050, Johannesburg, South Africa; Email: [email protected]
This paper presents results obtained during exploration of gold-rich quartz veins in low mountain, humid environments of the Colombian Andes, South America. Spontaneous potential profiling was used to evaluate strike-slip duplex structures and to locate gold-rich veins in extensional zones of a vein system. Six days of total fieldwork helped to model the deposit, and provided ideas on where to continue exploring with trenches. Similar exploration techniques may be applied to greenstone belt-hosted mesothermal shear zones and some epithermal base-metal deposits.
The oxidation of sulphides in sulphide-bearing veins or fractures generates small electric currents. Sulphide-poor host rocks produce a significant potential contrast. Spontaneous potential methods take advantage of that contrast: zones with higher concentration of sulphides in oxidation produce potential anomalies that stand out well below the local base level. Measuring techniques have to be adapted to climate.
The prospective zone was covered by soil and vegetation and it had only minor outcrops of pyroclastic rocks, quartz ridges with features of epithermal metallic mineralisation, and coarse quartz float. Stories of an old miner that panned coarse gold from a dry creek were all evidence of mineralisation. Effective response to spontaneous potential profiling was first tested. A total of six fieldwork days and their corresponding evening interpretation, progressively provided information to define a series of five gold-mineralised quartz veins. These were emplaced in extensional zones around strike-slip duplexes. Spontaneous potential profiles helped to trace veins from outcrop into completely covered terrain.
Colour-coding was used to interpret anomalies and non-anomalous ground. Profile orientation was important; better results were obtained when profiles intersected potential mineralised structures at right angles. The structure defined by trenching was very similar to that delineated with spontaneous potential profiling. Five mineralised veins, each 400 meters long, were discovered. The project is currently under evaluation.
Introduction: The author has successfully used spontaneous potential profiling for the exploration of mesothermal and epithermal veins in water-saturated soils of glaciated environments (Ontario and Quebec, Canada during non-winter seasons), tropical environments of the northern Andean Cordillera (several locations of Colombia and Ecuador), as well as coastal and high-mountain arid environments of Peru. This paper presents results obtained during the exploration of low sulphidation, epithermal gold-rich quartz veins in a
low mountain, humid environment1. Other case studies using the spontaneous potential method in high mountain, arid environments are being presented elsewhere.
The Method of Spontaneous Potential Profiling: Natural oxidation-reduction processes generate small electrical potentials that can be measured and mapped on the ground. In general lines, the oxidation of a mineral such as pyrite, transforms iron sulphide into iron oxide. That process generates free electrons that manifest themselves as a negatively charged electrical current. The opposite phenomenon is produced by biological activity that reduces substances providing energy. Thus, small “batteries” or electrical potential dipoles are formed underground, generating currents that normally are under one volt. Measuring such small quantities in the ground, requires special electrodes that do not polarize as they are introduced in the soil.
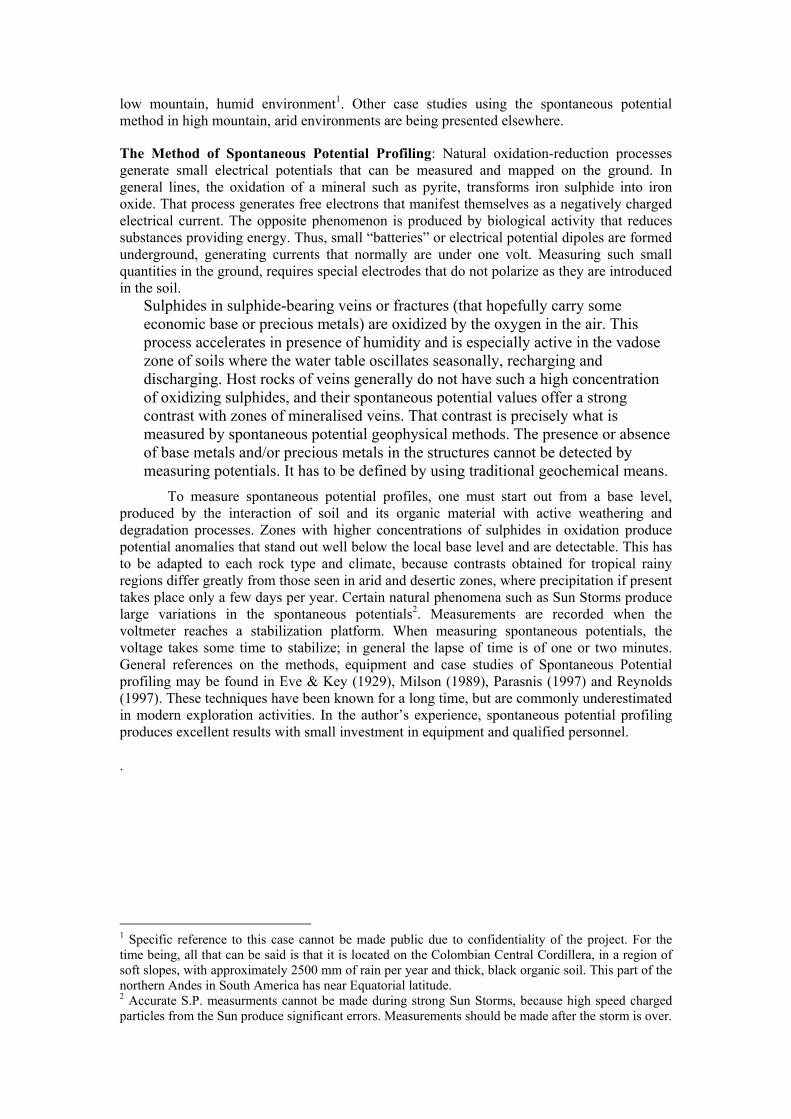
Sulphides in sulphide-bearing veins or fractures (that hopefully carry some economic base or precious metals) are oxidized by the oxygen in the air. This process accelerates in presence of humidity and is especially active in the vadose zone of soils where the water table oscillates seasonally, recharging and discharging. Host rocks of veins generally do not have such a high concentration of oxidizing sulphides, and their spontaneous potential values offer a strong contrast with zones of mineralised veins. That contrast is precisely what is measured by spontaneous potential geophysical methods. The presence or absence of base metals and/or precious metals in the structures cannot be detected by measuring potentials. It has to be defined by using traditional geochemical means.
To measure spontaneous potential profiles, one must start out from a base level, produced by the interaction of soil and its organic material with active weathering and degradation processes. Zones with higher concentrations of sulphides in oxidation produce potential anomalies that stand out well below the local base level and are detectable. This has to be adapted to each rock type and climate, because contrasts obtained for tropical rainy regions differ greatly from those seen in arid and desertic zones, where precipitation if present takes place only a few days per year. Certain natural phenomena such as Sun Storms produce large variations in the spontaneous potentials2. Measurements are recorded when the voltmeter reaches a stabilization platform. When measuring spontaneous potentials, the voltage takes some time to stabilize; in general the lapse of time is of one or two minutes. General references on the methods, equipment and case studies of Spontaneous Potential profiling may be found in Eve & Key (1929), Milson (1989), Parasnis (1997) and Reynolds (1997). These techniques have been known for a long time, but are commonly underestimated in modern exploration activities. In the author’s experience, spontaneous potential profiling produces excellent results with small investment in equipment and qualified personnel. .
1 Specific reference to this case cannot be made public due to confidentiality of the project. For the time being, all that can be said is that it is located on the Colombian Central Cordillera, in a region of soft slopes, with approximately 2500 mm of rain per year and thick, black organic soil. This part of the northern Andes in South America has near Equatorial latitude. 2 Accurate S.P. measurments cannot be made during strong Sun Storms, because high speed charged particles from the Sun produce significant errors. Measurements should be made after the storm is over.

Figure 1. Generalised geology of the exploration site. Figure 2. First round of S.P.
profiles to test response of area.
Generalised geology of the exploration site: Below is a review of all the information available on the prospective zone, as compiled into the map of Fig. 1. Most of the region is covered by vegetation and soils. There are some outcrops of the Manito Formation conformed by welded tuff sequences and various pyroclastic deposits with sub-horizontal stratification. An alignment of quartz ridges intersects the volcanic rocks. It contains multiple brecciation events, incipient chalcedonic banding, null metallic mineralisation and some relicts of pyrite. A further review of the zone south of the quartz crests as shown on Fig. 1, revealed milky quartz float with intercrossing dark grey quartz, druzes and abundant goethite in some angular vugs. Multiple SiO2 events, brecciation and gossanous vugs looked promising for exploration. Inhabitants of the region remember that the camp of an old miner was located along the creek that runs to the SW of the region with quartz float (marked by a star). The miner spent several rainy seasons panning coarse gold there. According to old inhabitants, the man found nuggets “the size of a thumb”3. Colluvial deposits a few meters thick cover most of the mapped area.
Exploration procedure and interpretation: This zone was perceived to be prospective for gold, but there were very few hints of how and where to focus exploration efforts. Outcrops offered little useful information. The author thought that measuring some spontaneous potential profiles and spending a few days of work could help to refine the geological model and identify exploration targets.
Profiles 1, 2 and 3 of Fig. 2 were obtained during the first two days of field work.
Note the length of the profiles (approximately 800 m). Complete results were compiled and
processed at the end of each work day and they helped to program the next day’s activities. A
potential anomaly produced by the quartz ridges was effectively proven. Furthermore, several
3 Three centimeters wide.
branches of the main structure were seen up slope and down slope from the goethite-rich
quartz float.
Two additional days of field work were needed to produce four more infill profiles (4, 5, 6 and 7), as shown on Fig. 3. The job was more time-effective due to better experience of the field workers. The main alignment with the quartz ridges seemed to bend slightly (Fig.4). A set of structures that seemed to spread from the main alignment was defined progressively. Data obtained in Profiles 1 to 7 are drawn on Fig. 4. Dark dots4 are detected anomalies and thick grey lines5 are zones without anomalies. Negative potentials in the profiles have been plotted southward. Probable alignments stand out when joining the dark points. Profile 6 showed anomalies near the larger fragments of iron oxide-rich quartz float. It seemed that there was another set of aligned anomalies to the south. It could have been due to a fault, another vein unrelated to the first, or a strike-slip duplex (sigmoidal structure). These were some of the possible alternatives that needed investigation. In the last case, the best way to test components of duplexes was to intersect them perpendicularly. The next set of profiles was planned with that in mind.
Two more days of work were used to produce profiles 8, 9, 10 and 11 (Fig. 5). These were oriented diagonally, as discussed above. Several sets of anomalies that could be drawn based on these profiles. They could be grouped in sets of two and three. Information from the grey lines (Fig. 6) was very valuable, since it allowed definition of zones without anomalies and delimitation of bodies without oxidizing sulphides. It seemed that we had defined a structure. Data obtained from the profiles was drawn on Fig. 6. The project was getting better every minute.
We then started to define some exploration objectives. We even drew a deformation strike-slip ellipsoid that could help us to better define zones of greater distension and probable mineralisation in the environs. The gold seemed to come from structures with NW-SE orientation. Other structures seemed not to carry economic quantities of gold. Rich ore shoots seemed to occur at the intersection of corners of duplexes.
These hypotheses were proven with additional geochemical evaluation. The complete structure, as defined finally with the help of trenches was very similar to that of Fig. 6. Sampling results and underground works were very positive. The project is currently under evaluation and results are confidential.
Conclusion: Spontaneous potential profiles served their purpose. Six days of total field work helped to define the structural model of the deposit, and provided ideas on where to continue exploring with trenches. The development of this prospect no longer went blindfolded. Similar exploration can take place in greenstone belt-hosted mesothermal shear zones and in other epithermal base-metal deposits.
References: Eve, A.S. & Keys, M.A., 1929, Electrical methods and spontaneous potential, in Applied Geophysics in
the Search for Minerals, McGill University, Montreal, Canada, Cambridge University Press, Cambridge, 53-82.
Milson, J., 1989, Field geophysics, Geological Society of London Handbook, Open University Press, Milton Keynes, 182p.
Parasnis, D., 1997, Electrical methods, in Principles of Applied Geophysics, 5th ed., (University of Lulea, Sweden) Chapman & Hall, London, 104-121.
Reynolds, J.M. 1997, Spontaneous (Self) Potentials in An Introduction to Applied and Environmental Geophysics, John Wiley & Sons, Toronto, 491-521.
4 Red dots were originally used, instead of black dots. 5 Green lines were originally used, instead of gray lines.

Figure 3. Second round of S.P. profiles to fill in area tested initially. Figure 4. Interpretation of the first two sets of profiles.
Figure 5. Diagonal profiles to test joining structures. Figure 6. Final interpretation of all
the S.P. profiles.