Embed Size (px)
Citation preview
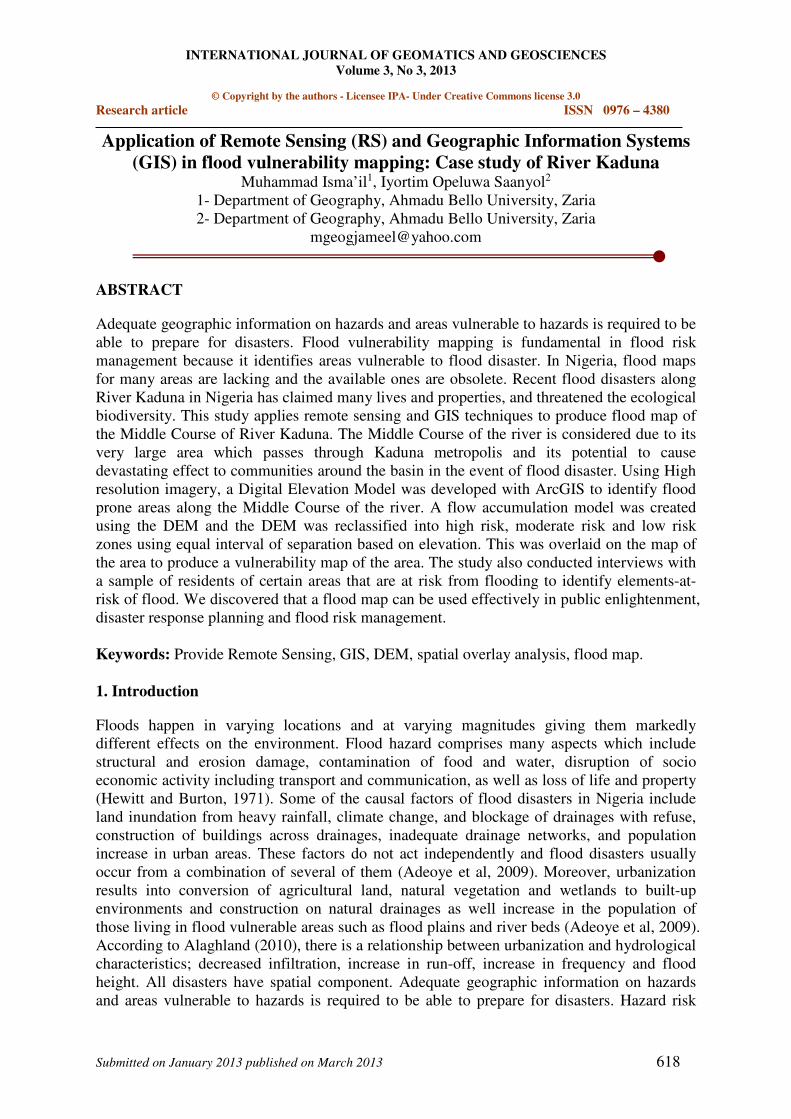
INTERNATIONAL JOURNAL OF GEOMATICS AND GEOSCIENCES
Volume 3, No 3, 2013
© Copyright by the authors - Licensee IPA- Under Creative Commons license 3.0
Research article ISSN 0976 – 4380
Submitted on January 2013 published on March 2013 618
Application of Remote Sensing (RS) and Geographic Information Systems
(GIS) in flood vulnerability mapping: Case study of River Kaduna Muhammad Isma’il1, Iyortim Opeluwa Saanyol2
1- Department of Geography, Ahmadu Bello University, Zaria
2- Department of Geography, Ahmadu Bello University, Zaria
ABSTRACT
Adequate geographic information on hazards and areas vulnerable to hazards is required to be
able to prepare for disasters. Flood vulnerability mapping is fundamental in flood risk
management because it identifies areas vulnerable to flood disaster. In Nigeria, flood maps
for many areas are lacking and the available ones are obsolete. Recent flood disasters along
River Kaduna in Nigeria has claimed many lives and properties, and threatened the ecological
biodiversity. This study applies remote sensing and GIS techniques to produce flood map of
the Middle Course of River Kaduna. The Middle Course of the river is considered due to its
very large area which passes through Kaduna metropolis and its potential to cause
devastating effect to communities around the basin in the event of flood disaster. Using High
resolution imagery, a Digital Elevation Model was developed with ArcGIS to identify flood
prone areas along the Middle Course of the river. A flow accumulation model was created
using the DEM and the DEM was reclassified into high risk, moderate risk and low risk
zones using equal interval of separation based on elevation. This was overlaid on the map of
the area to produce a vulnerability map of the area. The study also conducted interviews with
a sample of residents of certain areas that are at risk from flooding to identify elements-at-
risk of flood. We discovered that a flood map can be used effectively in public enlightenment,
disaster response planning and flood risk management.
Keywords: Provide Remote Sensing, GIS, DEM, spatial overlay analysis, flood map.
1. Introduction
Floods happen in varying locations and at varying magnitudes giving them markedly
different effects on the environment. Flood hazard comprises many aspects which include
structural and erosion damage, contamination of food and water, disruption of socio
economic activity including transport and communication, as well as loss of life and property
(Hewitt and Burton, 1971). Some of the causal factors of flood disasters in Nigeria include
land inundation from heavy rainfall, climate change, and blockage of drainages with refuse,
construction of buildings across drainages, inadequate drainage networks, and population
increase in urban areas. These factors do not act independently and flood disasters usually
occur from a combination of several of them (Adeoye et al, 2009). Moreover, urbanization
results into conversion of agricultural land, natural vegetation and wetlands to built-up
environments and construction on natural drainages as well increase in the population of
those living in flood vulnerable areas such as flood plains and river beds (Adeoye et al, 2009).
According to Alaghland (2010), there is a relationship between urbanization and hydrological
characteristics; decreased infiltration, increase in run-off, increase in frequency and flood
height. All disasters have spatial component. Adequate geographic information on hazards
and areas vulnerable to hazards is required to be able to prepare for disasters. Hazard risk
Application of Remote Sensing (RS) and Geographic Information Systems (GIS) in flood vulnerability
mapping
Muhammad Isma’il, Iyortim Opeluwa Saanyol
International Journal of Geomatics and Geosciences
Volume 3 Issue 3, 2013 619
vulnerability mapping is considered one of the most important steps in disaster risk reduction
because it identifies areas vulnerable to disaster so as to plan for disaster risk management.
Remotely sensed imagery and GIS can be very effective in identifying the spatial component
of flood for management. Remote sensing offers a synoptic view of the spatial distribution
and dynamic of hydrological phenomena such as flood and erosion. They are used to measure
and monitor the extent of flooded areas, provide a quantifiable estimate of the land area and
infrastructure affected by flooding and erosion (Izinyon, 2011). Nigeria has been slow to
realize the potential possessed by remote sensing and GIS in flood disaster management. This
is confirmed by the response to the recent flood disasters that have affected more than 23
states of the country, claimed many lives and properties, and threatened the ecological
biodiversity. Mitigation of flood disaster can be successful only when detailed knowledge is
obtained about the expected frequency, character and magnitude of hazardous events in an
area as well as the vulnerabilities of the people, buildings, infrastructure and economic
activities in a potentially dangerous area. Unfortunately this detailed knowledge is always
lacking in most urban centers of the developing world like Nigeria (Ishaya et al, 2009).
Goel et al (2005) presented the technique for preparation of flood hazard maps which include
development of digital elevation model and simulation of flood flows of different return
periods. Bhadra et al (2011) proved that GIS technique is effective in extracting the flood
inundation extent in a time and cost effective manner for the remotely located hilly basin of
Dikrong, where conducting conventional surveys is very difficult. Thilagavathi (2011) used
GIS to demarcate the flood hazard prone areas in the Papanasam Taluk into five zones of
varying degrees of flooding. Moreover, Orok (2011) stated that a flood risk map should be
able to identify the areas that are most vulnerable to flooding and estimate the number of
people that will be affected by floods in a particular area. In Nigeria, hazard vulnerability
maps for many areas are lacking and the available ones are obsolete. Ishaya et al (2009)
created digital terrain maps and flood vulnerability maps of Gwagwalada in Abuja showing
the areas that were highly vulnerable, less vulnerable and areas vulnerable to flood disaster.
Jeb and Aggarwal (2008) carried out a study with the aim of analyzing flood risk and
modeling plans for flood abatement in Kaduna metropolis. Given the recurrent nature of the
flood problem in Kaduna metropolis, they recommended further research for efficient risk
management system which could estimate the lives at risk due to flooding. This paper
presents flood vulnerability map for the Middle Course of River Kaduna. River Kaduna is
considered due to its very large extent and its potential to cause devastating effect to
communities around the basin. The study utilised high resolution imagery, a Digital Elevation
Model was developed with ArcGIS to identify flood prone areas along the Middle Course of
the river. The DEM was reclassified into high risk, moderate risk and low risk zones using
equal interval of separation based on elevation. Then the vulnerability map of the area was
produced.
2. Study area
The river Kaduna is a tributary of river Niger located between latitude 10°27'15''N -
10°13'5''N and longitude 7°21'48''E - 7°29'36''E. It passes through Kaduna city which is one
of the major trade centers in Nigeria. At approximately 550km long it takes its source from
the Jos plateau and flows across the Kaduna plains in a north westerly direction. It changes to
a south western direction of flow just before entering Kaduna city as the river widens and
begins to meander significantly, marking the beginning of the middle course. It cuts several
gorges through rough terrain between Kaduna and Zungeru (In Niger State), creating river
cliffs along the Kundendan and Tudun Wada areas of the state as well as the beginning of a

Application of Remote Sensing (RS) and Geographic Information Systems (GIS) in flood vulnerability
mapping
Muhammad Isma’il, Iyortim Opeluwa Saanyol
International Journal of Geomatics and Geosciences
Volume 3 Issue 3, 2013 620
pronounced ox-bow lake. Finally the river flows south through the broad level Niger valley
and joins the Niger River near Wuya opposite Pategi having drained about 70, 200 square
kilometers of land area (Alayande and Agunwamba, 2010).
River Kaduna has 2 distinct seasons (Okanlawon 1992): Wet Season between May and
October with an average discharge of 7,200,000m3/day; Dry Season lasting from November
to April with an average discharge of 3,600m3/day. Kaduna State experiences a typical
continental climate with distinct seasonal regimes, alternating between cool to hot dry and
humid to wet seasons. In Kaduna, the seasonality is pronounced with the cool to hot dry
season being longer than the rainy season. High storm intensities in addition to the nature of
the surface run-off build up the good network of medium sized river systems. Increasing
demand for wood fuel and construction materials has led to elimination of vegetation which
serves as flood breaks.
Flood disasters that have inundated large areas along the River Kaduna flood plain claimed
several lives and properties as shown in figure 1. There is therefore a need for efficient flood
hazard mapping of the areas adjacent to the river course in order to adequately mitigate the
damage incurred the next time there is a massive overflow from the river; and also curb the
current rapid urban expansion of settlements into the low lying flood plain by establishing
appropriate land-use legislation.
Figure 1: Google Image of River Kaduna

Application of Remote Sensing (RS) and Geographic Information Systems (GIS) in flood vulnerability
mapping
Muhammad Isma’il, Iyortim Opeluwa Saanyol
International Journal of Geomatics and Geosciences
Volume 3 Issue 3, 2013 621
3. Methodology
3.1 GIS Approach
This study demonstrated using topographic data, remotely sensed imagery, digital elevation
modeling and a smaller study area, the integrated approach of remote sensing and GIS
techniques in flood management. High resolution imagery was required for a clear depiction
of the extent of vulnerability. This high resolution imagery was obtained from the Google
Earth application and analysis was carried out using ARCGIS 9.3 software suite.
In the first phase, the study area was delineated in Google earth, the longitude and latitude
coordinates of the extreme corners were tabulated in a Microsoft excel spread sheet and
combined with an exported image of the study area also from Google earth application, and
used to create a geo-referenced map in the WGS 1984 Geographic coordinate system.
Next, several points within the study area were marked within Google earth and their
coordinates and elevations were recorded in an excel spreadsheet. This data was then
imported into ARCGIS as X, Y and Z data. Interpolation process was carried out, using the
spatial analyst tool to create a digital terrain model.
A flow accumulation model was created using the DEM and the DEM was reclassified into
high risk, moderate risk and low risk using equal interval of separation based on elevation.
This was overlaid on the map of the area to produce a vulnerability map of the area.
3.2 Field Survey
The study also conducted interviews with members of the population within the study area to
aid in reaching adequate conclusions and making relevant recommendations. The interview
consists of 50 respondents drawn from 5 flood prone areas in Kaduna namely; Banarwa,
Railway Station, Kudendan, Sabo and Tudun Wada. Using a structured guideline, inhabitants
of the areas of Kaduna city prone to flood disaster from River Kaduna were interviewed.
Random sampling method was employed in selecting the interviewees.
4. Results and discussion
The aim of this research was to create an accurate flood vulnerability map along the River
Kaduna where it passes through the Kaduna metropolis using simple methodology involving
digital elevation modeling. To fulfill this aim, the following analysis was carried out.
Creation of the vulnerability map was based on the digital elevation model of the Middle
Course of the river as shown in figure 2. It was used to produce the vulnerability map using
the reclassification tool. It should be noted that the area used was taken from the areas at risk
from River Kaduna flood as identified by Jeb and Aggarwal (2008). Using the elevation of
the area, flow accumulation analysis was carried out to discover the natural drainage pattern
of the area. The light colored portions of figure 3 show catchment areas for flood waters,
surface run-off will accumulate in these areas and they will serve as reservoirs for flood
waters. The applications of this model are numerous; it may be used as a basis for designing a
drainage network among other uses.

Application of Remote Sensing (RS) and Geographic Information Systems (GIS) in flood vulnerability
mapping
Muhammad Isma’il, Iyortim Opeluwa Saanyol
International Journal of Geomatics and Geosciences
Volume 3 Issue 3, 2013 622
Figure 2: Digital Elevation Model along the middle course of River Kaduna.
Figure 3: Flow accumulation model along the middle course of River Kaduna
Application of Remote Sensing (RS) and Geographic Information Systems (GIS) in flood vulnerability
mapping
Muhammad Isma’il, Iyortim Opeluwa Saanyol
International Journal of Geomatics and Geosciences
Volume 3 Issue 3, 2013 623
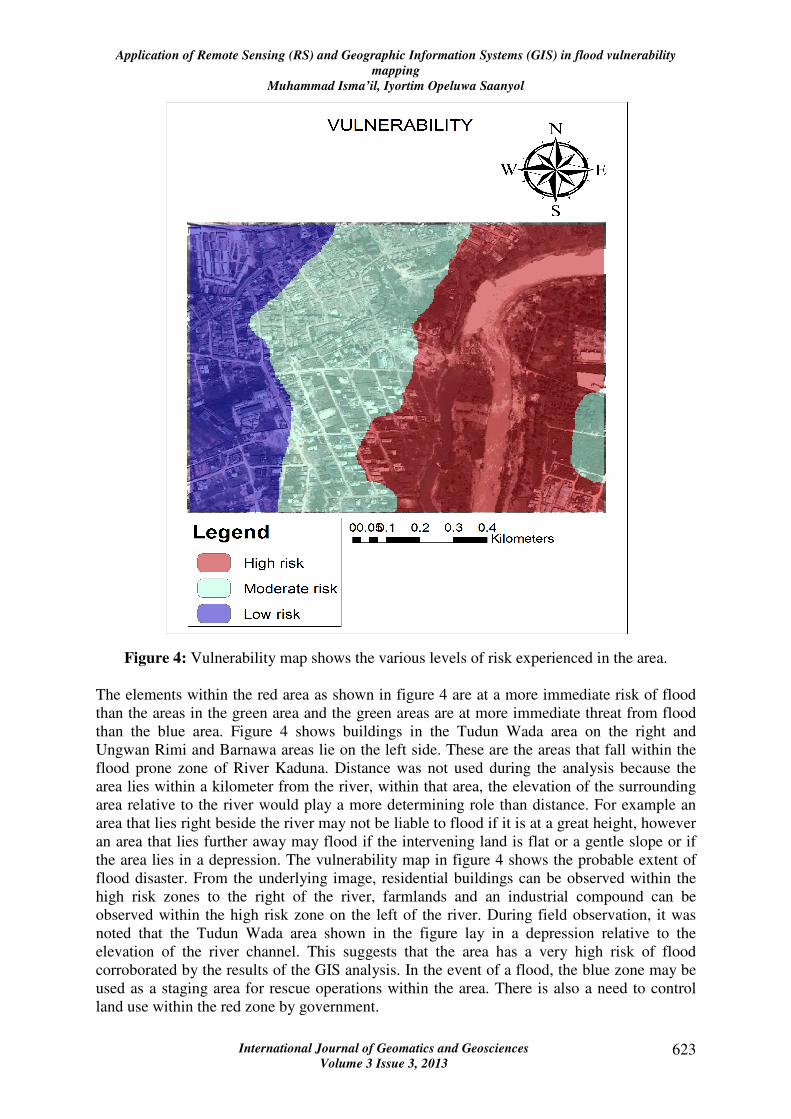
Figure 4: Vulnerability map shows the various levels of risk experienced in the area.
The elements within the red area as shown in figure 4 are at a more immediate risk of flood
than the areas in the green area and the green areas are at more immediate threat from flood
than the blue area. Figure 4 shows buildings in the Tudun Wada area on the right and
Ungwan Rimi and Barnawa areas lie on the left side. These are the areas that fall within the
flood prone zone of River Kaduna. Distance was not used during the analysis because the
area lies within a kilometer from the river, within that area, the elevation of the surrounding
area relative to the river would play a more determining role than distance. For example an
area that lies right beside the river may not be liable to flood if it is at a great height, however
an area that lies further away may flood if the intervening land is flat or a gentle slope or if
the area lies in a depression. The vulnerability map in figure 4 shows the probable extent of
flood disaster. From the underlying image, residential buildings can be observed within the
high risk zones to the right of the river, farmlands and an industrial compound can be
observed within the high risk zone on the left of the river. During field observation, it was
noted that the Tudun Wada area shown in the figure lay in a depression relative to the
elevation of the river channel. This suggests that the area has a very high risk of flood
corroborated by the results of the GIS analysis. In the event of a flood, the blue zone may be
used as a staging area for rescue operations within the area. There is also a need to control
land use within the red zone by government.
Application of Remote Sensing (RS) and Geographic Information Systems (GIS) in flood vulnerability
mapping
Muhammad Isma’il, Iyortim Opeluwa Saanyol
International Journal of Geomatics and Geosciences
Volume 3 Issue 3, 2013 624
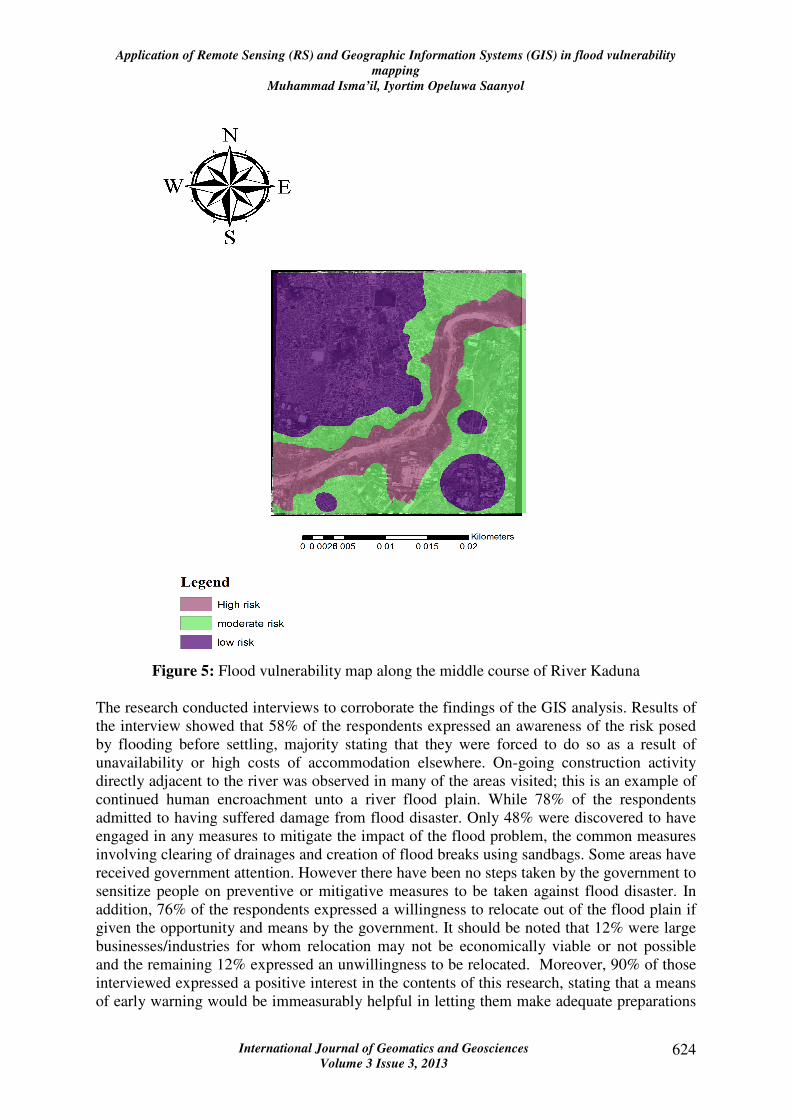
Figure 5: Flood vulnerability map along the middle course of River Kaduna
The research conducted interviews to corroborate the findings of the GIS analysis. Results of
the interview showed that 58% of the respondents expressed an awareness of the risk posed
by flooding before settling, majority stating that they were forced to do so as a result of
unavailability or high costs of accommodation elsewhere. On-going construction activity
directly adjacent to the river was observed in many of the areas visited; this is an example of
continued human encroachment unto a river flood plain. While 78% of the respondents
admitted to having suffered damage from flood disaster. Only 48% were discovered to have
engaged in any measures to mitigate the impact of the flood problem, the common measures
involving clearing of drainages and creation of flood breaks using sandbags. Some areas have
received government attention. However there have been no steps taken by the government to
sensitize people on preventive or mitigative measures to be taken against flood disaster. In
addition, 76% of the respondents expressed a willingness to relocate out of the flood plain if
given the opportunity and means by the government. It should be noted that 12% were large
businesses/industries for whom relocation may not be economically viable or not possible
and the remaining 12% expressed an unwillingness to be relocated. Moreover, 90% of those
interviewed expressed a positive interest in the contents of this research, stating that a means
of early warning would be immeasurably helpful in letting them make adequate preparations
Application of Remote Sensing (RS) and Geographic Information Systems (GIS) in flood vulnerability
mapping
Muhammad Isma’il, Iyortim Opeluwa Saanyol
International Journal of Geomatics and Geosciences
Volume 3 Issue 3, 2013 625
before a flood event. 10% expressed negative sentiments, stating that even if prior knowledge
was available, the flood waters would still inundate the area eventually and certain elements
that are immobile would still incur loss (Farmlands, shops, roads etc). This validation
indicates that the research fulfils the objective of creating a flood vulnerability map that is
easily understood by the public and serves as a tool for early warning against flood disaster.
Most of the population suggested government intervention when asked for possible solutions,
ideas like River dredging, building of concrete embankments, demolition of buildings along
drainage channels, re-channelization of the river, proper drainage systems and total
evacuation of the risky areas were also given. This shows that there is public awareness on
the subject of flood and a rudimentary knowledge on methods of managing the damage. The
government simply needs to expand on this knowledge and establish the relevant
infrastructure to ameliorate the problem. It should be noted that some of the areas have
suffered from recurring flood for the last decade and it has taken a huge toll on the areas,
leading to environmental problems such as erosion. Failure by the governments at both the
state and local levels to provide any solutions to the flood problem has led to frustration of
the population living within the areas at risk; Most of these inhabitants have developed
hostile sentiments when questioned about the flood.
5. Conclusions
The This study was carried out with the aim of creating an accurate flood vulnerability map
along the middle course of River Kaduna where it passes through Kaduna metropolis. Simple
methodology was employed, using coordinate and elevation data of the study area and
remotely sensed imagery from Google earth, analysis was carried out within ArcGIS 9.3.
Digital elevation model was generated, reclassified and integrated with imagery of the area to
show areas of different vulnerability to flood hazard. Natural barriers exist between the river
and the surrounding area, however urban explosion within the past decade and relocation
after the Kaduna violence in 2000 have led to settlement within flood prone areas. Areas like
Kudendan, Sabo, Station, Tudun Wada and Barnawa have residential buildings, farms and
industrial compounds within flood prone zones.
5.1 Recommendations
There is a need to expand the scope of this research to cover the entire flood plain of the river
that lies along the Kaduna metropolis and the entire flood plain is catalogued. If well applied,
remote sensing and GIS will go a long way to help in controlling the problem of river
flooding all over the nation. Their application is literally only limited by the imagination of
the operators. After analysis of this research, certain recommendations can be made. These
include;
1. Residential buildings shouldn’t be erected in the zones in red (high risk)
2. Riparian vegetation should be planted to act as flood breaks, reducing the velocity of
flow.
3. Drainages should be constructed to channel storm waters and the existing ones should
be cleared of blockages (refuse)
4. Embankments and other structural flood control measures should be constructed at
areas of high risk.
5. Kaduna state government should work with local governments to institute flood
detection and early warning systems

Application of Remote Sensing (RS) and Geographic Information Systems (GIS) in flood vulnerability
mapping
Muhammad Isma’il, Iyortim Opeluwa Saanyol
International Journal of Geomatics and Geosciences
Volume 3 Issue 3, 2013 626
6. Town planning should incorporate data from flood maps, appropriate land use policies
should be implemented within the vulnerable areas.
7. Flood insurance policies need to be established for commercial and industrial
beneficiaries.
8. Evacuation and disaster response protocols should be instituted with allocation for
emergency shelters and distribution of relief materials in the event of flood disaster.
9. Dredging operation should be carried out to allow the river flow freely through its
natural channel.
10. Individuals within areas known for annual flood events should be relocated to safer
land.
6. References
1. Abbas, I., (2008), Use of satellite remote sensing and geographic information systems
to monitor land degradation along Ondo coastal zone, BALWOIS, Ohrid.
2. Adeoye, N. O., Ayanlade, A. and Babatimehin, O., (2009), Climate change and
menace of floods in Nigerian Cities: Socio-economic implications, Advances in
Natural and Applied Sciences, 3(3), pp 369-377.
3. Alaghmand, S., Bin Abdullah, R., Abustan, I. and Vosoogh, B., (2010), GIS-based
River Flood Hazard Mapping in Urban Area (A Case Study in Kayu Ara River Basin,
Malaysia), International Journal of Engineering and Technology, 2(6), 488-500.
4. Alayande, A N. and Agunwamba, J. C, (2010), The impacts of urbanization on
Kaduna River flooding, Journal of American Science, 6(5), pp 28-35.
5. Beven, K. and Carling, P., (1989), FLOODS: Hydrological, Sedimentological and
Geomorphical Implications, John Wiley and sons Intl, New York.
6. Bhadra, A., Choudhury, S. and Kar, D., (2011), Flood Hazard Mapping in Dikrong
Basin of Arunachal Pradesh (India), World Academy of Science, Engineering and
Technology 60, India.
7. Bue, C. D., (1967), Flood Information for Flood Plain Planning, U.S. Geological
Survey Circular, no 539, United States.
8. Chow, V.T., (1956), Hydrologic studies of floods in the United States, International
Association of Scientific Hydrology Publication 42, pp 134-70.
9. Floyd, S., (1978), Remote Sensing: Principles and Interpretations, W.H. Freeman and
Company, San Francisco.
10. Goel, N. K., Than, H. H. and Arya, D. S., (2005), Flood Hazard Mapping in the
Lower Part of Chindwin River Basin, Myanmar, International conference on
innovation advances and implementation of flood forecasting technology, Tromsø,
Norway.
11. Harun, S., (2009), Remote sensing techniques for flood mapping in Bangladesh, Clark
University, Bangladhesh.

Application of Remote Sensing (RS) and Geographic Information Systems (GIS) in flood vulnerability
mapping
Muhammad Isma’il, Iyortim Opeluwa Saanyol
International Journal of Geomatics and Geosciences
Volume 3 Issue 3, 2013 627
12. Hewitt, K. and Burton, I., (1971), The hazardousness of a place: A regional geology
of damaging events, University of Toronto, Department of Geography Research
Publication, 5, p 154.
13. Ifatimehin, O. and Ufuah, M., (2006), An Analysis of urban expansion and loss of
vegetation in Lokoja, Using GIS Techniques, Zaria Geographer, 17, pp 28-36.
14. Ishaya, S., Ifatimehin, O. O. and Abaje, I. B., (2009), Mapping Flood Vulnerable
Areas in a Developing Urban Centre of Nigeria, Journal of Sustainable Development
in Africa, 11(4), pp 180-194.
15. Izinyon, O. and Ehiorobo, J., (2011), Measurements and documentation for flood and
erosion monitoring and control in the Niger Delta states of Nigeria, TSo7e
Engineering Survey, Marrakech, Morocco.
16. Jeb, D. N. and Aggarwal, S. P., (2008), Flood Inundation Hazard Modeling of the
River Kaduna Using Remote Sensing and Geographic Information Systems, Journal
of applied sciences research, 4(12), pp 1822-1833.
17. Okanlawon, O. O., (1992), River quality management as a strategy towards Water
pollution control; Application to Kaduna River, Environmental Resource unit.
18. Orok, H., (2011), A GIS based flood risk mapping of Kano city, Nigeria, University
of East Anglia, Norwich.
19. Thilagavathi, G., Tamilenthi, S., Ramu, C. and Baskaran, R., (2011), Application of
GIS in Flood Hazard Zonation Studies in Papanasam Taluk, Thanjavur District,
Tamilnadu, Advances in Applied Science Research, 2(3), pp 574-585.


![Journal of Remote Sensing & GIS · eophys Remote Sensing SSN: 219-0049 RS an open access journal based mapping methods [16]. Remote sensing and Geographic Information System is a](https://img.pdfslide.us/doc/110x75/5f56ace5ac756d0606266296/journal-of-remote-sensing-gis-eophys-remote-sensing-ssn-219-0049-rs-an-open.jpg)