Embed Size (px)
Citation preview

1
Application of Remote Sensing in studying forest cover conditions of protected areas
in Himachal Pradesh, India
Vandana Kumari Chauhan*, Ruchika Acharya, Amit Kumar and R.D. Singh CSIR-Institute of Himalayan Bioresource Technology, Council of Scientific and
Industrial Research (CSIR), Palampur, Himachal Pradesh – 176 061, India * E-mail: [email protected]
Abstract
The present study deals with use of remote sensing techniques to know the status of forest in protected areas of Himachal Pradesh, India. The protected area being devoid of anthropogenic interferences provides real time information on natural scenario prevailing on the ground. The study was undertaken in the Great Himalayan National Park, Sainj Wildlife Sanctuary, and Tirthan Wildlife Sanctuary located in Kullu district of Himachal Pradesh in India. The forest cover densities of these protected areas were derived from forest cover map generated from Landsat TM satellite data using digital image processing. The altitudinal variation in forest cover density was also calculated using Cartosat DEM data. The study revealed that the Ecozone had maximum forest cover density followed by Tirthan Wildlife Sanctuary, Sainj Wildlife Sanctuary, and GHNP core area.
Introduction Forests constitute the essential life support system by providing timber, fuel, fodder medicines etc. The pressure on India's forests is high because of high population. The rapid growth in the economy of the country in the last one decade has also put an additional demand on forest for infrastructure development. As per National forest policy (1952) the forest cover in hilly areas should be 66% (http://www.kerenvis.nic.in/isbeid/forest.htm), whereas the actual forest cover in western Himalayan state of Himachal Pradesh (H.P.) is only 22.49 %. Therefore, there is a scope for intensification of forest cover. Thus, it becomes imperative to monitor current status of the forest. Understanding of forest density in protected areas, thus, plays a major role in this context. Vegetation mapping through Remote Sensing (RS) and Geographic Information System (GIS) technologies provide such opportunity to make accurate, timely and cost effective forest resource evaluations (Roy et al., 2003). Keeping these issues in backdrop the present study was conducted with following objectives:
Preparation of forest cover map using Satellite remote sensing.
Calculation of forest cover density
Calculations of altitudinal variations in forest cover density
Verification of forest density with NDVI results
2
Study area
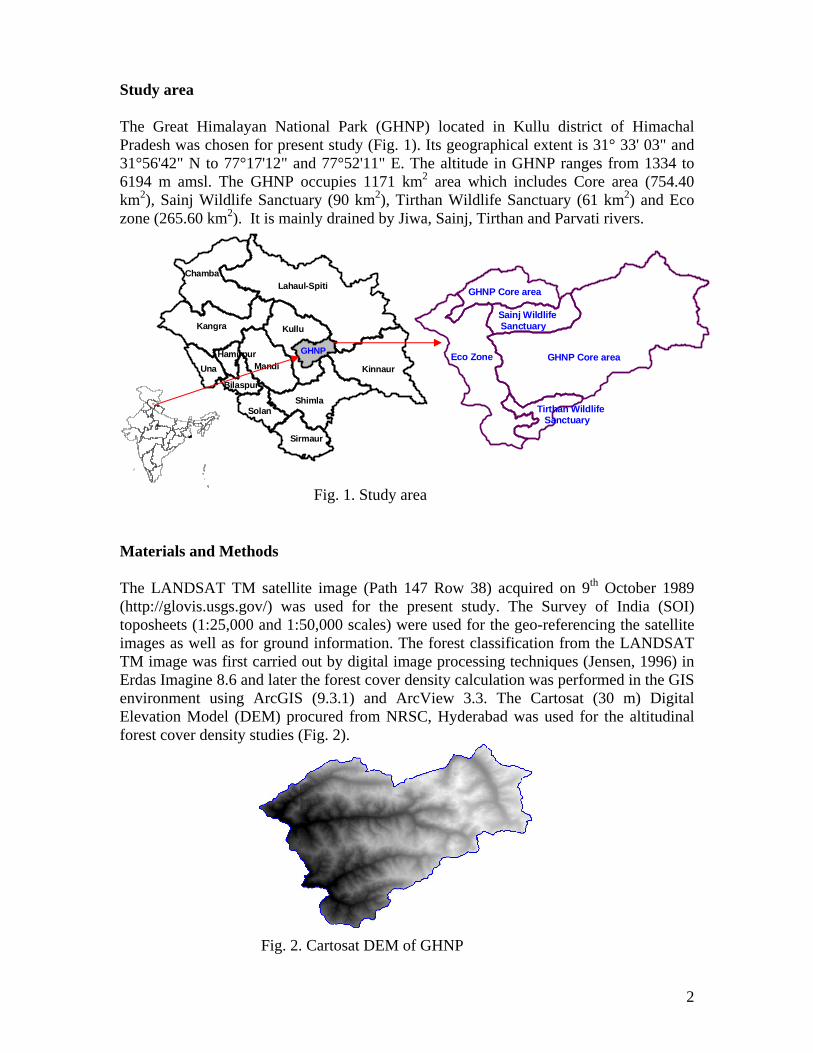
The Great Himalayan National Park (GHNP) located in Kullu district of Himachal Pradesh was chosen for present study (Fig. 1). Its geographical extent is 31° 33' 03" and 31°56'42" N to 77°17'12" and 77°52'11" E. The altitude in GHNP ranges from 1334 to 6194 m amsl. The GHNP occupies 1171 km2 area which includes Core area (754.40 km2), Sainj Wildlife Sanctuary (90 km2), Tirthan Wildlife Sanctuary (61 km2) and Eco zone (265.60 km2). It is mainly drained by Jiwa, Sainj, Tirthan and Parvati rivers.
Materials and Methods
The LANDSAT TM satellite image (Path 147 Row 38) acquired on 9th October 1989 (http://glovis.usgs.gov/) was used for the present study. The Survey of India (SOI) toposheets (1:25,000 and 1:50,000 scales) were used for the geo-referencing the satellite images as well as for ground information. The forest classification from the LANDSAT TM image was first carried out by digital image processing techniques (Jensen, 1996) in Erdas Imagine 8.6 and later the forest cover density calculation was performed in the GIS environment using ArcGIS (9.3.1) and ArcView 3.3. The Cartosat (30 m) Digital Elevation Model (DEM) procured from NRSC, Hyderabad was used for the altitudinal forest cover density studies (Fig. 2).
Fig. 1. Study area
Lahaul-Spiti
Kullu
Kinnaur
Shimla
Mandi
Solan
Sirmaur
Bilaspur
Hamirpur
Una
Kangra
Chamba
GHNPGHNP Core area
Sainj Wildlife Sanctuary
GHNP Core area
Eco Zone
Tirthan Wildlife Sanctuary
Fig. 2. Cartosat DEM of GHNP

3
First of all, the geometric corrections were performed on the image with the help of toposheets. The satellite image corresponding to the study area was then clipped by overlaying the GHNP boundary over it. The satellite image of the study area was classified in to two broad classes i.e. vegetation and non-vegetation classes (Fig. 3), following unsupervised classification method (Lillesand and Kiefer, 2000).
The vegetation class represented pixels of different classes such as forest, agriculture, scrubland, grassland and park. The pixels falling in to vegetation was reclassified in to subclasses such as agriculture, grassland, shrub land and park using supervised classification (Lillesand and Kiefer, 2000). The subclasses other than forest were excluded in the further analysis and forest pixels were used to calculate forest density in GIS environment. The forest cover density was calculated for various sub-divisions of GHNP and for the mesh of 1 km X 1 km generated for entire area (Kumar et al., 2007). The forest cover density was calculated using following equation:
Forest cover density (%) = (Forest cover area / Total land area)*100
The forest cover density calculated for 1 km X 1 km mesh were grouped into different classes such as Open forest (10–40 %), Moderate dense forest (40–70 %), Very dense forest (> 70 %), based on the criteria by Forest Survey of India (FSI, 2009).
Fig. 4. Various altitudinal ranges of GHNP
Fig. 3. Landuse/Landcover classification
LANDSAT IMAGE CLASSIFIED IMAGE

4
For altitudewise forest cover density, the DEM was classified in different altitudinal ranges (Fig. 4) such as Alpine region (> 3600 m), Sub-alpine region (> 3300-3600 m), Upper Temperate region (> 2800-3300 m) and Mid Temperate region (1300-2800 m). The altitudewise forest cover density was calculated for various GHNP subdivisions as well as for entire GHNP.
The forest cover density was compared with Normalized Difference Vegetation Index (NDVI). The NDVI were calculated from the satellite image for the pixels that corresponded only to forest area, using the infrared bands and red bands (Sabins, 1996).
Results and discussion
The results of this study revealed that the forest cover density of GHNP was 31.94 %. Overall, more than 50 % of the forest in GHNP was categorized as very dense forest owing to canopy cover >70 % (Fig. 5). The Core area had lowest forest cover density (15.73 %) because most of its area has alpine climate. The Sainj wildlife sanctuary and Tirthan wildlife sanctuary had 40.5 % and 56.13 % area under forest cover, respectively. Maximum forest cover density was observed in Eco Zone (72.18 %). Altitudewise, the forest cover density was observed maximum in upper temperate region (90 %) followed by mid-temperate region (73.34 %), sub-alpine region (52.78 %) and alpine region (0.26 %) respectively.
Conclusions
The forest cover density was significantly correlated with NDVI ( =0.93). It was observed that the NDVI in various altitudinal regions increased with forest cover density and decreased with decrease in the forest cover density (Fig 6).
Fig. 5.Forest cover density of GHNP
GHNP Core Area
Sainj Wildlife Sanctuary
GHNP Core AreaEco Zone
Tirthan Wildlife Sanctuary
Moderate Dense ForestOpen ForestScrubVery Dense Forest

5
The study also concluded that the GHNP had good forest cover density with major area occurring in upper and mid temperate regions, which is an indication of healthy forest conditions in the study area.
Acknowledgements
Director, CSIR-IHBT, Palampur is acknowledged for his support and the facilities provided. Staff members of Biodiversity division, CSIR-IHBT and Dr Sanjay Kumar, Scientist, CSIR-IHBT are acknowledged for their help. We are also thankful to National Remote Sensing Centre, Hyderabad for providing Cartosat DEM and to Council of Scientific and Industrial Research (CSIR) for financial support to exploratory studies on climate change and adaptation of species complexes (NWP-0020).
References
http://www.kerenvis.nic.in/isbeid/forest.htm Roy, P. S., Saran, S., Joshi, P. K. and Chandrashekhar, M. B., 2003, Satellite remote sensing for forest management. In Geoinformatics for Tropical Ecosystems, P.S. Roy (Ed.), Bishen Singh Mahendra Pal Singh, India. http://glovis.usgs.gov Jensen, J. R., 1996, Introductory digital image processing, Prentice Hall, USA. Lillesand, T. and Kiefer, W., 2000, Remote Sensing and Image Interpretation, 4th edition, John Wiley and Sons, New York. Kumar, A., Uniyal, S. K. and Brijlal, 2007, Stratification of forest density and its validation by NDVI analysis in a part of western Himalaya, India using Remote sensing and GIS Techniques, 28 (11), 2485–2495. FSI, 2009, State of Forest Report, Forest Survey of India, Dehradun, India. Sabins, F. F., 1996, Remote Sensing: Principles and Interpretations, Freeman and Company, USA.
Fig. 6. Correlation between Forest cover density and NDVI
0.3 %
52.5 %
89.5 %73.8 %
0102030405060708090
100
1300-2800 >2800-3300 >3300-3600 >3600Altitude (m)
Fo
rest
Co
ver
Den
sity
(%)
0
0.1
0.2
0.3
0.4
0.5
0.6
Mea
n N
DV
I
Forest Cover Density (%)
Mean NDVI
y = - 0.039 x + 0.535
R2 = 0.87

6
PAPER REFERENCE NO.: PN-53
TITLE OF THE PAPER: Application of Remote Sensing in studying forest cover conditions of protected areas in Himachal Pradesh, India
NAME OF THE PRESENTER: Miss Vandana Kumari Chauhan
AUTHOR (S) AFFILIATION
Miss Vandana Kumari Chauhan Project Assistant CSIR-Institute of Himalayan Bioresource Technology Council of Scientific and Industrial Research (CSIR) Palampur, Himachal Pradesh – 176 061, India E-mail: [email protected] Telephone number: +91-1894-233339 Fax number: +91-1894-230433 Author Photograph:
Brief Biography (100 words): Post Graduate in Geography from Panjab University. Done diploma in Remote Sensing and GIS Applications from Jamia Millia Islamia, New Delhi. Currently, working as a Research Scholar in CSIR-IHBT (Palampur) in the area of Biodiversity.
Miss Ruchika Acharya Project Assistant CSIR-Institute of Himalayan Bioresource Technology Council of Scientific and Industrial Research (CSIR) Palampur, Himachal Pradesh – 176 061, India E-mail: [email protected] Telephone number: +91-1894-233339 Fax number: +91-1894-230433 Author Photograph:
Brief Biography (100 words): Post Graduate in GIS from Symbiosis Institute of Geoinformatics, Pune. Currently, working as a Research Scholar in CSIR-IHBT (Palampur) in the area of Biodiversity.

7
Mr. Amit Kumar Scientist CSIR-Institute of Himalayan Bioresource Technology Council of Scientific and Industrial Research (CSIR) Palampur, Himachal Pradesh – 176 061, India E-mail: [email protected] Telephone number: +91-1894-233339 Fax number: +91-1894-230433 Author Photograph:
Brief Biography: has experience in Remote sensing and GIS applications in the area of Biodiversity, Natural Resource Management, Geology and Spatial Information System.
Dr. R.D. Singh Head of Department CSIR-Institute of Himalayan Bioresource Technology Council of Scientific and Industrial Research (CSIR) Palampur, Himachal Pradesh – 176 061, India E-mail: [email protected] Telephone number: +91-1894-233339 Ext 316 Fax number: +91-1894-230433 Author Photograph:
Brief Biography: has experience in husbandry of field and plantation crops with emphasis on tea and medicinal plants, Weed management, Allelopathy and Biodiversity Conservation.


![[REMOTE SENSING] 3-PM Remote Sensing](https://img.pdfslide.us/doc/110x75/61f2bbb282fa78206228d9e2/remote-sensing-3-pm-remote-sensing.jpg)
