Embed Size (px)
DESCRIPTION
Project Management Journal
Citation preview
International Journal of Scientific & Engineering Research, Volume 4, Issue 10, October-2013 852 ISSN 2229-5518
IJSER © 2013 http://www.ijser.org
APPLICATION OF PROJECT MANAGEMENT SYSTEM IN REDUCING CONSTRUCTION TIME Adeleke J. S1 , Ankeli I. A2, Buari T.A1 Esan M. T1
1 (Department of Building Technology, Federal Polytechnic, Ede, Nigeria )
2(Department of Estate Management, Federal Polytechnic, Ede, Nigeria)
Abstract: This paper examines the application of project management system by exploring the cost slope graph to reduce project period at minimum cost. The study adopts the use of interview, personal observation and empirical approach for data collection, to arrive at normal cost, a project bill of quantity for a specific project was obtained and its corresponding project duration for all the activities was obtained through a “network” diagram, the Critical Path Method (CPM). This total project duration was therefore shortened, starting with the activities with the least cost slope unit continuously to obtain an optimum cost lesser than the initial cost of the project. The study further revealed that the total project duration of 169 time unit obtained was reduced to 162 time unit at an optimum cost of N38,896 which represent, additional savings and other overhead cost. A graphical representation of project cost time graph was obtained from the least cost scheduling table by duration to show the optimum cost. The study therefore, recommended that shortening project duration should be used when delay sets in.
Keywords: Critical path method, Cost time optimization, Reducing Project period.
1.0 Introduction
Project execution involves time, cost and quality management. Therefore, close management control of them is required if they are to be completed within the established time and cost limitations. Project Management Institute (PMI, 1996) defines “project management” as the overall planning, control and coordination of building project from inception to completion stage, aimed at meeting a client’s requirement in order that the project is completed on time within a target cost as planned and to required quality standard.
Many of the construction industries influential clients are hiring a project manager to be the most effective way to procure a new facility, whether it is a multi storey office block, housing development, health or educational building etc. it is essential that in ensuring effectiveness and time conscious service, the project should be under the management system and control of the competent practitioners with a proven track record developed from practical involvement on site execution of construction project.
This study came up as a result of project time overrun of building production from inception to the completion stage. As a result of this, this paper described a procedure for identifying the cost of reducing project time so that comparism can be made with the benefit of getting the project completed sooner. The method requires gathering direct and indirect cost for specific project duration. Critical activities are searched to find lowest direct cost activities that will shortened the project duration. Total cost for specific project duration are computed and then compared with the benefit of reducing project time before the project begins or at the course of the project. The concept will be introduced and applied. Application of this principle to construction will result in the development of techniques for the management, control of construction cost and time treating the entire system as a unified.
1.1 Significance of the study
IJSER
International Journal of Scientific & Engineering Research, Volume 4, Issue 10, October-2013 853 ISSN 2229-5518
IJSER © 2013 http://www.ijser.org
This paper was necessitated by the escalating increase in construction time with the spirit of establishing a practical method of reducing a project period of some activities along the probable critical path CP that will be undergone during the course of the project. This paper will therefore, provide the general management techniques in reducing project time which will provide an effective strategy for client’s objective and construction industry at large.
1.2 Aim and Objectives
This paper aims at using management techniques, by exploring the cost slope graph, to reduce project time as occasionally needed and how the associated studies are conducted.
The objectives of the study are:
(i) To examine critically, the planning tools (CPM) to solve time problem
(ii) To examine the rational for reducing project time
2.0 Literature Review
One of the major criteria for project success is timely completion of such project, and this indicates how effective a construction industry is. Chan and Kumara swamy (1997) ascertained that a project is considered successful if it is to be completed on time, budget and to the quality standard specified by the client at unset of the project. Excessive and rampant cases of time overrun on building project are found to be common phenomenon of abandoned projects. Ajankekoko (1987) noted that the performance of the Nigerian construction industry time wise is poor and that is why it is difficult to find a project on which the initial contract period is not exceeded.
2.1 Project Period Explanation
As defined by Odeyinka (2000) project period is the time required for execution of project from start to completion and is normally agreed upon at the time of signing the contract. Izam and Kolawole (1998) opined that some section of The Standard Form of Contract for Building and Housing Projects in Nigeria (SFBCN 1990) makes provision for the contractor to state duration for carrying out proposed work. Bamisile (2004) Opined that most building construction projects are time oriented. Hence, Builders must come up with the optimum construction methodology. Odeyemi (2002) reveals that the basic techniques employed in the determination of contract period are job listing, work measurement, bar chart, and network analysis.
2.2 The Critical Path Method
According to Clough (1979) the CPM is an expedient and constitutes the basis for ensuring treatment of project time control. This is based on a graphical model called a “Network”. This network presents a diagrammatic form for all the job activities that must be carried out and their mutual time independencies. It serves as a basis for the calculation of work scheduled and provides a mechanism for controlling project time as the work progresses.
2.2.1 The CPM Procedures
Bamisile (2004) opined that the critical path procedures consist of three phases namely:
- Planning, construction operations which involve determination of what must be done, and the sequential order in which it will be carried out.
- Scheduling, determines calendar date for the start and completion of the project components - And lastly, is the time monitoring and control, which is the process of comparing actual job progress with
the program scheduled.
2.3 Need for Shortening Project period
IJSER
International Journal of Scientific & Engineering Research, Volume 4, Issue 10, October-2013 854 ISSN 2229-5518
IJSER © 2013 http://www.ijser.org
Chan and kumara swamy (1997) observed that almost 70% of building project in Hong kong were completed behind scheduled whereas limited surveys of the performance of the building project in Nigeria by Izan and Kolawole (1998) have indicated that building project in Nigeria overrun initial duration by 115- 300%. The reason for this can be traced to the effect of numerous contract period inflating factors on construction projects. Due to this time overrun in projects delivery there might be need to reduce project time for a specific project. According to Gray and Larson (1986) needs for shortening project period are as follows:
- One of the common reason is known as “imposed” project duration date, for example, a politician makes a public statement that a new law building will be delivered in two years, such statement is too often become imposed project duration date without any detailed consideration of the problem or cost of meeting such date.
- Incentives contract and continuous improvement incentives in partnering arrangement can make reduction of project time rewarding, for example, a contractor finish a bridge across a lake 18 month early to reduce traffic grid lock may receive more than N600,000 for early completion.
- Unforeseen delay, for example adverse weather condition, design flaws, and equipment break down. Which cause substantial delays midway in the project, getting back on schedule usually requires compressing the time on some of the remaining critical activity.
2.3.1 Methods of Shortening Project Period
According to Gray and Larson (1986) method of shortening project time of activities on the critical path are limited.
(i) Reducing project quality is one alternative that may reduce the time of an activity on the critical path. However sacrificing quality is rarely an acceptable or used method.
(ii) Another method of shortening the project period is to sub contract an activity. Sub-contracting also free up resources that can be assigned to the critical activities and can result in shorter project duration. However, it is likely this alternative was considered in the early planning stages. So it may not be a viable means for shortening the scheduled at a later time.
(iii) The most common method of shortening project time is to assign additional manpower and equipment to the remaining activities.
(iv) Another common method for meeting critical dead line is to reduce the scope of the project. (v) Finally, if all these alternatives area ruled out, shortening project time comes down to reducing specific
critical activities; times to reduce project time. This alternatives means paying a premium cost to cut activity time. A logical method for evaluating this cost/ time trade off conditions was utilized and applied in solving time problem in this paper work.
2.4 Project Cost
Oxford English dictionary (2005) defined cost as the amount of money needed to buy do or make something. According to Ashworth (1999) cost of buildings are seen from the cost of labour, material and machinery. Cost is seen as the estimated amount of the physical production of building, it is also the amount of expenditure incurred to satisfy a need or activity. Sidwell (1984) also emphasized that cost of building project is mostly set at the beginning of the project and this is usually call “initial price”.
2.4.1 Types of Project cost
Project costs are subdivided into two categories namely:
(i) Project Direct Cost: Direct cost or commonly represent labour, materials, equipment and sometimes subcontractors, Direct cost are assigned directly to a work package and activity hence the term. The
IJSER
International Journal of Scientific & Engineering Research, Volume 4, Issue 10, October-2013 855 ISSN 2229-5518
IJSER © 2013 http://www.ijser.org
ideal assumption is that direct cost for an activity time represents normal cost, which typically means low cost, efficient method for a normal time.
(ii) Project Indirect Cost: Indirect cost generally represents overhead costs such as supervision, administration, consultants and interest. Indirect cost cannot be associated with any particular work package or activity, Hence the term. Indirect cost varies differently with time. That is any reduction in time should result in a reduction of indirect cost. Reduction in project time represents a very real savings.
(iii) Project Total Cost: The sum of the cost of all the work packages or activities represents the total direct cost for the project. i.e addition of the direct cost and the indirect cost gives the proceeding project total cost.
2.5 Cost Time Optimization Procedure
As recommended by Rangwala (1998) if for some reason it is desired that the normal completion period is reduce. The project or part of the project is constructed under a crash program the crash program is to be carried out for optimum cost of the project through the following procedures: (i) Check the normal completion time of the project (ii) Total new completion time for the project must be less than the calculated normal completion
time. (iii) As the project time is calculated by the sum of durations of all the critical activities under
normal program, some of these critical activities should be crashed. (iv) Crashing of one activity is to be carried out at a time, unless any other links up activities is
affected due to this crashing. (v) The activities with the minimum cost slope should be crashed first. (vi) “ All crash” solution as to be obtain step by step procedure of crashing (vii) During this procedure, it may be found that for some overall project time, the cost is
minimum; this project time is the optimized project time for optimum cost. (viii) Keeping the same optimum project time the cost of the project is further reduce by crashing
non critical activities without changing critical path.
2.5.1 Construction of Project Cost Time Graph
As emphasized by Larsson (1986) there are three major steps required for the construction of a project time graph
(i) Find total direct costs for the selected project duration (ii) Find total indirect costs for selected project duration (iii) Sum the direct and indirect cost for these selected project duration hence, the graph is then use to
compare additional cost alternatives for benefits.
3.0 Methodology
The information for this paper was collected through oral interview, site visitation and empirical approach. The empirical approach deals with the analysis of data obtained from the use of working drawings and price bill of quantities for a specific project. In order to get sufficient data for this paper the quantity surveyor that was directly involved on the project was interviewed and relevant information on the cost where obtained. The cost information
IJSER
International Journal of Scientific & Engineering Research, Volume 4, Issue 10, October-2013 856 ISSN 2229-5518
IJSER © 2013 http://www.ijser.org
include project direct cost, project indirect cost, also from the bill of quantity the time taken to complete each item of work where computed based on synthetic data of work output per man hour which help to develop the normal time required to complete each activity, the additional of three working hours i.e (overtime) to the normal working hour per day also helps to determine the crash time to complete each of the activities, mathematical expression known as cost slope where applied and the activity on the critical path was crashed starting with the activity with least cost slope to obtain the optimum cost lesser than the initial cost of the project.
4.0 Data presentation
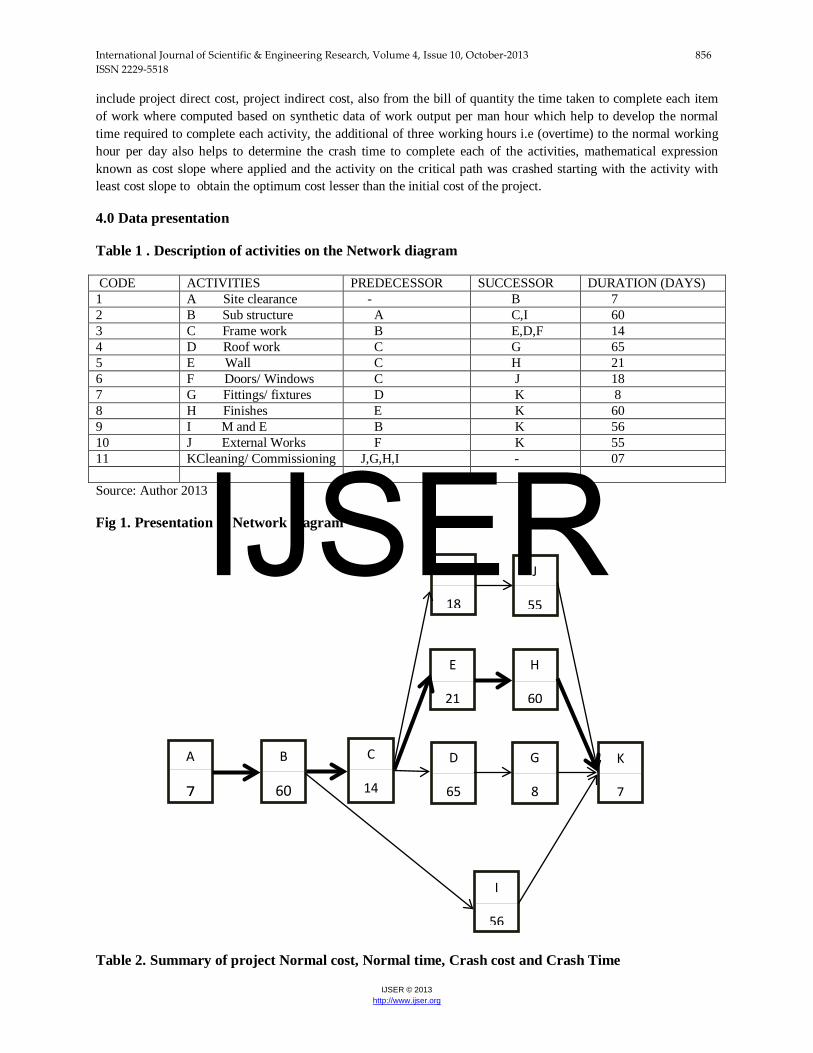
Table 1 . Description of activities on the Network diagram
CODE ACTIVITIES PREDECESSOR SUCCESSOR DURATION (DAYS) 1 A Site clearance - B 7 2 B Sub structure A C,I 60 3 C Frame work B E,D,F 14 4 D Roof work C G 65 5 E Wall C H 21 6 F Doors/ Windows C J 18 7 G Fittings/ fixtures D K 8 8 H Finishes E K 60 9 I M and E B K 56 10 J External Works F K 55 11 KCleaning/ Commissioning J,G,H,I - 07 Source: Author 2013
Fig 1. Presentation of Network diagram
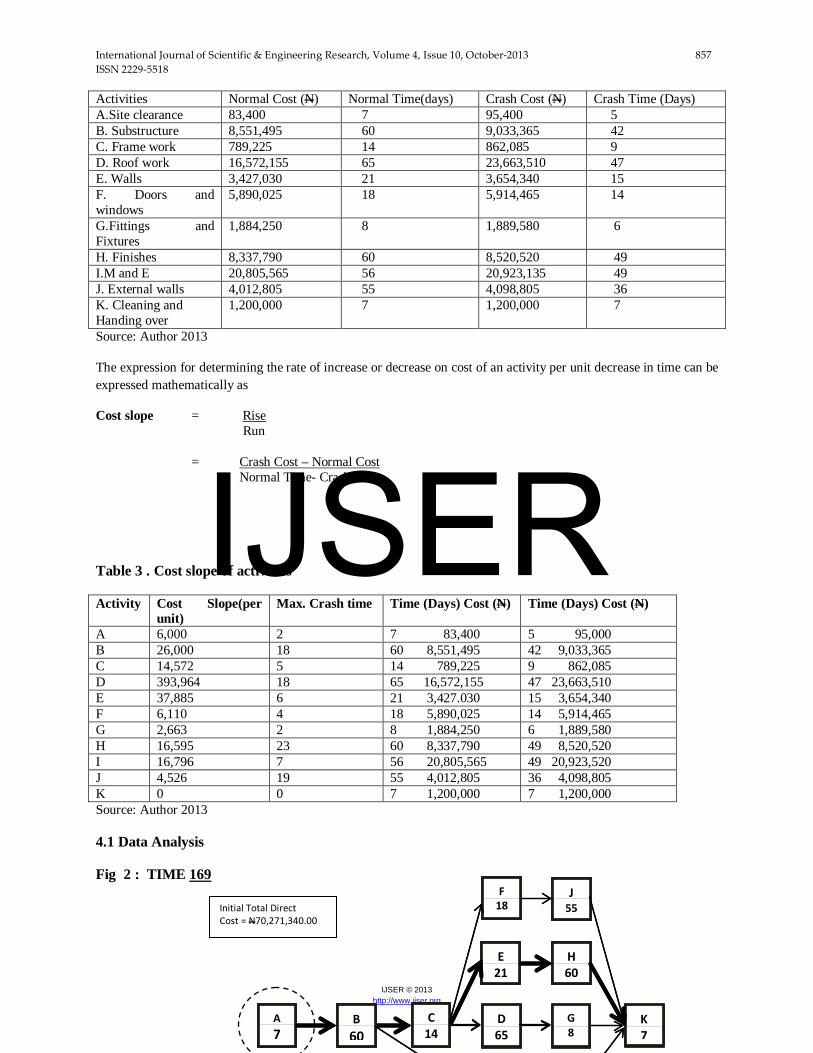
Table 2. Summary of project Normal cost, Normal time, Crash cost and Crash Time
A
7
B
60
C
14
D
65
G
8
K
7
E
21
H
60
J
55
F
18
I
56
IJSER
International Journal of Scientific & Engineering Research, Volume 4, Issue 10, October-2013 857 ISSN 2229-5518
IJSER © 2013 http://www.ijser.org
Activities Normal Cost (N) Normal Time(days) Crash Cost (N) Crash Time (Days) A.Site clearance 83,400 7 95,400 5 B. Substructure 8,551,495 60 9,033,365 42 C. Frame work 789,225 14 862,085 9 D. Roof work 16,572,155 65 23,663,510 47 E. Walls 3,427,030 21 3,654,340 15 F. Doors and windows
5,890,025 18 5,914,465 14
G.Fittings and Fixtures
1,884,250 8 1,889,580 6
H. Finishes 8,337,790 60 8,520,520 49 I.M and E 20,805,565 56 20,923,135 49 J. External walls 4,012,805 55 4,098,805 36 K. Cleaning and Handing over
1,200,000 7 1,200,000 7
Source: Author 2013
The expression for determining the rate of increase or decrease on cost of an activity per unit decrease in time can be expressed mathematically as
Cost slope = Rise Run
= Crash Cost – Normal Cost Normal Time- Crash time
Table 3 . Cost slope of activities
Activity Cost Slope(per unit)
Max. Crash time Time (Days) Cost (N) Time (Days) Cost (N)
A 6,000 2 7 83,400 5 95,000 B 26,000 18 60 8,551,495 42 9,033,365 C 14,572 5 14 789,225 9 862,085 D 393,964 18 65 16,572,155 47 23,663,510 E 37,885 6 21 3,427.030 15 3,654,340 F 6,110 4 18 5,890,025 14 5,914,465 G 2,663 2 8 1,884,250 6 1,889,580 H 16,595 23 60 8,337,790 49 8,520,520 I 16,796 7 56 20,805,565 49 20,923,520 J 4,526 19 55 4,012,805 36 4,098,805 K 0 0 7 1,200,000 7 1,200,000 Source: Author 2013
4.1 Data Analysis
Fig 2 : TIME 169
A B C
D
G
K
E
H
J
F
A 7
B 60
C 14
D 65
G 8
K 7
E 21
H 60
J 55
F 18 Initial Total Direct
Cost = N70,271,340.00
IJSER
International Journal of Scientific & Engineering Research, Volume 4, Issue 10, October-2013 858 ISSN 2229-5518
IJSER © 2013 http://www.ijser.org
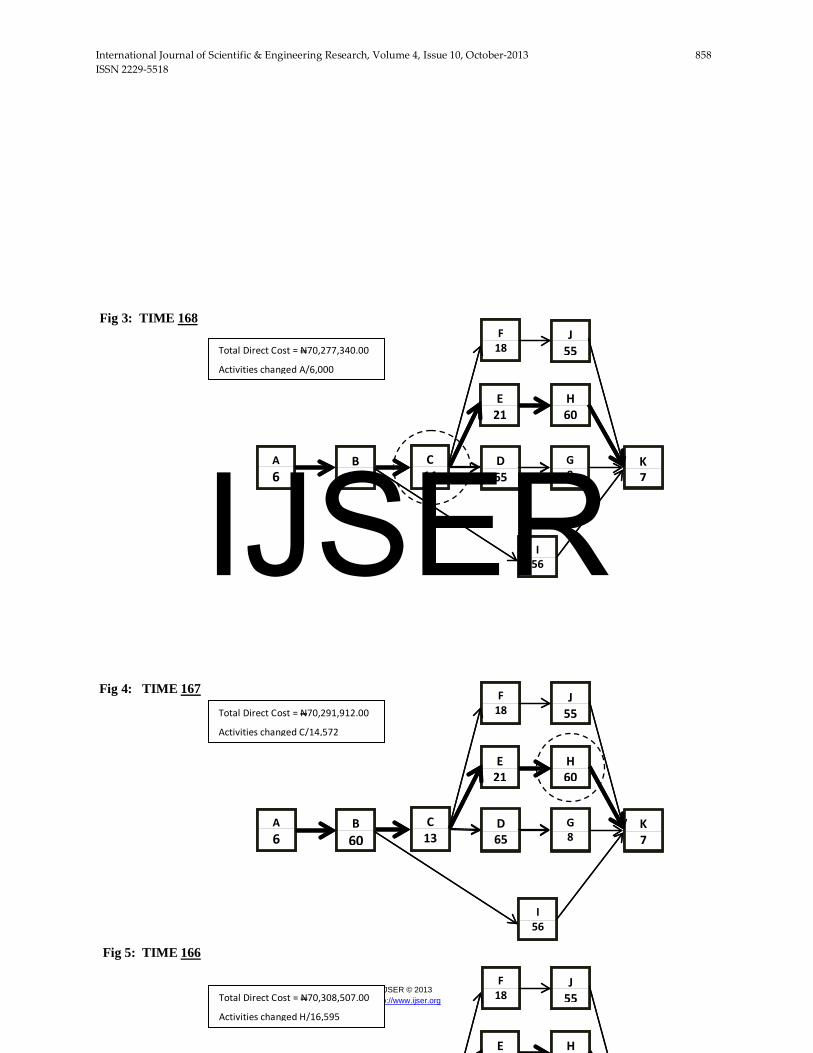
Fig 3: TIME 168
Fig 4: TIME 167
Fig 5: TIME 166
E H
J
F
E H
J 55
F 18 Total Direct Cost = N70,308,507.00
Activities changed H/16,595
A
B
C
D
G
K
E
H
J
F
I
A 6
B 60
C 14
D 65
G 8
K 7
E 21
H 60
J 55
F 18
I 56
Total Direct Cost = N70,277,340.00
Activities changed A/6,000
A
B
C
D
G
K
E
H
J
F
I
A 6
B 60
C 13
D 65
G 8
K 7
E 21
H 60
J 55
F 18
I 56
Total Direct Cost = N70,291,912.00
Activities changed C/14,572
IJSER
International Journal of Scientific & Engineering Research, Volume 4, Issue 10, October-2013 859 ISSN 2229-5518
IJSER © 2013 http://www.ijser.org
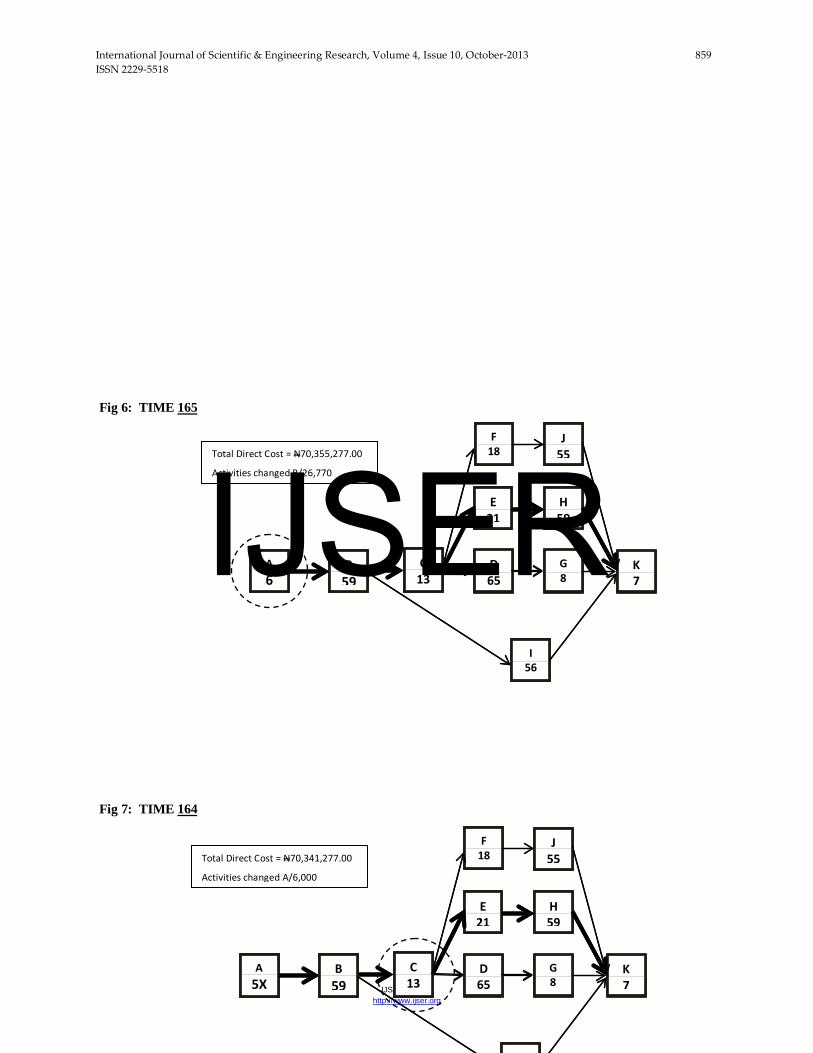
Fig 6: TIME 165
Fig 7: TIME 164
A
B
C
D
G
K
E
H
J
F
I
A 6
B 59
C 13
D 65
G 8
K 7
E 21
H 59
J 55
F 18
I 56
Total Direct Cost = N70,355,277.00
Activities changed B/26,770
A
B
C
D
G
K
E
H
J
F
A 5X
B 59
C 13
D 65
G 8
K 7
E 21
H 59
J 55
F 18
I
Total Direct Cost = N70,341,277.00
Activities changed A/6,000
IJSER
International Journal of Scientific & Engineering Research, Volume 4, Issue 10, October-2013 860 ISSN 2229-5518
IJSER © 2013 http://www.ijser.org
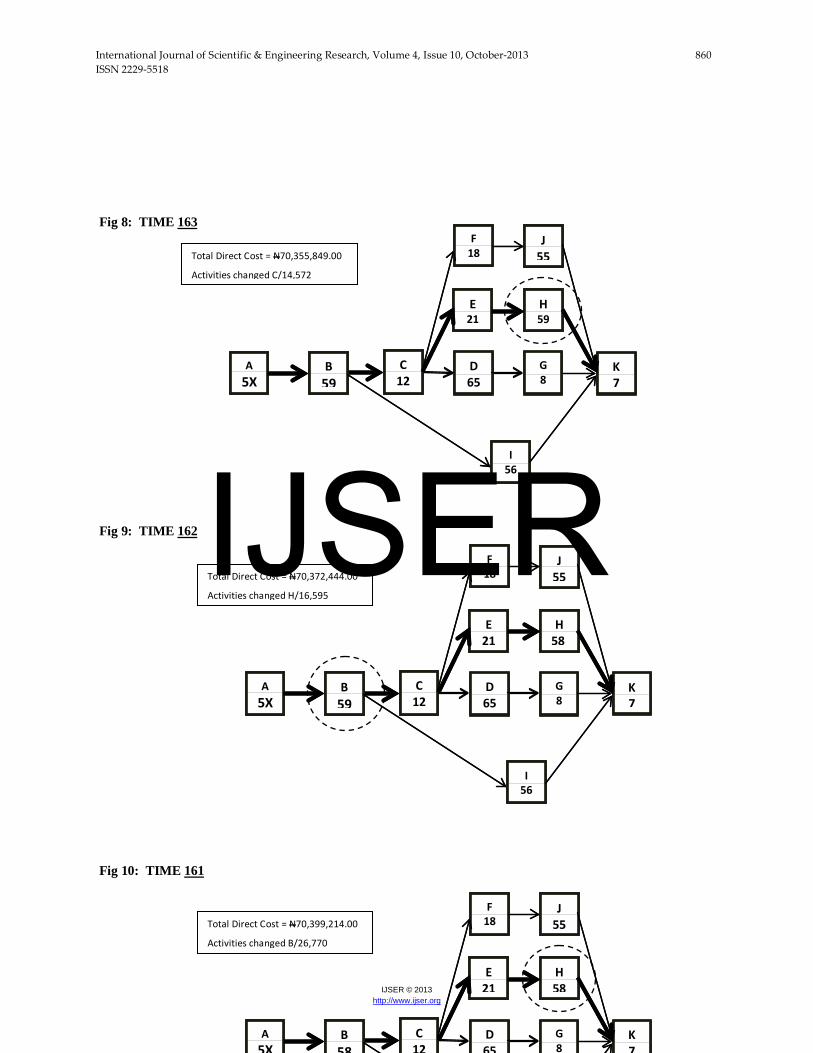
Fig 8: TIME 163
Fig 9: TIME 162
Fig 10: TIME 161
A
B
C
D
G
K
E
H
J
F
I
A 5X
B 59
C 12
D 65
G 8
K 7
E 21
H 58
J 55
F 18
I 56
Total Direct Cost = N70,372,444.00
Activities changed H/16,595
A
B
C
D
G
K
E
H
J
F
I
A 5X
B 59
C 12
D 65
G 8
K 7
E 21
H 59
J 55
F 18
I 56
Total Direct Cost = N70,355,849.00
Activities changed C/14,572
A B C D G K
E
H
J
F
A 5X
B 58
C 12
D 65
G 8
K 7
E 21
H 58
J 55
F 18 Total Direct Cost = N70,399,214.00
Activities changed B/26,770
IJSER
International Journal of Scientific & Engineering Research, Volume 4, Issue 10, October-2013 861 ISSN 2229-5518
IJSER © 2013 http://www.ijser.org
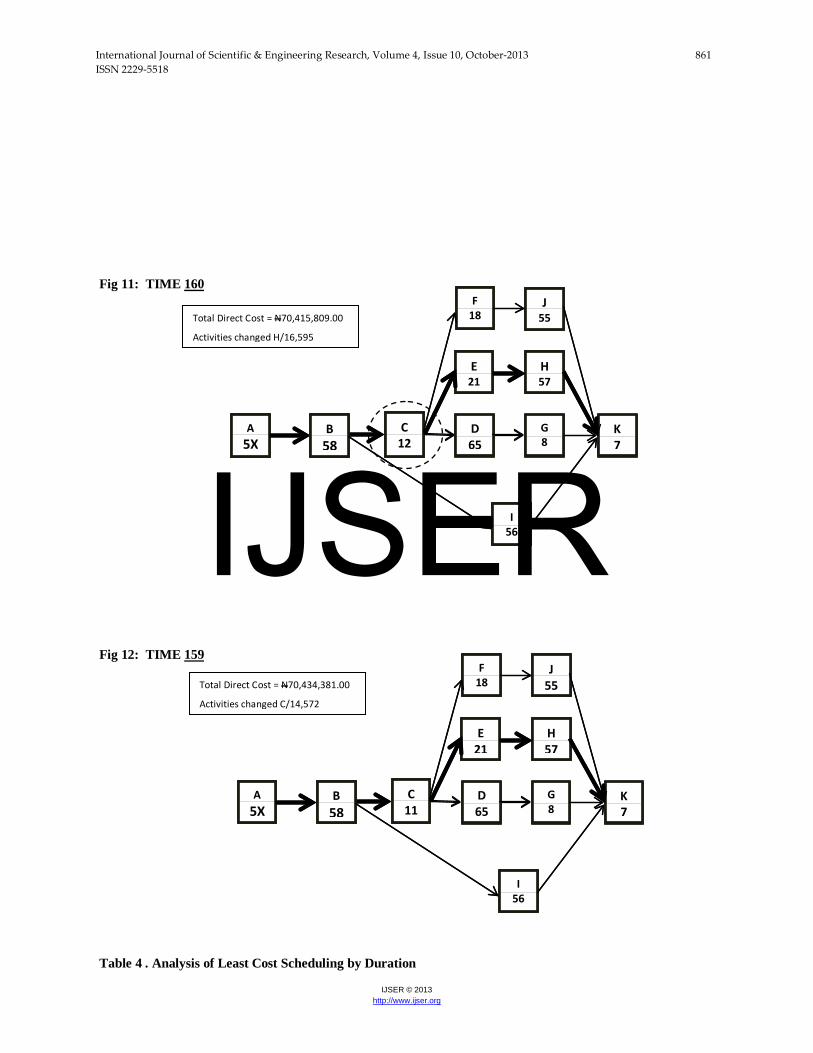
Fig 11: TIME 160
Fig 12: TIME 159
Table 4 . Analysis of Least Cost Scheduling by Duration
A
B
C
D
G
K
E
H
J
F
I
A 5X
B 58
C 12
D 65
G 8
K 7
E 21
H 57
J 55
F 18
I 56
Total Direct Cost = N70,415,809.00
Activities changed H/16,595
A
B
C
D
G
K
E
H
J
F
I
A 5X
B 58
C 11
D 65
G 8
K 7
E 21
H 57
J 55
F 18
I 56
Total Direct Cost = N70,434,381.00
Activities changed C/14,572
IJSER
International Journal of Scientific & Engineering Research, Volume 4, Issue 10, October-2013 862 ISSN 2229-5518
IJSER © 2013 http://www.ijser.org
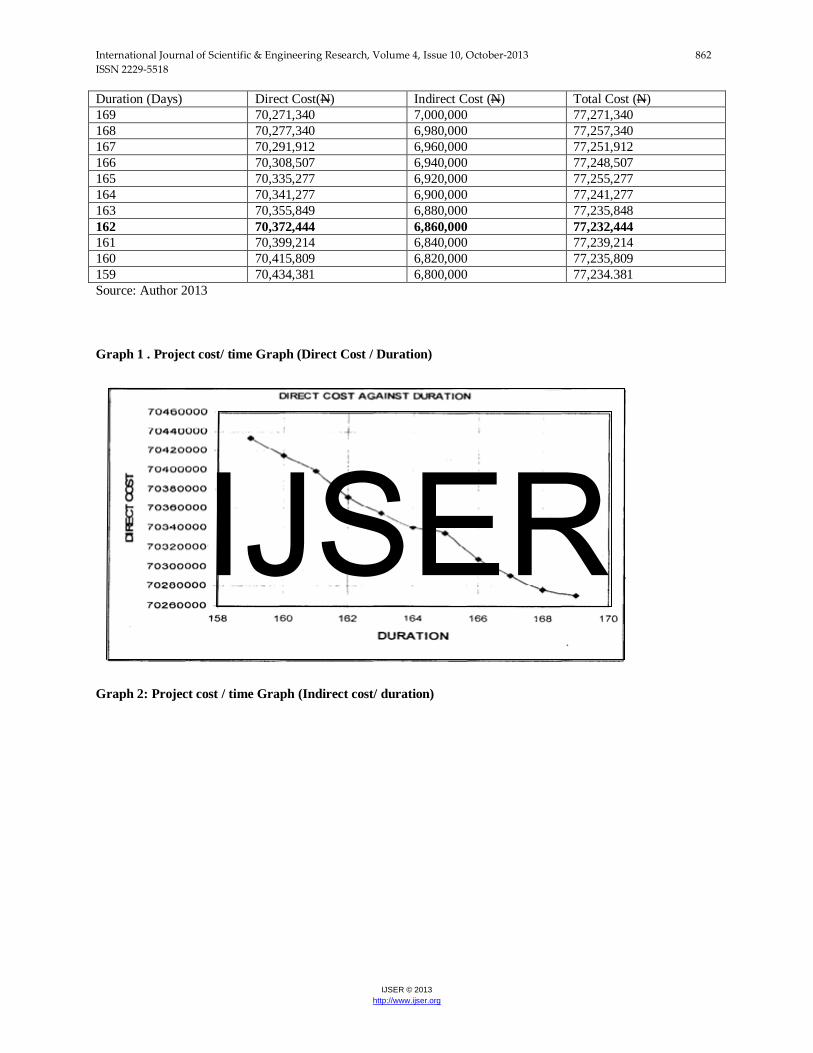
Duration (Days) Direct Cost(N) Indirect Cost (N) Total Cost (N) 169 70,271,340 7,000,000 77,271,340 168 70,277,340 6,980,000 77,257,340 167 70,291,912 6,960,000 77,251,912 166 70,308,507 6,940,000 77,248,507 165 70,335,277 6,920,000 77,255,277 164 70,341,277 6,900,000 77,241,277 163 70,355,849 6,880,000 77,235,848 162 70,372,444 6,860,000 77,232,444 161 70,399,214 6,840,000 77,239,214 160 70,415,809 6,820,000 77,235,809 159 70,434,381 6,800,000 77,234.381 Source: Author 2013
Graph 1 . Project cost/ time Graph (Direct Cost / Duration)
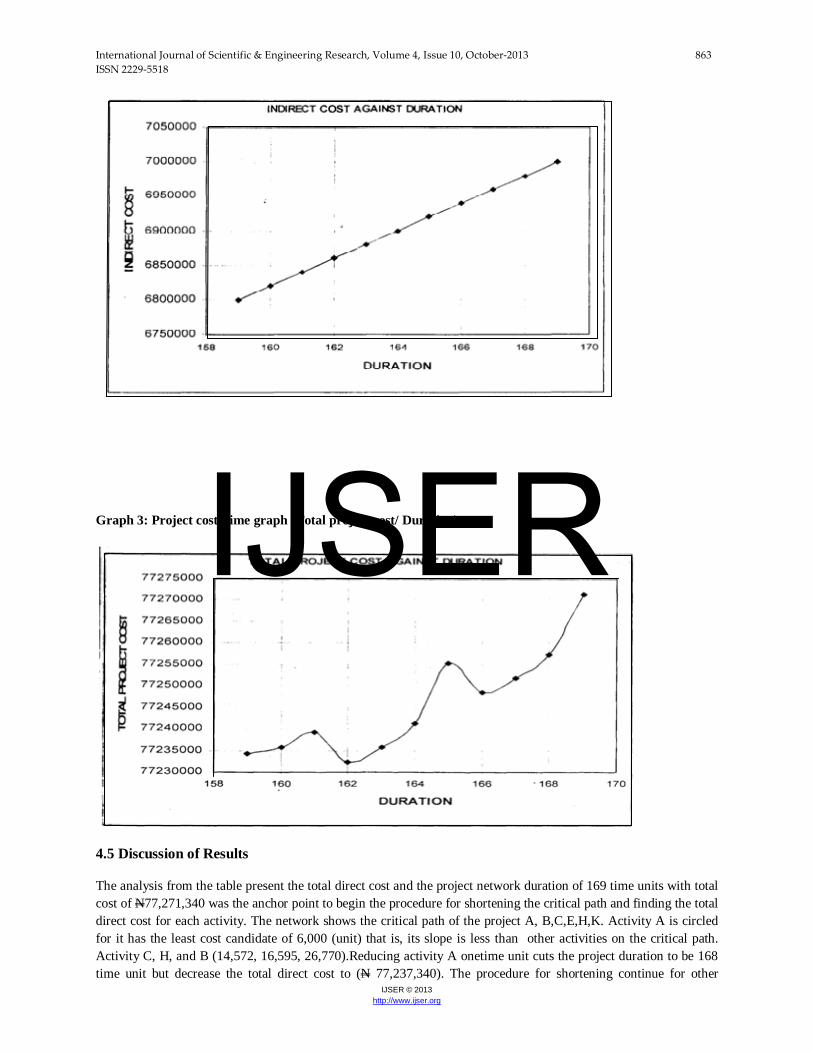
Graph 2: Project cost / time Graph (Indirect cost/ duration)
IJSER
International Journal of Scientific & Engineering Research, Volume 4, Issue 10, October-2013 863 ISSN 2229-5518
IJSER © 2013 http://www.ijser.org
Graph 3: Project cost/ time graph (Total project cost/ Duration)
4.5 Discussion of Results
The analysis from the table present the total direct cost and the project network duration of 169 time units with total cost of N77,271,340 was the anchor point to begin the procedure for shortening the critical path and finding the total direct cost for each activity. The network shows the critical path of the project A, B,C,E,H,K. Activity A is circled for it has the least cost candidate of 6,000 (unit) that is, its slope is less than other activities on the critical path. Activity C, H, and B (14,572, 16,595, 26,770).Reducing activity A onetime unit cuts the project duration to be 168 time unit but decrease the total direct cost to (N 77,237,340). The procedure for shortening continue for other
IJSER
International Journal of Scientific & Engineering Research, Volume 4, Issue 10, October-2013 864 ISSN 2229-5518
IJSER © 2013 http://www.ijser.org
activities with least candidate i.e C, H, B respectively without change in critical path, until the duration of 159 period duration with the total direct cost for the array of specific project durations found, the next step was to input the indirect cost for these same durations, the least cost scheduling table by duration presents the total direct cost, the total indirect cost, and the project total cost. These same cost time duration is obtained at 162 time unit and (N77,232,440).Though crashing can still continue for activities along the critical path and non critical path except for those carrying x symbols.
4.6 Findings and conclusion
The findings from the result of cost time trade off shows that the project period was however, reduced from normal project duration of 169 time unit with an initial total cost of (N77,207,340) to a crash project duration of 162 time unit at an optimized cost of (N77,232,444). In conclusion the paper reveals that the project normal duration was reduced by seven days ahead of project delivery at an optimum cost time point lesser than initial cost of the project. This represents a cost savings and elimination of some other overhead costs with absolute prevention of risks delay of project.
4.7 Recommendation
Based on the research findings, the following are recommended.
(i)All construction firms should adopt the use of shortening project durations when delays set in order to prevent paying liquidated and ascertained damages by contractors to their respective clients.
(ii) It should also be encourage since it represent additional costs savings and could attract incentive contract as result of time saving.
References
Clough R.H (1979) construction project management, 2nd edition, John wiley and son publisher, Toronto; Canada.
Rangwala B.C (1998) construction project management, 2nd edition, charotar publishing house, Awand India.
Chan D.W.M and Kumaraswamy M.M (1997), A comparative of causes of time overrun in Hong kong construction project. International journal of project management. 15 (1)February pp. 55-63.
Odeyinka H.A and Yusif A. (1979) The causes and effect of construction delays on completion cost of housing project in Nigeria. Journal of Financial management of property and construction. Vol. 2. Pp 31-44.
Gray and Larsson (1986) project management and practices, 2nd edition, Mc Graw hill, New York
Bamisile A (2004): Building production management, Foresight press limited, Lagos, Nigeria
Project management Institute (1996): A guide to the project management body of knowledge. PMI.
USA
Asworth A. (1999), Cost studies of buildings, Third edition, Longman, pp31-33
Oxford advanced leaner’s dictionary of current English (2005), Seventh edition, Oxford University press, New York
Ajanlekoko J O, Controlling cost in the construction industry, Lagos QS digest, Lagos 1987; 1(1): 8-12
IJSER

International Journal of Scientific & Engineering Research, Volume 4, Issue 10, October-2013 865 ISSN 2229-5518
IJSER © 2013 http://www.ijser.org
Izam Y D and Kolawole J O (1998): Factors influencing the duration estimation function of construction firms. Nigeria journal of construction Technology and management, Vol.No.1.pp.54-58
S.F.B.C.M (1990): Standard Form of Contract for Building and Housing Project in Nigeria
IJSER