Embed Size (px)
Citation preview
CHEMICAL ENGINEERING TRANSACTIONS
VOL. 59, 2017
A publication of
The Italian Association of Chemical Engineering Online at www.aidic.it/cet
Guest Editors: Zhuo Yang, Junjie Ba, Jing Pan Copyright © 2017, AIDIC Servizi S.r.l. ISBN 978-88-95608- 49-5; ISSN 2283-9216
Application of PM2.5 Alarm System Based on Embedded
Technology in Urban Air Pollution Monitoring
Xi Wang
Software college, Nanyang Normal University, Nanyang 473061, China
With the continuous improvement of people's living standard, people pay more and more attention to the
environment. Air quality is an important indicator of the environment. Haze problems cannot be under
estimated. It has brought an impact on the survival and development of mankind. However, PM2.5 is the
leading cause of haze.PM2.5 has the characteristics of small volume, strong activity and easy to carry viruses
and heavy metals, which has been greatly affected by the inhalation of the human body. Aiming at the
problems caused by haze, this paper designs a PM2.5 alarm system, which aims to monitor the situation of
urban air pollution. This paper uses STM32 MCU control system.PM2.5 sensor DSM501 is used to collect
PM2.5 signal.LCD12864 liquid crystal display is used to display the real-time value of PM2.5 concentration
and the current time. The speaker and the tricolor lantern are used to realize the function of limiting the sound
and light alarm. The system realizes the real-time monitoring of PM2.5 index of urban air pollution.
Experimental results show that the system has good real-time performance, convenient operation and stable
performance. It realizes the monitoring and alarm function of PM2.5 in urban air, which brings convenience to
people's life.
1. Introduction
In recent years, due to frequent occurrence of haze, people are increasingly concerned about the haze. Haze
problem cannot be changed overnight, and the main pollutants haze is PM2.5. Therefore, it is urgent to design
a PM2.5 monitoring device. According to the system monitoring results, people can take preventive measures
in time, thereby reducing the harm caused by PM2.5. Firstly, the principle of PM2.5 concentration
measurement is introduced. Then this paper introduces the hardware system design and software design of
PM2.5 concentration monitoring based on STM32 microcontroller. Finally, the concentration of PM2.5 is
obtained through the experimental test, and the monitoring and alarm function of PM2.5 in urban air is realized.
The particulate matter emitted by human activities mainly comes from industrial production and living activities.
They include fossil fuels (coal and oil) and biomass (plant straw and garbage etc.) (Nan et al., 2012). Vehicle
exhaust emission is the main source of particulate matter. It is necessary to limit the emission of automobile
exhaust, so as to control the emission of exhaust gas (Wang, 2013). The emission of automobile exhaust
pollution has been one of the main components of PM2.5. The high quantity of motor vehicle makes the city
air show the characteristics of compound pollution of soot and motor vehicle exhaust. Motor vehicle exhaust
pollution has been high, and it has become one of the main sources of air pollution of PM2.5. In 1997, the
government announce the implementation of air quality monitoring and air quality weekly in the National City
municipalities and the capital city (Wu, 2000). In 2000, the state begins to implement the city's environmental
air quality monitoring system for monitoring the construction of the project. At present, China's key cities have
been carried out in the field of environmental air quality forecasting and daily work through the use of ambient
air quality automatic monitoring system (Wu et al., 2005; Qi et al., 2000).
PM2.5 is also known as fine particulate matter with a diameter of less than or equal to 2.5 m particles, which
can be suspended in the air for a long time (Yang et al., 2012). Epidemiological investigation of the health
effects of ambient air particulate matter (PM) exposure in North America and Europe has been extensively
studied (Schwartz, 1991; Schwartz, 1996). However, the effects of fine particulate matter (PM2.5), coarse
particulate matter (PM2.5~10) and inhalable particulate matter (PM10) on human health are very different.
DOI: 10.3303/CET1759120
Please cite this article as: Xi Wang, 2017, Application of pm2.5 alarm system based on embedded technology in urban air pollution monitoring, Chemical Engineering Transactions, 59, 715-720 DOI:10.3303/CET1759120
715

PM2.5 can enter the lower respiratory tract of the human body, deposits in the lungs, and even through the
alveoli into the blood. This phenomenon has serious harm to children with lung function growth (Cao et al.,
1992). Based on the health hazards of PM2.5, the U.S. Environmental Protection Agency (USEPA) and the
WHO have developed and revised their respective PM2.5 air quality standards or guidelines. At present,
China's air pollution in large cities showing the characteristics of regional complex pollution (Beijing, Tianjin,
the Yangtze River Delta, Pearl River Delta region as a typical representative), it is mainly manifested as a
serious pollution of fine particles. These features will lead to lower the city's visibility and increase the
frequency of occurrence of haze weather (Li et al., 2010).
China's urban air quality monitoring started relatively late. At present, three methods are used to monitor the
air quality in China, which are instantaneous sampling method, continuous sampling analysis method for 24
hours and air quality automatic monitoring system (AQMS). The main monitoring factors of the instantaneous
sampling method are SO2, TSP and NOX, which are sampled and monitored every 5 days in every season.30
minutes or 1 hours of gas are collected every morning, noon and night, and then detect it by hand. The
sampling time is short, so it can not reflect the change rule of air quality completely and in real time. Therefore,
with the development of the sampling technique, this method has been gradually eliminated (Zhang, 2001;
Wang, 2008). 24h continuous sampling-laboratory analysis is the air quality of all day 24h continuous
sampling and data analysis. This method can truly reflect the daily variation of urban air quality, get the
average daily concentration, and the relative deviation is less than 10% (Zhang, 2001; Liu and Wang, 2001).
At present, most of the cities in our country have established the air quality automatic monitoring system
(AQMS). Air quality automatic monitoring system can monitor more projects, which are CO, NO, NO2, SO2,
particulate matter, wind speed and wind direction, etc. At present, most of China's substation analysis
instruments of the urban air quality monitoring system are able to independently analyze the gas concentration,
through the data transmission device analysis of the data sent to the terminal (Wu, 2000). This monitoring
method cannot be real-time on-line monitoring, but only a simple timing data collection.
2. Measuring principle of PM2.5 concentration
In China, there are three kinds of current PM2.5 detection methods, which are weighing method, betaray
absorption method and micro oscillation balance method. The principle of the weighing method is to direct the
PM2.5 to the membrane, and then weigh the balance. However, the filter does not collect all the PM2.5, and
some of the very small particles can through the membrane. As long as the filter membrane for more than 0.3
micron particles greater than 99% of the interception efficiency, it is considered qualified. Beta ray absorption
method, first of all, the PM2.5 is collected on filter paper, and then irradiated with a beam of beta rays. Then
the light passing through the filter paper and particles due to scattering and attenuation, the degree of
attenuation is proportional to the weight of PM2.5. The weight of PM2.5 can be calculated based on the
attenuation of the radiation.
This paper uses optical dust principle to detect the concentration of PM2.5, which is the Lambert - Beer law.
The content of the law is as follows: the incident light is parallel light and the light’s intensity is I0. When the
incident light is absorbed by particulates with a length of L, the intensity of the emitted light can be expressed
as:
exp( c ) 0I I K L
(1)
Among them, I0- the light intensity before the particulates to be measured; I-the transmitted light intensity after
particulates absorption; K- absorption coefficient; C- measured particulates concentration; L-particulates
length.
We transform the formula (1) to get:
ln 01 Ic
KL I (2)
When the light passes through the measured material, the light intensity is weakened due to the scattering
absorption. Therefore, the concentration of dust is measured by measuring the ratio of light intensity before
and after the measured medium. From the above, we can see that if the light intensity is measured before and
after absorption, the concentration of PM2.5 can be calculated.
3. System design
The principle block diagram of the PM2.5 detection system is shown in figure 1. This system take STM32
monolithic integrated circuit as the core, its peripheral circuit is composed of 4 modules, which are the PM2.5
716

density acquisition module, the signal processing module, the LCD 12864 liquid crystal display module and
the sound and light alarm module. Each module is composed of each other to achieve the following functions.
DSM501 sensor is used to obtain PM2.5 signal, and the PM2.5 signal will be transmitted to the STM32
microcontroller for digital processing. On the one hand, PM2.5 concentration data can be displayed through
the LCD12864 monitor. On the other hand, the buzzer will alarm and the lights will flash when the PM2.5
concentration exceeds the predetermined value, in order to remind people to take preventive measures.
DSM501 sensor
STM32 MCU
signal processing
LCD12864 display
Sound and light alarm
Figure 1: The principle block diagram of the PM2.5 detection system
3.1 PM2.5 detection sensor unit
PM2.5 is also known as fine particulate matter, usually defined in terms of aerodynamics as particles with
diameters less than or equal to 2.5 microns. At the same time, the content of fine particles also represents the
air quality, the higher the concentration of fine particles is, the worse the quality of the environment is. The
module is mainly composed of DSM501 sensors, the use of laser detection principle to detect more than 1
micron dust particles. PWM pulse width modulation output and particle counting principle can be used to
detect airborne particles with diameters of 1um or more. The internal air flow generator can automatically
detect the surrounding air, and has the advantages of small size, light weight and easy installation. When the
air is clean, the Vout output is high. When the pollutant concentration is too high, the output signal of Vout is low.
Figure 2 shows the relationship between the low pulse rate and the number of particles.
Particle number(Kpcs)
Low
pu
lse
rat
e(%
)
Figure 2: The relationship between the low pulse rate and the number of particles
3.2 Data processing module
Figure 3: The smallest system of STM32
717
The data processing module mainly includes 3 parts, which are the amplifier, the filter and the embedded
control module, and the embedded control module uses the STM32F103 monolithic integrated circuit. The
STM32 series is based on the ARM Cortex-0 core designed specifically for high performance, low cost and
low power embedded applications. STM32 is the core of PM2.5 detection system, which connects the other
modules and controls the work of each module. First of all, the PM2.5 acquisition module sends the collected
signal to the STM32 microcontroller after signal processing. Then the treatment of PM2.5 concentration data is
displayed by the LCD display module. Finally, the alarm module is used to judge the concentration range of
PM2.5, so as to realize the detection and early warning of the whole system. The smallest system of STM32 is
shown in figure 3.
3.3 LCD display module
LCD display module is located in the PM2.5 concentration detection receiver, which is used to display the
value of PM2.5 concentration and clock. This paper chooses LCD12864 as the monitor. The LCD12864
module is a dot matrix graphic LCD module with 4 bit /8 bit parallelism and a variety of interface modes of 2
wire or 3 wire serial interface. With a built-in ASCII of 8192 characters and a set of 128 characters, the display
resolution is 128 * 64. By using the flexible interface of the module and the simple and convenient operation
instructions, it can be used to form the Chinese human computer interactive graphic interface. Low voltage
and low power consumption is another notable feature. Using a single + 5V or 3.3V power supply, the reset
circuit contains a variety of control commands. In addition, it also has the characteristics of low price and high
cost performance.
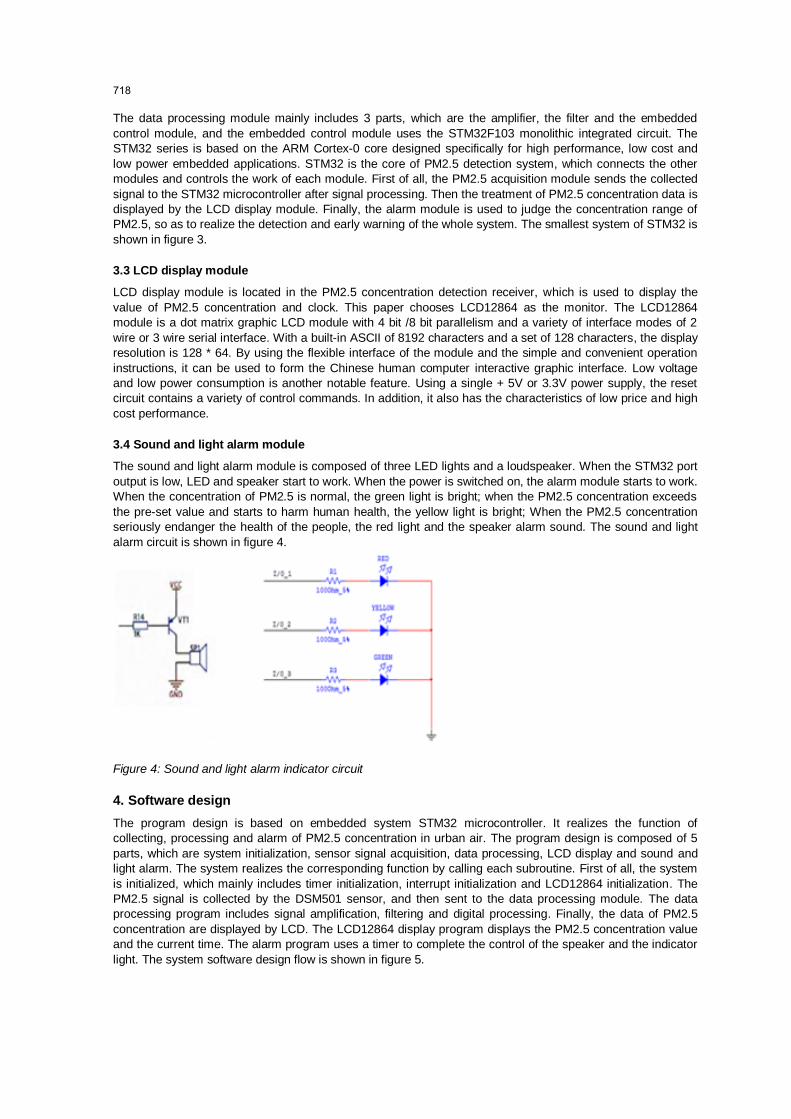
3.4 Sound and light alarm module
The sound and light alarm module is composed of three LED lights and a loudspeaker. When the STM32 port
output is low, LED and speaker start to work. When the power is switched on, the alarm module starts to work.
When the concentration of PM2.5 is normal, the green light is bright; when the PM2.5 concentration exceeds
the pre-set value and starts to harm human health, the yellow light is bright; When the PM2.5 concentration
seriously endanger the health of the people, the red light and the speaker alarm sound. The sound and light
alarm circuit is shown in figure 4.
Figure 4: Sound and light alarm indicator circuit
4. Software design
The program design is based on embedded system STM32 microcontroller. It realizes the function of
collecting, processing and alarm of PM2.5 concentration in urban air. The program design is composed of 5
parts, which are system initialization, sensor signal acquisition, data processing, LCD display and sound and
light alarm. The system realizes the corresponding function by calling each subroutine. First of all, the system
is initialized, which mainly includes timer initialization, interrupt initialization and LCD12864 initialization. The
PM2.5 signal is collected by the DSM501 sensor, and then sent to the data processing module. The data
processing program includes signal amplification, filtering and digital processing. Finally, the data of PM2.5
concentration are displayed by LCD. The LCD12864 display program displays the PM2.5 concentration value
and the current time. The alarm program uses a timer to complete the control of the speaker and the indicator
light. The system software design flow is shown in figure 5.
718

Start
PM2.5 concentration display
Acquisition of PM2.5 signal
Sensor preheating
System initialization
data processing
Does the PM2.5 concentration exceed the threshold?
N
Y
Sound and light alarm
Is the dust particles larger than 1 microns?
Y
N
End
Figure 5: System software design flow
5. The experiment results
Table 1: PM2.5 monitoring data in different places in one day
Time Residential
(ug/m3)
Shopping
mall(ug/m3)
Office
building(ug/m3)
Outdoor
(ug/m3)
00:00
01:00
02:00
03:00
04:00
05:00
06:00
07:00
08:00
09:00
10:00
11:00
12:00
13:00
14:00
15:00
16:00
17:00
18:00
19:00
20:00
21:00
22:00
23:00
38.3
42.4
41.9
46.7
49.8
54.9
69.2
78.6
92.3
97.1
99.9
118.4
119.5
115.3
116.7
88.5
56.7
53.9
65.2
68.5
52.8
46.3
43.5
36.8
35.9
29.5
31.9
38.7
43.1
50.6
57.9
65.8
77.5
88.6
97.8
123.7
126.5
118.4
120.1
92.6
76.7
91.2
88.8
81.0
59.7
53.2
47.7
39.8
52.8
49.2
42.1
48.9
57.4
63.2
68.9
79.8
83.2
86.1
93.0
124.5
128.4
112.4
103.6
85.7
65.3
72.1
93.5
98.4
85.6
74.8
60.4
57.3
56.7
48.9
36.5
39.3
45.4
50.2
84.8
113.6
159.4
164.3
172.6
198.7
205.3
190.4
183.6
144.9
72.9
85.8
107.4
124.5
93.8
82.8
71.4
67.5
The PM2.5 monitoring system is put into different places in a city to test, and the experimental results show
that the PM2.5 concentration changes with time as shown in table 1. As can be seen from table 1, with the
passage of time, the concentration of PM2.5 in the city gradually increased, and the outdoor PM2.5
concentration is significantly higher than indoor. The air quality grade PM2.5 standard value is defined as
719

follows: less than 75 (ug/m3) is considered normal, 75~150 (ug/m3)is defined as mild pollution, 150~250 (ug
/m3) is defined as severe pollution, and 250 (ug /m3) and above is defined as serious pollution. According to
the standard, the design of the system uses red, yellow and green lights to indicate the different
concentrations of PM2.5. When the concentration of PM2.5 is less than 75, the green light is lit. When the
concentration of PM2.5 in urban environment is more than 75 less than 250, the yellow light is illuminated.
When the concentration of PM2.5 detected in the urban environment is greater than or equal to 250, the red
light is lighted, and the alarm sound is sent out by the loudspeaker to remind the public to pay attention to the
safety of travel. The system realizes the real-time monitoring of the change of PM2.5 concentration in urban
environment.
6. Conclusion
In this paper, the real-time monitoring system of PM2.5 concentration based on embedded technology has the
advantages of simple structure, low cost, high precision, low power consumption, simple operation and stable
performance. The system can monitor, display, alarm and control the concentration of PM2.5 in the key
environmental indicators of urban air. The utility model has the advantages of accurate measurement, good
safety and strong applicability. This paper uses STM32 MCU control system. PM2.5 sensor DSM501 is used
to collect PM2.5 signal. LCD12864 liquid crystal display is used to display the real-time value of PM2.5
concentration and the current time. The speaker and the tricolor lantern are used to realize the function of
limiting the sound and light alarm. The system realizes the real-time monitoring of PM2.5 index of urban air
pollution. The experimental results show that the system has the advantages of good real-time performance,
convenient operation, stable performance and strong adaptability. It realizes the real-time monitoring, display
and early warning of urban PM2.5 concentration, which is advanced and innovative.
References
Cao S.R., Chen B.S., Hong C.J., 1992, Soot pollution and health. Beijing: China Environmental Science Press.
Li W.F., Bai Z.P., Shi J.W., 2010, Pollution characteristics and sources of fine particles in ambient air of Tianjin
City. Journal of environmental science research, 4, 15.
Liu H., Wang Y., 2001, About environment automatic monitoring system design and scheme discussion.
Shanghai Environmental Science, 20(3), 111-113.
Nan M.J., Bu X.H., 2012, Analysis of pollutant sources of primary air pollution in Nanjing area. Journal of Tibet
technology, 8, 15.
Qi W.Q., Sun Z.Q., Bian G.G., 2000, New technology of environmental monitoring. Beijing: chemical industry
press, 1-6.
Schwartz J., 1991, Environ. Res, 56, 204-213.
Schwartz J., 1996, Epidemial, 7, 20-28.
Wang S.H., 2008, Design of air quality monitoring system based on GPRS. Dissertation of Hunan University,
3-4.
Wang Z.P., 2013, The main source of air pollution and targeted against. North environment, 1, 28.
Wu B.C., 2000, Analysis of air quality monitoring operation mode, Yunnan Environmental Science, 12(4), 51-
52.
Wu B.C., Fei L., 2005, Modern environmental monitoring technology. Beijing: China Environmental Science
Press, 1-12.
Yang H.B., Zou X.D., Wang H.Y., 2012, Research progress and Prospect of PM2.5 in atmospheric
environment. Journal of weather and environment, 28(3), 77-82.
Zhang L., 2001, Evaluation and Research on the relevance of regional traffic environment. Dissertation of
Northeast Forestry University, 5-16.
720