Embed Size (px)
Citation preview
BI0310 – MAPLA 2007 - 1 -
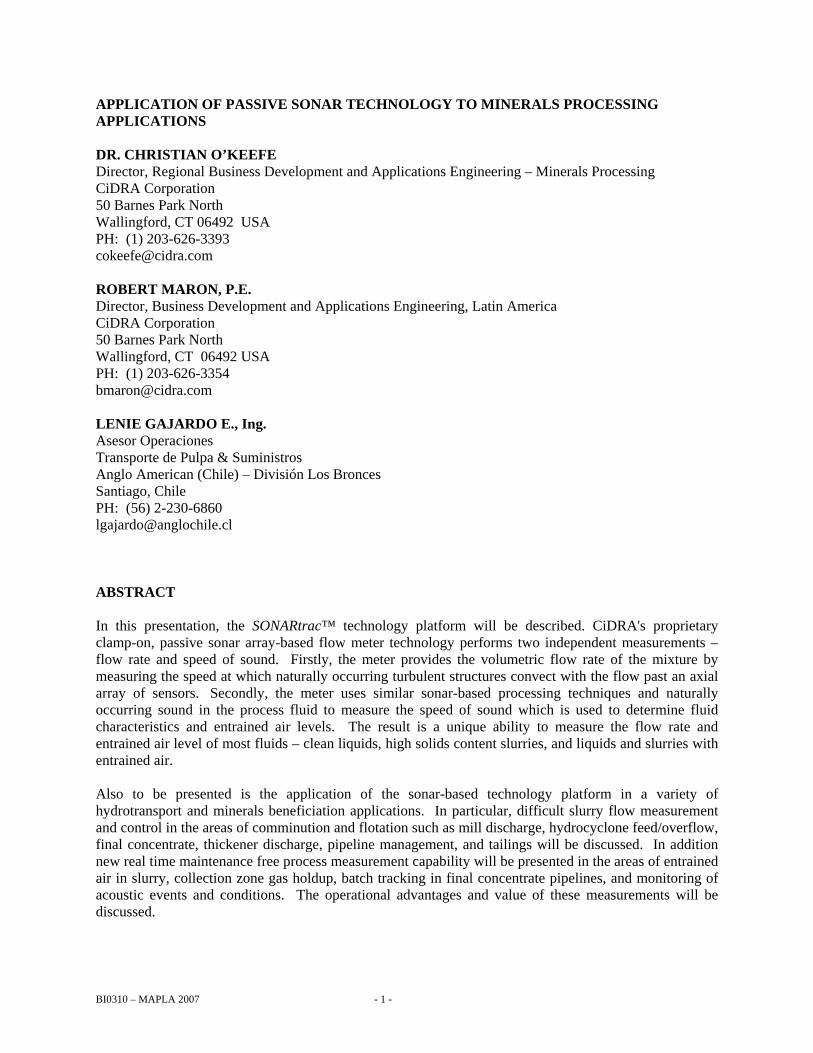
APPLICATION OF PASSIVE SONAR TECHNOLOGY TO MINERALS PROCESSING APPLICATIONS
DR. CHRISTIAN O’KEEFE Director, Regional Business Development and Applications Engineering – Minerals Processing CiDRA Corporation 50 Barnes Park North Wallingford, CT 06492 USA PH: (1) 203-626-3393 [email protected]
ROBERT MARON, P.E. Director, Business Development and Applications Engineering, Latin America CiDRA Corporation 50 Barnes Park North Wallingford, CT 06492 USA PH: (1) 203-626-3354 [email protected]
LENIE GAJARDO E., Ing. Asesor Operaciones Transporte de Pulpa & Suministros Anglo American (Chile) – División Los Bronces Santiago, Chile PH: (56) 2-230-6860 [email protected]
ABSTRACT In this presentation, the SONARtrac™ technology platform will be described. CiDRA's proprietary clamp-on, passive sonar array-based flow meter technology performs two independent measurements – flow rate and speed of sound. Firstly, the meter provides the volumetric flow rate of the mixture by measuring the speed at which naturally occurring turbulent structures convect with the flow past an axial array of sensors. Secondly, the meter uses similar sonar-based processing techniques and naturally occurring sound in the process fluid to measure the speed of sound which is used to determine fluid characteristics and entrained air levels. The result is a unique ability to measure the flow rate and entrained air level of most fluids – clean liquids, high solids content slurries, and liquids and slurries with entrained air. Also to be presented is the application of the sonar-based technology platform in a variety of hydrotransport and minerals beneficiation applications. In particular, difficult slurry flow measurement and control in the areas of comminution and flotation such as mill discharge, hydrocyclone feed/overflow, final concentrate, thickener discharge, pipeline management, and tailings will be discussed. In addition new real time maintenance free process measurement capability will be presented in the areas of entrained air in slurry, collection zone gas holdup, batch tracking in final concentrate pipelines, and monitoring of acoustic events and conditions. The operational advantages and value of these measurements will be discussed.
BI0310 – MAPLA 2007 - 2 -
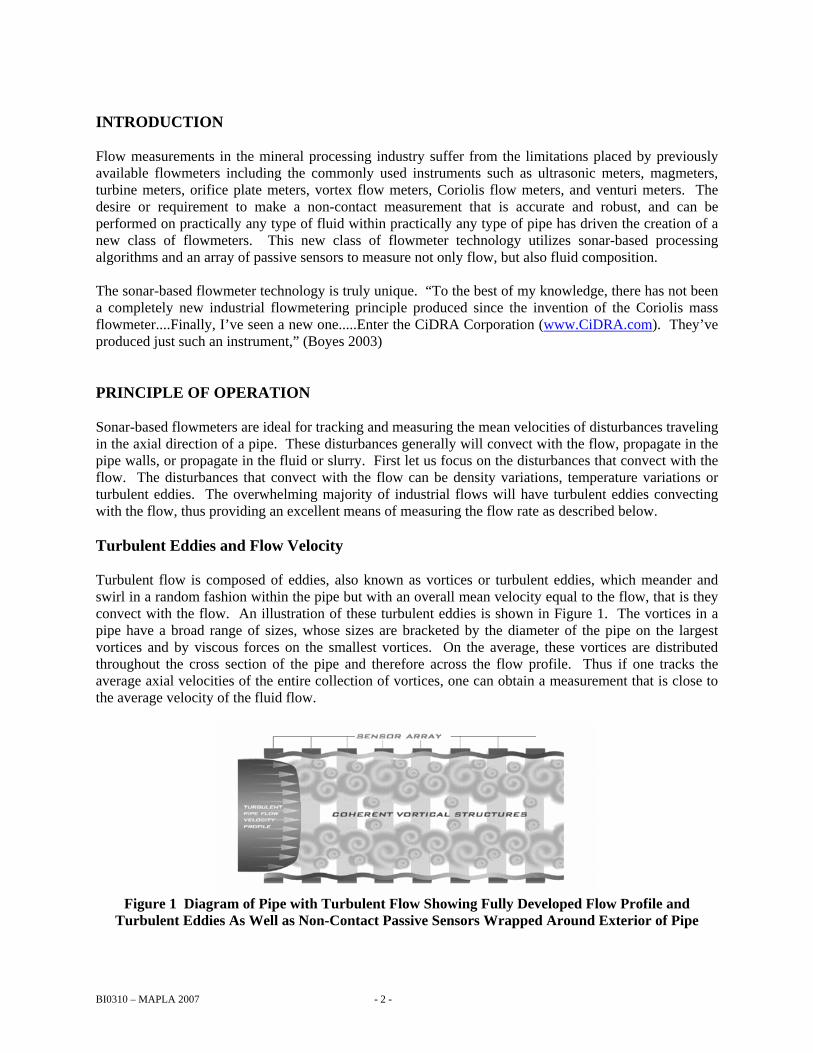
INTRODUCTION Flow measurements in the mineral processing industry suffer from the limitations placed by previously available flowmeters including the commonly used instruments such as ultrasonic meters, magmeters, turbine meters, orifice plate meters, vortex flow meters, Coriolis flow meters, and venturi meters. The desire or requirement to make a non-contact measurement that is accurate and robust, and can be performed on practically any type of fluid within practically any type of pipe has driven the creation of a new class of flowmeters. This new class of flowmeter technology utilizes sonar-based processing algorithms and an array of passive sensors to measure not only flow, but also fluid composition. The sonar-based flowmeter technology is truly unique. “To the best of my knowledge, there has not been a completely new industrial flowmetering principle produced since the invention of the Coriolis mass flowmeter....Finally, I’ve seen a new one.....Enter the CiDRA Corporation (www.CiDRA.com). They’ve produced just such an instrument,” (Boyes 2003) PRINCIPLE OF OPERATION Sonar-based flowmeters are ideal for tracking and measuring the mean velocities of disturbances traveling in the axial direction of a pipe. These disturbances generally will convect with the flow, propagate in the pipe walls, or propagate in the fluid or slurry. First let us focus on the disturbances that convect with the flow. The disturbances that convect with the flow can be density variations, temperature variations or turbulent eddies. The overwhelming majority of industrial flows will have turbulent eddies convecting with the flow, thus providing an excellent means of measuring the flow rate as described below. Turbulent Eddies and Flow Velocity Turbulent flow is composed of eddies, also known as vortices or turbulent eddies, which meander and swirl in a random fashion within the pipe but with an overall mean velocity equal to the flow, that is they convect with the flow. An illustration of these turbulent eddies is shown in Figure 1. The vortices in a pipe have a broad range of sizes, whose sizes are bracketed by the diameter of the pipe on the largest vortices and by viscous forces on the smallest vortices. On the average, these vortices are distributed throughout the cross section of the pipe and therefore across the flow profile. Thus if one tracks the average axial velocities of the entire collection of vortices, one can obtain a measurement that is close to the average velocity of the fluid flow.
Figure 1 Diagram of Pipe with Turbulent Flow Showing Fully Developed Flow Profile and
Turbulent Eddies As Well as Non-Contact Passive Sensors Wrapped Around Exterior of Pipe
BI0310 – MAPLA 2007 - 3 -
Array Measurement of Flow Velocity Through the combination of an array of passive sensors and the sonar array processing algorithms, the average axial velocities of a collection of vortices is obtained. The sequence of events to perform this measurement is as follows:
The movement of the turbulent eddies creates a small pressure change on the inside of the pipe wall
This small pressure changes results in a dynamic strain of the pipe wall itself (Figure 1 exaggerates)
The mechanical dynamic strain signal is converted to an electrical signal through a passive sensor wrapped partially or fully around the pipe – no couplant gels or liquids are required
This electrical signal is interpreted as a characteristic signature of the frequency and phase components of the turbulent eddies under the sensor.
This characteristic signature is detected by each element of the array of sensors. These sensors are spaced a precisely set distance from each other along the axial direction of the pipe.
An array processing algorithm combines the phase and frequency information of the sensor array elements to calculate the velocity of the characteristic signature as it convects under the array of sensors.
The challenges of performing this measurement in a practical manner are many. These include the challenges of operating in an environment with large pumps, flow generated acoustics, and vibrations all of which can cause large dynamic straining of the pipe. The impact of these effects is that the dynamic strain due to the passive turbulent eddies is usually much smaller than the dynamic strain arising from pipe vibrations and acoustic waves propagating in the fluid. The strength in the array processing algorithm is its ability to isolate and measure the velocities of these different components, including the weak signal from the convecting turbulent eddies, and the strong signals from the acoustic waves and vibrations. Typically flowmeters do not provide an indication of the quality of the measurement. Conversely, in the sonar processing algorithm such a quality factor can be generated by comparing the strength of the velocity measurement against background energy levels. A quality factor ranging from 0 to 1.0 is generated, with any flow measurement providing a quality factor above 0.1 to 0.2 (depending on the application) having the confidence as being a good measurement. Currently this technology can report the volume flow rate on liquids and slurries with flow velocities extending from 3 to several hundred ft/sec. The technology lends itself to measurement on practically any pipe size, as long as the flow is turbulent, and for some non-Newtonian fluids, even without turbulence. The pipe must be full but it can have entrained air in the form of well mixed bubbles. Calibration and its maintenance The volume flow measurement provided by tracking the turbulent eddies does require some adjustment or calibration. In practice the calibration adjusts the reported output by only a few percent, depending on the Reynolds number. After applying a correction factor, the offset is brought to within +/- 0.5% under these reference conditions as seen in Figure 2. In the field, without in-line calibration, our accuracy specification is +/1.0%. Since the flow measurement and hence calibration is not dependent on the absolute values of any analog signals, it will not drift with time or temperature. Maintenance of the calibration from meter to meter and
BI0310 – MAPLA 2007 - 4 -
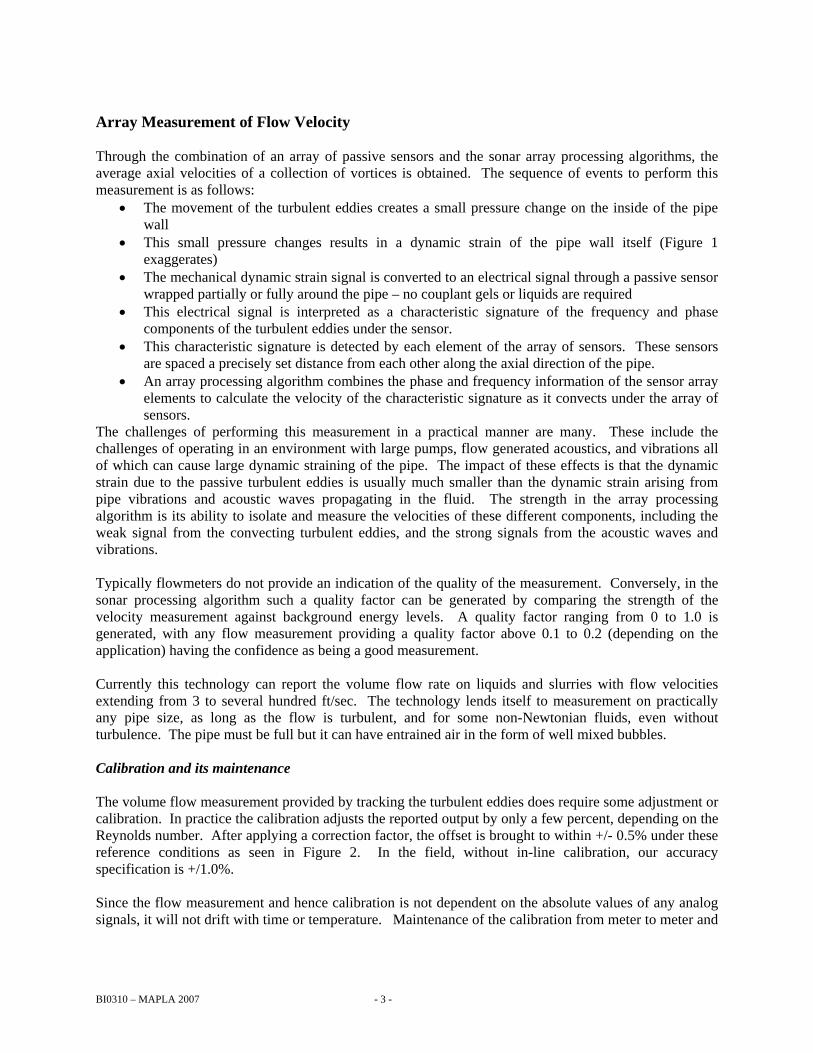
from temperature effects and aging is dependent on maintaining the spacing between the sensor elements and maintaining the stability of the clock used in the digitizer. The spacing between the sensors is set in the factory where they are bonded to a stainless steel sheet and cannot be adjusted by the customer. The clock stability is better than 0.01% and thus is 50 times better than the technology’s typical accuracy of +/- 1% in the field; and +/- 0.5% under reference conditions or after in-field supplemental calibration. As a result the impact of clock stability can be neglected. In Figure 2 one can see the results from applying the same calibration coefficients to six flowmeters, all of the 6-inch variety and all tested on the same pipe. As can be seen, the meter to meter variation is quite low and will not change with time.
Production SONARtrac Flow Meter Data
-1.00%
-0.75%
-0.50%
-0.25%
0.00%
0.25%
0.50%
0.75%
1.00%
0.00E+00 5.00E+05 1.00E+06 1.50E+06 2.00E+06 2.50E+06 3.00E+06
Re
Off
set
(%)
+/-0.5%95% Confidence Level = 0.42%SN060830085-109 Sch 10 T 10D B2SN060830085-111 Sch 10 T 5D B2SN060830085-115 Sch 10 T 10D B2SN060830085-116 Sch 10 T 5D B2SN060830085-117 Sch 10 T 10D B2SN060830085-118 Sch 10 T 5D B2SN060830085-109 Sch 10 T 10D B1SN060830085-111 Sch 10 T 5D B1
Figure 2 Illustration of Calibration Consistency from Meter to Meter. All Meters Have Same
Calibration Coefficients. Array Measurement of Acoustic Waves
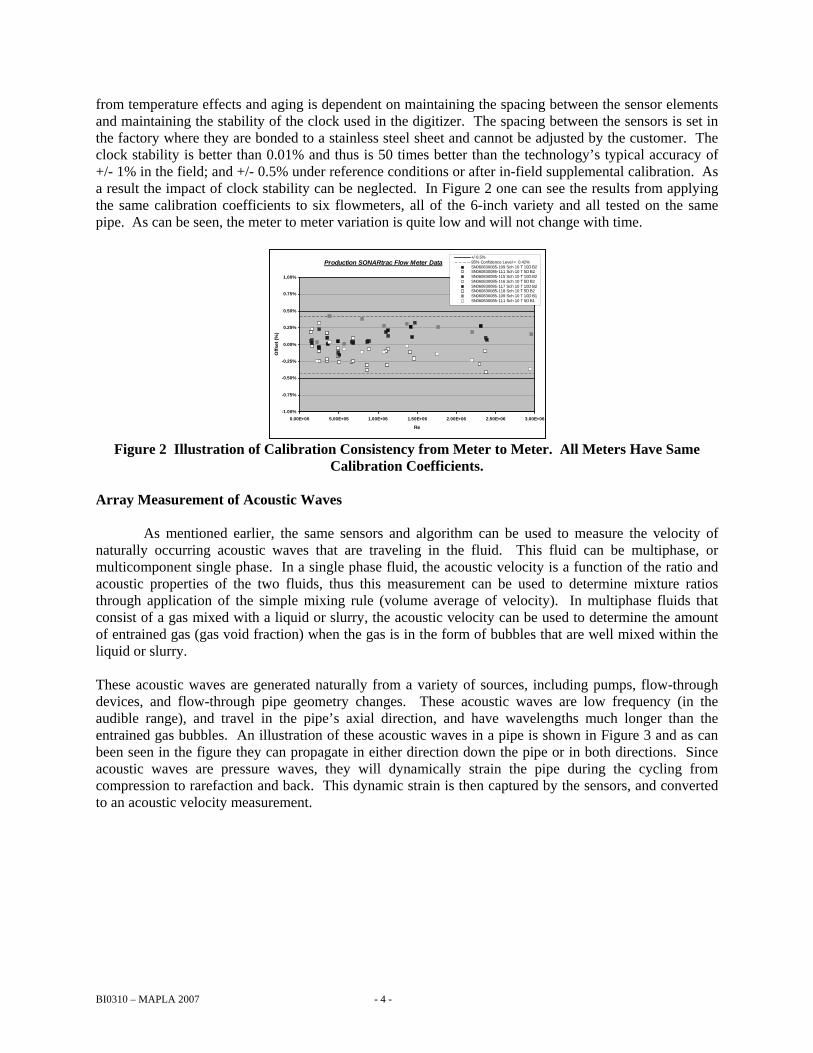
As mentioned earlier, the same sensors and algorithm can be used to measure the velocity of naturally occurring acoustic waves that are traveling in the fluid. This fluid can be multiphase, or multicomponent single phase. In a single phase fluid, the acoustic velocity is a function of the ratio and acoustic properties of the two fluids, thus this measurement can be used to determine mixture ratios through application of the simple mixing rule (volume average of velocity). In multiphase fluids that consist of a gas mixed with a liquid or slurry, the acoustic velocity can be used to determine the amount of entrained gas (gas void fraction) when the gas is in the form of bubbles that are well mixed within the liquid or slurry. These acoustic waves are generated naturally from a variety of sources, including pumps, flow-through devices, and flow-through pipe geometry changes. These acoustic waves are low frequency (in the audible range), and travel in the pipe’s axial direction, and have wavelengths much longer than the entrained gas bubbles. An illustration of these acoustic waves in a pipe is shown in Figure 3 and as can been seen in the figure they can propagate in either direction down the pipe or in both directions. Since acoustic waves are pressure waves, they will dynamically strain the pipe during the cycling from compression to rarefaction and back. This dynamic strain is then captured by the sensors, and converted to an acoustic velocity measurement.
BI0310 – MAPLA 2007 - 5 -
Figure 3 Illustration of Naturally Occurring Acoustic Waves Propagating in Pipe under the Sonar
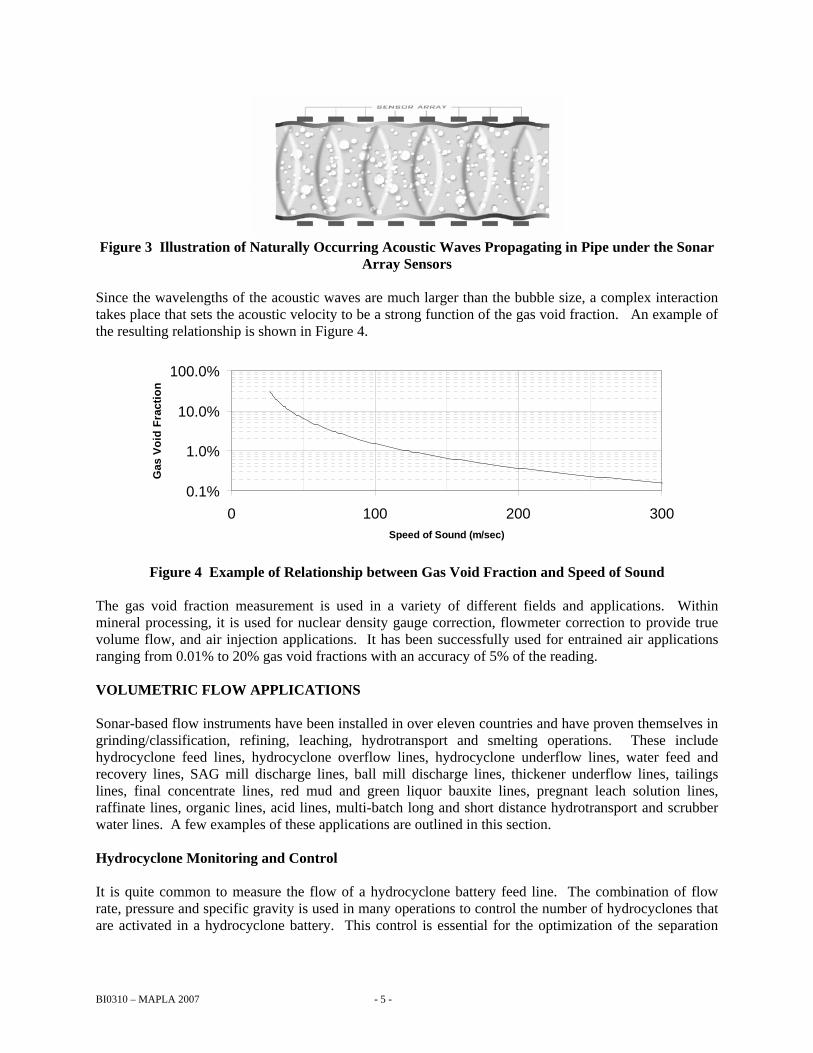
Array Sensors Since the wavelengths of the acoustic waves are much larger than the bubble size, a complex interaction takes place that sets the acoustic velocity to be a strong function of the gas void fraction. An example of the resulting relationship is shown in Figure 4.
0.1%
1.0%
10.0%
100.0%
0 100 200 300Speed of Sound (m/sec)
Gas
Vo
id F
ract
ion
Figure 4 Example of Relationship between Gas Void Fraction and Speed of Sound The gas void fraction measurement is used in a variety of different fields and applications. Within mineral processing, it is used for nuclear density gauge correction, flowmeter correction to provide true volume flow, and air injection applications. It has been successfully used for entrained air applications ranging from 0.01% to 20% gas void fractions with an accuracy of 5% of the reading. VOLUMETRIC FLOW APPLICATIONS Sonar-based flow instruments have been installed in over eleven countries and have proven themselves in grinding/classification, refining, leaching, hydrotransport and smelting operations. These include hydrocyclone feed lines, hydrocyclone overflow lines, hydrocyclone underflow lines, water feed and recovery lines, SAG mill discharge lines, ball mill discharge lines, thickener underflow lines, tailings lines, final concentrate lines, red mud and green liquor bauxite lines, pregnant leach solution lines, raffinate lines, organic lines, acid lines, multi-batch long and short distance hydrotransport and scrubber water lines. A few examples of these applications are outlined in this section. Hydrocyclone Monitoring and Control It is quite common to measure the flow of a hydrocyclone battery feed line. The combination of flow rate, pressure and specific gravity is used in many operations to control the number of hydrocyclones that are activated in a hydrocyclone battery. This control is essential for the optimization of the separation
BI0310 – MAPLA 2007 - 6 -
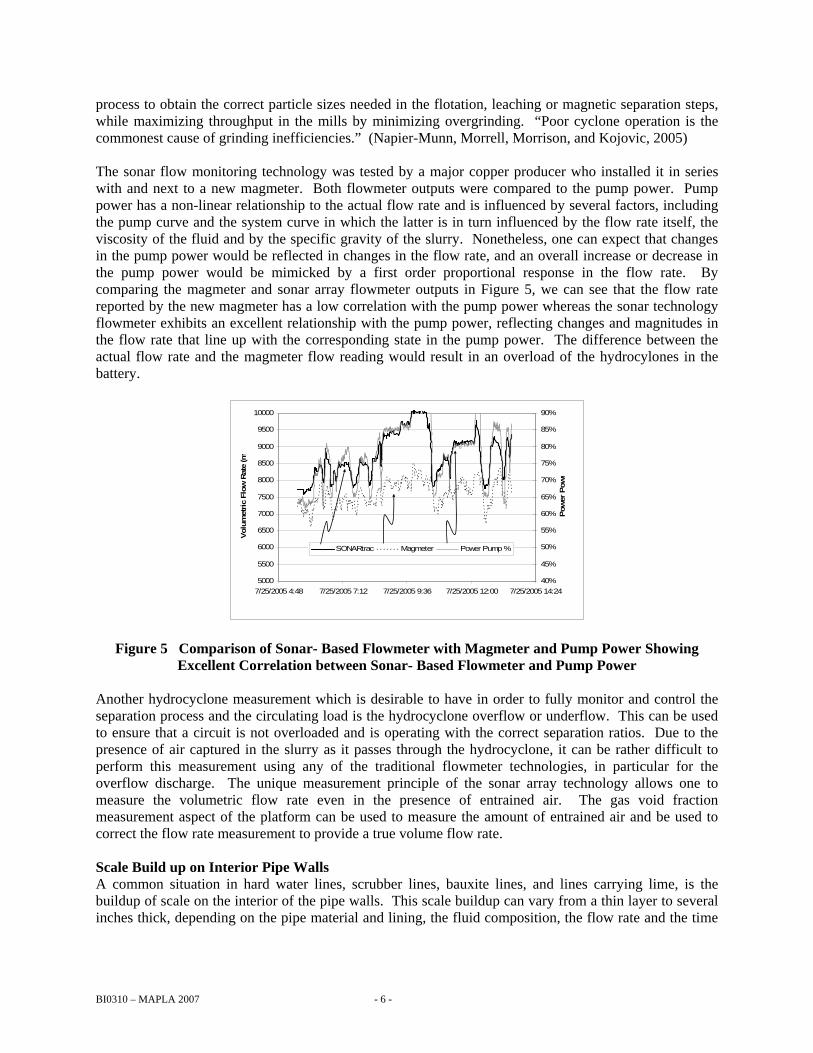
process to obtain the correct particle sizes needed in the flotation, leaching or magnetic separation steps, while maximizing throughput in the mills by minimizing overgrinding. “Poor cyclone operation is the commonest cause of grinding inefficiencies.” (Napier-Munn, Morrell, Morrison, and Kojovic, 2005) The sonar flow monitoring technology was tested by a major copper producer who installed it in series with and next to a new magmeter. Both flowmeter outputs were compared to the pump power. Pump power has a non-linear relationship to the actual flow rate and is influenced by several factors, including the pump curve and the system curve in which the latter is in turn influenced by the flow rate itself, the viscosity of the fluid and by the specific gravity of the slurry. Nonetheless, one can expect that changes in the pump power would be reflected in changes in the flow rate, and an overall increase or decrease in the pump power would be mimicked by a first order proportional response in the flow rate. By comparing the magmeter and sonar array flowmeter outputs in Figure 5, we can see that the flow rate reported by the new magmeter has a low correlation with the pump power whereas the sonar technology flowmeter exhibits an excellent relationship with the pump power, reflecting changes and magnitudes in the flow rate that line up with the corresponding state in the pump power. The difference between the actual flow rate and the magmeter flow reading would result in an overload of the hydrocylones in the battery.
5000
5500
6000
6500
7000
7500
8000
8500
9000
9500
10000
7/25/2005 4:48 7/25/2005 7:12 7/25/2005 9:36 7/25/2005 12:00 7/25/2005 14:24
Volu
met
ric
Flo
w R
ate
(m
40%
45%
50%
55%
60%
65%
70%
75%
80%
85%
90%
Pow
er P
ow
e
SONARtrac Magmeter Power Pump %
Figure 5 Comparison of Sonar- Based Flowmeter with Magmeter and Pump Power Showing Excellent Correlation between Sonar- Based Flowmeter and Pump Power
Another hydrocyclone measurement which is desirable to have in order to fully monitor and control the separation process and the circulating load is the hydrocyclone overflow or underflow. This can be used to ensure that a circuit is not overloaded and is operating with the correct separation ratios. Due to the presence of air captured in the slurry as it passes through the hydrocyclone, it can be rather difficult to perform this measurement using any of the traditional flowmeter technologies, in particular for the overflow discharge. The unique measurement principle of the sonar array technology allows one to measure the volumetric flow rate even in the presence of entrained air. The gas void fraction measurement aspect of the platform can be used to measure the amount of entrained air and be used to correct the flow rate measurement to provide a true volume flow rate. Scale Build up on Interior Pipe Walls A common situation in hard water lines, scrubber lines, bauxite lines, and lines carrying lime, is the buildup of scale on the interior of the pipe walls. This scale buildup can vary from a thin layer to several inches thick, depending on the pipe material and lining, the fluid composition, the flow rate and the time
BI0310 – MAPLA 2007 - 7 -
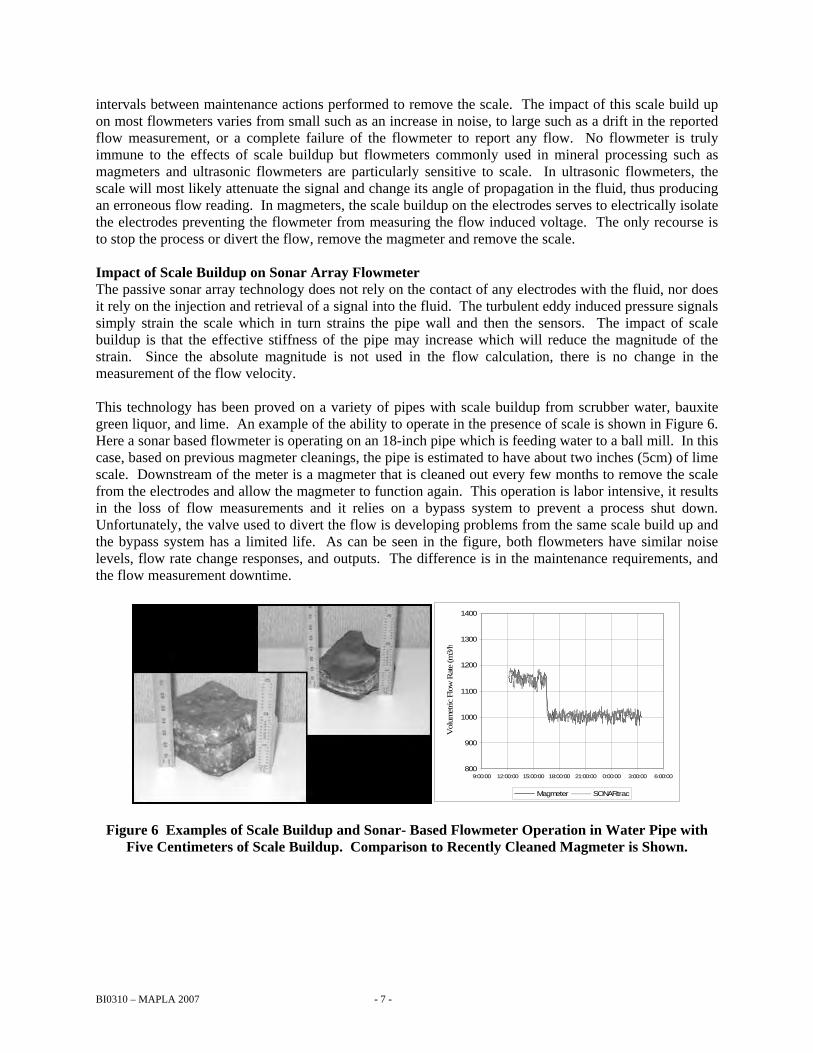
intervals between maintenance actions performed to remove the scale. The impact of this scale build up on most flowmeters varies from small such as an increase in noise, to large such as a drift in the reported flow measurement, or a complete failure of the flowmeter to report any flow. No flowmeter is truly immune to the effects of scale buildup but flowmeters commonly used in mineral processing such as magmeters and ultrasonic flowmeters are particularly sensitive to scale. In ultrasonic flowmeters, the scale will most likely attenuate the signal and change its angle of propagation in the fluid, thus producing an erroneous flow reading. In magmeters, the scale buildup on the electrodes serves to electrically isolate the electrodes preventing the flowmeter from measuring the flow induced voltage. The only recourse is to stop the process or divert the flow, remove the magmeter and remove the scale. Impact of Scale Buildup on Sonar Array Flowmeter The passive sonar array technology does not rely on the contact of any electrodes with the fluid, nor does it rely on the injection and retrieval of a signal into the fluid. The turbulent eddy induced pressure signals simply strain the scale which in turn strains the pipe wall and then the sensors. The impact of scale buildup is that the effective stiffness of the pipe may increase which will reduce the magnitude of the strain. Since the absolute magnitude is not used in the flow calculation, there is no change in the measurement of the flow velocity. This technology has been proved on a variety of pipes with scale buildup from scrubber water, bauxite green liquor, and lime. An example of the ability to operate in the presence of scale is shown in Figure 6. Here a sonar based flowmeter is operating on an 18-inch pipe which is feeding water to a ball mill. In this case, based on previous magmeter cleanings, the pipe is estimated to have about two inches (5cm) of lime scale. Downstream of the meter is a magmeter that is cleaned out every few months to remove the scale from the electrodes and allow the magmeter to function again. This operation is labor intensive, it results in the loss of flow measurements and it relies on a bypass system to prevent a process shut down. Unfortunately, the valve used to divert the flow is developing problems from the same scale build up and the bypass system has a limited life. As can be seen in the figure, both flowmeters have similar noise levels, flow rate change responses, and outputs. The difference is in the maintenance requirements, and the flow measurement downtime.
800
900
1000
1100
1200
1300
1400
9:00:00 12:00:00 15:00:00 18:00:00 21:00:00 0:00:00 3:00:00 6:00:00
Vol
umet
ric
Flo
w R
ate
(m3/
h
Magmeter SONARtrac
Figure 6 Examples of Scale Buildup and Sonar- Based Flowmeter Operation in Water Pipe with
Five Centimeters of Scale Buildup. Comparison to Recently Cleaned Magmeter is Shown.
BI0310 – MAPLA 2007 - 8 -
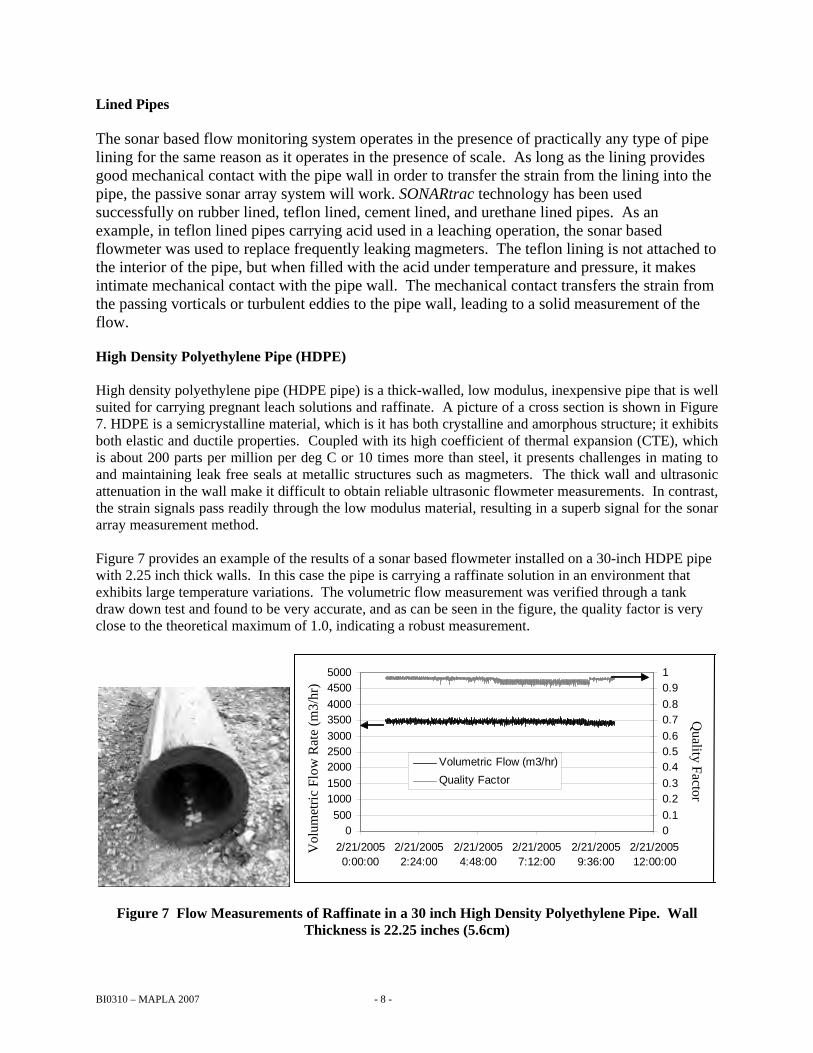
Lined Pipes The sonar based flow monitoring system operates in the presence of practically any type of pipe lining for the same reason as it operates in the presence of scale. As long as the lining provides good mechanical contact with the pipe wall in order to transfer the strain from the lining into the pipe, the passive sonar array system will work. SONARtrac technology has been used successfully on rubber lined, teflon lined, cement lined, and urethane lined pipes. As an example, in teflon lined pipes carrying acid used in a leaching operation, the sonar based flowmeter was used to replace frequently leaking magmeters. The teflon lining is not attached to the interior of the pipe, but when filled with the acid under temperature and pressure, it makes intimate mechanical contact with the pipe wall. The mechanical contact transfers the strain from the passing vorticals or turbulent eddies to the pipe wall, leading to a solid measurement of the flow. High Density Polyethylene Pipe (HDPE) High density polyethylene pipe (HDPE pipe) is a thick-walled, low modulus, inexpensive pipe that is well suited for carrying pregnant leach solutions and raffinate. A picture of a cross section is shown in Figure 7. HDPE is a semicrystalline material, which is it has both crystalline and amorphous structure; it exhibits both elastic and ductile properties. Coupled with its high coefficient of thermal expansion (CTE), which is about 200 parts per million per deg C or 10 times more than steel, it presents challenges in mating to and maintaining leak free seals at metallic structures such as magmeters. The thick wall and ultrasonic attenuation in the wall make it difficult to obtain reliable ultrasonic flowmeter measurements. In contrast, the strain signals pass readily through the low modulus material, resulting in a superb signal for the sonar array measurement method. Figure 7 provides an example of the results of a sonar based flowmeter installed on a 30-inch HDPE pipe with 2.25 inch thick walls. In this case the pipe is carrying a raffinate solution in an environment that exhibits large temperature variations. The volumetric flow measurement was verified through a tank draw down test and found to be very accurate, and as can be seen in the figure, the quality factor is very close to the theoretical maximum of 1.0, indicating a robust measurement.
0500
10001500
200025003000
35004000
45005000
2/21/20050:00:00
2/21/20052:24:00
2/21/20054:48:00
2/21/20057:12:00
2/21/20059:36:00
2/21/200512:00:00
00.1
0.20.3
0.40.50.6
0.70.8
0.91
Volumetric Flow (m3/hr)
Quality Factor
Vol
umet
ric
Flo
wR
ate
(m3/
hr)
Quality
Factor
0500
10001500
200025003000
35004000
45005000
2/21/20050:00:00
2/21/20052:24:00
2/21/20054:48:00
2/21/20057:12:00
2/21/20059:36:00
2/21/200512:00:00
00.1
0.20.3
0.40.50.6
0.70.8
0.91
Volumetric Flow (m3/hr)
Quality Factor
Vol
umet
ric
Flo
wR
ate
(m3/
hr)
Quality
Factor
Figure 7 Flow Measurements of Raffinate in a 30 inch High Density Polyethylene Pipe. Wall Thickness is 22.25 inches (5.6cm)
BI0310 – MAPLA 2007 - 9 -
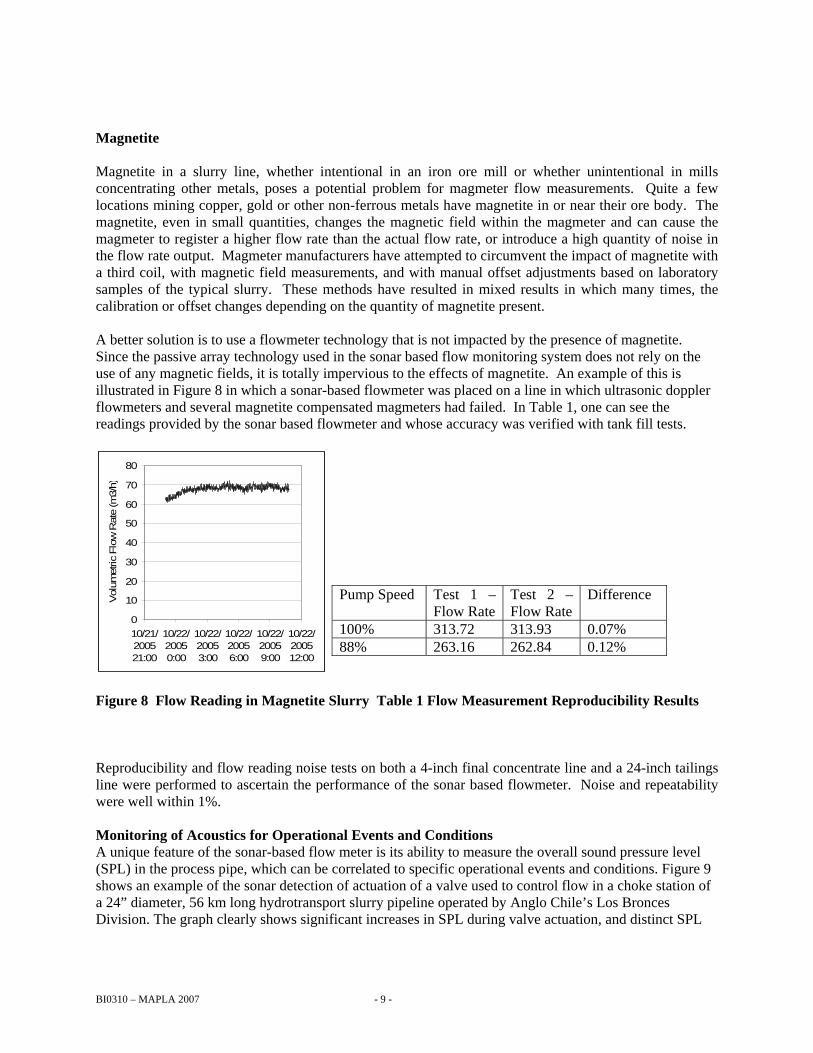
Magnetite Magnetite in a slurry line, whether intentional in an iron ore mill or whether unintentional in mills concentrating other metals, poses a potential problem for magmeter flow measurements. Quite a few locations mining copper, gold or other non-ferrous metals have magnetite in or near their ore body. The magnetite, even in small quantities, changes the magnetic field within the magmeter and can cause the magmeter to register a higher flow rate than the actual flow rate, or introduce a high quantity of noise in the flow rate output. Magmeter manufacturers have attempted to circumvent the impact of magnetite with a third coil, with magnetic field measurements, and with manual offset adjustments based on laboratory samples of the typical slurry. These methods have resulted in mixed results in which many times, the calibration or offset changes depending on the quantity of magnetite present. A better solution is to use a flowmeter technology that is not impacted by the presence of magnetite. Since the passive array technology used in the sonar based flow monitoring system does not rely on the use of any magnetic fields, it is totally impervious to the effects of magnetite. An example of this is illustrated in Figure 8 in which a sonar-based flowmeter was placed on a line in which ultrasonic doppler flowmeters and several magnetite compensated magmeters had failed. In Table 1, one can see the readings provided by the sonar based flowmeter and whose accuracy was verified with tank fill tests.
0
10
20
30
40
50
60
70
80
10/21/200521:00
10/22/20050:00
10/22/20053:00
10/22/20056:00
10/22/20059:00
10/22/200512:00
Volu
metric
Flo
w R
ate
(m
3/h
)
Pump Speed Test 1 – Flow Rate
Test 2 – Flow Rate
Difference
100% 313.72 313.93 0.07% 88% 263.16 262.84 0.12%
Figure 8 Flow Reading in Magnetite Slurry Table 1 Flow Measurement Reproducibility Results
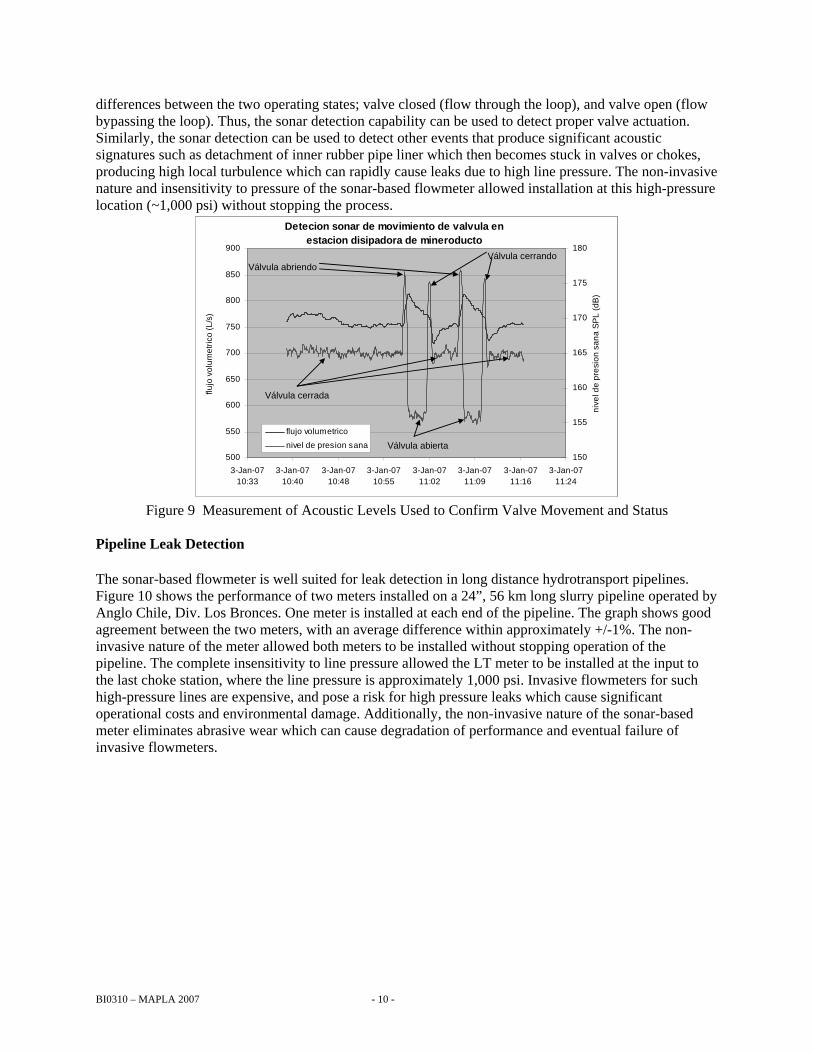
Reproducibility and flow reading noise tests on both a 4-inch final concentrate line and a 24-inch tailings line were performed to ascertain the performance of the sonar based flowmeter. Noise and repeatability were well within 1%. Monitoring of Acoustics for Operational Events and Conditions A unique feature of the sonar-based flow meter is its ability to measure the overall sound pressure level (SPL) in the process pipe, which can be correlated to specific operational events and conditions. Figure 9 shows an example of the sonar detection of actuation of a valve used to control flow in a choke station of a 24” diameter, 56 km long hydrotransport slurry pipeline operated by Anglo Chile’s Los Bronces Division. The graph clearly shows significant increases in SPL during valve actuation, and distinct SPL
BI0310 – MAPLA 2007 - 10 -
differences between the two operating states; valve closed (flow through the loop), and valve open (flow bypassing the loop). Thus, the sonar detection capability can be used to detect proper valve actuation. Similarly, the sonar detection can be used to detect other events that produce significant acoustic signatures such as detachment of inner rubber pipe liner which then becomes stuck in valves or chokes, producing high local turbulence which can rapidly cause leaks due to high line pressure. The non-invasive nature and insensitivity to pressure of the sonar-based flowmeter allowed installation at this high-pressure location (~1,000 psi) without stopping the process.
Detecion sonar de movimiento de valvula en estacion disipadora de mineroducto
500
550
600
650
700
750
800
850
900
3-Jan-0710:33
3-Jan-0710:40
3-Jan-0710:48
3-Jan-0710:55
3-Jan-0711:02
3-Jan-0711:09
3-Jan-0711:16
3-Jan-0711:24
flujo
vo
lum
etr
ico
(L
/s)
150
155
160
165
170
175
180
niv
el d
e p
resi
on
sa
na
SP
L (
dB
)
flujo volumetrico
nivel de presion sana
Válvula abriendoVálvula cerrando
Válvula cerrada
Válvula abierta
Figure 9 Measurement of Acoustic Levels Used to Confirm Valve Movement and Status
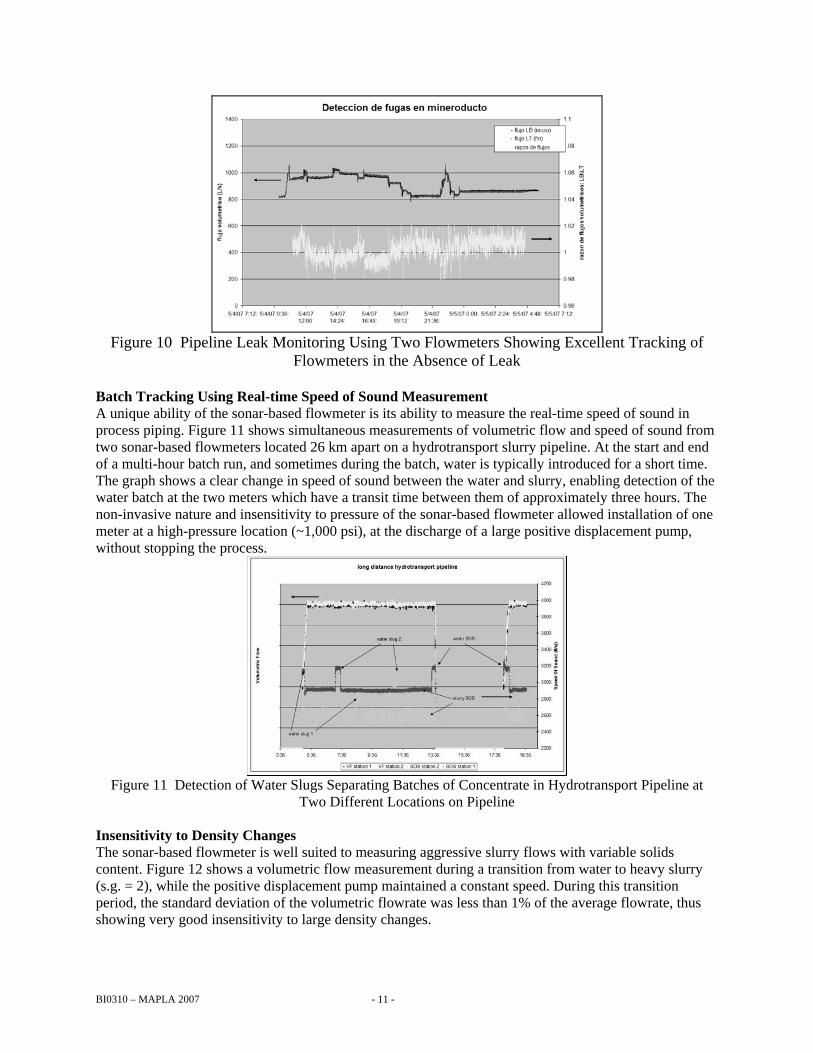
Pipeline Leak Detection The sonar-based flowmeter is well suited for leak detection in long distance hydrotransport pipelines. Figure 10 shows the performance of two meters installed on a 24”, 56 km long slurry pipeline operated by Anglo Chile, Div. Los Bronces. One meter is installed at each end of the pipeline. The graph shows good agreement between the two meters, with an average difference within approximately +/-1%. The non-invasive nature of the meter allowed both meters to be installed without stopping operation of the pipeline. The complete insensitivity to line pressure allowed the LT meter to be installed at the input to the last choke station, where the line pressure is approximately 1,000 psi. Invasive flowmeters for such high-pressure lines are expensive, and pose a risk for high pressure leaks which cause significant operational costs and environmental damage. Additionally, the non-invasive nature of the sonar-based meter eliminates abrasive wear which can cause degradation of performance and eventual failure of invasive flowmeters.
BI0310 – MAPLA 2007 - 11 -
Figure 10 Pipeline Leak Monitoring Using Two Flowmeters Showing Excellent Tracking of
Flowmeters in the Absence of Leak Batch Tracking Using Real-time Speed of Sound Measurement A unique ability of the sonar-based flowmeter is its ability to measure the real-time speed of sound in process piping. Figure 11 shows simultaneous measurements of volumetric flow and speed of sound from two sonar-based flowmeters located 26 km apart on a hydrotransport slurry pipeline. At the start and end of a multi-hour batch run, and sometimes during the batch, water is typically introduced for a short time. The graph shows a clear change in speed of sound between the water and slurry, enabling detection of the water batch at the two meters which have a transit time between them of approximately three hours. The non-invasive nature and insensitivity to pressure of the sonar-based flowmeter allowed installation of one meter at a high-pressure location (~1,000 psi), at the discharge of a large positive displacement pump, without stopping the process.
Figure 11 Detection of Water Slugs Separating Batches of Concentrate in Hydrotransport Pipeline at
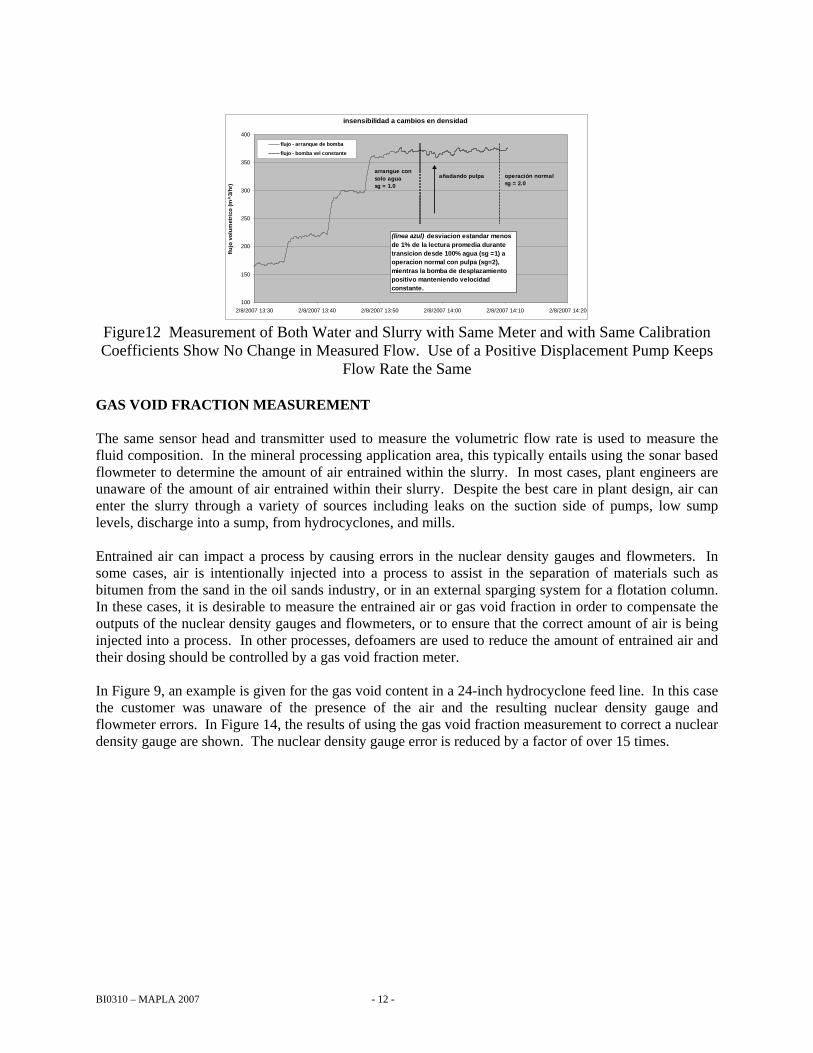
Two Different Locations on Pipeline Insensitivity to Density Changes The sonar-based flowmeter is well suited to measuring aggressive slurry flows with variable solids content. Figure 12 shows a volumetric flow measurement during a transition from water to heavy slurry (s.g. = 2), while the positive displacement pump maintained a constant speed. During this transition period, the standard deviation of the volumetric flowrate was less than 1% of the average flowrate, thus showing very good insensitivity to large density changes.
BI0310 – MAPLA 2007 - 12 -
insensibilidad a cambios en densidad
100
150
200
250
300
350
400
2/8/2007 13:30 2/8/2007 13:40 2/8/2007 13:50 2/8/2007 14:00 2/8/2007 14:10 2/8/2007 14:20
flu
jo v
olu
met
rico
(m
^3/
hr)
flujo - arranque de bomba
flujo - bomba vel constante
arrangue consolo aguasg = 1.0
añadando pulpa operación normalsg = 2.0
(linea azul) desviacion estandar menos de 1% de la lectura promedia durante transicion desde 100% agua (sg =1) a operacion normal con pulpa (sg=2), mientras la bomba de desplazamiento positivo manteniendo velocidad constante.
Figure12 Measurement of Both Water and Slurry with Same Meter and with Same Calibration Coefficients Show No Change in Measured Flow. Use of a Positive Displacement Pump Keeps
Flow Rate the Same GAS VOID FRACTION MEASUREMENT The same sensor head and transmitter used to measure the volumetric flow rate is used to measure the fluid composition. In the mineral processing application area, this typically entails using the sonar based flowmeter to determine the amount of air entrained within the slurry. In most cases, plant engineers are unaware of the amount of air entrained within their slurry. Despite the best care in plant design, air can enter the slurry through a variety of sources including leaks on the suction side of pumps, low sump levels, discharge into a sump, from hydrocyclones, and mills. Entrained air can impact a process by causing errors in the nuclear density gauges and flowmeters. In some cases, air is intentionally injected into a process to assist in the separation of materials such as bitumen from the sand in the oil sands industry, or in an external sparging system for a flotation column. In these cases, it is desirable to measure the entrained air or gas void fraction in order to compensate the outputs of the nuclear density gauges and flowmeters, or to ensure that the correct amount of air is being injected into a process. In other processes, defoamers are used to reduce the amount of entrained air and their dosing should be controlled by a gas void fraction meter. In Figure 9, an example is given for the gas void content in a 24-inch hydrocyclone feed line. In this case the customer was unaware of the presence of the air and the resulting nuclear density gauge and flowmeter errors. In Figure 14, the results of using the gas void fraction measurement to correct a nuclear density gauge are shown. The nuclear density gauge error is reduced by a factor of over 15 times.

BI0310 – MAPLA 2007 - 13 -
Figure 93 Hydrocyclone Feedline - Accurate Flow Rate and Entrained Air Measurement
Figure 14 Correction of Nuclear Density Gauge by SONARtracTM Gas Void Fraction
Measurement GAS HOLDUP MEASUREMENT Gas holdup in a flotation process is one of the key gas dispersion parameters used to define the efficiency of a flotation process. Measurement of this parameter, combined with some readily measured parameters provides the information needed to fully control a flotation process. The need has been for an accurate, low maintenance, robust instrument that can provide a continuous reading of the gas holdup without recalibration or cleaning. CiDRA has modified its sonar based gas void fraction meter to create a submersible version that can measure the gas holdup within a column. The gas holdup meter technology has been tested in a variety of mineral processing facilities. Since scale buildup does not affect the sonar array measurement technique, and the gas holdup meter has demonstrated to be a robust measurement instrument. Its calibration does not change with time, temperature, or scale buildup.
BI0310 – MAPLA 2007 - 14 -
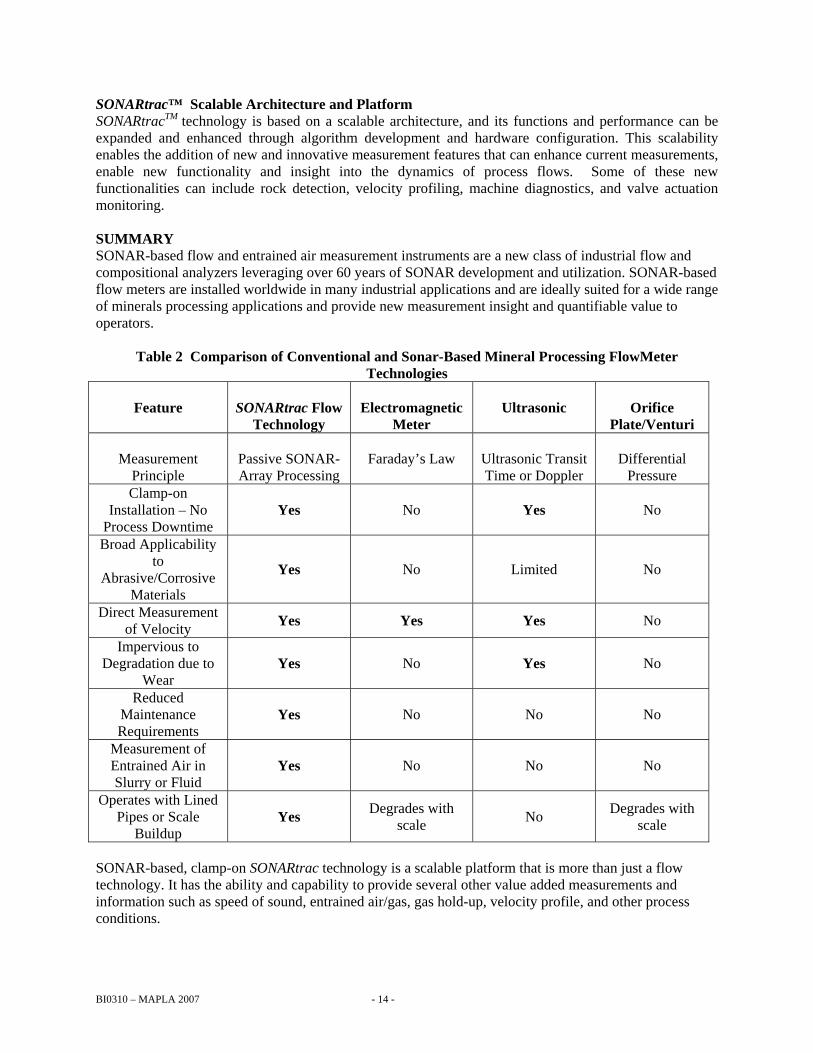
SONARtrac™ Scalable Architecture and Platform SONARtracTM technology is based on a scalable architecture, and its functions and performance can be expanded and enhanced through algorithm development and hardware configuration. This scalability enables the addition of new and innovative measurement features that can enhance current measurements, enable new functionality and insight into the dynamics of process flows. Some of these new functionalities can include rock detection, velocity profiling, machine diagnostics, and valve actuation monitoring. SUMMARY SONAR-based flow and entrained air measurement instruments are a new class of industrial flow and compositional analyzers leveraging over 60 years of SONAR development and utilization. SONAR-based flow meters are installed worldwide in many industrial applications and are ideally suited for a wide range of minerals processing applications and provide new measurement insight and quantifiable value to operators.
Table 2 Comparison of Conventional and Sonar-Based Mineral Processing FlowMeter Technologies
Feature
SONARtrac Flow
Technology
Electromagnetic
Meter
Ultrasonic
Orifice
Plate/Venturi
Measurement Principle
Passive SONAR- Array Processing
Faraday’s Law
Ultrasonic Transit Time or Doppler
Differential
Pressure Clamp-on
Installation – No Process Downtime
Yes No Yes No
Broad Applicability to
Abrasive/Corrosive Materials
Yes No Limited No
Direct Measurement of Velocity
Yes Yes Yes No
Impervious to Degradation due to
Wear Yes No Yes No
Reduced Maintenance Requirements
Yes No No No
Measurement of Entrained Air in Slurry or Fluid
Yes No No No
Operates with Lined Pipes or Scale
Buildup Yes
Degrades with scale
No Degrades with
scale
SONAR-based, clamp-on SONARtrac technology is a scalable platform that is more than just a flow technology. It has the ability and capability to provide several other value added measurements and information such as speed of sound, entrained air/gas, gas hold-up, velocity profile, and other process conditions.