Embed Size (px)
Citation preview
313Pharm. Bioprocess. (2015) 3(4), 313–321 ISSN 2048-9145
Application of mass spectrometry to facilitate advanced process controls of biopharmaceutical manufacture
Yelena Lyubarskaya1, Kazumi Kobayashi1 & Patrick Swann*,1
1Analytical Development Department,
Biogen, Cambridge, MA 02142, USA
*Author for correspondence:
PharmaceuticalReview
part of
10.4155/PBP.15.10 © 2015 Future Science Ltd
Pharm. Bioprocess.
10.4155/PBP.15.10
Review 2015/05/26
Lyubarskaya, Kobayashi & Swann Application of mass spectrometry to facilitate
advanced process controls of biopharmaceutical manufacture
3
4
2015
Development and implementation of process analytical technology and real-time release testing (here defined as advanced process controls) requires an approach to product development that emphasizes product and process understanding and process control, based on sound science and quality risk management (i.e., quality by design). Mathematical models can enhance the scientific understanding of a process and can also be explored for their predictive capability. Utilizing advanced process controls and mathematical models for biopharmaceutical products can be challenging given product/process complexity. Recent publications and preliminary work from our group are reviewed to show how the analytical capabilities of mass spectrometry can be leveraged to address these challenges.
Advanced process controls as part of a control strategyProviding regulators with assurance of con-sistent product quality is a key component of a successful commercial filing. For biologics license applications (BLAs) submitted to the US FDA, regulations state (emphasis added), “Approval of a biologics license applica-tion…shall constitute a determination that the establishment(s) and the product meet applicable requirements to ensure the con-tinued safety, purity, and potency of such products” [1]. To achieve this goal, both the applicant and the regulatory authority focus on the control strategy which is critical to providing consistent quality. As stated in the International Conference on Harmoni-sation Guidance for Industry Q8R2, “A control strategy is designed to ensure that a product of required quality will be pro-duced consistently” [2]. Thus, the guidance and regulations align in the general intent that the manufacture of approved products will be controlled in a manner that ensures consistent quality.
What constitutes an adequate control strategy? As defined in ICH Q10, a con-trol strategy is a “…planned set of controls, derived from current product and process
understanding, that assures process perfor-mance and product quality. The controls can include parameters and attributes related to drug substance and drug product materi-als and components, facility and equipment operating conditions, in-process controls, finished product specifications and the asso-ciated methods and frequency of monitoring, and control” [3]. Conventional control strat-egies for biopharmaceuticals have, to date, used all of the elements listed in the Q10 definition. However, discussion about the appropriate blend of control elements is com-mon during BLA and supplement review. ICH Q8 and Q11 have highlighted enhanced approaches using quality by design (QbD) concepts when developing a control strat-egy [2,4]. Under the QbD approach, testing, monitoring or controlling is shifted earlier into the process. QbD-related controls have included concepts like real-time release testing (RTRT; including use of models) [5] and process analytical tec hnology (PAT) [6].
In this paper, a general overview of control strategies for biopharmaceutical products is provided and opportunities for controlling processes earlier in the process discussed. These controls (PAT and RTRT including use
314 Pharm. Bioprocess. (2015) 3(4) future science group
Review Lyubarskaya, Kobayashi & Swann
of predictive models) are referred to here as advanced process controls (APCs). A review of recent publica-tions has been provided and an example of preliminary work which leverages the analytical capabilities of MS in support of the development and implementation of APCs described.
For biopharmaceutical process development, several terms have been defined by regulatory guidance and should be considered when developing APCs.
Critical quality attributes, control strategy implementation options & APCsCritical quality attributes (CQAs) are generally associated with the drug substance, excipients, inter-mediates (in-process materials) and drug product. For biopharmaceutical products, CQAs may include items such as potency, the nature and quantity of product-related substances, product-related impurities and p rocess-related impurities [7].
As bioprocess developers focus their efforts on design-ing and developing processes that reproducibly deliver CQAs within targets, CQAs are a foundational element in the QbD drug product process development para-digm [8]. The identification of CQAs for biopharmaceuti-cal products can be challenging. Biopharmaceutical prod-ucts can possess a large number of quality attributes, so that it might not be possible to fully evaluate the impact
on safety and efficacy of each one. Residual uncertainties in the CQA identification process can carry over to resid-ual uncertainties when developing the control strategy. In general (albeit with many exceptions), new chemical entities (sometimes referred to as small molecules) have less residual uncertainty in CQA identification. This may explain why many of the APC concepts discussed here for biopharmaceutical products have been more fully explored with small molecules. This also highlights the opportunity for improved analytical characterization for biopharmaceutical products as a key enabler of APCs.
What is the relationship between a product’s CQAs and its control strategy? A recent publication from FDA authors provided further clarification on QbD concepts including control strategy implementation options [9]. Three levels of control are described:
• Level 1 utilizes automated controls to monitor CQAs of the output materials in real time. Level 1 controls can be adaptive (PAT) and can enable RTRT. Yu et al. note that PAT is not the only way to implement RTRT. It is also possible to use pre-dictive models as a surrogate for traditional release test, where the model may be defined in terms of traditional in-process measurements;
• Level 2 controls allow for reduced end-product testing based upon a design space approach;
• Level 3 is the level of control traditionally used in the pharmaceutical industry and relies on exten-sive end-product testing and constrained material at tributes and process parameters.
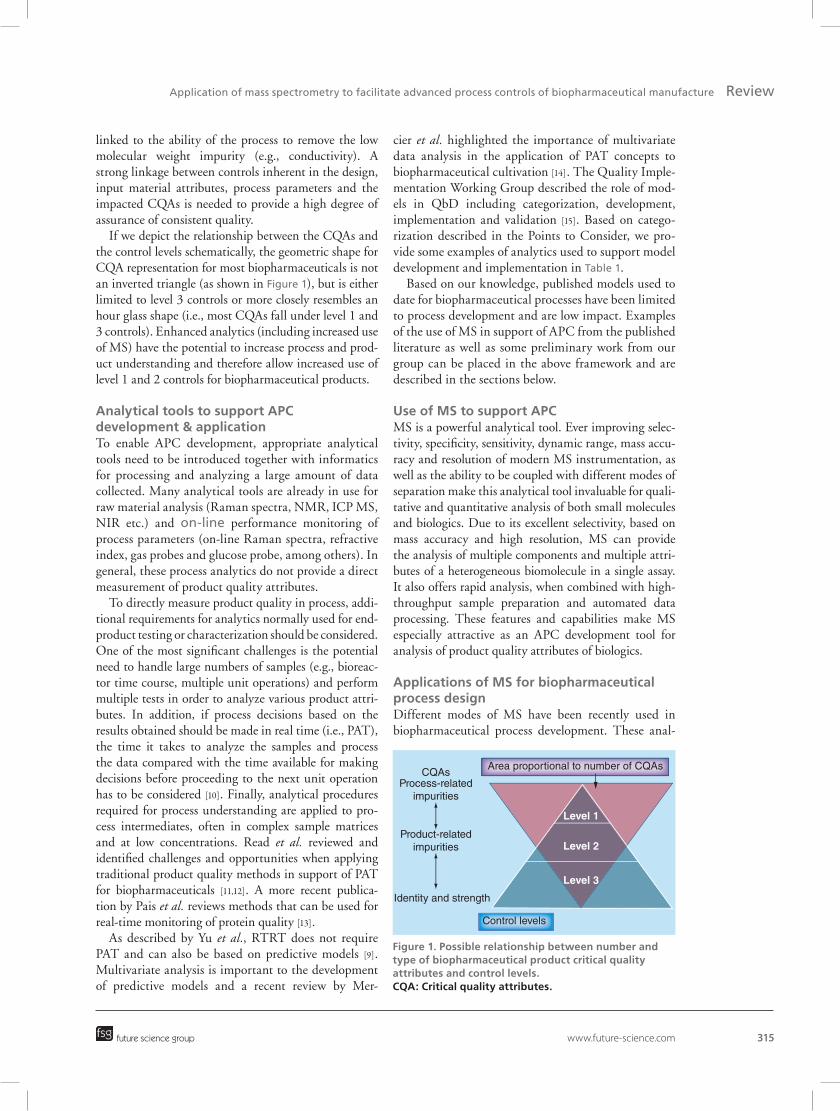
Building upon the control levels as defined by Yu et al., we propose a high-level overview describing a possible relationship between the number and type of biopharmaceutical product CQAs and level 1–3 con-trols (see Figure 1). Identity and strength are assigned to level 3 controls based on our interpretation of the cGMP regulation 21 CFR 211 165 (a): “For each batch of drug product, there shall be appropriate laboratory determi-nation of satisfactory conformance to final specifica-tions for the drug product, including the identity and strength of each active ingredient, prior to release” [1].
For biopharmaceutical products, other CQAs (e.g., process-related impurities) are often controlled without end-product testing or a demonstrated design space. For example, the removal of many different bio-reactor low molecular weight impurities can be assured by a sufficient number of diafiltration volumes at a downstream ultrafiltration/diafiltration step. This step is performed using constrained material attributes and process parameters (level 3 controls) or in an adaptive manner based on process output parameters strongly
Key terms
In-process control (or process control): Checks performed during production to monitor and, if appropriate, to adjust the process and/or to ensure that the intermediate or API conforms to its specifications.
Real-time release testing: The ability to evaluate and ensure the quality of in-process and/or final product based on process data, which typically include a valid combination of measured material attributes and process controls.
Process analytical technology: A system for designing, analyzing and controlling manufacturing through timely measurements (i.e., during processing) of critical quality and performance attributes of raw and in-process materials and processes with the goal of ensuring final product quality.
Critical quality attribute: A physical, chemical, biological or microbiological property or characteristic that should be within an appropriate limit, range or distribution to ensure the desired product quality.
Design space: The multidimensional combination and interaction of input variables (e.g., material attributes) and process parameters that have been demonstrated to provide assurance of quality. Working within the design space is not considered as a change. Movement out of the design space is considered to be a change and would normally initiate a regulatory postapproval change process. Design space is proposed by the applicant and is subject to regulatory assessment and approval.
www.future-science.com 315
Figure 1. Possible relationship between number and type of biopharmaceutical product critical quality attributes and control levels.CQA: Critical quality attributes.
CQAsProcess-related
impurities
Product-relatedimpurities
Identity and strength
Area proportional to number of CQAs
Control levels
Level 3
Level 1
Level 2
future science group
Application of mass spectrometry to facilitate advanced process controls of biopharmaceutical manufacture Review
linked to the ability of the process to remove the low molecular weight impurity (e.g., conductivity). A strong linkage between controls inherent in the design, input material attributes, process parameters and the impacted CQAs is needed to provide a high degree of assurance of consistent quality.
If we depict the relationship between the CQAs and the control levels schematically, the geometric shape for CQA representation for most biopharmaceuticals is not an inverted triangle (as shown in Figure 1), but is either limited to level 3 controls or more closely resembles an hour glass shape (i.e., most CQAs fall under level 1 and 3 controls). Enhanced analytics (including increased use of MS) have the potential to increase process and prod-uct understanding and therefore allow increased use of level 1 and 2 controls for biopharmaceutical products.
Analytical tools to support APC development & applicationTo enable APC development, appropriate analytical tools need to be introduced together with informatics for processing and analyzing a large amount of data collected. Many analytical tools are already in use for raw material analysis (Raman spectra, NMR, ICP MS, NIR etc.) and on-line performance monitoring of process parameters (on-line Raman spectra, refractive index, gas probes and glucose probe, among others). In general, these process analytics do not provide a direct measurement of product quality attributes.
To directly measure product quality in process, addi-tional requirements for analytics normally used for end-product testing or characterization should be considered. One of the most significant challenges is the potential need to handle large numbers of samples (e.g., bioreac-tor time course, multiple unit operations) and perform multiple tests in order to analyze various product attri-butes. In addition, if process decisions based on the results obtained should be made in real time (i.e., PAT), the time it takes to analyze the samples and process the data compared with the time available for making decisions before proceeding to the next unit operation has to be considered [10]. Finally, analytical procedures required for process understanding are applied to pro-cess intermediates, often in complex sample matrices and at low concentrations. Read et al. reviewed and identified challenges and opportunities when applying traditional product quality methods in support of PAT for biopharmaceuticals [11,12]. A more recent publica-tion by Pais et al. reviews methods that can be used for real-time monitoring of protein quality [13].
As described by Yu et al., RTRT does not require PAT and can also be based on predictive models [9]. Multivariate analysis is important to the development of predictive models and a recent review by Mer-
cier et al. highlighted the importance of multivariate data analysis in the application of PAT concepts to biopharmaceutical cultivation [14]. The Quality Imple-mentation Working Group described the role of mod-els in QbD including categorization, development, implementation and validation [15]. Based on catego-rization described in the Points to Consider, we pro-vide some examples of analytics used to support model development and implementation in Table 1.
Based on our knowledge, published models used to date for biopharmaceutical processes have been limited to process development and are low impact. Examples of the use of MS in support of APC from the published literature as well as some preliminary work from our group can be placed in the above framework and are described in the sections below.
Use of MS to support APCMS is a powerful analytical tool. Ever improving selec-tivity, specificity, sensitivity, dynamic range, mass accu-racy and resolution of modern MS instrumentation, as well as the ability to be coupled with different modes of separation make this analytical tool invaluable for quali-tative and quantitative analysis of both small molecules and biologics. Due to its excellent selectivity, based on mass accuracy and high resolution, MS can provide the analysis of multiple components and multiple attri-butes of a heterogeneous biomolecule in a single assay. It also offers rapid analysis, when combined with high-throughput sample preparation and automated data processing. These features and capabilities make MS especially attractive as an APC development tool for analysis of product quality attributes of biologics.
Applications of MS for biopharmaceutical process designDifferent modes of MS have been recently used in biopharmaceutical process development. These anal-
316 Pharm. Bioprocess. (2015) 3(4) future science group
Review Lyubarskaya, Kobayashi & Swann
yses have focused on process understanding during process development. Using the modeling framework from Table 1, these would be low impact applications applied to process design. These have included analy-sis of various process impurities and additives, such as host cell proteins [16,17], leachables and extractables [18], metals [19], volatile compounds [20]. Matrix-assisted laser desorption time-of-flight (MALDI-TOF) MS has also been used to determine process consistency and suitability of the cell line for production purposes [21].
Applications of MS for biopharmaceutical process monitoring & controlSeveral MS applications have been reported to charac-terize and monitor protein quality attributes during bio-pharmaceutical process development and manufacture and considered as potential PAT applications. In their current state, they would appear to be in process develop-ment (low impact) and therefore would need an appro-priate level of development and validation to be medium or high impact applications according to Table 1.
Liquid chromatography (LC) at-line with MSD-TOF MS has been used to perform intact antibody analysis for an ultrascale down study, which has been undertaken to investigate a potential impact of down-stream processing on the molecular structure of a mono-clonal antibody (mAb) and to demonstrate how process operating conditions can impact other unit opera-tions [22]. LC/MSD-TOF analysis allowed for simulta-neous detection of the changes that occur to the cleav-age of heavy chain C-terminal lysine residues and the glycosylation pattern, as well as the presence of heavy chain/light chain dimers depending on the time of har-vest. The age of culture was found to have a large impact on the range of glycosylation patterns observed, but not on C-terminal lysine cleavage. This approach, described as a fast, at-line PAT tool, required a manual protein A purification prior to on-line desalting and MS analysis.
A method for rapid determination of the rela-tive amounts of a recombinant antibody glycoforms with different terminal galactose content has been described [23]. The method uses a single quadrupole mass spectrometer at-line with a high performance liquid chromatography (HPLC) system. Process inter-mediates from the recombinant antibody process are collected, reduced and injected directly into the HPLC system. The heavy and light chains of the therapeu-tic antibody as well as host cell protein impurities are separated chromatographically. MS detection is per-formed in the selected-ion monitoring (SIM) mode
Table 1. Categorization of models based on Quality Implementation Working Group, points to consider, with examples.
Intended outcome of the model
Models contribution in assuring product quality
Low impact – process development Medium impact – data used for control but not for release
High impact – RTRT, substitute for a specification test
Process design See section: ‘Applications of MS for biopharmaceutical process design’
Design space which is not used as sole determinant of product quality [15]
Design space which is used as the sole determinant of product quality [15]
Analytical procedures See sections: ‘Monitoring glycan profile during recombinant protein production by MS’ and ‘Development of a multiattribute automated LC/MS peptide mapping procedure as an APC tool’
PAT-based model used as supplement for batch release [15]
PAT-based model used for batch release [15]
Process monitoring and control
See sections: ‘Applications of MS for biopharmaceutical process monitoring & control’ and ‘Development of a multiattribute automated LC/MS peptide mapping procedure as an APC tool’
Univariate SPC or MSPC if used as supplement to release test [15]
SPC and MSPC if used as surrogate for release test [15]
APC: Advanced process control; MSPC: Multivariate statistical process control; PAT: Process analytical technology; RTRT: Real-time release testing; SPC: Statistical process control.
Key terms
At-line measurements: Measurement where the sample is removed, isolated from, and analyzed in close proximity to the process stream.
On-line measurements: Measurement where the sample is diverted from the manufacturing process, and may be returned to the process stream.
www.future-science.com 317future science group
Application of mass spectrometry to facilitate advanced process controls of biopharmaceutical manufacture Review
to monitor the most abundant ions corresponding to the different glycoforms of the heavy chain. Although LC–MS method with SIM detection certainly per-mits monitoring and quantitation of major glycoforms in cell culture supernatant; however, it is much more challenging to monitor and quantify lower abundant species, which could contain important information, for example, on fucosylation levels and addition of potentially immunogenic sugars, among others.
A more recent publication addresses the deficiencies of both the SIM method [23] and the off-line protein A purification approach [22], by utilizing (LC/electro-spray quadrupole time-of-flight-MS (LC/ESI-qTOF-MS) system, coupled with an on-line column-switch-ing system equipped with two columns, a protein A affinity column and a reversed-phase (RP) desalting column [24]. Two column-switching systems have been introduced, one targeting intact mAbs, and the other targeting the light and heavy chains of the mAbs. This system has been demonstrated as an efficient PAT tool for at-line monitoring of mAb production, specifically, glycoform heterogeneity.
Development of a multiattribute automated LC/MS peptide mapping procedure as an APC toolSimultaneous monitoring of multiple product qual-ity attributes and correlation of those with the process performance parameters would be very beneficial for development and manufacture of complex biologics. Peptide mapping with mass spectrometric detection is probably the best analytical approach to date, which
allows assessment of protein heterogeneity and is ame-nable to automation and high throughput. The devel-opment of a fully automated proteolytic digestion pro-cedure for mAbs and recombinant proteins followed by RP HPLC–MS/MS has been reported [25]. The procedure is reported to be comparable to the previ-ously used manual digestion procedure, while provid-ing time savings, reducing manual labor and increasing the reproducibility of the digests.
Similarly, our group has developed a rapid, automated peptide mapping procedure with MS detection and applied this method to the upstream process intermedi-ates. This approach can provide fast data turnaround and quantitatively report multiple attributes, such as lev-els of deamidation, galactosylation, sialylation, N- and C-terminal heterogeneity and oxidation among others, essentially encompassing all significant posttranslational modifications and primary structure variations of inter-est. The methodology is utilizing a robotic system and is capable of assessing cell culture samples, following an automated protein A purification procedure.
Utilizing the framework from Table 1, we are explor-ing application of this capability to either a model used for analytical procedures or for a model used for process monitoring/control. As the peptide mapping LC/MS methodology is different from the conven-tional methods used for drug substance/drug product release and routine process monitoring, correlation of multiple product attributes measured by peptide mapping to that measured by conventional methods would be needed for an analytical procedure model. Good correlation from a preliminary dataset has been
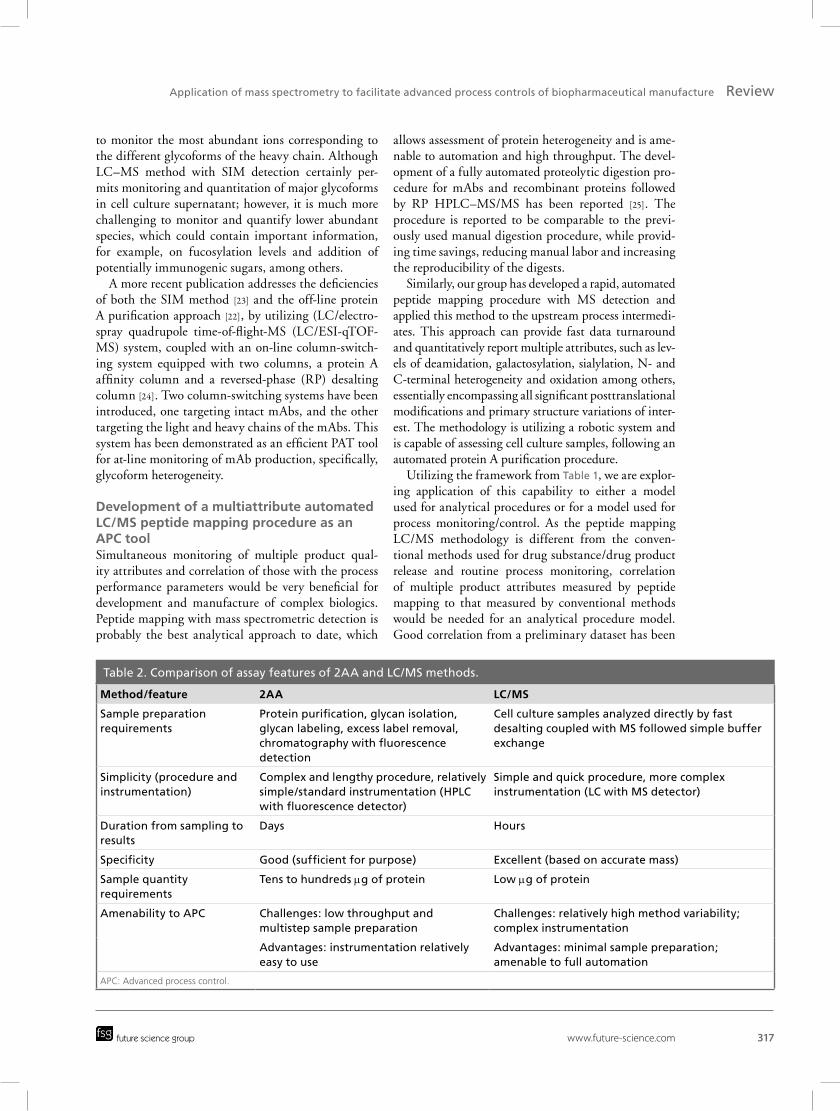
Table 2. Comparison of assay features of 2AA and LC/MS methods.
Method/feature 2AA LC/MS
Sample preparation requirements
Protein purification, glycan isolation, glycan labeling, excess label removal, chromatography with fluorescence detection
Cell culture samples analyzed directly by fast desalting coupled with MS followed simple buffer exchange
Simplicity (procedure and instrumentation)
Complex and lengthy procedure, relatively simple/standard instrumentation (HPLC with fluorescence detector)
Simple and quick procedure, more complex instrumentation (LC with MS detector)
Duration from sampling to results
Days Hours
Specificity Good (sufficient for purpose) Excellent (based on accurate mass)
Sample quantity requirements
Tens to hundreds μg of protein Low μg of protein
Amenability to APC Challenges: low throughput and multistep sample preparation
Challenges: relatively high method variability; complex instrumentation
Advantages: instrumentation relatively easy to use
Advantages: minimal sample preparation; amenable to full automation
APC: Advanced process control.
318 Pharm. Bioprocess. (2015) 3(4)
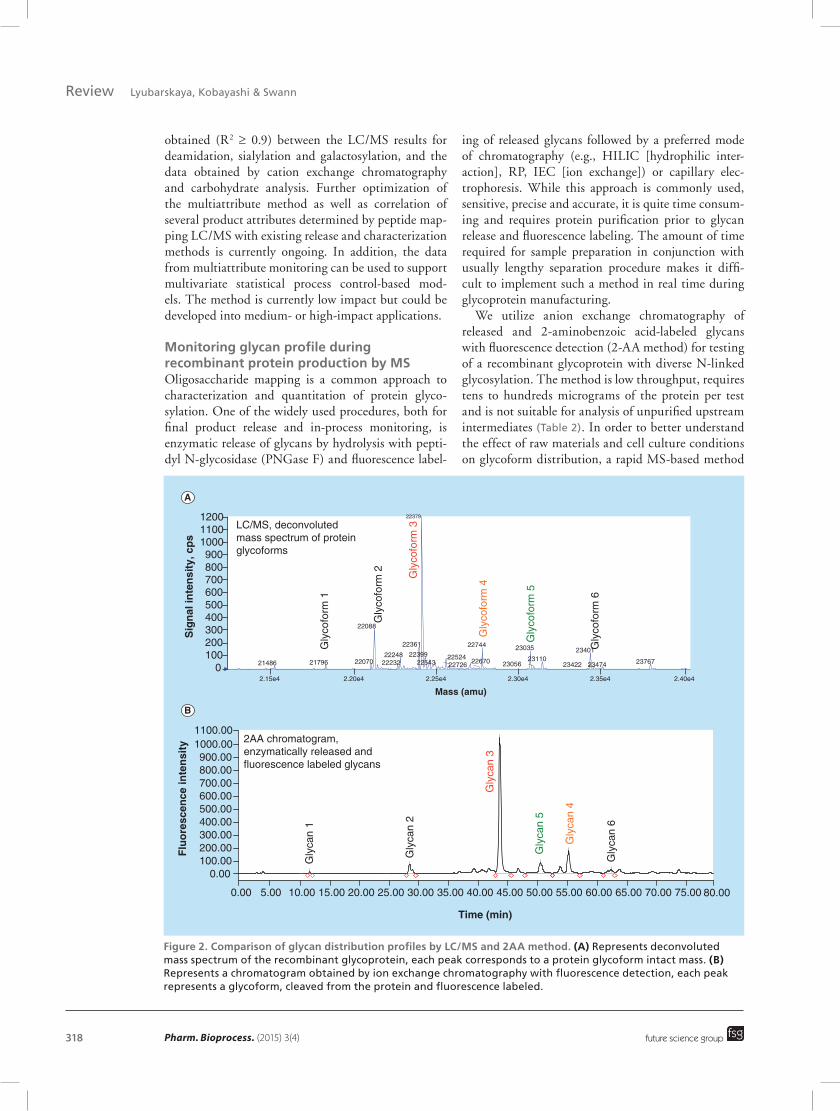
Figure 2. Comparison of glycan distribution profiles by LC/MS and 2AA method. (A) Represents deconvoluted mass spectrum of the recombinant glycoprotein, each peak corresponds to a protein glycoform intact mass. (B) Represents a chromatogram obtained by ion exchange chromatography with fluorescence detection, each peak represents a glycoform, cleaved from the protein and fluorescence labeled.
2.15e4
0100200300400500600700800900
100011001200
LC/MS, deconvolutedmass spectrum of proteinglycoforms
Gly
cofo
rm 1
Gly
cofo
rm 2 Gly
cofo
rm 3
Gly
cofo
rm 4
Gly
cofo
rm 5
Gly
cofo
rm 6
22088
22361 22744 23035 234012239922248 22524 2311022670 2376722070 2254321796 2223221486 23056 234742342222726
2.20e4 2.25e4 2.30e4 2.35e4 2.40e4
Mass (amu)
Sig
nal
inte
nsi
ty, c
ps
22379
0.00100.00200.00300.00400.00500.00600.00700.00800.00900.00
1000.001100.00
0.00 5.00 10.00 15.00 20.00 25.00 30.00 35.00 40.00 45.00 50.00 55.00 60.00 65.00 70.00 75.00 80.00
Flu
ore
scen
ce in
ten
sity
Time (min)
2AA chromatogram,enzymatically released andfluorescence labeled glycans
Gly
can
1
Gly
can
2
Gly
can
6
Gly
can
3
Gly
can
4
Gly
can
5
A
B
future science group
Review Lyubarskaya, Kobayashi & Swann
obtained (R2 ≥ 0.9) between the LC/MS results for deamidation, sialylation and galactosylation, and the data obtained by cation exchange chromatography and carbohydrate analysis. Further optimization of the multiattribute method as well as correlation of several product attributes determined by peptide map-ping LC/MS with existing release and characterization methods is currently ongoing. In addition, the data from multiattribute monitoring can be used to support multivariate statistical process control-based mod-els. The method is currently low impact but could be developed into medium- or high-impact applications.
Monitoring glycan profile during recombinant protein production by MSOligosaccharide mapping is a common approach to characterization and quantitation of protein glyco-sylation. One of the widely used procedures, both for final product release and in-process monitoring, is enzymatic release of glycans by hydrolysis with pepti-dyl N-glycosidase (PNGase F) and fluorescence label-
ing of released glycans followed by a preferred mode of chromatography (e.g., HILIC [hydrophilic inter-action], RP, IEC [ion exchange]) or capillary elec-trophoresis. While this approach is commonly used, sensitive, precise and accurate, it is quite time consum-ing and requires protein purification prior to glycan release and fluorescence labeling. The amount of time required for sample preparation in conjunction with usually lengthy separation procedure makes it diffi-cult to implement such a method in real time during glycoprotein manufacturing.
We utilize anion exchange chromatography of released and 2-aminobenzoic acid-labeled glycans with fluorescence detection (2-AA method) for testing of a recombinant glycoprotein with diverse N-linked glycosylation. The method is low throughput, requires tens to hundreds micrograms of the protein per test and is not suitable for analysis of unpurified upstream intermediates (Table 2). In order to better understand the effect of raw materials and cell culture conditions on glycoform distribution, a rapid MS-based method
www.future-science.com 319
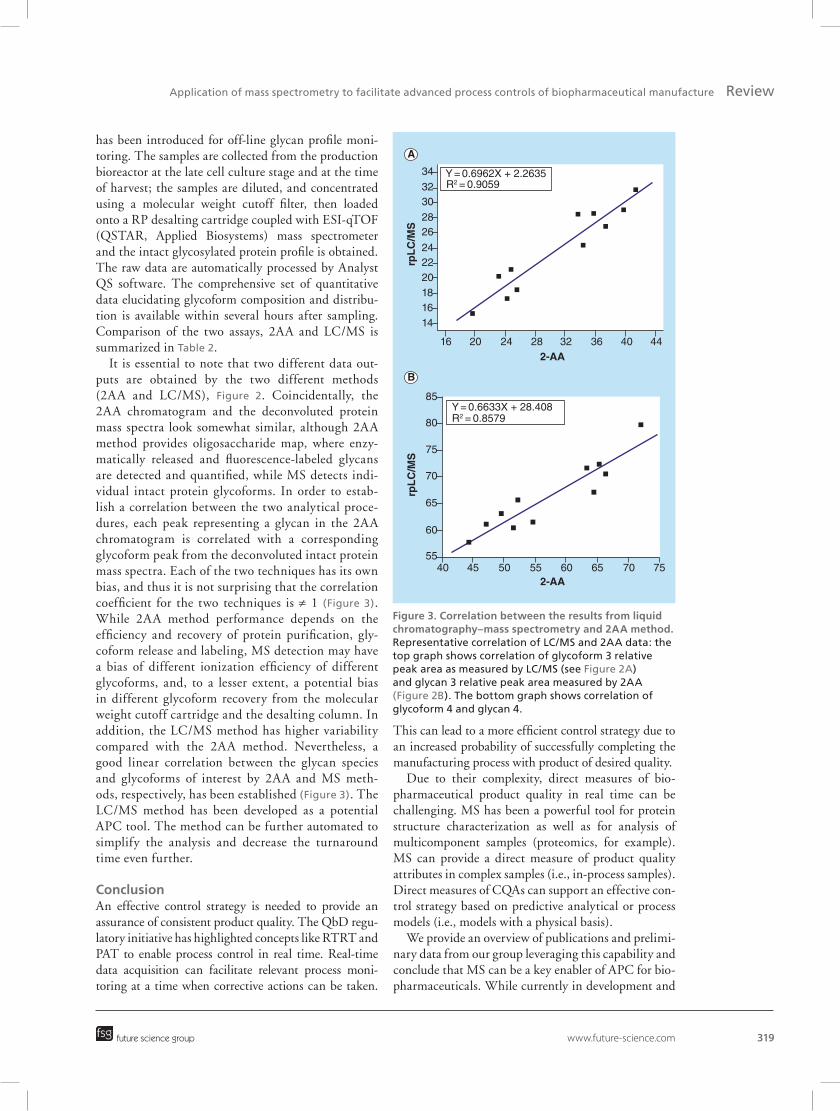
Figure 3. Correlation between the results from liquid chromatography–mass spectrometry and 2AA method. Representative correlation of LC/MS and 2AA data: the top graph shows correlation of glycoform 3 relative peak area as measured by LC/MS (see Figure 2A) and glycan 3 relative peak area measured by 2AA (Figure 2B). The bottom graph shows correlation of glycoform 4 and glycan 4.
34 Y = 0.6962X + 2.2635 R2 = 0.905932
30
2826
242220181614
16 20 24 282-AA
rpL
C/M
S
32 36 40 44
rpL
C/M
S
2-AA
85
80
75
70
65
60
5540 45 50 55 60 65 70 75
Y = 0.6633X + 28.408R2 = 0.8579
A
B
future science group
Application of mass spectrometry to facilitate advanced process controls of biopharmaceutical manufacture Review
has been introduced for off-line glycan profile moni-toring. The samples are collected from the production bioreactor at the late cell culture stage and at the time of harvest; the samples are diluted, and concentrated using a molecular weight cutoff filter, then loaded onto a RP desalting cartridge coupled with ESI-qTOF (QSTAR, Applied Biosystems) mass spectrometer and the intact glycosylated protein profile is obtained. The raw data are automatically processed by Analyst QS software. The comprehensive set of quantitative data elucidating glycoform composition and distribu-tion is available within several hours after sampling. Comparison of the two assays, 2AA and LC/MS is s ummarized in Table 2.
It is essential to note that two different data out-puts are obtained by the two different methods (2AA and LC/MS), Figure 2. Coincidentally, the 2AA chromatogram and the deconvoluted protein mass spectra look somewhat similar, although 2AA method provides oligosaccharide map, where enzy-matically released and fluorescence-labeled glycans are detected and quantified, while MS detects indi-vidual intact protein glycoforms. In order to estab-lish a correlation between the two analytical proce-dures, each peak representing a glycan in the 2AA chromatogram is correlated with a corresponding glycoform peak from the deconvoluted intact protein mass spectra. Each of the two techniques has its own bias, and thus it is not surprising that the correlation coefficient for the two techniques is ≠ 1 (Figure 3). While 2AA method performance depends on the efficiency and recovery of protein purification, gly-coform release and labeling, MS detection may have a bias of different ionization efficiency of different glycoforms, and, to a lesser extent, a potential bias in different glycoform recovery from the molecular weight cutoff cartridge and the desalting column. In addition, the LC/MS method has higher variability compared with the 2AA method. Nevertheless, a good linear correlation between the glycan species and glycoforms of interest by 2AA and MS meth-ods, respectively, has been established (Figure 3). The LC/MS method has been developed as a potential APC tool. The method can be further automated to simplify the analysis and decrease the turnaround time even further.
ConclusionAn effective control strategy is needed to provide an assurance of consistent product quality. The QbD regu-latory initiative has highlighted concepts like RTRT and PAT to enable process control in real time. Real-time data acquisition can facilitate relevant process moni-toring at a time when corrective actions can be taken.
This can lead to a more efficient control strategy due to an increased probability of successfully completing the manufacturing process with product of desired quality.
Due to their complexity, direct measures of bio-pharmaceutical product quality in real time can be challenging. MS has been a powerful tool for protein structure characterization as well as for analysis of multicomponent samples (proteomics, for example). MS can provide a direct measure of product quality attributes in complex samples (i.e., in-process samples). Direct measures of CQAs can support an effective con-trol strategy based on predictive analytical or process models (i.e., models with a physical basis).
We provide an overview of publications and prelimi-nary data from our group leveraging this capability and conclude that MS can be a key enabler of APC for bio-pharmaceuticals. While currently in development and
320 Pharm. Bioprocess. (2015) 3(4) future science group
Review Lyubarskaya, Kobayashi & Swann
therefore of low impact, this analytical capability can be used to support future PAT applications or RTRT using predictive models resulting in control strategies that are both efficient and effective.
Future perspectivePrecise product quality data from process intermedi-ates obtained via MS will enable process developers to establish robust correlations between process param-eters and product quality attributes. Mathematical models will be further developed to enhance the sci-entific understanding of a process and will be widely used for their predictive capability. Early-stage prod-uct quality data, enhanced process understanding and predictive models can enable downstream process real-time control (feed forward control) and/or inform the upstream process (feedback control), resulting in flexible yet robust manufacturing process control. This approach will ultimately enable RTRT and mini-mize the need for redundant end-product release. The routine use of MS at the manufacturing site in a real-time feedback/feed forward loop will be enabled with
advancements of automated sampling technology, at-line purification analytics and further development of smaller footprint/fit-for-purpose mass spectrometers, making the direct use of MS routine for APC of bio-processes in both development and manufacture of the future.
AcknowledgementsThe authors acknowledge Rohin Mhatre and Eliana Clark for
advice and encouragement as well as Zoran Sosic, Iva Turyan
and Li Zang for mass spectrometry method development and
data.
Financial & competing interests disclosureThe authors have no relevant affiliations or financial involve-
ment with any organization or entity with a financial inter-
est in or financial conflict with the subject matter or mate-
rials discussed in the manuscript. This includes employment,
consultancies, honoraria, stock ownership or options, expert
testimony, grants or patents received or pending, or royalties.
No writing assistance was utilized in the production of this
manuscript.
Executive summary
Advanced process controls as part of a control strategy – introduction• Development and implementation of advanced process controls (APCs) requires an approach to product
development that emphasizes product and process understanding and process control, based on sound science and quality risk management (i.e. quality by design or QbD).
Critical quality attributes, control strategy implementation options and APCs• A high level relationship between critical quality attributes for biotechnology products and control strategy
implementation options is proposed.Analytical tools to support APC development and application• Challenges to developing and implementing analytical tools for APC are described and a categorization of
models used for APC is described. Use of MS to support APC• Some MS applications for process control and monitoring to date are reviewed and put into context of model
categorization: process design and process monitoring and controlDevelopment of a multi-attribute automated LC/MS mapping procedure as an APC tool• Preliminary results from our group is described for a rapid, automated peptide mapping procedure with MS
detection including application of this method to the upstream process intermediates.Monitoring glycan profile during recombinant protein production by mass spectrometry• A rapid mass spectrometry based method has been introduced for off-line glycan profile monitoring and
compared with conventional oligosaccharide mapping.• A good linear correlation between the oligosaccharide mapping and LC/MS analysis of protein glycoforms has
been established. The LC/MS method has been developed as a potential APC tool.Future Perspective• While currently in development and therefore of low impact, the capability of mass spectrometry can be
expanded and used to support future process analytical technology applications or real-time release testing using predictive models resulting in control strategies that are both efficient and effective.
ReferencesPapers of special note have been highlighted as:• of interest; •• of considerable interest
1 Code of federal regulations. www.ecfr.gov
2 International conference on harmonisation: guidance for industry Q8(R2) pharmaceutical development. www.ich.org
3 International conference on harmonisation: guidance for industry Q10 Pharmaceutical Quality System. www.ich.org
www.future-science.com 321future science group
Application of mass spectrometry to facilitate advanced process controls of biopharmaceutical manufacture Review
4 International conference on harmonisation: development and manufacture of drug substances (chemical entities and biotechnological/biological entities) Q11. www.ich.org
5 Guideline on real time release testing, EMA. www.ema.europa.eu/docs
6 Guidance for industry PAT – a framework for innovative pharmaceutical development, manufacturing, and quality assurance. www.fda.gov/downloads/Drugs/Guidances/ucm070305.pdf
7 International conference on harmonisation: specifications: test procedures and acceptance criteria for biotechnological/biological products Q6B. www.ich.org
8 Rathore AS, Winkle H. Quality by design for biopharmaceuticals. Nat. Biotechnol. 27(1), 26–34 (2009).
• Discussescriticalqualityattributeasafoundationalelementinthequalitybydesign(QbD)drugproductprocessdevelopmentparadigm.
9 Yu LX, Amidon G, Khan MA et al. Understanding pharmaceutical quality by design. AAPS J. 16(4), 771–783 (2014).
•• ApublicationfromtheUSFDA,whichprovidesclarificationonQbDconceptsincludingcontrolstrategyimplementationoptions;threelevelsofcontrolaredescribed.
10 Rathore AS, Krull IS, Mendhe R. Analytical tools for enabling process analytical technology (PAT) applications in biotechnology. LCGC North America 30(1), 52–63 (2012).
11 Read EK, Park JT, Shah RB, Riley BS, Brorson KA, Rathore AS. Process analytical technology (PAT) for biopharmaceutical products: part I. Concepts and applications. Biotechnol. Bioeng. 105(2), 276–284 (2010).
12 Read EK, Shah RB, Riley BS, Park JT, Brorson KA, Rathore AS. Process analytical technology (PAT) for biopharmaceutical products: part II. Concepts and applications. Biotechnol. Bioeng. 105(2), 285–295 (2010).
• Describesapplyingtraditionalproductqualitymethodsinsupportofprocessanalyticaltechnology(PAT)forbiopharmaceuticals.
13 Pais DAM, Carrondo MJT, Alves PM, Teixeira AP. Towards real-time monitoring of therapeutic protein quality in mammalian cell processes. Curr. Opin. Biotechnol. 30, 161–167 (2014).
•• Recentreviewofmethodsthatcanbeusedforrealtimein-processmonitoringofproteinquality.
14 Mercier SM, Diepenbroek B, Wijffels RH, Streefland M. Multivariate PAT solutions for biopharmaceutical cultivation: current progress and limitations. Trends Biotechnol. 32(6), 329–341 (2014).
• OutlinestheimportanceofmultivariatedataanalysisintheapplicationofPATconceptstomanufacturingofbiopharmaceuticals.
15 Quality implementation working group, points to consider. www.ich.org
16 Zhang Q, Goetze AM, Cui H et al. Comprehensive tracking of host cell proteins during monoclonal antibody
purifications using mass spectrometry. MAbs. 6(3), 659–670 (2014).
17 Tait AS, Hogwood CE, Smales CM, Bracewell DG. Host cell protein dynamics in the supernatant of a mAb producing CHO cell line. Biotechnol. Bioeng. 109(4), 971–982 (2012).
18 Liu J, Kennedy JH, Ronk M, Marghitoiu L, Lee H, Nashed-Samuel Y. Ambient analysis of leachable compounds from single-use bioreactors with desorption electrospray ionization time-of-flight mass spectrometry. Rapid Commun. Mass Spectrom. 28(21), 2285–2291 (2014).
19 Fujimori K, Lee H, Phillips J, Nashed-Samuel Y. Development of an inductively coupled plasma mass spectrometry method for quantification of extracted tungsten from glass prefilled syringes used as a primary packaging for pharmaceutical and therapeutic protein products. PDA J. Pharm. Sci. Technol. 67(6), 670–679 (2013).
20 Luchner M, Gutmann R, Bayer K et al. Implementation of proton transfer reaction-mass spectrometry (PTR-MS) for advanced bioprocess monitoring. Biotechnol. Bioeng. 109(12), 3059–3069 (2012).
21 Cruz HJ, Conradt HS, Dunker R et al. Process development of a recombinant antibody/interleukin-2 fusion protein expressed in protein-free medium by BHK cells. J. Biotechnol. 96, 169–183 (2002).
22 Reid CQ, Tait A, Baldascini H et al. Rapid whole monoclonal antibody analysis by mass spectrometry: an ultra scale-down study of the effect of harvesting by centrifugation on the post-translational modification profile. Biotechnol. Bioeng. 107(1), 85–95 (2010).
•• DescribestheuseofLC/MSforinvestigationofapotentialimpactofdownstreamprocessingonamonoclonalantibodystructureandanimpactofprocessoperatingconditionsonotherunitoperations.
23 Wan HZ, Kaneshiro S, Frenz J, Cacia J. Rapid method for monitoring galactosylation levels during recombinant antibody production by electrospray mass spectrometry with selective-ion monitoring. J. Chromatogr. A 913, 437–446 (2001).
•• Describesaselective-ionmonitoringapproachforrapiddeterminationoftherelativeamountsofarecombinantantibodyglycoformswithdifferentamountofterminalgalactoses.
24 Kuribayashi R, Hashii N, Harazono A, Kawasaki N. Rapid evaluation for heterogeneities in monoclonal antibodies by liquid chromatography/mass spectrometry with a column-switching system. J. Pharm. Biomed. Anal. 67–68, 1–9 (2012).
•• DescribestheuseofLC/electrosprayquadrupoletime-of-flight-MSon-linewithacolumn-switchingsystem,aproteinAaffinitycolumnandareversed-phasedesaltingcolumn,asaPATtoolinbioprocessmonitoring.
25 Chelius D, Xiao G, Nichols AC et al. Automated tryptic digestion procedure for HPLC/MS/MS peptide mapping of immunoglobulin gamma antibodies in pharmaceutics. J. Pharm. Biomed. Anal. 47(2), 285–294 (2008).
• Describesthedevelopmentofafullyautomatedproteolyticdigestionprocedureformonoclonalantibodiesandrecombinantproteinsfollowedbyreversed-phaseLCwithon-lineMSdetection.
Coverage includes:
• Deliveryofsmallmoleculedrugs,vaccines,radionuclides,proteins,peptides,genes,siRNA,nucleotides,stemcellsanddiagnosticprobes
• Targetingatthemolecular,cellular,organandsystemiclevels
• Techniquesforcrossingbiologicalbarriers
• Methodsforenhancementofpharmacokineticprofiles
• Biodynamicandbioresponsivedelivery
• In vitro,in vivoand in silicodeliverystudies
And much more...
To submit your paper please email: [email protected]
www.future-science.com/loi/tde
“
The frustrating and costly rejection of painstakingly developed therapeutic delivery systems by biology is all too common. Therapeutic Delivery aims to cover all aspects of delivery from bench to bedside and thereby help to elevate the field to the premier place
it should be in Medicine.”Dr John Patton, Associate Editor, President and CEO, Dance Pharmaceuticals Inc, USA
ISSN:2041-5990Published:12peryearVolume:Number 6 (2015)Citations: MEDLINE/IndexMedicus,EMBASE/Excerpta Medica,ChemicalAbstracts,Scopus®
Therapeutic Delivery