Embed Size (px)
Citation preview
NASA T M X-1429
APPLICATION OF LIQUID- LAYER SOLID-SAMPLE SPARK
TECHNIQUE T O SPECTROCHEMICAL ANALYSIS
USING CONVENTIONAL SPARK SOURCE
By Ramon M. Barnes
Lewis Research Center Cleveland, Ohio
NATIONAL AERONAUTICS AND SPACE ADMINISTRATION
For sale by the Clearinghouse for Federal Scientific and Technical Information Springfield, Virginia 22151 - CFSTI price $3.00
https://ntrs.nasa.gov/search.jsp?R=19680001029 2018-09-01T02:53:29+00:00Z
.--
APPLICATION OF LIQUID-LAYER SOLID-SAMPLE SPARK
TECHNIQUE TO SPECTROCHEMICAL ANALYSIS
USING CONVENTIONAL SPARK SOURCE
by Ramon M. Barnes
Lewis Research Center
SUMMARY
Improved analytical results were obtained when a thin layer of water or aqueous solution was aspirated onto the surface of a flat metal sample during spark analysis. Studies with liquid layers applied to aluminum alloy standards demonstrated that in- creased sampling and line emission produced increased analytical curve slopes and count precision for the determination of impurities. Spark exposure times were reduced by one-half to one-fifth.
The solute from a solution layer was used to replace the aluminum internal standard in both the spark analysis of aluminum alloys and the dc a r c analysis of the sample elec- trode material vapor deposited on the counter electrode.
spheric elements and from the counter electrode material was minimized, and the physical appearance of the spark c ra te r showed no oxide formation. Inductance of the spark circuit and aspiration rate influences were investigated. Application of this method to the analysis of refractory and superalloys is indicated by the results of the analysis.
I ,
In spark analysis when a liquid layer was applied, interfering emission from atmo-
INTRODUCTION
Investigations of standard analytical spark methods for solid and solution samples using submicrosecond time-resolved emission spectroscopy have recently lead to the development of new analytical techniques (refs. 1 and 2). One of these new techniques, which combines the solid point-to-plane approach with solution samples, is called the liquid-layer solid-sample spark method (ref. 2). This report discusses some further investigations of the liquid-layer solid-sample spark method using a conventional spark source.
In conventional spark analysis, the light from a spark passing between a smoothr surface metal electrode and a pin counter electrode is spectrally dispersed and measured. This electrode arrangement is commonly known as the point-to-plane method (ref. 3). The measured intensity of the dispersed light is related to the concentrations of constituent elements of the metal electrode sample.
In the liquid-layer solid-sample spark method, apparatus similar to that of the point-to-plane technique was employed with the addition of a means for applying a liquid layer to the surface of the metal electrode during the time the sample is being sparked. In this investigation, a thin layer of liquid, generally water o r aqueous solutions, was applied by means of a simple aspirator.
The application of a thin liquid layer in the liquid-layer solid-sample spark method produced some significant changes in light intensity from the spark, which directly affected the analytical relation of light intensity to concentration. Substantial increases in light emission from sample electrode constituents were observed previously (ref. 2), and the ratio of spectroscopic line emission to radiation background was increased. The amount of sample electrode material displaced and the depth of penetration of the spark into the sample electrode was also increased. The area of the spark on the sample surface was free of oxides and discolorations, and the spark craters appeared clean and shiny for the wide variety of materials examined. These effects were verified in this investigation. In addition, the analysis was improved as a result of increased slope of the analytical curves due to the influence of these effects.
solution, the solute from the solution layer and the electrode material from the solid beneath the solution layer undergo identical processes in the spark discharge, which result in useful light emission from the solute for quantitative analysis. For example, solute emission was used to replace the emission from the major element of the solid sample as a constant concentration reference in analysis. As a result , wide concentra- tion changes in alloys can be investigated and directly referenced to a common standard.
alloys using a conventional spark source are discussed in this report. Quantitative results are presented on the effect of liquid aspiration rate, inductance of the spark discharge circuit, and the precision of light emission from repeated sparkings. Also investigated was the vapor deposit of sample material on the counter electrode. The applicability of this method to refractory and superalloy ana1ys.k is indicated by the results of the analysis.
Previous investigations (ref. 2) have shown that when the liquid layer is an aqueous
The results of applying the liquid-layer solid-sample spark technique to aluminum
EX PER IMENTAL
In this investigation with the liquid-layer solid-sample spark technique, standard
2
*
I opei%ting procedures were employed with the available spark source and spectrographic and spectrometric readout systems. The only required modifications were those of the sample holding apparatus.
Spark Source and Dispersive Methods
A commercially available spark source was used with a typical range of spark parameters of capacitance (0.0025 to 0.015 pf), inductance (residual to 1250 ph), and resistance (residual to 5 a). The spark source incorporates an air-interrupted secon- dary spark gap in ser ies with the analytical spark gap. Unless otherwise specified, the operating parameters for these tests a r e given in the following table:
For the spark source, Resistance, ohm . . . . . . . . . . . . . . . . . . . . . . . . . . . . . . . . . residual Inductance, ph . . . . . . . . . . . . . . . . . . . . . . . . . . . . . . . . . . residual Capacitance, pf . . . . . . . . . . . . . . . . . . . . . . . . . . . . . . . . . . 0.01 Discharge voltage, V . . . . . . . . . . . . . . . . . . . . . . . . . . . . . . . 17 000 Discharges per cycle . . . . . . . . . . . . . . . . . . . . . . . . . . . . . . . . . . 4 rf current, amp . . . . . . . . . . . . . . . . . . . . . . . . . . . . . . . . . . . . 15 Prespark t ime, sec . . . . . . . . . . . . . . . . . . . . . . . . . . . . . . . . . . 0 Exposure time, sec . . . . . . . . . . . . . . . . . . . . . . . . . . . . . . . 5 to 30 Analytical gap spacing, mm . . . . . . . . . . . . . . . . . . . . . . . . . . . . . . 5 Atmosphere . . . . . . . . . . . . . . . . . . . . . . . . . . . . . . . . . . . . . . . air
Gallium solution concentration, percent . . . . . . . . . . . . . . . . . . . . . . 0.25 Silicon concentration in aluminum, percent . . . . . . . . . . . . . . . . . . . . 0.73 Aspirating gas . . . . . . . . . . . . . . . . . . . . . . . . . . . . . . compressed air
For the sample,
Photographic and photoelectric detection of the same spark emission w a s obtained simul- taneously using a 3 . 4 meter Ebert spectrograph (1200 line/mm grating) and a 1 .5 meter Paschen-Runge direct reading spectrometer (1200 line/mm grating). Photographic measurements were made in support of the photometric data to determine background levels and line interferences.
A commercially available atomizer-burner, commonly used in flame photometry, was employed to supply a thin, reproducible liquid layer on the surface of the sample electrode. The fuel jacket of a medium-bore atomizer burner was removed and the
3
remaining oxygen nozzle and burner base was mounted in the atomizer-burner holder. This unit was attached to a phenolic resin rod held in a ring stand fo r convenience of positioning and adjustment of the direction of the spray.
Sample Holder
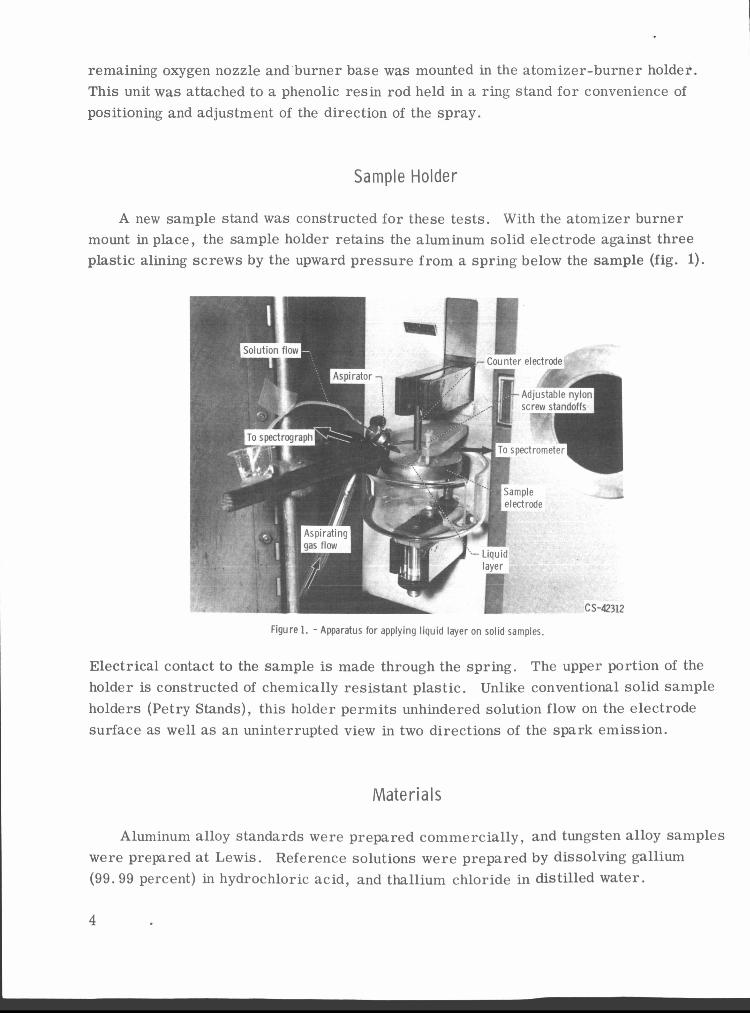
A new sample stand was constructed for these tests. With the atomizer burner mount in place, the sample holder retains the aluminum solid electrode against three plastic alining screws by the upward pressure from a spring below the sample (fig. 1).
- Couiiter -7
elect rode
screw standoffs
-4q
lave1
i
r
cs-42: 112 Figure 1. - Apparatus for applying liquid layer on solid samples.
Electrical contact to the sample is made through the spring. The upper portion of the holder is constructed of chemically resistant plastic. Unlike conventional solid sample holders (Petry Stands), this holder permits unhindered solution flow on the electrode surface as well as an uninterrupted view in two directions of the spark emission.
Mate r i a Is
Aluminum alloy standards were prepared commercially, and tungsten alloy samples were prepared a t Lewis. (99.99 percent) in hydrochloric acid, and thallium chloride in distilled water.
Reference solutions were prepared by dissolving gallium
4
*
.-’ RESULTS AND DISCUSSION
I m prove men t i n A n a I y s is
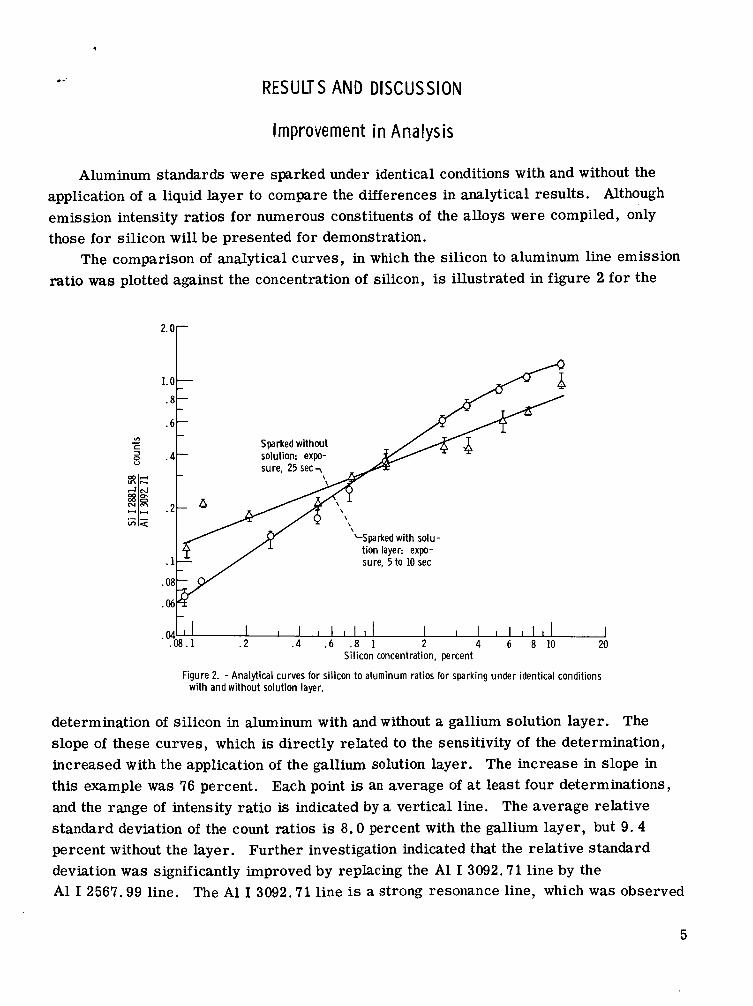
Aluminum standards were sparked under identical conditions with and without the application of a liquid layer to compare the differences in analytical results. Although emission intensity ratios for numerous constituents of the alloys were compiled, only those for silicon will be presented for demonstration.
ratio was plotted against the concentration of silicon, is illustrated in figure 2 for the The comparison of analytical curves, in which the silicon to aluminum line emission
3 p a r k e d with s o h - tion layer: expo- sure, 5 to 10 sec
I I l l I l l I I I I I I I . 2 . 4 .6 .8 1 2 4 6 8 1 0 20
Silicon concentration, percent
Figure 2. - Analytical curves for silicon to aluminum ratios for sparking under identical conditions with and without solution layer.
determination of silicon in aluminum with and without a gallium solution layer. The slope of these curves, which is directly related to the sensitivity of the determination, increased with the application of the gallium solution layer. The increase in slope in this example was 76 percent. Each point is an average of at least four determinations, and the range of intensity ratio is indicated by a vertical line. The average relative standard deviation of the count ratios is 8.0 percent with the gallium layer, but 9.4 percent without the layer. Further investigation indicated that the relative standard deviation w a s significantly improved by replacing the A1 I 3092.71 line by the A1 I 2567.99 line. The A1 I 3092.71 line is a strong resonance line, which was observed
5
photographically to be strongly self reversed when used with the liquid-layer solid- sample spark technique. When the A1 I 2567.99 line is used, typical relative standard deviations for two standards fo r 10 o r 11 replicate runs averaged 2.8 percent with the gallium layer and 3 . 7 percent without the layer. These and other comparisons of count precision with and without a liquid layer made during these investigations indicated that determinations made with the liquid layer tend to be more precise than those without the application of the liquid layer. The scatter of values for individual standards around the average analytical curves in figure 2 was decreased when a liquid layer was applied. The increased analytical curve slope improved the concentration precision, and the reduced scatter of points increased concentration accuracy compared with the conven- tional point-to-plane analysis.
The reduction of exposure time required for a determination was another analytical advantage derived from the application of a liquid layer. The analytical curve obtained with a liquid layer applied required from one-third to one-fifth the exposure required for the curve without the liquid layer to give similar silicon light intensity levels. The application of the liquid layer increased the line-to-background ratio of analytical lines to make this exposure time reduction possible.
Use of Reference Standards
Elements other than those contained in the solid electrode sample were also used as internal standards in analytical determinations. The solute from a solution layer, when used as an internal standard, is referred to as the reference standard. Gallium chloride and thallium chloride solutions were tested as reference standards in this investigation, although indium w a s used for previous aluminum analysis (ref. 2). Photographic detec- tion was employed to determine line interferences and concentration levels required. Although thallium and gallium were both acceptable for use as reference standards, all photometric determinations were made with gallium solutions.
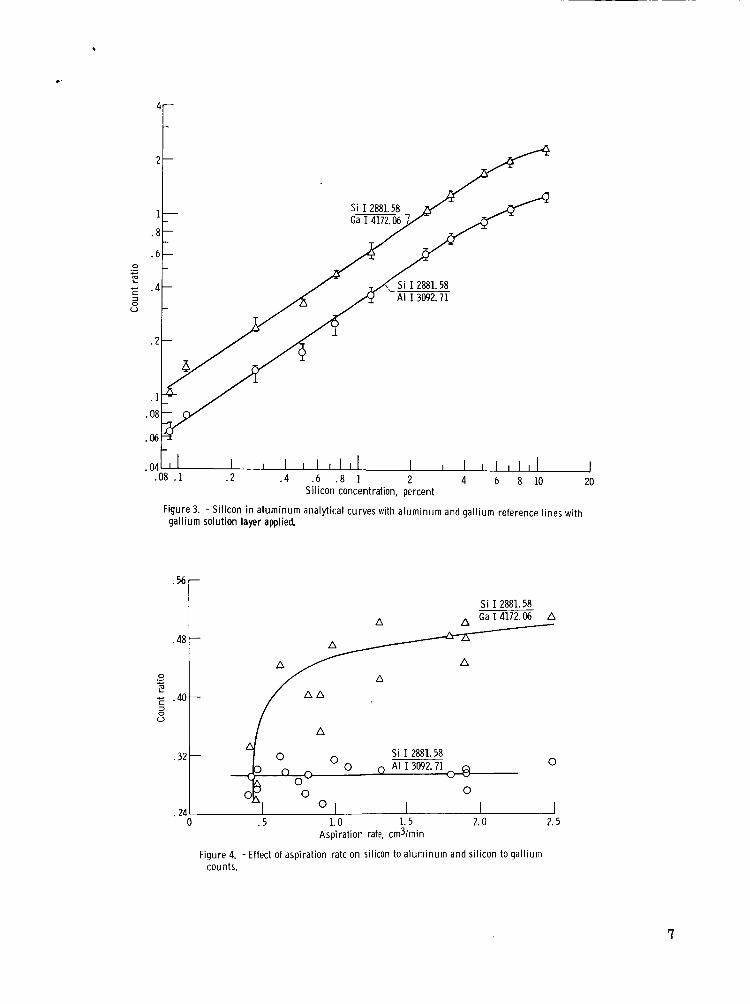
silicon (0.09 to 11. 16 percent), copper (0.03 to 5.17 percent), and iron (0 .15 to 2 . 4 5 percent), when either an aluminum internal standard or a gallium reference standard w a s used. This similarity is shown for silicon in figure 3. Four o r more determinations were used to obtain the average points plotted. The relative standard deviation of count ratios is 8.0 percent fo r the silicon-to-aluminum ratios and 5 . 1 percent for the silicon- to-gallium ratios.
in analysis of aluminum alloys in place of the aluminum internal standard, and corrections for changing aluminum concentrations in different alloys can be avoided.
Similar analytical curves were obtained for aluminum sample constituents, including
These results indicated that the gallium solute could serve as the reference standard
6
.56
.48-
0 .- c e 7 .40- 3 0 0
. 3 2
.24
-
Si I 2881.58 a Ga 14172.06 A a
A
Si I 2881.58 0 0 AI 1305'2.71 ~ Q
0
-
v u
Figure 4. -Effect of aspiration rate on silicon to a luminum and silicon to gal l ium counts.
7
4 Efieci o i Aspirat ion Rate
The influence of aspiration rate of gallium solutions on the count ratio of silicon from an aluminum standard containing 0.76 percent silicon is shown in figure 4. The silicon-to-aluminum ratio did not appear to change with aspiration rate. The relative standard deviation of the ratio in figure 4 for which data were collected on two separate days is 6.6 percent. Similar ratios were obtained when water was aspirated. The silicon-to-aluminum ratio was insensitive to the aspiration rate with either water o r gallium solution layers. This result was expected for there was no prior indication of the appearance of preferential sampling with the liquid-layer solid-sample spark tech- nique.
On the other hand, the silicon-to-gallium count ratio did respond to the aspiration rate of gallium solution (see fig. 4). The silicon-to-gallium ratio showed insensitivity similar to the silicon-to-aluminum ratio only above a critical aspiration rate of approx- imately 1 cubic centimeter per minute. To demonstrate the importance of maintaining an aspiration rate in excess of the critical rate, the relative standard deviations of silicon-to-gallium ratios over the range of 0.9 to 2.48 cubic centimeters per minute was compared with the range of 1 .0 to 2.48 cubic centimeters per minute. A reduction from 10.6 to 6 .0 percent was observed. This improvement in precision illustrated the necessity of using aspiration rates greater than 1 cubic centimeter per minute. Above this critical rate, precision similar to that obtained for the silicon-to-aluminum ratio was, therefore, obtained with the gallium-to-aluminum ratio.
Below an aspiration rate of 1 cubic centimeter per minute, the silicon-to-gallium ra- tio drops sharply. The source of this drop was not the result of increased silicon counts, but, instead, decreased gallium counts. At low aspiration rates, the gallium count w a s high, decreasing continuously as the critical aspiration rate was approached and, thereby, increasing the silicon-to-gallium ratio. This effect may result from the variation in gallium layer thickness. At low aspiration rates, the layer thickness is greater and more gallium is present on the sample electrode, which results in high gallium counts. As the aspiration rate increases, the liquid layer is spread thinner until it reaches an equilib- rium value at which the silicon-to-gallium counts stablize. The thickness of the layer may be related to the particular atomizer design and may vary with different apparatus. However, once a stable intensity ratio is determined as in figure 4 and the aspiration rate maintained above the critical rate, the use of a reference standard for spectrochemical analysis can be effective.
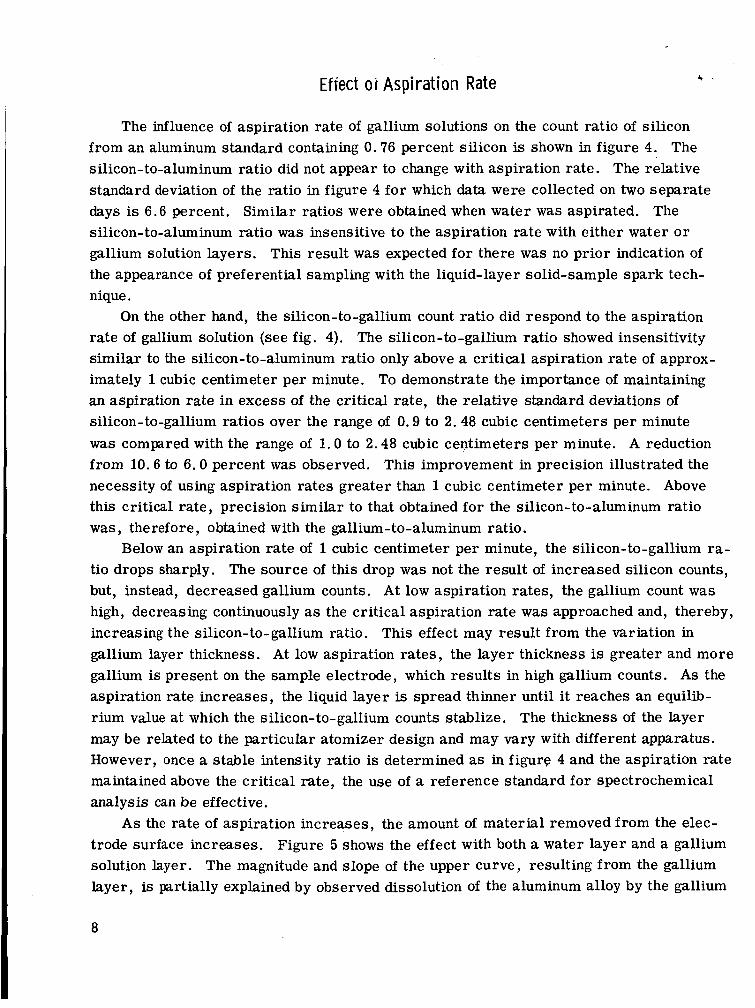
As the rate of aspiration increases, the amount of material removed from the elec- trode surface increases. Figure 5 shows the effect with both a water layer and a gallium solution layer. The magnitude and slope of the upper curve, resulting from the gallium layer, is partially explained by observed dissolution of the aluminum alloy by the gallium
a
14 c .- E ..... E"
.- = 10
2
VI- VI 0 - L m c
'LGallium solut ion layer
A A
-
12-
-
8-
6 -
a
Figure 5. - Comparison of a luminum lost wi th gallium and water layers at different aspiration rates.
0 0 7T 9- 0 3 92 -0- - -0
0 Si 12881.58 00 AI I 3092.71 / w
0 I 0 5 10 15 20 25
.I8
Amount of aluminum displaced, mglmin
Figure 6. -Comparison of amount nf aluminum alloy displaced w i th si l icon-to-aluminum and s i l icon- toqal l ium counts.
9
acid solution. A8 0.45 cubic centimeter per minute, the application of the solution withi out sparking removed 1.8 milligram per minute of the alloy in the same time sparking would normally occur. Further studies should determine the influence of acid concentra- tion on the rate of sample removal. However, the analytical count ratios should not change if the sample is completely dissolved in proportion to the concentration of the constituents, because they were as effectively sampled from solution as they were from the solid.
count ratio observed. For a wide range the silicon-to-aluminum ratio remains unaffected, and the silicon-to-gallium ratio shows the dependence on a critical level for relatively constant ratios.
Figure 6 demonstrates the relation between the amount of material displaced and the
Effect of Spark Inductance
The general applicability of the liquid-layer solid-sample spark technique at various sparking conditions had not been quantitatively studied previously, although visual obser- vation of sparked areas qualitatively showed similar sampling effects, which differed only in magnitude. A quantitative study was made using a fixed capacitance but a variable inductance, which permits the number of discharges per cycle to be maintained without further experimental operating adjustments. The average radio frequency current was directly related to the spark inductance, and the observed sampling and intensity changes were normalized by plotting them against the current and inductance.
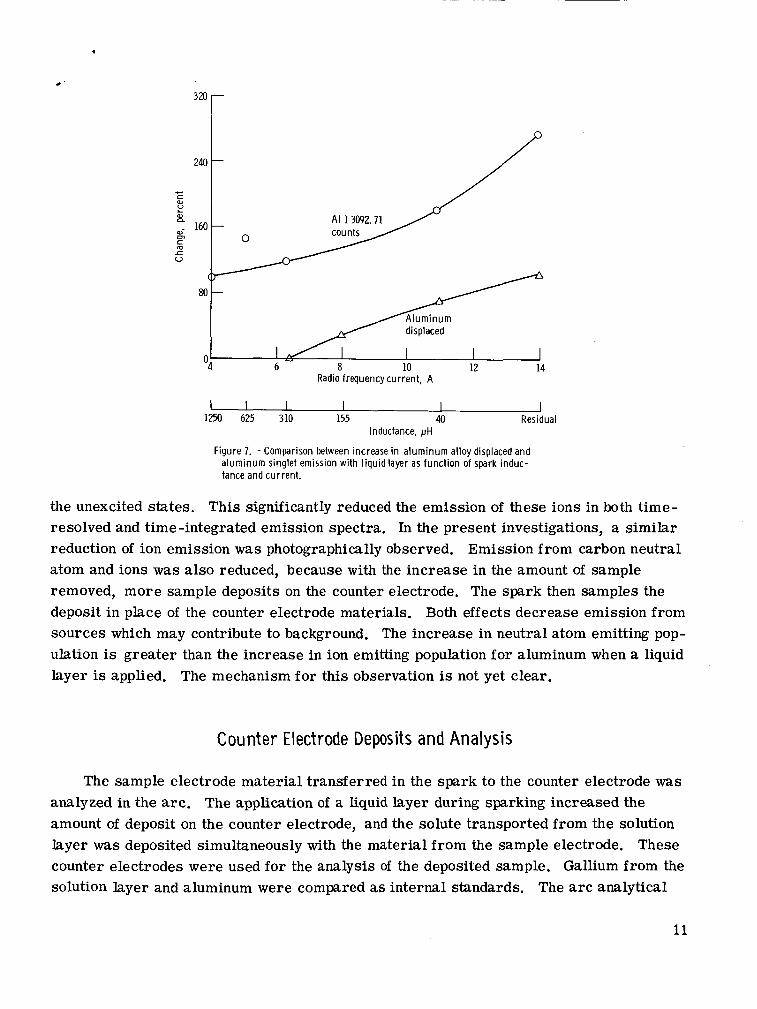
Figure 7 shows the amount of change in emission intensities and weight of aluminum displaced with and without the application of a solution layer. The lower curve indicates that, as the inductance becomes smaller (i. e., current becomes larger), the weight of aluminum removed increases. The liquid layer application provided a more effective method of sampling. Although the A1 I counts increased with reduced inductance, the increase in A1 I intensity was not proportional to the inductance in the same manner as the change in weight of the aluminum actually displaced. For any value of inductance, the change in intensity is always greater than the change in weight. This indicated an influ- ence on the emission of sampled material beyond the increase in material sampled.
crease in line-to-background ratios: The reduction of background emission f rom atmos - pheric ions and counter electrode material, and an increase in neutral atom population. The interaction of decomposition products f rom the solution layer with the atmospheric ions is similar to the interactions observed in previous studies of optical emission anal- ysis methods using solutions (ref. 2). gen which interacts with excited states of singly ionized nitrogen and oxygen to produce
Two different, although related, effects may account for this disproportionate in-
The water is decomposed to atomic hydro-
10
1
.
O4 n 6 8 10 12 14
Radio frequency current, A
I I I I I 1250 625 310 155 40 Residual
Inductance, pH
Figure 7. - Comparison between increase in aluminum alloy displaced and aluminum singlet emission with liquid layer as function of spark induc- tance and current.
the unexcited states. This significantly reduced the emission of these ions in both time- resolved and time -integrated emission spectra. In the present investigations, a similar reduction of ion emission was photographically observed. Emission from carbon neutral atom and ions was also reduced, because with the increase in the amount of sample removed, more sample deposits on the counter electrode. The spark then samples the deposit in place of the counter electrode materials. Both effects decrease emission from sources which may contribute to background. The increase in neutral atom emitting pop- ulation is greater than the increase in ion emitting population for aluminum when a liquid layer is applied. The mechanism for this observation is not yet clear.
Counter Electrode Deposits and Analysis
The sample electrode material transferred in the spark to the counter electrode was analyzed in the arc. The application of a liquid layer during sparking increased the amount of deposit on the counter electrode, and the solute transported from the solution layer was deposited simultaneously with the material from the sample electrode. These counter electrodes were used for the analysis of the deposited sample. Gallium from the solution layer and aluminum were compared as internal standards. The a r c analytical
11
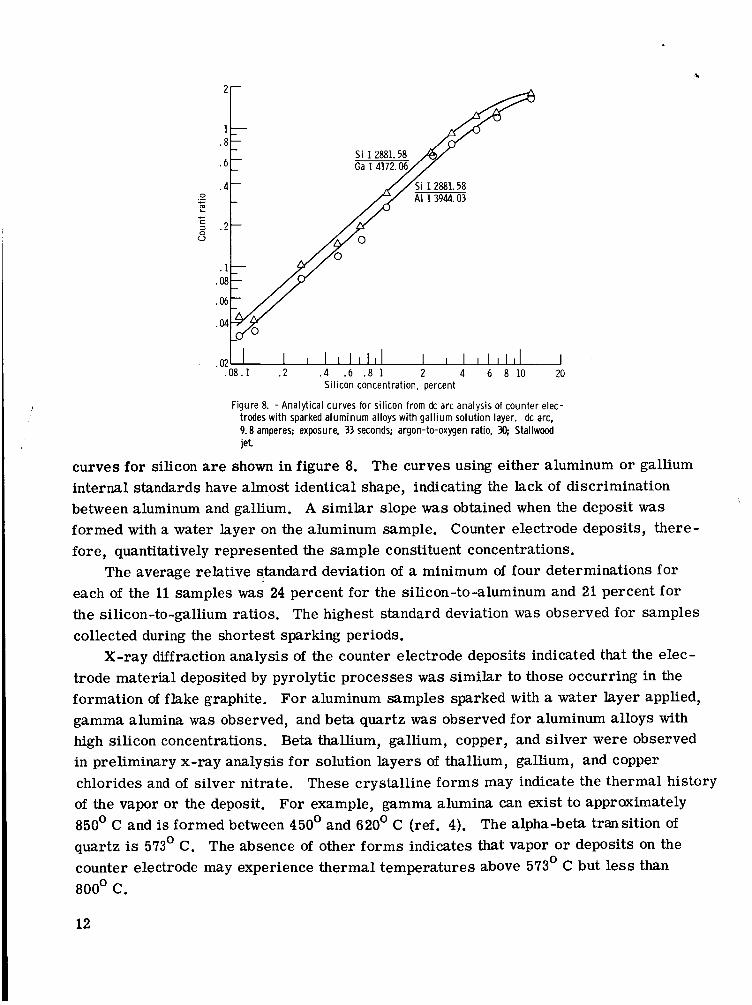
I 2881.58 I 3944.03
Prel iminary Tests on Tungsten Alloys
Tungsten alloys containing varying proportions of niobium and tantalum were tested with the application of a water layer during a 60-second exposure. A 48 percent in- crease in the weight of material removed indicated that further work using this technique may show improvements similar to those observed with aluminum.
CONCLUDING REMARKS
Conventional point -to-plane spark analysis of aluminum alloys was improved when the liquid-layer solid-sample spark technique was employed. Preliminary results indicated that similar improvements may be expected for the investigation of refractory and superalloys, which a r e difficult to analyze.
Fo r the aluminum alloys studied, material sampling and line emission is increased when a liquid layer is applied to the electrode surface for all values of spark inductance, including those at very low spark current. For the test conditions used for analysis, the increase in slope of silicon analytical curves and the improvement of count precision obtained with the application of a liquid layer combined with higher observed intensities to give substantial gains in analytical measurements with the liquid-layer solid-sample spark technique. For example, the increase in slope was 76 percent and relative stan- dard deviations for repeated determinations were about 3 percent. The increased anal- ytical curve slope and the reduced scatter of values for individual standards increased concentration precision compared with conventional point-to-plane analysis. The appli- cation of the liquid layer increased line-to-background ratios of analytically used lines to provide for a one-third to one-fifth reduction in exposure time.
By replacing the matrix element as the internal standard with a reference standard of constant concentration from the solution layer, the determination of elements in widely different base alloys or in differing alloy compositions of the same base material is simplified.
water or gallium solution layers, the silicon-to-gallium ratio responded to the aspiration rate of gallium solution. Above a critical aspiration rate of approximately 1 cubic centimeter per minute, silicon-to-gallium ratios showed a similar insensitivity. Once a stable intensity ratio is determined and the aspiration rate maintained above the critical rate, the use of a reference standard for spectrochemical analysis can be effective.
similar to those obtained with aluminum may be expected for the analysis of refractory alloys using the liquid-layer solid-sample s p a r k technique. The use of an electrode
Although the silicon-to-aluminum ratio was insensitive to the aspiration rate of either
An increase in sampling was observed for tungsten alloys which indicated that results
13
material transfer technique in the spark combined with increased sampling with an applied liquid layer may prove valuable in the preparation of refractory alloys for a r c analysis.
The investigation indicated that previous observations (ref. 2) leading to the develop- ment of the technique were supported and that the liquid-layer solid-sample spark method can be applied readily and reliably to conventional high-voltage spark analysis with direct spectrometric readout systems.
Lewis Research Center, National Aeronautics and Space Administration,
Cleveland, Ohio, August 4, 1967, 129 -03-14-04-22.
REFERENCES
1. Walters, J. P. ; and Malmstadt, H. V. : Emission Characteristics and Sensitivity in a High-Voltage Spark Discharge. Anal. Chem., vol. 37, no. 12, Nov. 1965, pp. 1484-1503.
2. Barnes, Ramon M. : Quantitative Analysis of Solutions and Solids and the Identifica- tion of Ionization Levels by Submicrosecond Time -Resolved Spark Emission Spec - troscopy. Ph. D. Thesis, University of Illinois, 1966.
' 3. Anon. : Methods for Emission Spectrochemical Analysis. Fourth ed. , ASTM, 1964.
4. Newsome, J. W.; Heiser, H. W.; Russell, As. S.; and Stumpf, H. C.: Alumina Properties. Tech. Paper No. 10, 2nd rev., Aluminum Company of America, 1960.
14 NASA-Langley, 1967 - 6 E-4034


![Atomic layer deposition onto polymer surfaces · Atomic layer deposition (ALD) is a layer-by-layer process based on self-limiting gas-solid surface reactions [1-3]. Deposition cycles](https://img.pdfslide.us/doc/110x75/5f70f4ce86c8b13d2031a5ca/atomic-layer-deposition-onto-polymer-surfaces-atomic-layer-deposition-ald-is-a.jpg)


![SOLID FREEFORM FABRICATION OF TRANSPARENT … · The latter were created using layer-to-layer fabrication with locally adjusted indices of refraction [4]. While significant progress](https://img.pdfslide.us/doc/110x75/5b5b4ddc7f8b9a55388e0c39/solid-freeform-fabrication-of-transparent-the-latter-were-created-using-layer-to-layer.jpg)