Embed Size (px)
Citation preview
Application of Hierarchical Clustering to FindExpression Modules in Cancer
T. M. Murali
August 18, 2008
T. M. Murali August 18, 2008 Expression Modules in Cancer
Innovative Application of Hierarchical Clustering
I A module map showing conditional activity of expression modules incancer, Eran Segal, Nir Friedman, Daphne Koller and Aviv Regev,Nature Genetics 36, 1090–1098, 2004
I Analyse gene expression data to find groups of genes expressed inconcert between different cancers.
I Use hierarchical clustering innovatively.
T. M. Murali August 18, 2008 Expression Modules in Cancer
Goals
I Move away from standard approach: determine genes that respond(based on cut-off) and study these genes further.
I Develop method that can analyse large numbers (1000s) of samplesacross multiple conditions.
I Patterns of co-expression across all conditions are not very interesting.
I Compute gene modules: groups of genes that show concertedbehaviour across multiple conditions.
I Specifically, Segal et al. associate with each gene module, a set ofsamples in which the module is up-regulated and a set of samples inwhich the module is down-regulated.
T. M. Murali August 18, 2008 Expression Modules in Cancer
Key Steps
T. M. Murali August 18, 2008 Expression Modules in Cancer
Key Steps
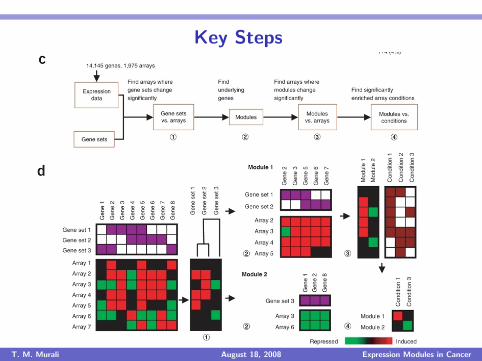
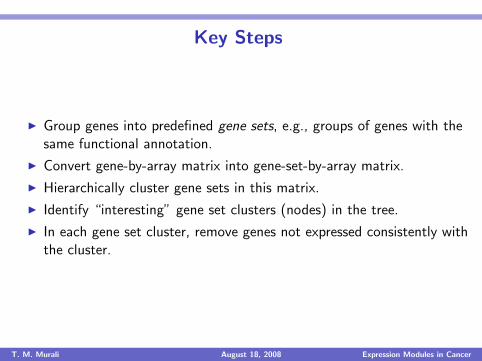
I Group genes into predefined gene sets, e.g., groups of genes with thesame functional annotation.
I Convert gene-by-array matrix into gene-set-by-array matrix.
I Hierarchically cluster gene sets in this matrix.
I Identify “interesting” gene set clusters (nodes) in the tree.
I In each gene set cluster, remove genes not expressed consistently withthe cluster.
T. M. Murali August 18, 2008 Expression Modules in Cancer
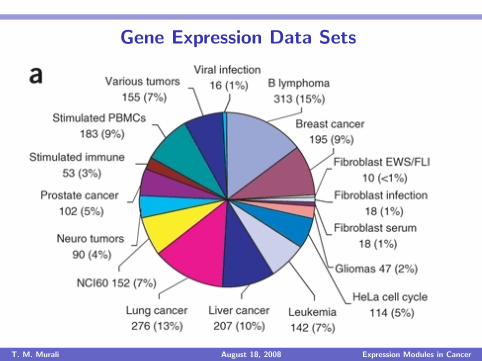
Gene Expression Data Sets
T. M. Murali August 18, 2008 Expression Modules in Cancer
Data Normalisation
I Needed because some arrays measure “absolute” value of geneexpression and others measure “relative” values.
I Affymetrix microarrays: take logarithm to the base-2 and zerotransform within data set.
I cDNA microarrays: zero transform within data set.
T. M. Murali August 18, 2008 Expression Modules in Cancer
Data Normalisation
I Needed because some arrays measure “absolute” value of geneexpression and others measure “relative” values.
I Affymetrix microarrays: take logarithm to the base-2 and zerotransform within data set.
I cDNA microarrays:
zero transform within data set.
T. M. Murali August 18, 2008 Expression Modules in Cancer
Data Normalisation
I Needed because some arrays measure “absolute” value of geneexpression and others measure “relative” values.
I Affymetrix microarrays: take logarithm to the base-2 and zerotransform within data set.
I cDNA microarrays: zero transform within data set.
T. M. Murali August 18, 2008 Expression Modules in Cancer
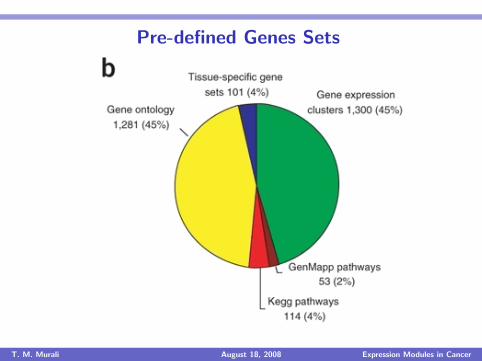
Pre-defined Genes Sets
T. M. Murali August 18, 2008 Expression Modules in Cancer
Computing Gene-Set-By-Array Matrix
I Goal is to construct a gene-set-by-array matrix.
I For each gene set-array pair, find an “average” expression value ofthat gene set in that array.
I A gene is induced (respectively, repressed in an array if its change inexpression is ≥ 2 (respectively, ≤ 2).
I For each gene set-array pair, compute the fraction of genes induced orrepressed.
I Use these values in the gene-set-by-array matrix.
T. M. Murali August 18, 2008 Expression Modules in Cancer
Computing Significant Entries in theGene-Set-By-Array Matrix
I Many entries in the gene-set-by-array matrix may not be statisticallysignificant.
I For a given array, fraction of induced genes in a gene set may be closeto the fraction of induced genes in the array.
I Statistical test: for a given array, is the fraction of induced genes in agene set much larger than the fraction of induced genes in the entirearray?
I Compute the p-value (statistical significance) of the fraction.Exercise.
I Do so for every gene-set-array pair.
I Use false discovery rate correction to account for multiple hypothesestesting.
I Replace insignificant entries by 0.
T. M. Murali August 18, 2008 Expression Modules in Cancer
Hierarchical Clustering
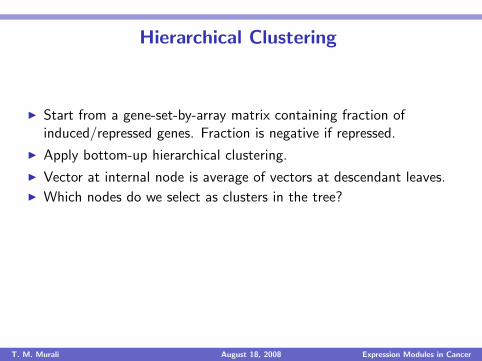
I Start from a gene-set-by-array matrix containing fraction ofinduced/repressed genes. Fraction is negative if repressed.
I Apply bottom-up hierarchical clustering.
I Vector at internal node is
average of vectors at descendant leaves.I Which nodes do we select as clusters in the tree?
I Associate each interior node with Pearson correlation between the twochildren.
I Cluster ≡ node whose Pearson correlation differs by more than 0.05from the Pearson correlation of its parent.
T. M. Murali August 18, 2008 Expression Modules in Cancer
Hierarchical Clustering
I Start from a gene-set-by-array matrix containing fraction ofinduced/repressed genes. Fraction is negative if repressed.
I Apply bottom-up hierarchical clustering.
I Vector at internal node is average of vectors at descendant leaves.
I Which nodes do we select as clusters in the tree?I Associate each interior node with Pearson correlation between the two
children.I Cluster ≡ node whose Pearson correlation differs by more than 0.05
from the Pearson correlation of its parent.
T. M. Murali August 18, 2008 Expression Modules in Cancer
Hierarchical Clustering
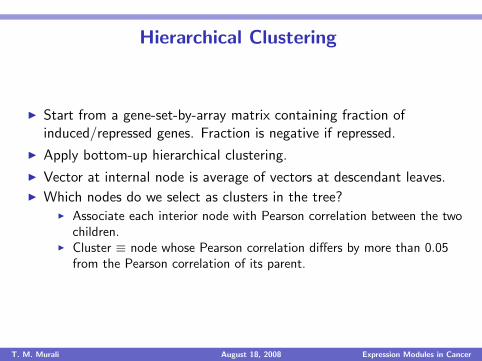
I Start from a gene-set-by-array matrix containing fraction ofinduced/repressed genes. Fraction is negative if repressed.
I Apply bottom-up hierarchical clustering.
I Vector at internal node is average of vectors at descendant leaves.I Which nodes do we select as clusters in the tree?
I Associate each interior node with Pearson correlation between the twochildren.
I Cluster ≡ node whose Pearson correlation differs by more than 0.05from the Pearson correlation of its parent.
T. M. Murali August 18, 2008 Expression Modules in Cancer
Hierarchical Clustering
I Start from a gene-set-by-array matrix containing fraction ofinduced/repressed genes. Fraction is negative if repressed.
I Apply bottom-up hierarchical clustering.
I Vector at internal node is average of vectors at descendant leaves.I Which nodes do we select as clusters in the tree?
I Associate each interior node with Pearson correlation between the twochildren.
I Cluster ≡ node whose Pearson correlation differs by more than 0.05from the Pearson correlation of its parent.
T. M. Murali August 18, 2008 Expression Modules in Cancer
Turning Clusters into Modules
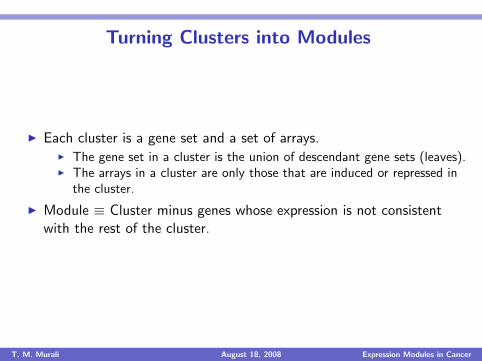
I Each cluster is a gene set and a set of arrays.
I The gene set in a cluster is the union of descendant gene sets (leaves).I The arrays in a cluster are only those that are induced or repressed in
the cluster.
I Module ≡ Cluster minus genes whose expression is not consistentwith the rest of the cluster.
T. M. Murali August 18, 2008 Expression Modules in Cancer
Turning Clusters into Modules
I Each cluster is a gene set and a set of arrays.I The gene set in a cluster is the union of descendant gene sets (leaves).I The arrays in a cluster are only those that are induced or repressed in
the cluster.
I Module ≡ Cluster minus genes whose expression is not consistentwith the rest of the cluster.
T. M. Murali August 18, 2008 Expression Modules in Cancer
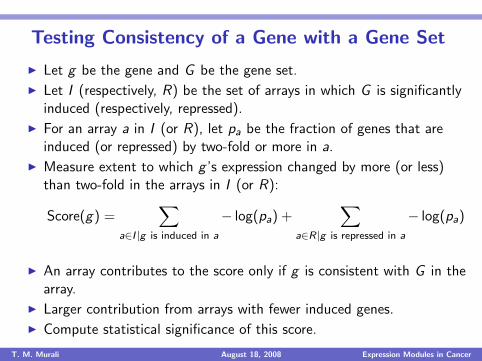
Testing Consistency of a Gene with a Gene Set
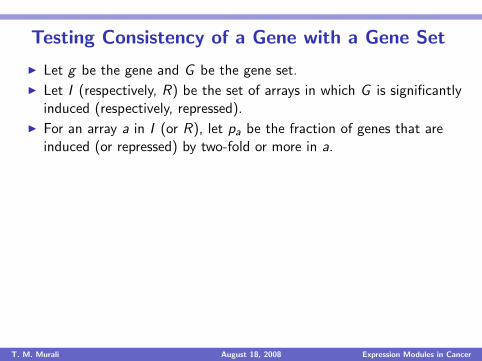
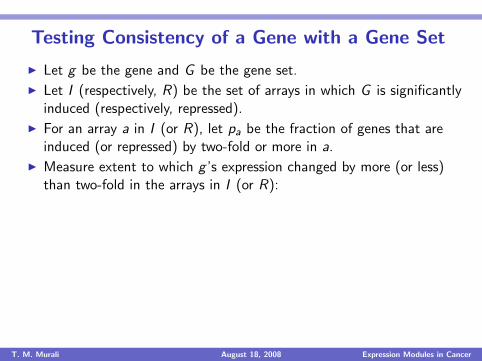
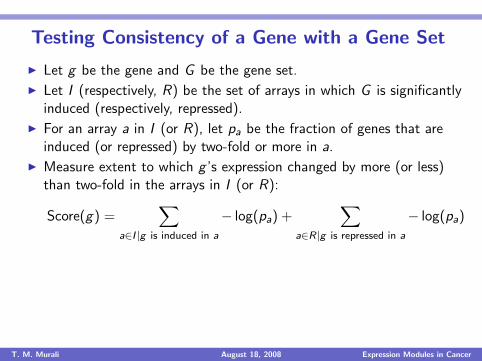
I Let g be the gene and G be the gene set.
I Let I (respectively, R) be the set of arrays in which G is significantlyinduced (respectively, repressed).
I For an array a in I (or R), let pa be the fraction of genes that areinduced (or repressed) by two-fold or more in a.
I Measure extent to which g ’s expression changed by more (or less)than two-fold in the arrays in I (or R):
Score(g) =∑
a∈I |g is induced in a
− log(pa) +∑
a∈R|g is repressed in a
− log(pa)
I An array contributes to the score only if g is consistent with G in thearray.
I Larger contribution from arrays with fewer induced genes.
I Compute statistical significance of this score.
T. M. Murali August 18, 2008 Expression Modules in Cancer
Testing Consistency of a Gene with a Gene Set
I Let g be the gene and G be the gene set.
I Let I (respectively, R) be the set of arrays in which G is significantlyinduced (respectively, repressed).
I For an array a in I (or R), let pa be the fraction of genes that areinduced (or repressed) by two-fold or more in a.
I Measure extent to which g ’s expression changed by more (or less)than two-fold in the arrays in I (or R):
Score(g) =∑
a∈I |g is induced in a
− log(pa) +∑
a∈R|g is repressed in a
− log(pa)
I An array contributes to the score only if g is consistent with G in thearray.
I Larger contribution from arrays with fewer induced genes.
I Compute statistical significance of this score.
T. M. Murali August 18, 2008 Expression Modules in Cancer
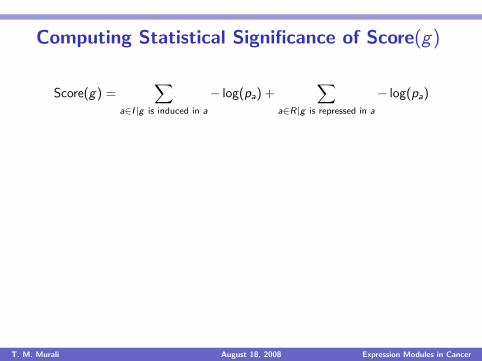
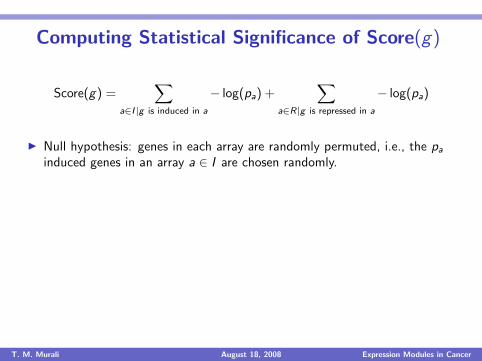
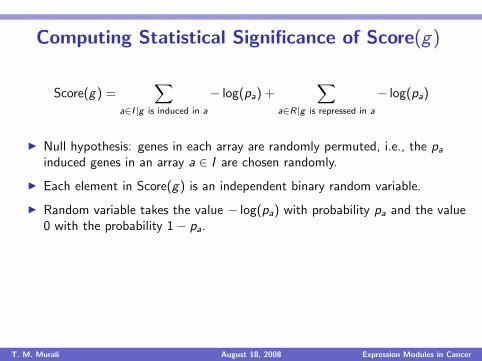
Computing Statistical Significance of Score(g)
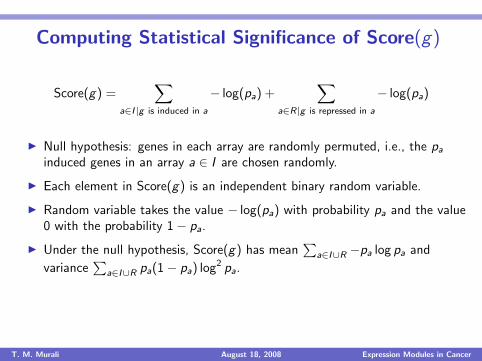
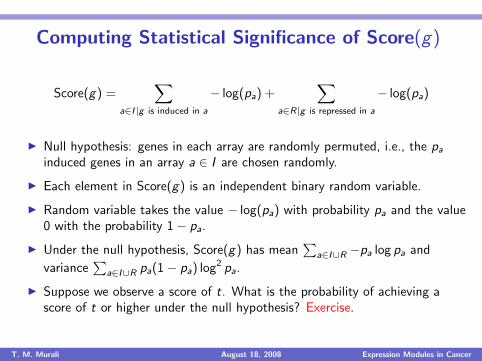
Score(g) =∑
a∈I |g is induced in a
− log(pa) +∑
a∈R|g is repressed in a
− log(pa)
I Null hypothesis: genes in each array are randomly permuted, i.e., the pa
induced genes in an array a ∈ I are chosen randomly.
I Each element in Score(g) is an independent binary random variable.
I Random variable takes the value − log(pa) with probability pa and the value0 with the probability 1− pa.
I Under the null hypothesis, Score(g) has mean∑
a∈I∪R −pa log pa and
variance∑
a∈I∪R pa(1− pa) log2 pa.
I Suppose we observe a score of t. What is the probability of achieving ascore of t or higher under the null hypothesis? Exercise.
T. M. Murali August 18, 2008 Expression Modules in Cancer
Computing Statistical Significance of Score(g)
Score(g) =∑
a∈I |g is induced in a
− log(pa) +∑
a∈R|g is repressed in a
− log(pa)
I Null hypothesis: genes in each array are randomly permuted, i.e., the pa
induced genes in an array a ∈ I are chosen randomly.
I Each element in Score(g) is an independent binary random variable.
I Random variable takes the value − log(pa) with probability pa and the value0 with the probability 1− pa.
I Under the null hypothesis, Score(g) has mean∑
a∈I∪R −pa log pa and
variance∑
a∈I∪R pa(1− pa) log2 pa.
I Suppose we observe a score of t. What is the probability of achieving ascore of t or higher under the null hypothesis? Exercise.
T. M. Murali August 18, 2008 Expression Modules in Cancer
Further Analysis
I Statistical significance of computed modules using leave-one-out crossvalidation (read supplement).
I Compute enrichment of clinical annotations of the arrays in a module.
I Visualisation of modules.
I Literature-based analysis of modules
T. M. Murali August 18, 2008 Expression Modules in Cancer
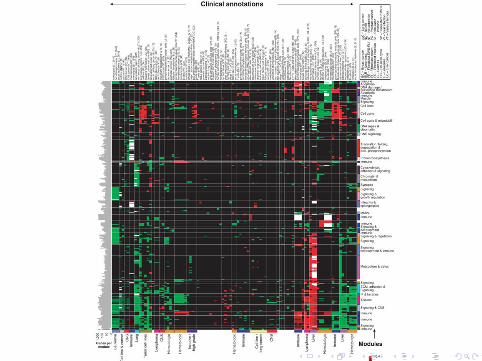
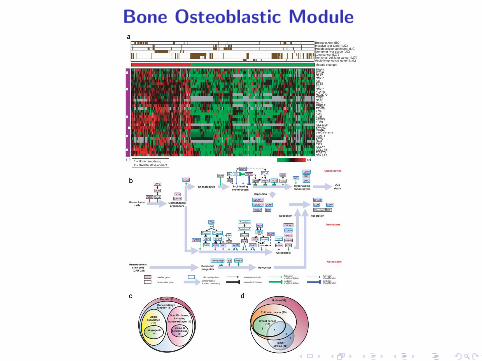
Bone Osteoblastic Module
Conclusions
I Used pre-defined gene sets to drive hierarchical clustering algorithm.
I Remove genes from a cluster of gene sets if the gene’s expressionprofile deviates from the cluster.
I Automatically decide which arrays are part of a module.
I Natural segue into lectures on biclustering where we will automaticallydecide which arrays and which genes to include in a bicluster.
T. M. Murali August 18, 2008 Expression Modules in Cancer
Software Exercise
1. Register for and download Genomica.
2. Use Genomica to compute a module map for the sample data set.
3. Download human Entrez Gene gene sets and gene expression data.
4. Run Genomica on these data sets.
5. Change parameters and run Genomica again. Are the resultsdifferent?
T. M. Murali August 18, 2008 Expression Modules in Cancer
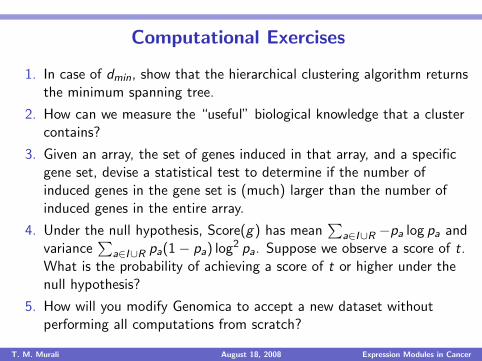
Computational Exercises
1. In case of dmin, show that the hierarchical clustering algorithm returnsthe minimum spanning tree.
2. How can we measure the “useful” biological knowledge that a clustercontains?
3. Given an array, the set of genes induced in that array, and a specificgene set, devise a statistical test to determine if the number ofinduced genes in the gene set is (much) larger than the number ofinduced genes in the entire array.
4. Under the null hypothesis, Score(g) has mean∑
a∈I∪R −pa log pa andvariance
∑a∈I∪R pa(1− pa) log2 pa. Suppose we observe a score of t.
What is the probability of achieving a score of t or higher under thenull hypothesis?
5. How will you modify Genomica to accept a new dataset withoutperforming all computations from scratch?
T. M. Murali August 18, 2008 Expression Modules in Cancer