Embed Size (px)
Citation preview

Application of Geospatial Techniques for Analysis of River Inundation and
Flood Risk Potential along Lower Niger Basin in Nigeria
Emmanuel Udo A., Ojinnaka O. C., Baywood .C .N
Keywords: Remote sensing;Risk management;Spatial planning
ABSTRACT
The application of geospatial technologies (Remote sensing and GIS) in analysis and
management of spatial information is gaining popularity in recent times. It provides information
that has proved useful for a wide range of application in disaster management. The evaluation
and management of floods constitute the first step and the rational basis of mitigation measures
against flood damages. Geospatial techniques have been proved to be the most effective tool for
flood analysis. The use of remote sensing and GIS techniques for flood mapping and monitoring
is an important tool of information for decision-makers. Therefore, an attempt has been made to
apply this modern technique for the assessment of 2012 river inundation and flood risk along
lower Niger basin in Nigeria. Time series Moderate resolution imaging spectrordiometre
(MODIS) data of NASA terra satellite, SRTM, land use/cover map, population data and
geographical information system (GIS) were used for this purpose. The map generated from the
non-flood image captured on 20th October 2010 was used as a reference to determine the extent
of flooding from the disaster image and the spatial impact was measured based on the proportion
of the submerged land territory while physical impact was measured based on the affected
population. Six indexes of flood risk identification, namely, elevation, proximity to the river land
use, population density Drainage density and flow accumulation were used for flood risk analysis
in the study area. Each of these parameters was reclassified into four which included high risk,
moderately risk, low risk, and no risk through the ranking process. The objective for using
multiple factors was to define areas with the highest risk inducing factors (most likely to flood)
and assess how closely these locations are to the actual flooded areas reported during the 2012
flood. Flood risk map (FRM) was later generated by overlaying the reclassified maps of all the
parameters using addition operator. The integration of remotely sensed data and other spatial and
non-spatial data within the GIS platform was able to produce series of thematic maps which was
used to generate a geospatial database for flood risk analysis and assessment. The result of the
analysis shows that the areas inundated was also the locations identified as very high risk zones.
This effectively demonstrated the contribution of geospatial methods in management of flooding.
It was therefore, suggested that policy makers and all stake holders concerned in disaster
management should adopt this reliable technique for informed decision making.
Application of Geospatial Techniques for Analysis of River Inundation and Flood Risk Potential along Lower Niger
Basin in Nigeria (9327)
Emmanuel Udo Ahuchaogu, Ojinnaka Oliver c. and Nkechi Baywood .C (Nigeria)
FIG Congress 2018
Embracing our smart world where the continents connect: enhancing the geospatial maturity of societies
Istanbul, Turkey, May 6–11, 2018

Application of Geospatial Techniques for Analysis of River Inundation and
Flood Risk Potential along Lower Niger Basin in Nigeria
Emmanuel Udo A., Ojinnaka O. C., Baywood .C .N
1.0 INTRODUCTION
Flooding is one of the serious natural hazards in the world Emmanuel et al, Flooding results
when inflow makes a stream channel exceeds its caring capacity. Also when there is low
infiltration capacity and poor drainage, rise in hydrological water table above the surface results
to flooding, sometimes this happens due to collapse of dams and when there is heavy rainfall.
It is one of the major environmental problems facing man within the century. This is especially
the case in most wetlands of the world. The reason of this is the general rise in sea level globally,
due to global warming as well as the saturated nature of the wetlands in the Riverine areas.
Periodic floods occur in many rivers, forming a surrounding region known as flood plain. Rivers
overflow for reasons like excess rainfall. In extreme cases flooding may cause a loss of lives. On
22nd August 2012, torrential rain resulted to the rise of water level in lagdo dam Cameroon. As a
result, the Cameroon authority informed the Nigerian government on 23rd of August of the need
to open the dam and release excess water. Consequently, the dam was opened on the 24th of
August 2012 following the alert given to the Nigeria government a day earlier. The release of the
water from the dam coincided with the release of water from the Kainji and Jebba dams located
in Niger state into the River Niger. This resulted in flooding of major towns downstream along
river Niger-Benue and its tributaries. The unprecedented flood was disastrous than any known
event resulting in several damages and untold sufferings to residents along lower Niger basin
and entire Nigeria warranting federal disaster declarations. The impact on the communities and
local government attracted the attention of state and federal governments who rated many states
along lower Niger basin in group A in the flood impact assessment. In order to lessen the
negative consequences of flood, risk areas must be identified and protected using appropriate
approach.
Application of Geospatial Techniques for Analysis of River Inundation and Flood Risk Potential along Lower Niger
Basin in Nigeria (9327)
Emmanuel Udo Ahuchaogu, Ojinnaka Oliver c. and Nkechi Baywood .C (Nigeria)
FIG Congress 2018
Embracing our smart world where the continents connect: enhancing the geospatial maturity of societies
Istanbul, Turkey, May 6–11, 2018

Fig 1.1 situations during the 2012 flooding in part of the study area
Application of Geospatial Techniques for Analysis of River Inundation and Flood Risk Potential along Lower Niger
Basin in Nigeria (9327)
Emmanuel Udo Ahuchaogu, Ojinnaka Oliver c. and Nkechi Baywood .C (Nigeria)
FIG Congress 2018
Embracing our smart world where the continents connect: enhancing the geospatial maturity of societies
Istanbul, Turkey, May 6–11, 2018

1.2. Aim and Objectives
The aim of this study is to demonstrate the application of Geospatial Techniques for Analysis of
River Inundation and Flood Risk Potential along Lower Niger Basin in Nigeria
Objectives
➢ To determine the spatial extent of 2012 flood within the study area
➢ To understand the general topography, of the study area.
➢ To determine population vulnerability of the study area.
➢ Prepare a flood risk map of the study area,.
➢ To suggest strategies for future flood disaster and risk mitigation in the study area
1.3 Study Area
The area under consideration in this study has a total land mass of 70959 square kilometers which
comprises of four states. The states include kogi state (28936 square kilometers), Edo state
(19638 square kilometers), Anambra state (4855 square kilometers) and Delta state (17530 square
kilometers). Kogi State is located in North central part of Nigeria, Edo state is located in south
western part of Nigeria, Anambra State is a state in the south eastern part of Nigeria, while Delta
state is located in the south –south in a region known as Niger delta. Geographically the study
area is located between latitudes 5°.00`N and 8°.45`N, then longitudes 5°.00`E and 7°.45`E.
Location map
Application of Geospatial Techniques for Analysis of River Inundation and Flood Risk Potential along Lower Niger
Basin in Nigeria (9327)
Emmanuel Udo Ahuchaogu, Ojinnaka Oliver c. and Nkechi Baywood .C (Nigeria)
FIG Congress 2018
Embracing our smart world where the continents connect: enhancing the geospatial maturity of societies
Istanbul, Turkey, May 6–11, 2018

FIG 1.0 LOCATION MAP OF THE STUDY AREA
2.0. MATERIALS AND METHODS
The following materials and data were acquired for this study: Digital Elevation Dataset from
Shuttle Radar Topographical Mission (SRTM). This was downloaded from USGS explorer, prior
and during 2012 flood remote sensing satellite imageries captured by moderate resolution
imaging spectroradiometer (MODIS) on NASAS terra satellite. One was captured on 20th
October 2010 before the flood and the other was captured on 13th October 2012 during the peak
of the flood, Google earth imagery. The spatial locations of some flooded communities were also
acquired with the use of Garmin 72 GPS, Other datasets are administrative map from where
political boundaries and roads were digitized. GPS and notebook were also used to acquire and
record the coordinates of the communities respectively. Others information are population data
from Nigerian population commission, information gathered from NIMET, NEMA, NIWA,
publications and through social survey.
2.1 Flood Extent Mapping
The time series imageries and the administrative map were geo-referenced to WGS84 ZONE 32
in Arc-GIS 10.1, using common reference points. The reason for identifying in the same
coordinate system is to ensure compatibility between the various environmental data-set. The
creation of a personal geodatabase for each feature of interest was done in ArcCatalog extension
Application of Geospatial Techniques for Analysis of River Inundation and Flood Risk Potential along Lower Niger
Basin in Nigeria (9327)
Emmanuel Udo Ahuchaogu, Ojinnaka Oliver c. and Nkechi Baywood .C (Nigeria)
FIG Congress 2018
Embracing our smart world where the continents connect: enhancing the geospatial maturity of societies
Istanbul, Turkey, May 6–11, 2018

of the ArcGIS 10.1. The digitizing process was done in the ArcMap environment for feature
extraction. Digitizing is the process of converting geographical features from an analogue or
raster map into vector format. The true width of the river channel was extracted from pre-disaster
imagery as poly- gons (shape file) and in the same process, the flood mask along the river
channel from the disaster image was digitized as polygons within the ArcMap platform. The
map generated from the non-flood image captured on 20th October 2010 was used as a reference
to determine the extent of flooding as shown in 3.1a and 3.1b below.
2.2 Overlay Analysis
For detail study, the Niger-Benue River layer and the flood mask layer were both overlaid on the
administrative map layer which is disaggregated to the LGA level (Figure 3.1c). Spatial erase
was carried out on the new map to erase the river feature that falls within the area of the flood
polygon this also removed the true width of the Niger-Benue River from the area affected by
flood . This procedure was able to separate the flooded area from the actual river channel so as to
reveal the spatial extent of the flood; This criteria was adopted from (Felix Ndidi Nkeki 2013) .
With the application of GIS spatial analysis, water covered area is synthesized. After the spatial
erasing of the true river channel, the flooded area marked by red color was mapped out . The
overall affected area along the river basin is 5613sq.km this constitute 8% of the land mass of the
study area. The overlay analysis revealed that 26local governments were affected. The spatial
extents at the affected locations were digitised and calculated using calculate geometry module.
The analysis revealed that spatially, Ibaji, was the worst affected local government Figur3.2a-.
A ground truthing was also conducted to validate the extent of the flood as captured by the
satellite imagery and to identify other flooded areas. During this exercise, the co-ordinate of some
flooded locations in the affected communities were captured and added as events to the flood
extent map. The validation exercise revealed that flooded water left some footprints on walls of
buildings and these footprints were measured with a measuring tape and its mean were calculated
to arrive at the average height of flooded water of 6m above the ground level. The mean height of
flooded water was considered because the flood height varied from one location to another even
in the same communities. Questionnaires were dispatched and interview also conducted.
2.3. Terrain Modelling
Creating the DEM for the analysis requires merging the SRTM DEM tiles into one raster grid
entity (mosaicking). Progressively, the tiles were entered into the ArcMap-Arc Info platform for
Application of Geospatial Techniques for Analysis of River Inundation and Flood Risk Potential along Lower Niger
Basin in Nigeria (9327)
Emmanuel Udo Ahuchaogu, Ojinnaka Oliver c. and Nkechi Baywood .C (Nigeria)
FIG Congress 2018
Embracing our smart world where the continents connect: enhancing the geospatial maturity of societies
Istanbul, Turkey, May 6–11, 2018
processing. Using the tiles elevation data were mosaicked with data management module of Arc-
tool box in ArcGIS 10.1 and the generated data was transformed from geographic coordinate
system to projected coordinate system (i.e. from GCS-WGS1984 to WGS1984 World Mercator.
The mosaicked data was masked with the boundary limit of the study area and converted to xyz
point data. The XYZ point data was exported to surfer10 worksheet where the data was
resampled to a grid interval of 40m This criteria was adopted from ( Emmanuel Udo 2015). The
resampled data was blanked from the blanked file, elevation model contour, wireframe, flow
model, slope map and flow accumulation map of the study area were generated. The multiple
terrain representation was adopted in other to critically analyze the terrain. These models shows
terrain elevation range of between 20m to 600m above mean sea level with elevation decreasing
towards the river Niger
2.4 Drainage Delineation
The drainage map is the resultant flow accumulation map developed from the SRTM which sinks
has been filled. This was processed using the hydrological module of ArcGIS 10.1. In the
hydrological module tool in ArcGIS, before the delineation of drainage can be done, all sinks
need to be filled. The sink areas are pixels which have heights that are lower than neighboring
pixel values. when it is filled the runoff from the DEM will reach its edges. In the hydrology
module the sink in the SRTM was filled using the fill module. The resultant filled raster data was
used as input to generate the flow direction raster data using the flow direction module. The
output (flow direction raster) was used as input to generate the drainage using the flow
accumulation module.
Land Use: The land use of the study area was classified based on visual image interpretation of
goggle earth imagery. The land use map reveals that there were about six land use types in the
study area and these are built up area, cleared land, farmland, wet lands, forest and water body.
The land use was later reclassified into three based on the capacity of each land use type to
infiltrate water. It is discovered that built up areas, wetlands and water body will highly support
flood generation while farmlands and cleared land are moderately; and forest will be lowly.
Application of Geospatial Techniques for Analysis of River Inundation and Flood Risk Potential along Lower Niger
Basin in Nigeria (9327)
Emmanuel Udo Ahuchaogu, Ojinnaka Oliver c. and Nkechi Baywood .C (Nigeria)
FIG Congress 2018
Embracing our smart world where the continents connect: enhancing the geospatial maturity of societies
Istanbul, Turkey, May 6–11, 2018

2.5 Risk mapping of kogi state:
A risk map demarcates areas under potential consequences. Knowing the areas under potentials
danger enables a proper decision to be taken and appropriate measure taken to mitigate the
impact before flood strikes. Flood risk map enables facilities at dangerous flood zones to be
identified and protected before the event. In this study, the risky areas were zoned using the flow
accumulation, proximity to the river, land use, Elevation, Slopes, and drainage density as
elements of flood risk identification. Analytical Hierarchical Process (AHP) was adopted in this
study whereby these flood factors are ranked and overlaid for decision making. Therefore, each
of the parameters was reclassified into four which included high risk, moderate risk, low risk and
no risk through the ranking process . Flood risk map (FRM) was later generated by overlaying
the reclassified maps of all the parameters using addition operator to generate the risk map of the
study area i.e. FRM = Ʃ {Reclassified (Elevation, Distance to Drainage, drainage Density, land
use, Flow direction , and slope)} (fig3.6b). The spatial extents of the risk categories were
digitized in layers in form of shape files and the area occupied by each risk category was
automatically calculated in GIS environment using calculate geometry module. For in-depth
spatial analysis administrative layer of the study area was super-imposed to the risk map. The risk
map was validated with the 2012 flood extent map of the study area. This analysis revealed that
the areas flooded are, low lying areas and areas closer to the flood plain portrayed as high and
moderate risk zones in the risk map
2.5 Exposed population ;
Population exposed to different levels of risk was estimated by integrating the spatial coverage of
each risk category with the average population density of study area i.e (Pop. Vulnerability. =
Area of risk category * pop. Density)
3.0. RESULTS AND DISCUSSIONS
3.1 Results
Figure 3.1a and b is the comparison before and during flood in the study area Fig 3.1c is the
overlay analysis of river layer flood layer and the administrative elements of the study area.
fig3.2a is the area of land in square kilometers inundated at different locations within the study
area. Fig3.2b is the percentage of land affected in the study area. Table3.1 reveals the population
vulnerable to different levels of flood exposure within the study area. Fig 3.3a, and b are over
lay analysis of the flood layer on the 3-Dmodel of the study area. Figure3.4a and b are the,
Application of Geospatial Techniques for Analysis of River Inundation and Flood Risk Potential along Lower Niger
Basin in Nigeria (9327)
Emmanuel Udo Ahuchaogu, Ojinnaka Oliver c. and Nkechi Baywood .C (Nigeria)
FIG Congress 2018
Embracing our smart world where the continents connect: enhancing the geospatial maturity of societies
Istanbul, Turkey, May 6–11, 2018

DTM and contour map of the study area. Figure3.5a and b are the land use/cover and drainage
map of the study area. Fig 3.6a and b are Flow accumulation map of the study area and Over lay
analysis of the flood layer on the DTM of the study area While (figures 3.7a and b and c) are
the risk map of the study area , Area of Land occupied by various risk zones and validation of the
risk map
Fig 3.1a Fig 3.1b
Application of Geospatial Techniques for Analysis of River Inundation and Flood Risk Potential along Lower Niger
Basin in Nigeria (9327)
Emmanuel Udo Ahuchaogu, Ojinnaka Oliver c. and Nkechi Baywood .C (Nigeria)
FIG Congress 2018
Embracing our smart world where the continents connect: enhancing the geospatial maturity of societies
Istanbul, Turkey, May 6–11, 2018

Fig3.1c overlay analisis of river layer, flood mask layer and Adm. Elements of the study area
Fig3.2a spatial inpact of the flood on various locationns
Application of Geospatial Techniques for Analysis of River Inundation and Flood Risk Potential along Lower Niger
Basin in Nigeria (9327)
Emmanuel Udo Ahuchaogu, Ojinnaka Oliver c. and Nkechi Baywood .C (Nigeria)
FIG Congress 2018
Embracing our smart world where the continents connect: enhancing the geospatial maturity of societies
Istanbul, Turkey, May 6–11, 2018

Fig3.2b spatial inpact of the flood on various locationns
Fig3.2c is the percentage of land affected in the study area
EXPOSUREPOPULATION
HIGH 5925487
MODERATE 4534435
LOW 2292284
NO 2026030
TABLE 3.1 Estimate Of Population Vulnerable To Flood
Application of Geospatial Techniques for Analysis of River Inundation and Flood Risk Potential along Lower Niger
Basin in Nigeria (9327)
Emmanuel Udo Ahuchaogu, Ojinnaka Oliver c. and Nkechi Baywood .C (Nigeria)
FIG Congress 2018
Embracing our smart world where the continents connect: enhancing the geospatial maturity of societies
Istanbul, Turkey, May 6–11, 2018

Fig 3.3a over lay analysis of the flood layer on the 3-Dmodel of the study area
Fig 3.3b Contour over lay analysis of the flood layer on the 3-Dmodel of the study area
Application of Geospatial Techniques for Analysis of River Inundation and Flood Risk Potential along Lower Niger
Basin in Nigeria (9327)
Emmanuel Udo Ahuchaogu, Ojinnaka Oliver c. and Nkechi Baywood .C (Nigeria)
FIG Congress 2018
Embracing our smart world where the continents connect: enhancing the geospatial maturity of societies
Istanbul, Turkey, May 6–11, 2018

(a) b
Figure3.4 DTM map of the study area Contour map of the study area
Application of Geospatial Techniques for Analysis of River Inundation and Flood Risk Potential along Lower Niger
Basin in Nigeria (9327)
Emmanuel Udo Ahuchaogu, Ojinnaka Oliver c. and Nkechi Baywood .C (Nigeria)
FIG Congress 2018
Embracing our smart world where the continents connect: enhancing the geospatial maturity of societies
Istanbul, Turkey, May 6–11, 2018

Fig 3.5a Land use map of the study area 3.5b Drainage Map of the study area
Application of Geospatial Techniques for Analysis of River Inundation and Flood Risk Potential along Lower Niger
Basin in Nigeria (9327)
Emmanuel Udo Ahuchaogu, Ojinnaka Oliver c. and Nkechi Baywood .C (Nigeria)
FIG Congress 2018
Embracing our smart world where the continents connect: enhancing the geospatial maturity of societies
Istanbul, Turkey, May 6–11, 2018

a)Flow accumulation map of the study area (b)Over lay analysis of the flood layer on the DTM
Application of Geospatial Techniques for Analysis of River Inundation and Flood Risk Potential along Lower Niger
Basin in Nigeria (9327)
Emmanuel Udo Ahuchaogu, Ojinnaka Oliver c. and Nkechi Baywood .C (Nigeria)
FIG Congress 2018
Embracing our smart world where the continents connect: enhancing the geospatial maturity of societies
Istanbul, Turkey, May 6–11, 2018

Fig 3.7a risk map of the study area 3.7b Area of Land occupied by various risk zones
Application of Geospatial Techniques for Analysis of River Inundation and Flood Risk Potential along Lower Niger
Basin in Nigeria (9327)
Emmanuel Udo Ahuchaogu, Ojinnaka Oliver c. and Nkechi Baywood .C (Nigeria)
FIG Congress 2018
Embracing our smart world where the continents connect: enhancing the geospatial maturity of societies
Istanbul, Turkey, May 6–11, 2018
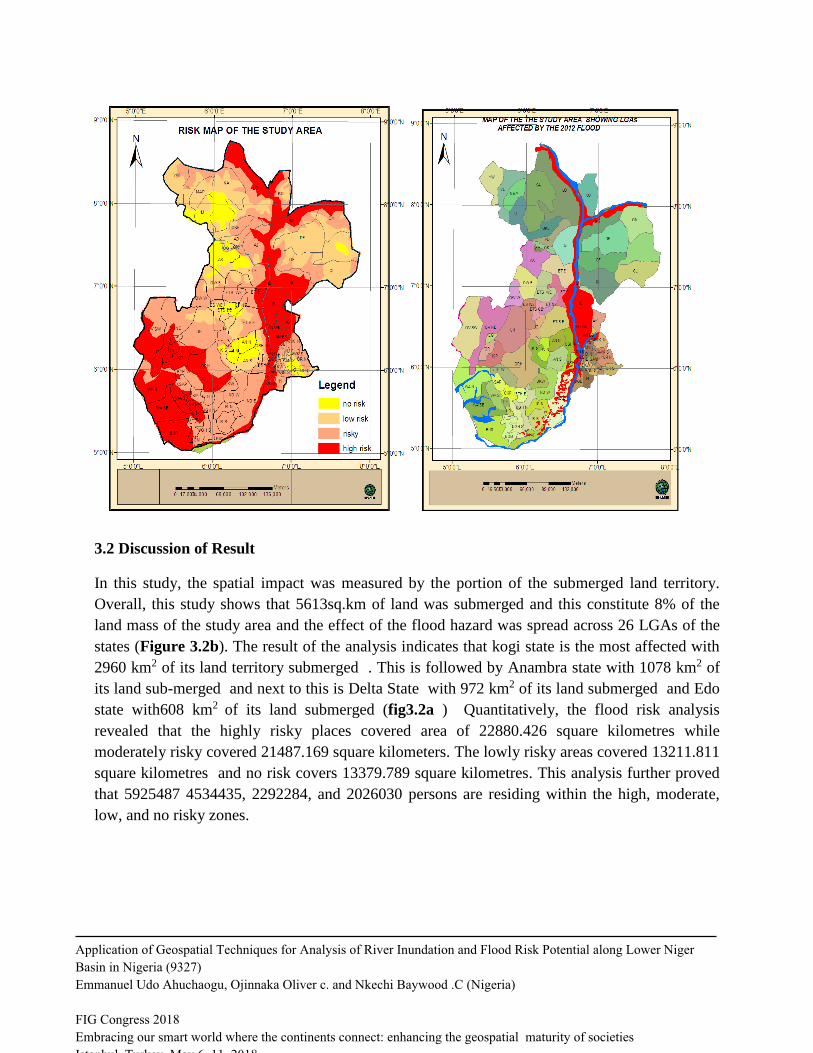
3.2 Discussion of Result
In this study, the spatial impact was measured by the portion of the submerged land territory.
Overall, this study shows that 5613sq.km of land was submerged and this constitute 8% of the
land mass of the study area and the effect of the flood hazard was spread across 26 LGAs of the
states (Figure 3.2b). The result of the analysis indicates that kogi state is the most affected with
2960 km2 of its land territory submerged . This is followed by Anambra state with 1078 km2 of
its land sub-merged and next to this is Delta State with 972 km2 of its land submerged and Edo
state with608 km2 of its land submerged (fig3.2a ) Quantitatively, the flood risk analysis
revealed that the highly risky places covered area of 22880.426 square kilometres while
moderately risky covered 21487.169 square kilometers. The lowly risky areas covered 13211.811
square kilometres and no risk covers 13379.789 square kilometres. This analysis further proved
that 5925487 4534435, 2292284, and 2026030 persons are residing within the high, moderate,
low, and no risky zones.
Application of Geospatial Techniques for Analysis of River Inundation and Flood Risk Potential along Lower Niger
Basin in Nigeria (9327)
Emmanuel Udo Ahuchaogu, Ojinnaka Oliver c. and Nkechi Baywood .C (Nigeria)
FIG Congress 2018
Embracing our smart world where the continents connect: enhancing the geospatial maturity of societies
Istanbul, Turkey, May 6–11, 2018

3.3. Recommendations
In response to the re-occurring flood events in the study area and in Nigeria as a whole,
(1) There is the need to intensify environmental education
(2) Continual risk Mapping of cities in Nigeria.
(3) There is the need for improved land Use Planning in the study area.
(4) policy makers and all stake holders concerned in disaster management should adopt this
reliable technique disaster management
Refferences
Emmanuel udo 2015, Flood Hazard Analysis and Damage Assessment of 2012 Flood in
Anambra State Using GIS and Remote Sensing Approach, American Journal of Geographic
Information System 2015, 4(1): 38-51
Felix Ndidi Nkeki (2013). Geospatial Techniques for the Assessment and Analysis of Flood Risk
along the Niger-Benue Basin in Nigeria, Journal of Geographic Information System
http://dx.doi.org/10.4236/jgis.2013.
Nwafor A.N, Flood Extent Mapping In Bayesa State, Naigeria. Journal of Geography, Vol. 8
(33), pp 18-2
Olajuyigbe, E A, (2012) Mapping And Analysis Of 2012 Flood Disaster In Edo State Using
Geospatial Technic. Journal Of Environmental sciences, vol. 6 (5), PP 32-44.
Ologunorisa, E. T. (2004). An Assessment of Flood Vulnerability Zones in the Niger Delta,
Nigeria. International Journal of Environmental Studies, Vol. 61(1), pp. 31-38.
.
Ministry of Environment. (2012) Flood Early Warning: June, 2012. Early Warning Center.
Sunday Ishaya 2009. mapping flood vulnerable areas in a developing urban centre of Nigeria
Journal of Sustainable Development in Africa (Volume 11, No.4, 2009.
Barroca, L., 2006. Indicators for Identification of Urban Flooding Vulnerability. National
Hazards Earth System, Science. 6: 553 – 561.
Application of Geospatial Techniques for Analysis of River Inundation and Flood Risk Potential along Lower Niger
Basin in Nigeria (9327)
Emmanuel Udo Ahuchaogu, Ojinnaka Oliver c. and Nkechi Baywood .C (Nigeria)
FIG Congress 2018
Embracing our smart world where the continents connect: enhancing the geospatial maturity of societies
Istanbul, Turkey, May 6–11, 2018


![Showcasing the Tourism Potentials of Lokoja, Kogi …largest rivers in West Africa, rivers Benue and Niger [3]. River Benue with its source from one of the Cameroon Mountains and river](https://img.pdfslide.us/doc/110x75/5e78f4b384d900133426f4c8/showcasing-the-tourism-potentials-of-lokoja-kogi-largest-rivers-in-west-africa.jpg)


![11.[52-60]Assessment of Suitability of Kerian River Tributaries Using](https://img.pdfslide.us/doc/110x75/577d1e5a1a28ab4e1e8e5568/1152-60assessment-of-suitability-of-kerian-river-tributaries-using.jpg)