Embed Size (px)
Citation preview
Running head: THE ACADEMIC MOTIVATION SCALE
Application of Exploratory Structural Equation Modeling to
Evaluate the Academic Motivation Scale
Frédéric Guaya, Alexandre J. S. Morinb, David Litalienc, Pierre Valoisd, and Robert J. Vallerande
aProfessor of Counseling Psychology and Education, Université Laval
bResearch Professor at the Institute for Positive Psychology and Education,
Australian Catholic University
cDoctoral student in Counseling Psychology and Education, Université Laval
dProfessor at the Faculty of Educational Sciences, Université Laval
eProfessor and Chair of the Educational and Counselling Psychology Department,
McGill University
This is the prepublication version of the following manuscript: Guay, F., Morin, A. J. S., Litalien, D., Valois, P., & Vallerand, R. J. (2015) Application of exploratory structural equation modeling to evaluate the academic motivation scale. The Journal of Experimental Education, 83 (1), 51-82, DOI: 10.1080/00220973.2013.876231 © 2015. This paper is not the copy of record and may not exactly replicate the authoritative document published in The Journal of Experimental Education. Please do not copy or cite without author's permission. The final article is available, upon publication, at: https://doi.org/10.1080/00220973.2013.876231
Acknowledgements: This study was supported by the Canada Research Chair Program, the Social Sciences and Humanities Research Council of Canada, and the Fonds de Recherche sur la Société et la Culture. This study was made possible in part by a grant from the Australian Research Council (DP130102713) awarded to a research team that included the second author. Corresponding author: Frédéric Guay Pavillon des Sciences de l’Éducation, 2320, rue des Bibliothèques, Université Laval, Québec (Québec) G1V 0A6, Canada. E-mail : [email protected]

Abstract
In this research, we examined the construct validity of scores (factor structure, convergent and divergent validity) of the Academic Motivation Scale (AMS) using exploratory structural equation modeling (ESEM). Study 1 and Study 2 involved 1416 college students and 4498 high school students, respectively. First, results of both studies indicated that the factor structure tested with ESEM provides better fit to the data than the one tested with confirmatory factor analysis (CFA). Second, the factor structure was gender invariant in the ESEM framework. Third, the pattern of convergent and divergent correlations among AMS factors was more in line with theoretical expectations when computed with ESEM rather than CFA. Fourth, the configuration of convergent and divergent correlations connecting each AMS factors to a validity criterion was more in line with theoretical expectations with ESEM than with CFA. Overall, results obtained via ESEM provided relative good support for the construct validity of the AMS scores.
Keywords: academic motivation scale, motivation, self-determination

THE ACADEMIC MOTIVATION SCALE 1
Confirmatory Factor Analysis (CFA) has been widely used to test the factor, convergent and divergent validity of scores of various psychological instruments. However, many psychological instruments fail to reach commonly accepted level of fit to the data usually advocated in CFA research (see Marsh et al., 2009 for more details). For example, the factor structure of the Academic Motivation Scale (AMS), a widely used instrument assessing students’ motivation, has been tested in several studies. However, the AMS factor structure failed to meet acceptable standards of fit (e.g., Hu & Bentler, 1999) in most of these studies. The goal of this research was thus to test some aspects of the construct validity (i.e., factor validity, convergent and divergent validity) of the AMS scores while using a new statistical tool overcoming some limits of CFA, namely exploratory structural equation modeling (ESEM; Asparohov and Muthén, 2009; Marsh et al., 2009; Morin, Marsh, & Nagengast, 2013). ESEM offers the possibility to integrate features of confirmatory factor analysis (CFA), structural equation modeling, and exploratory factor analysis (EFA) in a single framework. Below, we provide a brief overview of ESEM and a literature review on the theoretical framework that underlies the AMS as well as on papers that have tested the validity of its scores. Why use ESEM over the CFA-Independent Cluster Model?
The basic assumption behind CFA analysis is that items load on their respective factor (i.e. main loading), with no cross-loading on the other latent factors (Marsh et al., 2009). This procedure is consistent with the restrictive independent cluster model (ICM) of CFA, and it has the advantage of motivating researchers to develop parsimonious models. However, ICM-CFA requires strong measurement assumptions that do not always hold with real data. Specifically, a measurement instrument may have many cross-loadings (though much weaker than main loading) that are coherent with the underlying theory. The ICM-CFA approach of setting cross-loadings to zero may therefore lead researchers to specify a parsimonious model that does not fit the data well. Similarly, allowing small cross loadings to be incorporated in a model provides some control for the fact that items are imperfect indicators of a construct and thus present some degree of irrelevant association with the other constructs included in the model - a form of systematic measurement error. More importantly, when cross-loadings, even small ones, are not estimated, then the only way to represent these associations between specific indicators and other constructs is through the latent factor correlations, which end up being overestimated in many applications of CFA (e.g., Asparouhov & Muthén, 2009; Marsh et al., 2009; Morin et al., 2013). An ESEM approach overcomes these limitations because, like EFA, it freely estimates all rotated cross-loadings between indicators and latent factors. Moreover, ESEM offers the same advantages as CFA analysis in terms of fit indices, standard errors, and tests of significance. The ESEM framework flexibility (correlated residuals, tests of invariance, etc.) therefore provides a synergy between CFA, EFA, and SEM.
Some confusion exists regarding the difference between EFA/ESEM and CFA models. Specifically, we note a semantically-generated confusion leading some researchers to consider EFA/ESEM as an exploratory method for situations where no a priori exist regarding the expected factor structure, whereas they see CFA as a purely confirmatory procedure. However, there is nothing inherently “exploratory” (i.e., devoid of a priori) or “confirmatory” in either EFA/ESEM or CFA. Rather, the main difference between them is that all cross loadings are estimated in EFA/ESEM and not in CFA.
In a recent comprehensive review of ESEM, Marsh, Morin, Parker, and Kaur (in press) have located a total of 103 publically available manuscripts, including 91 published journal articles, in which a reference was made to ESEM. When we examined carefully these 91 publications, 52 of them used the newly developed ESEM package implemented in Mplus to analyze real data. The majority of these studies (n = 34) follow a confirmatory approach in line with the one used in this research (e.g., Abou-Shouk, Megicks, & Lim, 2012; Appel,
THE ACADEMIC MOTIVATION SCALE 2
Gnambs, & Maio, 2012; Morin & Maïano, 2011). That is, these studies defined a priori all the expected latent constructs and then verified if the main loadings were more substantial than the cross-loadings. As part of this process, the fit indices of ESEM and CFA models are also compared to empirically verify the superiority of an ESEM versus CFA representation of the data. In other words, these studies used ESEM as an alternative to classical CFA in order to estimate cross-loadings. Only a few studies (n = 18) used an exploratory approach to ESEM without clear a priori expectations to locate the optimal solution (i.e., a classical exploratory study in which researchers attempt to reduce a large number of factors to a smaller number of subsets; e.g., Allen, Lonigan, & Wilson, 2013; Anderson, Sanderson, & Kosutic, 2011; Maïano, Morin, Lafranchi, & Therme, 2013). However, some of these studies still contrasted a reduced number of possibilities based on theoretical expectations regarding the number of factors that should be obtained (e.g., Kristjansson et al., 2011). Similarly, some studies started in the first place with a confirmatory approach and when observing misfit moved to an exploratory approach to locate a more optimal structure (e.g., Meleddu, Guicciardi, Scalas, & Fadda, 2012). These studies are in line with classical EFA and utilize ESEM as a modern replacement for classical EFA (versus the first category that employs ESEM as a replacement for CFA). More precisely, these studies had no clear hypothesis regarding which indicators should load on the factors and employ ESEM to explore the data to come up with a solution. Finally, only one study (Myers, Chase, Pierce, & Martin, 2011) starts by specifying a clear expected a priori structure (i.e. ESEM as a replacement for CFA), but also supplement this approach by an exploratory data-driven process where solutions including different numbers of factors are contrasted in a classical EFA manner.
Empirically/statistically, it can be argued that the approach of contrasting solutions including different numbers of factors subsumes the confirmatory approach of estimating a single a priori solution (i.e. both provide fit information for the a priori solution). However, both approaches have drastically different implications. An approach where solutions with differing numbers of factors are compared in order to pick the best one based on a data-driven process (that can be complemented, or not, with some theoretical guidelines), is referred to as an exploratory process. Conversely, a confirmatory process starts from clear expectations and test them with the data. When there are strong assumptions regarding the expected structure of the data, and no reason to expect the structure to be different, then there is no reason to "explore" alternative solutions in a data-driven manner. This approach is less than optimal; reinforcing the dust-bowl empiricism approach that led in part to the idea that EFA approach should not be used in confirmatory research.
Our goal in this paper is thus to illustrate the use of ESEM as a viable confirmatory alternative to CFA, based on strong theoretical assumptions regarding the expected factor structure. However, nothing precludes the use of ESEM for more traditional data-driven exploratory purposes where the model fit information can be used to help in the determination of the optimal number of factors to extract (e.g., Asparouhov & Muthén, 2009; Hayashi, Bentler, & Yuan, 2007). An ESEM Application to Evaluate the Construct Validity of Scores and the Gender Invariance of the AMS
Education researchers and practitioners recognize that motivation is important for academic achievement and persistence (Pintrich, 2003). Numerous theories have been proposed to understand students’ motivation toward school. One theoretical approach that has gained greater visibility in this area is self-determination theory (SDT; Deci & Ryan, 2002). The central thesis of this theory is that students will develop their competencies in different school subjects when their motivation for doing schoolwork is for pleasure, choice, and personal satisfaction. In contrast, motivations that reflect external impetuses will hamper the development of these competencies.
THE ACADEMIC MOTIVATION SCALE 3
In educational psychology, one of the most widely used SDT-based instruments to measure student motivation is the AMS (Vallerand, Blais, Briere, & Pelletier, 1989, also see Vallerand & Bissonnette, 1992, Vallerand et al., 1993). The AMS is publically available and can be downloaded from http://www.er.uqam.ca/nobel/r26710/LRCS/echelles_en.htm. Evidence of construct validity has been shown in several empirical studies (e.g. Vallerand et al., 1992, 1993) though some studies have questioned its psychometric properties (Fairchild, Horsta, Finneya, & Barronb, 2005). More than 20 years after the AMS was introduced (Vallerand, Blais et al., 1989), we believe the time has come to reassess construct validity evidence (factor structure, convergent and divergent validity) in light of ESEM. Below, we describe SDT-based types of motivation and review some studies that tested the construct validity of scores from the AMS. We then briefly explain why it is important to analyse the construct validity of scores from the AMS via ESEM. Types of Motivation Proposed by SDT
According to SDT, motivation is not a global, undifferentiated concept. Rather, motivation is defined as a multidimensional concept that varies in terms of quality. SDT proposes different types of motivation that reflect different levels of self-determination (i.e., the extent to which behavior originates from the self; Deci & Ryan, 1985). Intrinsic motivation (IM) is the most self-determined form of motivation, and occurs when a person engages in an activity for its own sake, for the pleasure and satisfaction derived. The AMS measures three types of IM: IM to know (pleasure and satisfaction in learning, exploring, and trying to understand something new), IM to accomplish (satisfaction and pleasure derived from trying to surpass oneself or to accomplish or create something), and IM to experience stimulation (sensations, excitement, or aesthetic enjoyment associated with the activity) in line with the Tripartite Model of Intrinsic Motivation (for more details, see Carbonneau & Vallerand, 2012).
On the other hand, extrinsic motivation involves engaging in an activity as a mean to an end rather than for its intrinsic qualities. According to SDT, there are several types of extrinsic motivation, which differ in their underlying level of self-determination. From the lowest to the highest level of self-determination, they are external regulation, introjected regulation, identified regulation, and integrated regulation. External regulation (ER) refers to behaviors that are not self-determined, and are instead regulated by external means such as rewards and constraints. Regulation is introjected (IR) when behaviors are partly internalized, but not fully coherent with other aspects of the self. For example, individuals can act in order to rid themselves of guilt, lessen anxiety, or maintain a positive self-image. Identified regulation (IDR) occurs when behaviors are performed by choice, because the individual considers them important. For example, a student who does not enjoy college might decide to pursue a college education anyway, because it is an important step toward entering the job market in a desired field. Integrated regulation occurs when identified regulations are congruent with the individual’s values and needs. However, the AMS does not measure this type of motivation, because it occurs in older students who have developed a better sense of their identity. A further type of motivation posited by SDT is amotivation (AM). It is characterized by a lack of intentionality, or a relative lack of motivation (intrinsic or extrinsic). Amotivated individuals feel incompetent and out of control. The Simplex-Like Pattern of Correlations among Types of Motivation
According to SDT, the motivation types can be ordered along a continuum. Motivation types are therefore expected to show a simplex like pattern of correlations, with stronger positive correlations between adjacent than distant motivations (Ryan & Connell, 1989). The simplex concept (Guttman, 1954) describes ordered relations between correlated variables such that those that share conceptual similarities correlate more highly than those that are more conceptually discrepant. When a correlation matrix is rearranged in a way that
THE ACADEMIC MOTIVATION SCALE 4
constructs with similar conceptual properties are next to each other, a perfect simplex model will show the largest correlations close to the diagonal and correlations below the diagonal should decrease: correlations far from the diagonal are weaker than those that are proximal. Translating this simplex concept into a correlation matrix containing types of motivation, we should observe, for example, that identified and intrinsic motivations are positively and moderately correlated, and these correlations should be higher than correlations connecting intrinsic motivations to external regulation (see Ryan & Connell, 1989).
Moreover, SDT posits that correlations between types of motivation and positive antecedents and outcomes should be in line with the continuum (Deci & Ryan, 2002). For example, correlations linking intrinsic motivations to achievement should be higher than the correlation between identified regulation and achievement. Similarly, the correlation between identified regulation and achievement should be higher than the correlation between introjected regulation and achievement, and so on. These patterns of correlations are frequently used to test the convergent and divergent validity of scores of motivational instruments developed in light of SDT. Previous Studies Assessing the Construct Validity of the AMS Scale Scores
The AMS contains 28 items designed to elicit responses to the question, “Why are you going to school/college?” The items evaluate seven types of motivation (three types of IM, identified regulation, introjected regulation, external regulation, and amotivation), with four items per type of motivation.
In this article, we review only papers that tested some aspects of the construct validity of scores of the original version of the scale. Research articles that measured only one type of IM (e.g., IM to know; Grouzet, Otis, & Pelletier, 2006; Ratelle, Vallerand, Larose, & Senécal, 2007) are not reviewed. We found a total of seven scientific articles that met this criterion. Table 1 outlines the methods and results of these articles. In each of these studies, the reliability of scores on these subscales was supported (see Table 1).
The first article on the construct validity of responses provided on the AMS has been published by Vallerand, Blais, et al. (1989). Using the French-Canadian version of the AMS, the authors conducted three studies (Study 3 is not described here because it only reports reliabilities; see Table 1). In Study 1, an EFA conducted on 358 participants provided support for the factor validity of the AMS measurement model. In Study 2, results of a CFA performed on 746 participants also supported the factor validity of the AMS measurement model (GFI and AGFI > .90). However, Study 2 failed to clearly support the convergent and divergent validity of scores on the AMS subscales. The simplex pattern among motivation types was problematic, because some types of IM (to accomplish and to experience stimulation) correlated more positively with introjected than with identified regulation. Moreover, correlations among types of intrinsic motivation were relatively high (r =.52 to .64). Similarly, when the divergent validity of AMS responses was assessed in relation to interest in school activities, this external criterion correlated positively with introjected regulation (r = .30).
In a second investigation, Vallerand et al. (1992) tested the construct validity of responses provided on the English version of the AMS (adapted from the French version through a rigorous process; Vallerand, 1989) in a sample of 802 university students. A CFA indicated that the seven-factor structure inadequately reproduced the observed covariance matrix (NFI, AGFI, and GFI were .89, .87, and .89 respectively), but fit indices increased when 26 correlated residuals were included: NFI, AGFI, and GFI were respectively .93, .91, and .94 (Vallerand et al., 1992).
In a third investigation, Vallerand et al. (1993) tested the construct validity of responses provided on the English version of the AMS in 217 junior college students. Again, the convergent and divergent validity of the AMS scale scores were not clearly supported by
THE ACADEMIC MOTIVATION SCALE 5
the results. The correlations among motivation types did not fully support the expected simplex pattern: some types of IM (to accomplish and to experience stimulation) correlated more positively with introjected regulation than with identified regulation. Correlations among types of intrinsic motivation were relatively high (r =.58 to .62). Moreover, contrary to expectations, introjected regulation correlated positively with some adaptive criteria (intrinsic interest, task orientation, concentration, and positive emotions). Taken together, these three pioneer studies indicate that the factor, convergent and divergent validities of responses provided on the AMS could be improved.
Four subsequent studies tested the construct validity of the AMS scale scores. Blanchard, Vrignaud, Lallemand, Dosnon, and Wach (1997) tested the French version of the AMS in a sample of 1540 French high school students. CFA results supported in part the factor structure of the AMS measurement model. Although the GFI and AGFI were less than optimal, the NFI, NNFI, and RMSEA were adequate (see Table 1). However, the convergent and divergent validity of the AMS scale scores based one the simplex pattern among motivation types was not perfectly supported: IM to accomplish and to experience stimulation correlated more positively with introjected regulation than with identified regulation. Correlations among types of intrinsic motivation were relatively high ranging between .56 and .69. Furthermore, and contrary to expectations, introjected regulation correlated positively with an adaptive criterion (i.e., intrinsic interests).
Cokley, Bernard, Cunningham, and Motoike (2001) tested the English version of the scale in a sample of 263 university students. CFAs mostly supported the factor structure of the AMS measurement model. Although the NFI was low (see Table 1), the SRMR, RMSEA, and CFI were adequate. Divergent and convergent correlations between scores on the AMS and academic self-concept were mostly in line with the SDT continuum. However, few motivation types correlated with Grade Point Average (GPA) and major GPA at p < .001.
Fairchild et al. (2005) analyzed the English version of the AMS in a sample of 1406 college students. CFA fit indices supported the factor structure of the AMS measurement model. However, the simplex correlation pattern was not fully supported among the AMS scales scores: the three types of IM correlated more positively with introjected regulation than with identified regulation. Also, correlations among types of intrinsic motivation were quite high ranging between .71 and .87. Contrary to expectations, introjected regulation correlated positively with an external criterion: mastery approach goals.
Barkoukis, Tsorbatzoudis, Grouios, and Sideridis (2008) analyzed the Greek version of the AMS in two studies. In Study 1, CFA fit indices based on a sample of 911 high school students supported the factor structure of the AMS measurement model. Although the GFI, AGFI, and NNFI were less than .90, the CFI, SRMR, and RMSEA were adequate. Study 2 was conducted in a sample of 303 high school students. However, the simplex correlation pattern among the AMS scales scores was only partially supported: IM to accomplish correlated more positively with introjected regulation than with identified regulation. Also, correlations among types of intrinsic motivation were moderate ranging between .35 and .66. Contrary to expectations, introjected regulation correlated positively with an adaptive criterion (i.e., enjoyment).
Taken together, these seven papers provided mixed evidence of construct validity for responses provided on the AMS. On the one hand, most studies supported the factor structure of the AMS measurement model, although some fit indices were not consistently high, according to some standards (Hu & Bentler, 1999). On the other hand, these studies did not fully support the convergent and divergent validity of the AMS scale scores. For instance, the simplex pattern was only partially supported across the studies. Specifically, in many studies IM correlated more positively with introjected regulation than with identified regulation. Moreover, in most studies, the introjection subscale correlated positively with numerous
THE ACADEMIC MOTIVATION SCALE 6
consequences, whereas SDT predicts that this correlation should be closer to 0 or negative. Also, in some studies the three types of intrinsic motivation (accomplishment, stimulation, knowledge; Carbonneau & Vallerand, 2012) are highly correlated, thereby raising the possibility that these constructs represent a single underlying dimension. This peculiar pattern of relations among the subscales and criterion variables has led some researchers to propose rewriting the AMS items or developing new ones to improve the construct validity of responses to the AMS (Fairchild, Horsta, Finneya, & Barron, 2005). However, before reaching this conclusion, we believe that it is important to test the AMS with new evolving application of ESEM that overcomes some limitation of EFAs and CFAs. Three reasons support this choice.
First, due to the numerous methodological advances associated with CFA, the general view implicit in psychometric research, before ESEM, was that EFA had been completely superseded by CFA and that EFA solutions that could not be replicated with CFA were of dubious validity. ESEM has simply brought EFA within the CFA/SEM family, making the advances typically associated with CFA available with EFA measurement models – including the assessment of fit and the use of ESEM/EFA for confirmatory purposes. Thus, although this research is in line with previous EFA ones, it could also allow to directly compare the ESEM and CFA solution and to conclude that the ESEM solution provides a much better representation of the data in terms of fit. In other words, this research could provide an explanation to the previously reported suboptimal degrees of fit to the data reported in CFA.
Second, given the theoretical simplex structure of the AMS responses through which motivation types slowly move from an autonomous extreme to an amotivated one, cross loadings are to be expected between adjacent factors. Cross loadings are also expected to get smaller, and eventually negative, for factors more clearly separated on the motivation continuum. To our knowledge, this is the first illustration of ESEM where the expected nature of the cross loadings is defined as part of the a priori expectations (in line with the simplex-like pattern).
Third, given that ESEM has been shown to provide more exact estimates of relations among latent factors (e.g., Asparouhov & Muthén, 2009; Marsh et al., 2009; Morin et al., 2013), it should also provide a more exact test of the expected simplex-like pattern of associations between the AMS factors. For example, it is possible that, with ESEM, the three types of intrinsic motivation will be less correlated with one another.
In sum, this research represents a contribution to existing knowledge in providing a rigorous test of the factor structure and construct validity of AMS scale scores with a relatively new statistical tool that seems naturally suited to this investigation. Goals and Hypotheses
The first objective of the present two studies conducted in college and high school students was to test the factor validity of the AMS responses through ESEM and comparing the obtained results to a CFA solution. Based on the extensive research evidence available in support for the underlying 7-factor structure of the AMS, we hereby rely on a confirmatory approach to ESEM based on the estimation of a 7-factor model and its comparison with an equivalent 7-factor CFA solution (e.g., Marsh et al., 2009; Morin et al., 2013). However, Appendix B illustrates the use of ESEM in a more exploratory manner– but we reinforce that this process should be reserved to exploratory applications (see above).
Our second objective was to verify the generalizability and measurement invariance of the resulting factor structure across meaningful subgroups of participants defined on the basis of their gender. In addition to representing a powerful test of generalizability of the results, this test also address the ability of the scale to be used in the context of gender-based comparisons. Previous studies have repeatedly found gender differences in motivation levels showing that females tend to present higher levels of types of intrinsic motivation, identified
THE ACADEMIC MOTIVATION SCALE 7
regulation, introjected regulation and lower levels of external regulation and amotivation than males (Grouzet, Otis, & Pelletier, 2006; Ratelle et al., 2007; Vallerand et al., 1997). However, no previous study has systematically investigated if this difference is due to gender bias in responses provided to the motivational measures, or to meaningful gender differences. The present study is one of the first to investigate the gender-based measurement invariance of responses to the full version of the AMS with ESEM. This is a promising avenue as in order to ensure the validity of any form of group-based comparisons, one must first demonstrate that the scale measures the same construct, in the same manner, across the compared subpopulations (Meredith, 1993; Millsap, 2011). More precisely, weak invariance (i.e., where only the factor loadings are constrained to invariance) assures that the instrument measures the same construct across subgroups. Strong invariance (i.e., where both the factor loadings and items’ thresholds are constrained to invariance) supports the interpretation that participants or subgroups with similar levels on the construct of interest will present comparable scores on the items forming the construct. Finally, strict invariance (i.e., where the factor loadings, items’ thresholds and items’ uniquenesses are constrained to invariance) demonstrate that the constructs are assessed with similar levels of measurement errors and precision in the various subgroups. Clearly, given that males and females have previously been shown to present different motivational tendencies, this verification is an important prerequisite to gender-based comparison relying on the AMS. In addition to these substantive contributions, this paper provides the first more “pedagogical” illustration of invariance testing involving ESEM in combination with the WLSMV estimator for categorical variables, including a series of sample inputs to help interested user to implement the same approach to their own research.
Our final objective is to examine the convergent and divergent validity of the AMS scale scores. To this end, we will first test the expected simplex correlations pattern among the AMS factors. Then, we will also verify the relations between the AMS factors and perceived academic competence as a criterion variable. According to SDT (Deci & Ryan, 2002), perceived competence should be: a) more positively correlated with the three types of intrinsic regulation than with identified regulations , b) more negatively correlated with amotivation than with external regulation, c) more negatively correlated with external regulation than with introjected regulation. We hypothesize that the simplex pattern of correlations as well as the pattern of correlation connecting the motivational constructs to perceived competence will be better supported with ESEM than with CFA.
In the method section we give sufficient details and instructions (see Appendixes A, B, and C for the Mplus input code, an exploratory approach to ESEM, and model specifications for the invariance testing sequence) for applied researchers who want to use ESEM to test some aspects of the construct validity of their instruments’ scores. However, we have tried to keep statistical issues as straightforward as possible. More theoretical and mathematical details on ESEM could be found in Asparohov and Muthén (2009), Marsh et al. (2009), and Morin et al. (2013).
Study 1 Participants, Procedure, and Measures
The data for Study 1 was obtained from two data sets including a total of 1416 French-Canadian college students (946 girls and 452 boys, 18 without gender identification; n= 582 in the first data set and n = 834 in the second data set). In Quebec’s education system, a college is a post-high school institution that offers pre-university (2-year) and technical terminal (3-year) programs. In both data sets, a well-trained research assistant administered the questionnaire in classroom. Both questionnaires took approximately 30 minutes to complete and no compensation was offered. More details on the first data set are found in Litalien and Guay (2010) and on the second set in Guay et al. (2003). Data sets were
THE ACADEMIC MOTIVATION SCALE 8
aggregated to have a higher ratio of participants by free parameters (4 participants by 1 free parameter) in the ESEM analysis. The Litalien et al. (2010) sample was collected in the fall semester of 2007 and the Guay et al. (2003) in the fall semester of 2000.
In order to test the discriminant validity of the AMS scale scores, we used the Perceived Competence Scale, developed in French by Losier, Vallerand, and Blais (1993). This instrument used a 7-point scale (1 -strongly disagree to 7-strongly agree) and included four items (e.g., “I have trouble doing my schoolwork properly” – reverse scoring; “As a student, I have developed very good competencies; I do not believe that I am a very talented student” – reverse scoring; “Overall, I think that I am a good student”). Losier et al. (1993) have shown that that scores on this scale present high internal consistency and acceptable test-retest reliability. Moreover, the factor validity of responses provided on this instrument has been supported as well as their convergent and divergent validity. In study 1, Cronbach alpha for scores for this measure was .83. Statistical Analysis
Estimation Method. All structural equation modeling analyses were performed on polychoric correlation matrices using Mplus (version 7.0; Muthén & Muthén, 2012) with the WLSMV estimator for categorical variables. This estimator estimates models with missing data (there were approximately 5% of missing responses in the present study) based on the full sample (n = 1416) and the full information that is available using pairwise present methods (see Asparouhov & Muthén, 2010).The choice to rely on WLSMV estimation is linked to the fact that this estimator is more suited to the ordered-categorical nature of Likert scales than traditional maximum likelihood estimation (Beauducel & Herzberg, 2006; Finney, & DiStefano, 2006; Lubke & Muthén, 2004).
CFA models were estimated according to the independent cluster model, with each item allowed to load on a single factor, and all seven factors allowed to correlate. ESEM models were estimated according to the specification provided in Asparouhov and Muthén (2009), with all rotated loadings freely estimated, subject to typical constraints imposed on the unrotated factor solution for identification purposes. Following Marsh et al. (2009, 2010; also see Morin & Maïano, 2011; Morin et al., 2013) we used an oblique Geomin rotation with an epsilon value of 0.5. The annotated input used for the ESEM analysis is presented in Appendix A. Based on the extensive research evidence available in support for the underlying 7-factor structure of the AMS, we thereby rely on a confirmatory approach to ESEM based on the estimation of a 7-factor model and its comparison with an equivalent 7-factor CFA solution (e.g., Marsh et al., 2009; Morin et al., 2013). Our goal in this paper is to illustrate the use of ESEM as a viable confirmatory alternative to CFA, based on strong theoretical assumptions regarding the expected factor structure.
Multigroup analyses. Invariance of the measurement model across gender was tested in the following sequence that was adjusted to the ordered-categorical nature of the items (see Meredith & Teresi, 2006; Morin et al., 2011): 1) configural invariance; 2) weak invariance; 3) strong invariance (invariance of the loadings and thresholds); 4) strict invariance (invariance of the loadings, thresholds and uniquenesses; 5) invariance of the variance/covariance matrix (invariance of the loadings, thresholds, uniquenesses, and variances-covariances); 6) latent mean invariance (invariance of the loadings, thresholds, uniquenesses, variances-covariances, and latent means). The models used for the full sequence of measurement invariance tests is fully described in Appendix C and annotated samples inputs are available upon request from the second author.
Goodness of fit. The fit of all models was evaluated using various indices as operationalized in Mplus 7.0 in conjunction with the WLSMV estimator (Hu, & Bentler, 1999; Yu, 2002). It is now broadly accepted that all a priori models are false and will be shown to be false when tested with a sufficiently large sample size. For this and other
THE ACADEMIC MOTIVATION SCALE 9
reasons, chi-square tests of exact fit are of little relevance for evaluation of goodness of fit for a single model and are even more problematic for the comparison of fit for two different models that requires additional assumptions that are unlikely to be met (e.g., Marsh, Balla & McDonald, 1988). Hence, in applied CFA/SEM research, there is a predominant focus on approximate fit indices that are sample size independent (e.g., Hu, & Bentler, 1999; Marsh, Hau, & Grayson, 2005; Marsh, Hau & Wen, 2004) such as the Comparative Fit Index (CFI), the Tucker-Lewis Index (TLI), and the Root Mean Square Error of Approximation (RMSEA). Values greater than .90 for CFI and TLI are considered to be indicative of adequate model fit, although values approaching .95 are preferable. Values smaller than .08 or .06 for the RMSEA support respectively acceptable and good model fit. Note that previous research has shown that traditional fit indices (TLI, CFI, RMSEA) perform well under WLSMV estimation (Beauducel & York Herzberg, 2006). It is important to note that with the WLSMV estimator, the chi-square values are not exact, but rather adjusted or "estimated" to obtain a correct p-value. This explains why χ² and CFI values can be non-monotonic with model complexity. For the CFI, improvement when constraints are added should thus be interpreted as random. This specificity is also important for the χ² difference tests, used to compare the nested models used across the sequence of measurement invariance tests, which need to be conducted via Mplus’ DIFFTEST function (MDDc2; Asparouhov, & Muthén, 2006). Because MDDc2 (like the c2 itself) tend to be oversensitive to sample size and to minor model misspecifications, it is recommended to use additional indices to complement chi-square difference tests when comparing nested models (Chen, 2007; Cheung, & Rensvold, 2002). A CFI diminution of .01 or less and a RMSEA augmentation of .015 or less between a model and the preceding model indicate that the invariance hypothesis should not be rejected.
Although we focus here on approximate fit indices, we recognize that our view is not universal in the statistical literature where debates regarding the relative usefulness of chi-square test of exact fit versus approximate fit indices have been ongoing for decades now (for additional details, see for instance the archives from the SEMNET statistical discussion list and the special issue of Personality and Individual Differences, 2007, Volume 42, that was entirely devoted to this debate). Results and discussion
First, as Marsh et al. (2009) recommended, we began with a CFA to verify the appropriateness of the a priori seven-factor structure underlying responses to the AMS (i.e., factor validity). If the analysis revealed adequate and similar fit indices for both ESEM and CFA models, then there would be less advantage in pursuing an ESEM analysis because the ESEM model is less parsimonious than the CFA model – although an ESEM model can still provide a more exact representation of the factor correlations (for a review, see Morin et al., 2013). The CFA results in CFI and TLI values (.948 and .940 respectively) within the acceptable range, but a RMSEA (0.081) at the limit of acceptability (see M1-1 in Table 2). Concerning convergent and divergent validity of the CFA results, some of the estimated correlations among motivation types are problematic (see correlations above the diagonal in Table 3). Correlations among the three types of intrinsic motivation are high (.68, .71, and .80) thereby bringing into question the capacity of the AMS to distinguish among them. Moreover, correlations between types of intrinsic motivation and introjected regulation (divergent correlations) are high (.40, .44, and .69) and are mostly equivalent to correlations between types of intrinsic motivation and identified regulation (convergent correlations). According to the simplex pattern, correlations between intrinsic motivations and introjected regulation should be lower than those between intrinsic motivations and identified regulation. These results call into question the convergent and divergent validity of the AMS factors’ scores. However, it should be noted that the pattern of CFA results is not completely uninformative: factor loadings are all substantial (ranging from .50 to .95, M = .80, SD =.11; see Table 4),
THE ACADEMIC MOTIVATION SCALE 10
and correlations between motivation types and perceived academic competence are moderate (|M| = .38; see Table 3).
For the ESEM model, the approximate fit indices all indicate good model fit (CFI=.989, TLI=.979, RMSEA=0.048) that are clearly superior to those obtained with the CFA (see M1-2 in Table 2). Even the RMSEA 90% confidence intervals confirm the superiority of the ESEM model, showing no overlap with values from the CFA model. Similarly, the ESEM solution was shown to provide significantly better fit than the alternative CFA model (MD∆χ² = 2006.772; df = 126; p ≤ .01). Moreover, most items load strongly on their respective factors (ranging from .26 to .96, M = .63, SD =.17), whereas most cross-loadings are weaker (-.16 to .42, |M| = .09; SD =.07 ; see Table 4). However, there are two exceptions to the general pattern: 1) the first item of intrinsic motivation to experience stimulation loads at .26 on its construct and at .29 on intrinsic motivation to accomplish; and 2) the second item of introjected regulation loads at .42 on its construct and at .42 on intrinsic motivation to accomplish. An examination of cross-loadings further reveals that they tend to be stronger between adjacent factors on the motivation continuum and negative cross-loadings tend to involve more distal factors on this continuum, such as the amotivation factor.
The estimated correlations among motivation types are much lower with ESEM than with CFA (see Table 3). For example, the correlation between IM to know and IM to accomplish is .46 with ESEM versus .80 with CFA. Moreover, the simplex correlation pattern is mostly supported with ESEM, but not with CFA. Specifically, with ESEM, correlations among adjacent motivation types (convergent correlations) on the self-determination continuum are stronger than correlations among distal motivation types (divergent correlations). More importantly, correlations between IM to know and IM to experience stimulation and introjected regulation are lower than correlations between these two IM types and identified regulation. However, note that the correlation between IM to accomplish and introjected regulation is equivalent (.39) to the correlation between IM to accomplish and identified regulation. Furthermore, correlations between motivation types and perceived academic competence are lower with ESEM than with CFA. Notably, the correlation between introjected regulation and perceived academic competence (divergent correlation) is .26 with CFA versus only .08 with ESEM, which is more consistent with theoretical expectations. As we said in the introduction, our goal in this paper is to illustrate the use of ESEM as a viable confirmatory alternative to CFA. However, Appendix B illustrates the use of ESEM in a more exploratory manner for researchers who might be interested to pursue this option.
Third, scale score reliability estimate were computed from the ESEM standardized parameter estimates, using McDonald’s (1970) ω = (Σ|λi|)² / ([Σ|λi|]² + Σδii) where λi are the standardized factor loadings and δii, the standardized item uniquenesses. Compared with traditional scale score reliability estimates (e.g., alpha; see Sijtsma, 2009), ω has the advantage of taking into account the strength of association between items and constructs (λi) as well as item-specific measurement errors (δii). Scale score reliability estimates ranged between .83 to .93, except for identified regulation for which the estimate was .62, which parallels Vallerand et al.’s (1989, 1992, and 1993) results.
Finally, we tested the complete measurement invariance of the ESEM measurement model across gender groups (see models M1-3 to M1-8 in Table 2). Interestingly, all of these increasingly restrictive models provided a satisfactory level of approximate fit to the data, with CFI and TLI>.95 and RMSEA<.06. Furthermore, changes in approximate fit indices remained low and thus suggested that the observed decrease in close fit was negligible, providing support for the weak, strong, strict, and latent variance-covariance invariance across gender. In many cases, the approximate fit indices incorporating a control for model parsimony (i.e. TLI and RMSEA) even improved when invariance constraints are added to
THE ACADEMIC MOTIVATION SCALE 11
the model; the more restricted model with strict invariance and invariance of the latent variance-covariance even shows a substantially higher degree of fit to the data than the baseline model (TLI=.995 versus .979 and RMSEA=.022). However, when equality constraints are placed on the latent means, the ΔRMSEA (.012) is close to the recommended cut-off of .015, the ΔCFI, ΔTLI are larger than in the other models, and the RMSEA 90% confidence intervals is significantly higher (in terms of showing no overlap) than the preceding model. Thus, we probed these differences. When males’ latent means are fixed to 0 for identification purposes, females’ latent means (expressed as differences in SD units from males’ means) are significantly higher on the IM to accomplish (M=.38; s.e.=.07; p<.01), introjected regulation (M=.20; s.e.=.06; p<.01), and identified regulation (M=.48; s.e.=.08; p<.01) factors, non-significantly different on the IM to know (M=.034; s.e.=.06; p>.05) and IM to to experience stimulation (M=.08; s.e.=.06; p>.05) factors, and significantly lower on the amotivation (M=-.39; s.e.=.07; p<.01) and external regulation (M=-.24; s.e.=.07; p<.01) factors.
Overall, the results of Study 1 suggest that ESEM provides better fit and more substantively meaningful correlation coefficients when compared to the CFA model estimates, and are fully invariant across genders. Furthermore, latent means differences observed between the factors across genders are in line with the results from previous studies reporting gender-based differences in terms of motivation factors. Overall, this study thus provides good support for construct validity of the AMS scale scores. Moreover, these results challenge Fairchild et al.’s (2005) contention that new AMS items need to be developed. However, all of these results needed to be corroborated in another sample of students in another educational situation. This was the goal of Study 2.
Study 2 Participants, Procedure, Measures, and Statistical Analysis
Participants in Study 2 were 4498 high school students (2262 boys, 2224 girls, 12 unspecified) living in Montreal, Quebec, Canada. The sample was collected in 1988–1989 during the fall semester. Mean age was 14.97 years and more than 96% of participants were French-speaking. They were recruited in class, and were asked to complete a questionnaire (part of these data are reported in Vallerand, Fortier, & Guay, 1997). Students completed an adapted version of the Perceived Competence Scale (Losier et al. , 1993) that comprised four items. In Study 2, however, Cronbach alpha for scores from this measure was .61, which is lower than the one observed in Study 1. The same analyses conducted in Study 1 were performed in Study 2. There were 8% of missing values in this study, and these were handled as in Study 1. Results and discussion
The CFA solution provides CFI, TLI and RMSEA values (.950, .942, and .068 respectively) that all indicate acceptable fit to the data (see model M2-1 in Table 2). However, some correlations among motivation types are problematic (see correlations above the diagonal in Table 3). First, estimated correlations among the three types of IM are high (.82, .84, and .85) which raises doubts about the capacity of the AMS to distinguish them. Second, the correlations between types of IM and introjected regulation (divergent ones) are higher (.71, .72, and .89) than correlations between types of IM and identified regulation (convergent ones; .53, .63, and .64). As in Study 1, the pattern of CFA results is not completely uninformative: all factor loadings are substantial (ranging from .43 to .91, M = .77, SD =.09; see Table 5), and correlations between motivation types and perceived academic competence are moderate (mean = .40; see Table 3).
As in Study 1, ESEM clearly provides significantly better fit to the data (MD∆χ² = 4263.987; df = 126; p ≤ .01; CFI=.989, TLI=.979, RMSEA=.041, and non-overlapping RMSEA 90% confidence interval) than CFA (see model M2-2 in Table 2). Most items load
THE ACADEMIC MOTIVATION SCALE 12
strongly on their respective factors (ranging from .33 to .87, M = .59, SD =.16), whereas cross-loadings are weaker (-.17 to .39, |M| = .07, SD =.07; see Table 5), except that the second item of IM to experience stimulation loads equivalently on its respective factor (.26) and on IM to accomplish (.27). Cross loadings tend to be stronger between adjacent factors on the SDT continuum and negative cross-loadings tend to involve more distal factors on this continuum. In this study, scale score reliability estimates (ω) were all satisfactory and ranged between .74 and .80 (see Table 3).
Estimated correlations among motivation types are much lower with ESEM than CFA (see Table 3). For example, the correlation between IM to know and IM to accomplish is .49 with ESEM versus .85 with CFA. Although correlations among motivation types are weaker with ESEM than with CFA, they do not fully support the simplex pattern. Specifically, all three correlations between IM types and introjected regulation (divergent ones) are higher than the correlations between the three IM types and identified regulation (convergent ones). Furthermore, correlations between motivation types and perceived academic competence are lower with ESEM than with CFA. Notably, the correlation between introjected regulation and perceived academic competence is .39 with CFA versus only .15 with ESEM. However, we have to be careful in our interpretation of these results because the reliability of scores on the perceived competence measure is somewhat low. As in Study 1, Appendix B illustrates the use of ESEM in a more exploratory manner for researchers who might be interested to pursue this option.
Finally, the final retained ESEM measurement model for responses to the AMS again proved to be completely invariant across gender groups in terms of approximate fit indices (see models M2-3 to M2-8 in the lower section of Table 5). As it was the case for study 1, all of the increasingly restrictive models provided a satisfactory level of approximate fit to the data, and the fit indices incorporating a control for model parsimony improved when invariance constraints were added to the model (TLI=.996 versus .979 and RMSEA=.017 versus .041). Finally, as in Study 1, when equality constraints are placed on the latent means, the ΔCFI (.010) and ΔRMSEA (.015) corresponds to the recommended cut-off, the ΔTLI is larger than in the other models, and the RMSEA 90% confidence intervals is significantly higher (in terms of showing no overlap) than the preceding model. The observed latent mean differences also closely parallel those from the previous study. When males’ latent means are fixed to 0 for identification purposes, females’ latent means (in SD units) are significantly higher on the IM to accomplish (M=.149; s.e.=.035; p<.01), IM to know (M=.173; s.e.=.034; p<.01), IM to experience stimulation (M=.331; s.e.=.034; p<.01), identified regulation (M=.324; s.e.=.040; p<.01), and introjected regulation (M=.329; s.e.=.035; p<.01) factors, and significantly lower on the amotivation (M=-.363; s.e.=.036; p<.01) and external regulation (M=-.298; s.e.=.037; p<.01) factors.
The data of Study 2 were collected approximately 25 years ago, so it is possible that results of this study would differ from those that we would have obtained if we had conducted this study today. This could have relevant implications when interpreting the findings, especially when we compare results of study 1 and study 2 stemming from samples that have been collected at different epochs. However, study 2 provides an interesting and seldom test of the generalizability of the AMS factor across time.
Study 2 confirms the results from Study 1 and provides support for the factor validity of the AMS responses and for the invariance of the AMS measurement model across gender. The observation of an equivalent factor structure across these studies thus confirm that the AMS factor structure is robust and taps into crucial motivational processes that are unaffected by the passage of time – at least for a period covering the past 25 years. However, the convergent and divergent validity of the AMS factors is not fully supported. Correlations among the motivation subscales using both CFA and ESEM challenge the simplex pattern of
THE ACADEMIC MOTIVATION SCALE 13
relations proposed by SDT. Nevertheless, most convergent and divergent correlations between motivation types and perceived academic competence are in line with the self-determination continuum. Similarly, the pattern of observed latent means differences according to gender are also in line with the results from previous studies and confirm the results from Study 1, supporting the discriminant validity of the AMS responses. Although Study 1 suggested that two of the AMS items may deserve special attention, these items performed adequately in the present study, which rather suggest that the second item from the IM to experience stimulation subscale may possibly require attention. Further exploration of these results suggest that rotational indeterminacy could explain this specific pattern of results and that future studies should devote attention to the three items identified here.
General discussion In this two-study investigation, we used ESEM to test the construct validity of the
AMS scale scores. As argued in the introduction, by estimating all cross-loadings between indicators and latent constructs, ESEM allowed us to overcome the limitations of CFA in terms of overestimated correlations among latent constructs. The two studies, conducted in college and high school students, show higher fit indices with ESEM than with CFA. With ESEM, cross-loadings between intrinsic motivation (IM) and extrinsic motivation (EM) indicators and amotivation constructs were consistent with theoretical expectations. Moreover, estimated divergent and convergent correlations among AMS factors were lower with ESEM than with CFA. Although results were not identical across the two studies, most correlations were in line with theoretical expectations when using ESEM, but less so when using CFA. Furthermore, estimated correlations between AMS factors and perceived academic competence were much lower with ESEM than with CFA. Most importantly, these results are in line with those from previous ESEM studies in showing the importance of routinely comparing ESEM and CFA solutions, not only in terms of fit, but also in terms of parameter estimates (Marsh et al., 2011; Morin et al., 2013). In the present study, without the ESEM comparison, the results would have led us to retain the CFA solution, which provide an acceptable level of fit to the data, thus missing the improved fit of the ESEM solution, but also the greater degree of theoretical conformity of the ESEM model. Factor validity
In both studies, many cross-loadings were positive, especially between adjacent factors on the motivation continuum proposed by SDT (Deci & Ryan, 2002). Despite these cross-loadings, each item appeared to measure the construct that it was supposed to measure in line with traditional definitions of simple structure in which non-target loadings are ideally small relative to target loadings but not required to be zero (e.g. Thurstone, 1947). For example, most indicators of intrinsic motivation loaded more on their respective construct than on identified regulation, introjected regulation, external regulation, or amotivation. In the two studies, we noted only three exceptions to this general pattern. Two items of intrinsic motivation to experience stimulation loaded equivalently on their construct and on intrinsic motivation to accomplish, and one item of introjected regulation loaded equivalently on its construct and on intrinsic motivation to accomplish. Future research should verify whether this pattern of results is reproduced.
It is also noteworthy that the cross-loadings between the intrinsic motivation indicators and introjection were relatively weak, although with CFA, correlations between the three types of intrinsic motivation and introjected regulation were high. This last result means that items designed to measure intrinsic motivations differ from items that measure introjection, and removing the small common portion of variance between these indicators (for intrinsic motivation and introjected regulation) leads to lower correlations among these constructs when using ESEM. Taken together, the ESEM results corroborate the factor validity of the AMS responses.
THE ACADEMIC MOTIVATION SCALE 14
Gender differences Interestingly, our results fully support the complete measurement invariance of the ESEM measurement model across genders. This result supports the generalizability of the ESEM factor structure of the AMS responses across meaningful subgroups of participants, but also supports the use of the AMS in studies of gender differences. Furthermore, our results showed consistent gender-based mean differences across both studies that replicated the results from previous studies regarding gender differences in motivation factors (Grouzet, Otis, & Pelletier, 2006; Ratelle et al., 2007; Vallerand et al., 1997). Specifically, findings from both studies indicate that, when compared to men, women tend to be more intrinsically motivated by accomplishment, more regulated by identification and introjection, but less amotivated and regulated by external sources of control. However, some gender differences were not corroborated across studies which could be attributable to the fact that participants of study 2 were recruited approximately 25 years ago (the 1988-1989 school year). Specifically, Study 1 indicates that, in college, women comparatively to men are more intrinsically motivated by stimulation and knowledge, but such differences were not corroborated in Study 2 characterized by a high school population. Future studies are needed to better understand these differences, especially to verify if these differences are attributable to the different epochs of data collection. Convergent and divergent validity
SDT proposes that relations among motivational constructs will follow a simplex pattern. For example, types of intrinsic motivation should correlate more strongly with identified regulation than with introjection, whereas external regulation should correlate more strongly with introjected regulation than with identified regulation. Most previous studies on the AMS did not reproduce this pattern (see Table 1). Specifically, intrinsic motivations correlated more positively with introjection than with identified regulation. The results from Study 1, using CFA, were in line with these previous findings. However, the results using ESEM showed that intrinsic motivation types correlated less positively with introjection than with identified regulation (except for IM to accomplish). In Study 2, results using CFA also corroborated the high correlations found in Study 1 between IM types and introjection. However, in Study 2, the ESEM model did not fully corroborate the expected simplex correlation pattern. Although the ESEM correlations were much lower between IM types and introjected regulation, they were nevertheless higher than those observed between IM types and identified regulation. How can we explain these divergent results between Study 1 and Study 2, given that the high school and college students responded to the identical items?
There are several possible explanations for this difference, including sample size, students’ characteristics (e.g., socioeconomic background), cognitive maturation, age, and the different periods of the data collection. However, one striking difference between the two samples relates to the educational context. The students in Study 1 were in college, whereas the students in Study 2 were in high school. High school students are usually under heavy pressure (social comparisons, standardized testing, and disciplinary sanctions). We therefore propose that high school teachers that promote intrinsic and identified regulation would also use control. Accordingly, many students report that they like and value high school activities, but that they also perform these activities for introjected and external reasons (Ratelle et al., 2007). However, college students have many more opportunities to make choices (e.g., program, schedule). Therefore, we speculated that in college, support for autonomous motivations (intrinsic and identified regulation) would supplant control, leading to more differentiated motivations. To lend credence for this idea, it would be useful to conduct a study with similar students attending different educational contexts. For example, a group of high school students attending an alternative school, where support for autonomous motivations is more salient, could be compared to a group attending a regular school, where
THE ACADEMIC MOTIVATION SCALE 15
both support and control are salient. Another contribution of this study relates to the tripartite model of intrinsic
motivation (Carbonneau & Vallerand, 2012). According to this model, IM is subdivided into three components reflecting motivation to know, to experience stimulation, and to accomplish. Studies that tested the relations among these three types of IM have typically found very high correlations, which brings their distinctiveness into question. In the present investigation, both studies showed moderate ESEM correlations (ranging from .36 to .49) and very high CFA correlations (˃.68). Based on ESEM, we argue that these three types of IM measure different conceptual properties (see also Carbonneau & Vallerand, 2012).
The convergent and divergent validity of the AMS responses was also supported by the correlations between motivation types and perceived academic competence. As expected, both studies showed higher correlations between motivation types and perceived academic competence with CFA than with ESEM. Furthermore, ESEM correlations were in line with the self-determination continuum. Specifically, autonomous forms of motivation (intrinsic motivations and identified regulation) were more positively associated with perceived academic competence compared to controlled forms of extrinsic motivation (introjected and external). Moreover, amotivation was negatively associated with perceived academic competence. Interestingly, in both studies, correlations between introjected regulation and perceived academic competence were higher with CFA than with ESEM (.26 vs. .08 and .39 vs. .12, respectively). These CFA results are inconsistent with SDT, which posits that introjection is a less suitable energy source. Nevertheless, they are consistent with past studies showing that introjected regulation is moderately associated with motivational outcomes (interest, concentration, emotions, mastery goals; see Table 1). However, the ESEM results showed a modest relation between perceived academic competence and introjected regulation, again pointing to the need to use ESEM to analyze the AMS. Limitations and conclusion
The two studies presented here have some limitations. First, the convergent and divergent validity of the AMS scales scores was established via perceived academic competence alone. It would be useful in future research to measure other relevant constructs, such as academic achievement, learning strategies, and emotions. Second, construct validity could be more stringently tested via a multitrait-multimethod (MTMM) approach. For instance, a longitudinal design could be used, with motivation types as the multiple traits and measurement times as the multiple methods (e.g., Guay, 2005). Third, the validity of the AMS responses needs to be tested using ESEM in more diverse samples (elementary school students, university students) to corroborate the present results. Fourth, because we did not gather data on school neither on classroom, it was impossible to control for the nested aspect of these data, which may have resulted in slightly biased standard error estimates. Fifth, for the sake of parsimony we did not perform any formal statistical tests to verify if the differences in observed latent factor correlations significantly differed according to the expected simplex pattern (7 factors correlated together = 21 pairwise comparisons X 2 studies). We felt that for the purpose of verifying whether the expected simplex pattern provided a good explanation of the results, a descriptive comparison of the correlations is sufficient. However, future statistical studies should devote attention to develop a more straightforward manner of testing this pattern. Finally, the data of Study 2 were collected 25 years ago, so one may argue that the results are not perfectly applicable to a similar population today. However, it should be noted that results of the most recent studies on SDT corroborate those obtained 25 years ago (Ryan & Deci, 2009).
This investigation showed that the ESEM method is effective for testing the construct validity of the AMS responses (factor validity, convergent and divergent validity, reliability). The versatility of this new statistical tool means that it could be used to test a
THE ACADEMIC MOTIVATION SCALE 16
variety of research issues (Marsh et al., 2009). We thus encourage researchers to use it to test their research hypotheses.
References Abou-Shouk, M., Megicks, P., & Lim, W.M. (2012). Perceived benefits and e-commerce
adoption by SME travel agents in developing countries: Evidence from Egypt. Journal of Hospitality & Tourism Research. Online first, doi:10.1177/1096348012442544
Allen, N.P., Lonigan, C.J., & Wilson, S.B. (2013). Psychometric evaluation of the children’s behavior questionnaire-very short from in preschool children using parent and teacher report. Early Childhood Research Quarterly, 28, 302-313.
Anderson, S.A., Sanderson, J., & Kosutic, I. (2011). Therapist use-of-self orientations questionnaire: A reliability and validity study. Contemporary Family Therapy, 33, 364-383.
Appel, M., Gnambs, T., & Maio, G.R. (2012). A Short measure of the need for affect. Journal of Personality Assessment, 94, 418-426.
Asparouhov, T., Muthén, B.O. (2006). Robust chi-square difference testing with mean and variance adjusted test statistics. Los Angeles, CA: Muthén & Muthén; www.statmodel.com/examples/webnote.shtml#web10.
Asparouhov, T., & Muthén, B. (2009). Exploratory structural equation modeling. Structural Equation Modeling, 16, 397–438.
Barkoukis, V., Tsorbatzoudis, H., Grouios, G., & Sideridis, G. (2008). The assessment of intrinsic and extrinsic motivation and amotivation: Validity and reliability of the Greek version of the Academic Motivation Scale. Assessment in Education: Principles, Policy & Practice, 15, 39-55.
Beauducel, A., & Yorck Herzberg, P. (2006). On the performance of maximum likelihood versus means and variance adjusted weighted least squares estimation in CFA. Structural Equation Modeling 13, 186-203.
Blanchard, S., Vrignaud, P., Lallemand, N., Dosnon, O., & Wach, M. (1997). Validation de l’échelle de motivation en éducation auprès de lycéens français. L’orientation scolaire et professionnelle, 26, 33-56.
Bollen, K.A. (1989). Structural Equations with Latent Variables. New York, NY: Wiley. Carbonneau, N., & Vallerand, R.J. (2012). Toward a tripartite model of intrinsic motivation.
Journal of Personality, 80, 1147-1178. Chen, F.F. (2007). Sensitivity of goodness of fit indexes to lack of measurement invariance.
Structural Equation Modeling, 14, 464-504. Cheung, G. W., & Rensvold, R.B. (2002). Evaluating goodness-of fit indexes for testing
measurement invariance. Structural Equation Modeling, 9, 233-55. Cokley, K. O., Bernard, N., Cunningham, D., & Motoike, J. (2001). A psychometric
investigation of the academic motivation scale using a United States sample. Measurement and Evaluation in Counseling and Development, 34, 109-119.
Deci, E. L., & Ryan, R. M. (1985). Intrinsic motivation and self-determination in human behavior. New York, NY: Plenum.
Deci, E. L., & Ryan, R. M. (2002). Handbook of self-determination research. Rochester, NY: University of Rochester Press.
Fabrigar, L. R., Wegener, D. T., MacCallum, R. C., & Strahan, E. J. (1999). Evaluating the use of exploratory factor analysis in psychological research. Psychological Methods, 4, 272-299.
Fairchild, A. J., Horsta, S. J., Finneya, S. J., & Barron, K. E. (2005). Evaluating existing and new validity evidence for the Academic Motivation Scale Contemporary Educational Psychology, 30, 331-358.
Finney, S. J., & DiStefano, C. G., CO: IAP. (2006). Non-normal and categorical data in
THE ACADEMIC MOTIVATION SCALE 17
structural equation modeling. In G. R. Hancock & R. O. Mueller (Eds.), Structural equation modeling: A decond course (pp. 269-314). Greenwich,CT: IAP.
Glorfeld, L. W. (1995). An Improvement on Horn’s Parallel Analysis Methodology for Selecting the Correct Number of Factors to Retain. Educational and Psychological Measurement, 55, 377-393.
Grouzet, F. M. E., Otis, N., & Pelletier, L. G. (2006). Longitudinal cross-gender factorial invariance of the Academic Motivation Scale. Structural Equation Modeling, 13, 73-98.
Guay, F. (2005). Motivations underlying career decision-making activities: The career decision-making autonomy scale (CDMAS). Journal of Career Assessment, 13, 77-97.
Guay, F., Senécal, C., Gauthier, L., & Fernet, C. (2003). Predicting career indecision: A self-determination theory perspective. Journal of Counseling Psychology, 50, 165-177.
Hancock G.R., & Mueller R.O. (2006). Structural Equation Modeling: A Second Course. Greenwich, CT: Information Age Publishing, Inc.
Hayashi, K., Bentler, P. M., & Yuan, K. (2007). On the likelihood ratio test for the number of factors in exploratory factor analysis. Structural Equation Modeling, 14, 505-526.doi:10.1080/10705510701301891
Hayton, J. C., Allen, D. G., & Scarpello, V. (2004). Factor retention decisions in exploratory factor analysis: A tutorial on parallel analysis. Organizational Research Methods, 7, 191-205.
Henson, R. K., & Roberts, J. K. (2006). Use of exploratory factor analysis in published research: Common errors and some comment on improved practice. Educational and Psychological Measurement, 66, 393-416.
Horn, J. L. (1965). A rationale and test for the number of factors in factor analysis. Psychometrika, 30, 179-185.
Hu, L., & Bentler, P. M. (1999). Cutoff criteria for fit indexes in covariance structure analysis: Conventional criteria versus new alternatives. Structural Equation Modeling, 6, 1-55.
Kahn, J. H. (2006). Factor analysis in counseling psychology research, training, and practice: Principles, advances, and applications. The Counseling Psychologist, 34, 684-718.
Litalien, D. & Guay, F. (2010). Validation d’un modèle motivationnel des aspirations professionnelles. Revue Canadienne de l’Education. 33, 732-760.
Losier, G. F., Vallerand, R. J., & Blais, M. R. (1993). Construction et validation de l'Échelle des Perceptions de Compétence dans les Domaines de Vie (EPCDV). Science et Comportement, 23, 1-16.
Lubke, G.H., & Muthén, B.O (2004). Applying multigroup confirmatory factor models for continuous outcomes to Likert scale data complicates meaningful group comparisons. Structural Equation Modeling, 11, 514-534.
Maïano, C., Morin, A.J.S., Lafranchi, M.-C., & Therme, P. (2013). The Eating Attitudes Test-26 Revisited using Exploratory Structural Equation Modeling. Journal of Abnormal Child Psychology, 41, 775-788
Marsh, H. W., Balla, J. R., & McDonald, R. P. (1988). Goodness-of fit indices in confirmatory factor analysis: The effect of sample size. Psychological Bulletin, 102, 391– 410. doi:10.1037/0033-2909.103.3.391
Marsh, H. W., Hau, K., & Grayson, D. (2005). Goodness of Fit in Structural Equation Models. In Maydeu-Olivares, Albert (Ed); McArdle, John J. (Ed), Contemporary psychometrics: A festschrift for Roderick P. McDonald. (pp. 275-340). Mahwah, NJ, US: Lawrence Erlbaum Associates Publishers.
Marsh, H. W., Hau, K.-T., & Wen, Z. (2004). In search of golden rules: Comment on hypothesis-testing approaches to setting cutoff values for fit indexes and dangers in overgeneralizing Hu and Bentler’s (1999) findings. Structural Equation Modeling, 11,

THE ACADEMIC MOTIVATION SCALE 18
320-341. doi:10.1207/s15328007sem1103_2 Marsh, H. W., Liem, G. A. D., Martin, A. J., Morin, A. J. S., & Nagengast, B. (2011).
Methodological-measurement fruitfulness of exploratory structural equation modeling (ESEM): New approaches to key substantive issues in motivation and engagement. Journal of Psychoeducational Assessment, 29, 322-346
Marsh, H.W., Muthén, B., Asparouhov, T., Lüdtke, O., Robitzsch, A., Morin, A.J.S., & Trautwein, U. (2009). Exploratory structural equation modeling, integrating CFA and EFA: Application to students’ evaluations of university teaching. Structural Equation Modeling, 16, 439-476.
Marsh, H. W., Nagengast, B., Morin, A. J. S., Parada, R. H., Craven, R. G., & Hamilton, L. R. (2011). Construct validity of the multidimensional structure of bullying and victimization: An application of exploratory structural equation modeling. Journal of Educational Psychology, 103, 701-732.
Meredith W. (1993). Measurement invariance, factor analysis and factorial invariance. Psychometrika, 58, 525-43.
Millsap, R.E. (2011). Statistical approaches to measurement invariance. NY: Taylor & Francis.
Millsap, R.E., & Tein, J.-Y. (2004). Assessing factorial invariance in ordered-categorical measures. Multivariate Behavioral Research, 39, 479-515.
Morin A. J. S., & Maïano C. (2011). Cross-validation of the short form of the physical self-inventory (PSI-18) using exploratory structural equation modeling (ESEM). Psychology of Sport and Exercise, 12, 540-554.
Morin, A. J. S., Marsh, H. W., & Nagengast, B. (2013, in press). Exploratory structural equation modeling. In Hancock, G. R. & Mueller, R. O. (Eds.), Structural equation modeling: A second course, 2nd ed. (pp. 395-436). Charlotte, NC: IAP.
Morin, A. J. S., Moullec, G., Maïano, C., Layet, L., Just. J.-L., & Ninot, G. (2011). Psychometric properties of the Center for epidemiologic studies depression scale (CES-D) in French clinical and non-clinical adults. Epidemiology and Public Health, 59, 327-340.
Muthén, L. K., & Muthén, B. O. (2012). Mplus user’s guide (7th Ed.). Los Angeles, CA: Muthén & Muthén.
Myers, N.D., Chase, M.A., Pierce, S.W., & Martin, E. (2011). Coaching efficacy and exploratory structural equation modeling: A substantive-methodological synergy. Journal of Sport & Exercise Psychology, 33, 779-806.
Osborne, J.W., & Costello, A.B. (2004). Sample size and subject to item ratio in principal components analysis. Practical Assessment, Research & Evaluation, 9, online publication retrieved Retrieved July 30, 2013.
Pintrich, P. R. (2003). A motivational science perspective on the role of student motivation in learning and teaching contexts. Journal of Educational Psychology, 95, 667-686.
R Development Core Team. (2013). R: A language and environment for statistical computing.
Vienna, Austria: R Foundation for Statistical Computing.Ratelle, C.F., Guay, F., Vallerand, R.J., Larose, S., & Senécal, C. (2007). Autonomous, controlled, and amotivated types of academic motivation: A person-oriented analysis. Journal of Educational Psychology, 99, 734-746.
Revelle, W. (2013). Psych: Procedures for psychological, psychometric, and personality research. Rpackage version 1.2.12. Retrieved from http://personality-project.org/r/psych.manual.pdf
Ryan, R. M., & Connell, J. P. (1989). Perceived locus of causality and internalization: Examining reasons for acting in two domains. Journal of Personality and Social Psychology, 57, 749-761.
THE ACADEMIC MOTIVATION SCALE 19
Schumacker, R.E., & Lomax, R.G. (2010). A beginner’s guide to structural equation modeling, third edition. New York, NY: Routledge.
Thurstone, L. L. (1947). Multiple factor analysis. Chicago: University of Chicago. Vallerand, R.J. (1989). Vers une méthodologie de validation trans-culturelle de
questionnaires psychologiques : Implications pour la recherche en langue française. Psychologie canadienne, 30, 662-678.
Vallerand, R. J., & Bissonnette, R. (1992). Intrinsic, extrinsic, and amotivational styles as predictors of behavior: A prospective study. Journal of Personality, 60, 599-620.
Vallerand, R. J., Blais, M. R., Briere, N. M., & Pelletier, L. G. (1989). Construction et validation de l'Échelle de motivation en éducation (EME). Canadian Journal of Behavioural Science, 21, 323-349.
Vallerand, R. J., Fortier, M. S., & Guay, F. (1997). Self-determination and persistence in a real-life setting: Toward a motivational model of high school dropout. Journal of Personality and Social Psychology, 72, 1161-1176.
Vallerand, R. J., Pelletier, L. G., Blais, M. R., Briere, N. M., Sénécal, C., & E. F., Vallières. (1993). On the assessment of intrinsic, extrinsic, and amotivation in education: Evidence on the concurrent and construct validity of the Academic Motivation Scale. Educational and Psychological Measurement, 53, 159-172.
Yu, C. Y. (2002). Evaluating cutoff criteria of model fit indices for latent variable models with binary and continuous outcomes. Los Angeles, CA: University of California.
Zwick, W.R., & Velicer, W.F. (1982). Factors influencing four rules for determining the number of components to retain. Multivariate Behavioral Research, 17, 253-269.
Zwick, W. R., & Velicer, W. F. (1986). Comparison of five rules for determining the number of components to retain. Psychological Bulletin, 99, 432-442.
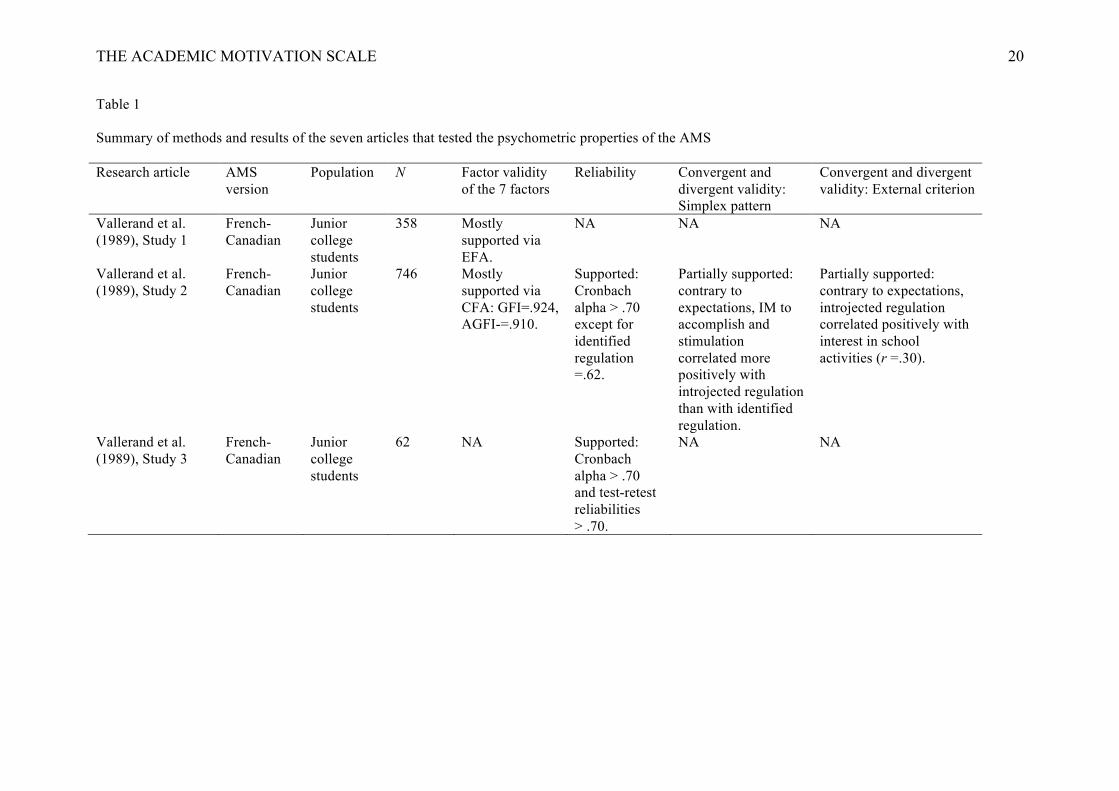
THE ACADEMIC MOTIVATION SCALE 20
Table 1
Summary of methods and results of the seven articles that tested the psychometric properties of the AMS
Research article AMS version
Population N Factor validity of the 7 factors
Reliability Convergent and divergent validity: Simplex pattern
Convergent and divergent validity: External criterion
Vallerand et al. (1989), Study 1
French-Canadian
Junior college students
358 Mostly supported via EFA.
NA NA NA
Vallerand et al. (1989), Study 2
French-Canadian
Junior college students
746 Mostly supported via CFA: GFI=.924, AGFI-=.910.
Supported: Cronbach alpha > .70 except for identified regulation =.62.
Partially supported: contrary to expectations, IM to accomplish and stimulation correlated more positively with introjected regulation than with identified regulation.
Partially supported: contrary to expectations, introjected regulation correlated positively with interest in school activities (r =.30).
Vallerand et al. (1989), Study 3
French-Canadian
Junior college students
62 NA Supported: Cronbach alpha > .70 and test-retest reliabilities ˃ .70.
NA NA

THE ACADEMIC MOTIVATION SCALE 21
Table 1 (continued)
Research article AMS version
Population N Factor validity of the 7 factors’ scores
Reliability Convergent and divergent validity: Simplex pattern
Convergent and divergent validity: External criterion
Vallerand et al. (1992)
English University students
Sample 1=745, Sample 2= 57
Partially supported via CFA: GFI=.89, AGFI-=.87, NFI=.89.
Supported: Cronbach alpha > .70 (except for identified regulation in Sample 1= .62) and test-retest reliabilities ˃ .70.
NA NA
Vallerand et al. (1993)
French-Canadian
Junior college students
217 NA Supported: Cronbach alpha > .70, except for identified regulation = .60.
Partially supported: contrary to expectations, IM to accomplish and stimulation correlated more positively with introjected regulation than with identified regulation.
Partially supported: contrary to expectations, introjected regulation correlated positively with intrinsic interest, task orientation, concentration, and positive emotions.
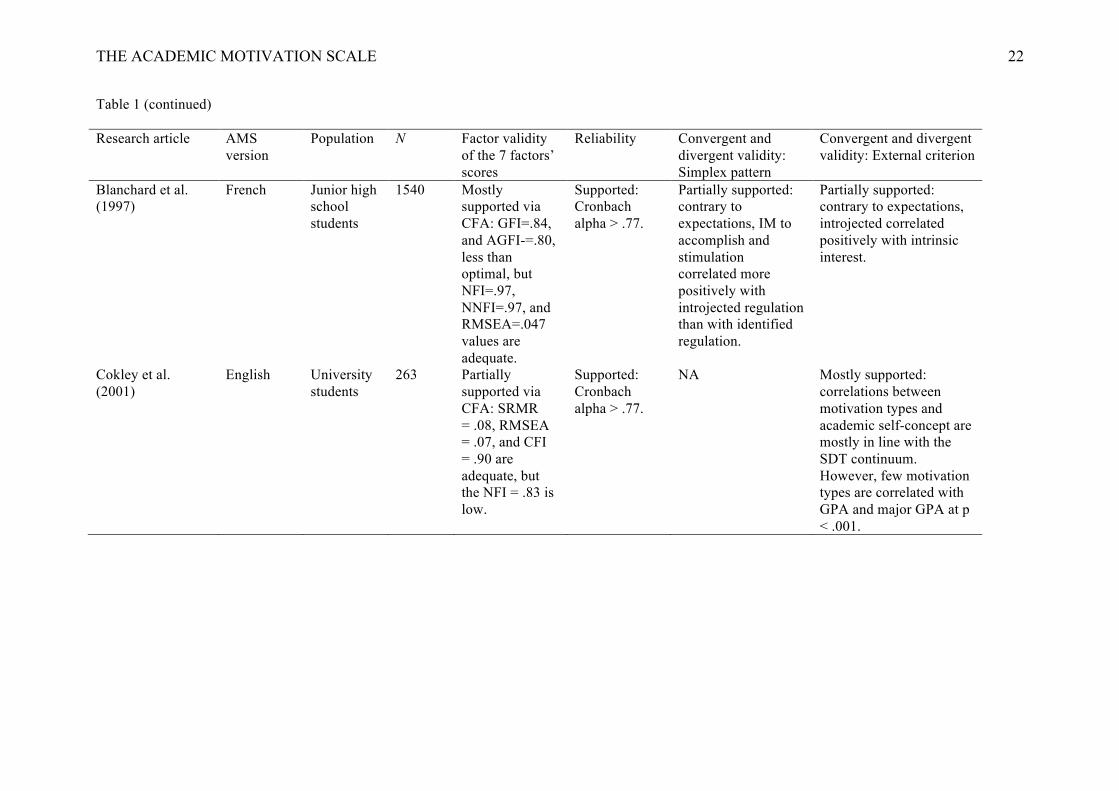
THE ACADEMIC MOTIVATION SCALE 22
Table 1 (continued) Research article AMS
version Population N Factor validity
of the 7 factors’ scores
Reliability Convergent and divergent validity: Simplex pattern
Convergent and divergent validity: External criterion
Blanchard et al. (1997)
French Junior high school students
1540 Mostly supported via CFA: GFI=.84, and AGFI-=.80, less than optimal, but NFI=.97, NNFI=.97, and RMSEA=.047 values are adequate.
Supported: Cronbach alpha > .77.
Partially supported: contrary to expectations, IM to accomplish and stimulation correlated more positively with introjected regulation than with identified regulation.
Partially supported: contrary to expectations, introjected correlated positively with intrinsic interest.
Cokley et al. (2001)
English University students
263 Partially supported via CFA: SRMR = .08, RMSEA = .07, and CFI = .90 are adequate, but the NFI = .83 is low.
Supported: Cronbach alpha > .77.
NA Mostly supported: correlations between motivation types and academic self-concept are mostly in line with the SDT continuum. However, few motivation types are correlated with GPA and major GPA at p < .001.

THE ACADEMIC MOTIVATION SCALE 23
Table 1 (continued) Research article AMS
version Population N Factor validity
of the 7 factors’ scores
Reliability Convergent and divergent validity: Simplex pattern
Convergent and divergent validity: External criterion
Fairchild et al. (2005)
English College students
1406 Supported via CFA: Robust CFI = .967, Robust RMSEA = .055.
Supported: Cronbach alpha > .77
Partially supported: Contrary to expectations, the three IM types correlated more positively with introjected regulation than with identified regulation
Partially supported: Contrary to expectations, introjected correlated positively with mastery approach goals.
Barkoukis et al. (2008)-Study 1
Greek High school students
911 Mostly supported via CFA: SRMR = .06, RMSEA = .06, and CFI = .91, GFI=.89, AGFI=.87, CFI=.91, NNFI=.897
Supported: Cronbach alpha > .70 (except for IM to experience stimulation = .60) and test-retest reliabilities ˃ .70
NA NA
Barkoukis et al. (2008)-Study 2
Greek High school students
303 NA Supported: Cronbach alpha > .70 (except for IM to experience stimulation = .63)
Partially supported: Contrary to expectations, IM to accomplish correlated more positively with introjected regulation than with identified regulation.
Partially supported: Contrary to expectations, introjected regulation correlated positively with enjoyment.
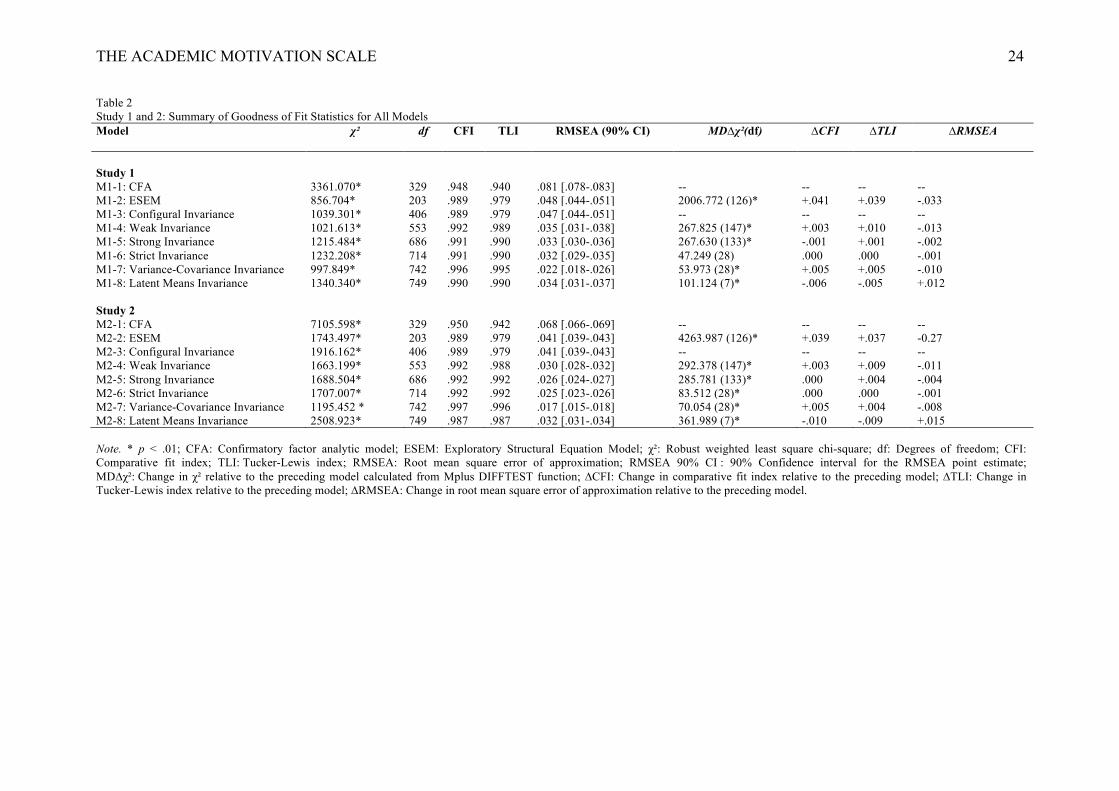
THE ACADEMIC MOTIVATION SCALE 24
Table 2 Study 1 and 2: Summary of Goodness of Fit Statistics for All Models Model χ² df CFI TLI RMSEA (90% CI) MD∆χ²(df) ∆CFI ∆TLI ∆RMSEA Study 1 M1-1: CFA 3361.070* 329 .948 .940 .081 [.078-.083] -- -- -- -- M1-2: ESEM 856.704* 203 .989 .979 .048 [.044-.051] 2006.772 (126)* +.041 +.039 -.033 M1-3: Configural Invariance 1039.301* 406 .989 .979 .047 [.044-.051] -- -- -- -- M1-4: Weak Invariance 1021.613* 553 .992 .989 .035 [.031-.038] 267.825 (147)* +.003 +.010 -.013 M1-5: Strong Invariance 1215.484* 686 .991 .990 .033 [.030-.036] 267.630 (133)* -.001 +.001 -.002 M1-6: Strict Invariance 1232.208* 714 .991 .990 .032 [.029-.035] 47.249 (28) .000 .000 -.001 M1-7: Variance-Covariance Invariance 997.849* 742 .996 .995 .022 [.018-.026] 53.973 (28)* +.005 +.005 -.010 M1-8: Latent Means Invariance 1340.340* 749 .990 .990 .034 [.031-.037] 101.124 (7)* -.006 -.005 +.012 Study 2 M2-1: CFA 7105.598* 329 .950 .942 .068 [.066-.069] -- -- -- -- M2-2: ESEM 1743.497* 203 .989 .979 .041 [.039-.043] 4263.987 (126)* +.039 +.037 -0.27 M2-3: Configural Invariance 1916.162* 406 .989 .979 .041 [.039-.043] -- -- -- -- M2-4: Weak Invariance 1663.199* 553 .992 .988 .030 [.028-.032] 292.378 (147)* +.003 +.009 -.011 M2-5: Strong Invariance 1688.504* 686 .992 .992 .026 [.024-.027] 285.781 (133)* .000 +.004 -.004 M2-6: Strict Invariance 1707.007* 714 .992 .992 .025 [.023-.026] 83.512 (28)* .000 .000 -.001 M2-7: Variance-Covariance Invariance 1195.452 * 742 .997 .996 .017 [.015-.018] 70.054 (28)* +.005 +.004 -.008 M2-8: Latent Means Invariance 2508.923* 749 .987 .987 .032 [.031-.034] 361.989 (7)* -.010 -.009 +.015 Note. * p < .01; CFA: Confirmatory factor analytic model; ESEM: Exploratory Structural Equation Model; χ²: Robust weighted least square chi-square; df: Degrees of freedom; CFI: Comparative fit index; TLI: Tucker-Lewis index; RMSEA: Root mean square error of approximation; RMSEA 90% CI : 90% Confidence interval for the RMSEA point estimate; MD∆χ²: Change in χ² relative to the preceding model calculated from Mplus DIFFTEST function; ∆CFI: Change in comparative fit index relative to the preceding model; ∆TLI: Change in Tucker-Lewis index relative to the preceding model; ∆RMSEA: Change in root mean square error of approximation relative to the preceding model.
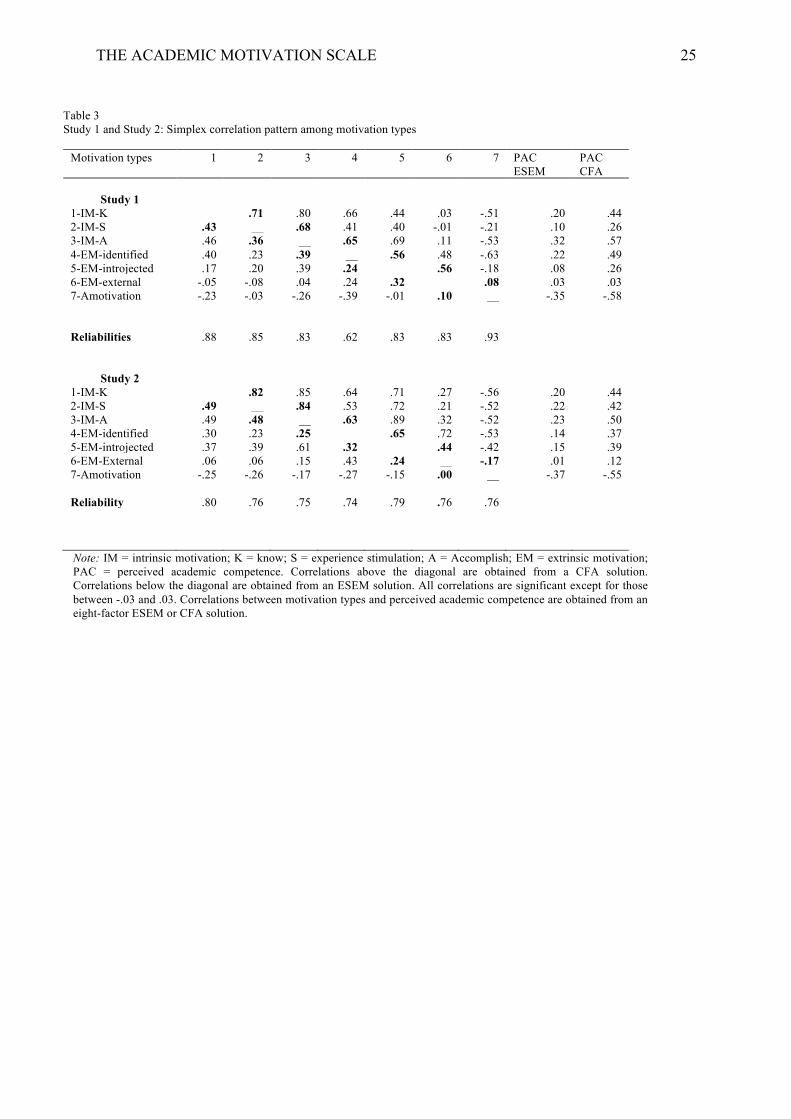
THE ACADEMIC MOTIVATION SCALE 25
Table 3 Study 1 and Study 2: Simplex correlation pattern among motivation types
Motivation types 1 2 3 4 5 6 7 PAC ESEM
PAC CFA
Study 1
1-IM-K __ .71 .80 .66 .44 .03 -.51 .20 .44 2-IM-S .43 __ .68 .41 .40 -.01 -.21 .10 .26 3-IM-A .46 .36 __ .65 .69 .11 -.53 .32 .57 4-EM-identified .40 .23 .39 __ .56 .48 -.63 .22 .49 5-EM-introjected .17 .20 .39 .24 __ .56 -.18 .08 .26 6-EM-external -.05 -.08 .04 .24 .32 __ .08 .03 .03 7-Amotivation -.23 -.03 -.26 -.39 -.01 .10 __ -.35 -.58 Reliabilities .88 .85 .83 .62 .83 .83 .93
Study 2 1-IM-K __ .82 .85 .64 .71 .27 -.56 .20 .44 2-IM-S .49 __ .84 .53 .72 .21 -.52 .22 .42 3-IM-A .49 .48 __ .63 .89 .32 -.52 .23 .50 4-EM-identified .30 .23 .25 __ .65 .72 -.53 .14 .37 5-EM-introjected .37 .39 .61 .32 __ .44 -.42 .15 .39 6-EM-External .06 .06 .15 .43 .24 __ -.17 .01 .12 7-Amotivation -.25 -.26 -.17 -.27 -.15 .00 __ -.37 -.55 Reliability .80 .76 .75 .74 .79 .76 .76 Note: IM = intrinsic motivation; K = know; S = experience stimulation; A = Accomplish; EM = extrinsic motivation; PAC = perceived academic competence. Correlations above the diagonal are obtained from a CFA solution. Correlations below the diagonal are obtained from an ESEM solution. All correlations are significant except for those between -.03 and .03. Correlations between motivation types and perceived academic competence are obtained from an eight-factor ESEM or CFA solution.
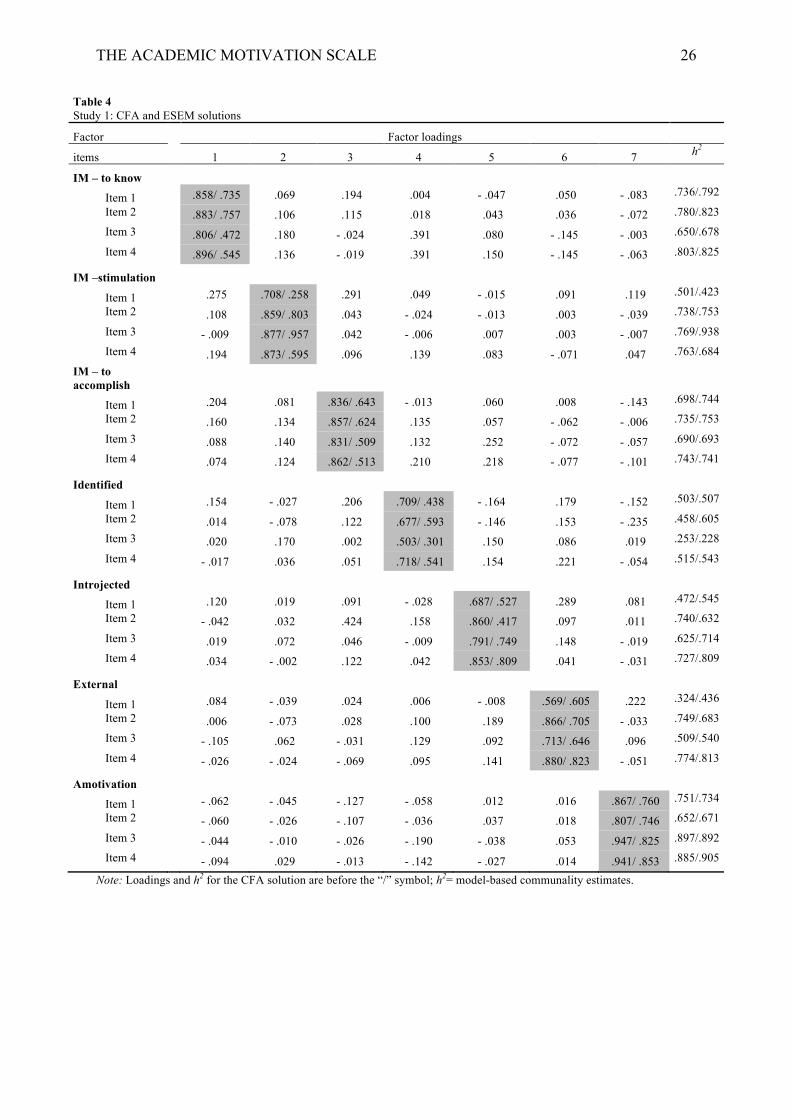
THE ACADEMIC MOTIVATION SCALE 26
Table 4 Study 1: CFA and ESEM solutions
Factor Factor loadings
items 1 2 3 4 5 6 7 h2
IM – to know
Item 1 .858/ .735 .069 .194 .004 - .047 .050 - .083 .736/.792
Item 2 .883/ .757 .106 .115 .018 .043 .036 - .072 .780/.823
Item 3 .806/ .472 .180 - .024 .391 .080 - .145 - .003 .650/.678
Item 4 .896/ .545 .136 - .019 .391 .150 - .145 - .063 .803/.825
IM –stimulation
Item 1 .275 .708/ .258 .291 .049 - .015 .091 .119 .501/.423
Item 2 .108 .859/ .803 .043 - .024 - .013 .003 - .039 .738/.753
Item 3 - .009 .877/ .957 .042 - .006 .007 .003 - .007 .769/.938
Item 4 .194 .873/ .595 .096 .139 .083 - .071 .047 .763/.684
IM – to accomplish
Item 1 .204 .081 .836/ .643 - .013 .060 .008 - .143 .698/.744
Item 2 .160 .134 .857/ .624 .135 .057 - .062 - .006 .735/.753
Item 3 .088 .140 .831/ .509 .132 .252 - .072 - .057 .690/.693
Item 4 .074 .124 .862/ .513 .210 .218 - .077 - .101 .743/.741
Identified
Item 1 .154 - .027 .206 .709/ .438 - .164 .179 - .152 .503/.507
Item 2 .014 - .078 .122 .677/ .593 - .146 .153 - .235 .458/.605
Item 3 .020 .170 .002 .503/ .301 .150 .086 .019 .253/.228
Item 4 - .017 .036 .051 .718/ .541 .154 .221 - .054 .515/.543
Introjected
Item 1 .120 .019 .091 - .028 .687/ .527 .289 .081 .472/.545
Item 2 - .042 .032 .424 .158 .860/ .417 .097 .011 .740/.632
Item 3 .019 .072 .046 - .009 .791/ .749 .148 - .019 .625/.714
Item 4 .034 - .002 .122 .042 .853/ .809 .041 - .031 .727/.809
External
Item 1 .084 - .039 .024 .006 - .008 .569/ .605 .222 .324/.436
Item 2 .006 - .073 .028 .100 .189 .866/ .705 - .033 .749/.683
Item 3 - .105 .062 - .031 .129 .092 .713/ .646 .096 .509/.540
Item 4 - .026 - .024 - .069 .095 .141 .880/ .823 - .051 .774/.813
Amotivation
Item 1 - .062 - .045 - .127 - .058 .012 .016 .867/ .760 .751/.734
Item 2 - .060 - .026 - .107 - .036 .037 .018 .807/ .746 .652/.671
Item 3 - .044 - .010 - .026 - .190 - .038 .053 .947/ .825 .897/.892
Item 4 - .094 .029 - .013 - .142 - .027 .014 .941/ .853 .885/.905
Note: Loadings and h2 for the CFA solution are before the “/” symbol; h2= model-based communality estimates.
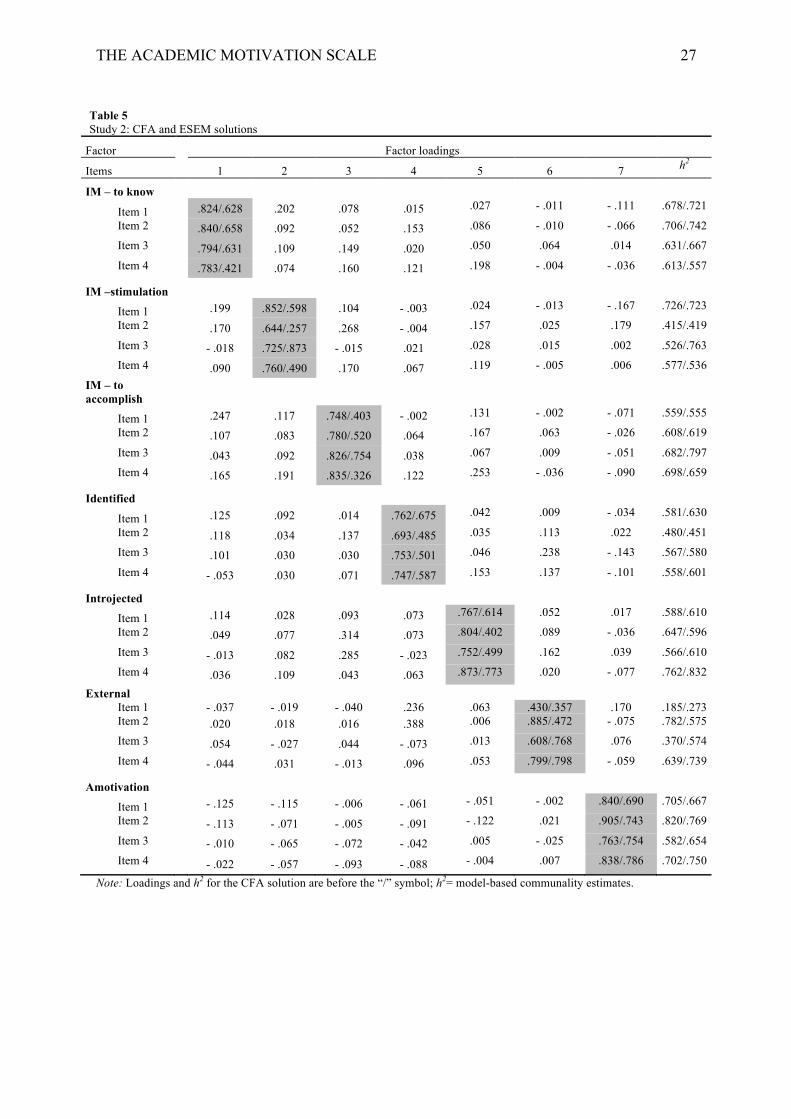
THE ACADEMIC MOTIVATION SCALE 27
Table 5 Study 2: CFA and ESEM solutions
Factor Factor loadings
Items 1 2 3 4 5 6 7 h2
IM – to know
Item 1 .824/.628 .202 .078 .015 .027 - .011 - .111 .678/.721
Item 2 .840/.658 .092 .052 .153 .086 - .010 - .066 .706/.742
Item 3 .794/.631 .109 .149 .020 .050 .064 .014 .631/.667
Item 4 .783/.421 .074 .160 .121 .198 - .004 - .036 .613/.557
IM –stimulation
Item 1 .199 .852/.598 .104 - .003 .024 - .013 - .167 .726/.723
Item 2 .170 .644/.257 .268 - .004 .157 .025 .179 .415/.419
Item 3 - .018 .725/.873 - .015 .021 .028 .015 .002 .526/.763
Item 4 .090 .760/.490 .170 .067 .119 - .005 .006 .577/.536
IM – to accomplish
Item 1 .247 .117 .748/.403 - .002 .131 - .002 - .071 .559/.555
Item 2 .107 .083 .780/.520 .064 .167 .063 - .026 .608/.619
Item 3 .043 .092 .826/.754 .038 .067 .009 - .051 .682/.797
Item 4 .165 .191 .835/.326 .122 .253 - .036 - .090 .698/.659
Identified
Item 1 .125 .092 .014 .762/.675 .042 .009 - .034 .581/.630
Item 2 .118 .034 .137 .693/.485 .035 .113 .022 .480/.451
Item 3 .101 .030 .030 .753/.501 .046 .238 - .143 .567/.580
Item 4 - .053 .030 .071 .747/.587 .153 .137 - .101 .558/.601
Introjected
Item 1 .114 .028 .093 .073 .767/.614 .052 .017 .588/.610
Item 2 .049 .077 .314 .073 .804/.402 .089 - .036 .647/.596
Item 3 - .013 .082 .285 - .023 .752/.499 .162 .039 .566/.610
Item 4 .036 .109 .043 .063 .873/.773 .020 - .077 .762/.832
External Item 1 - .037 - .019 - .040 .236 .063 .430/.357 .170 .185/.273 Item 2 .020 .018 .016 .388 .006 .885/.472 - .075 .782/.575
Item 3 .054 - .027 .044 - .073 .013 .608/.768 .076 .370/.574
Item 4 - .044 .031 - .013 .096 .053 .799/.798 - .059 .639/.739
Amotivation
Item 1 - .125 - .115 - .006 - .061 - .051 - .002 .840/.690 .705/.667
Item 2 - .113 - .071 - .005 - .091 - .122 .021 .905/.743 .820/.769
Item 3 - .010 - .065 - .072 - .042 .005 - .025 .763/.754 .582/.654
Item 4 - .022 - .057 - .093 - .088 - .004 .007 .838/.786 .702/.750
Note: Loadings and h2 for the CFA solution are before the “/” symbol; h2= model-based communality estimates.

THE ACADEMIC MOTIVATION SCALE 28
Appendix A
Input specifications in Mplus for the ESEM model
TITLE: Syntax for ESEM DATA: FILE IS Bei_1416.DAT; VARIABLE: NAMES ARE mic1 mic2 mic3 mic4 ! mic = intrinsic motivation to know mis1 mis2 mis3 mis4 ! mis = intrinsic motivation to stimulation mia1 mia2 mia3 mia4 ! mia = intrinsic motivation to accomplishment iden1 iden2 iden3 iden4 ! iden = identified regulation intro1 intro2 intro3 intro4 ! Intro = introjected regulation rege1 rege2 rege3 rege4 ! Reg = External regulation amo1 amo2 amo3 amo4; ! Amo = Amotivation Categorical are mic1 - amo4; !Specify that we used categorical variables USEVARIABLES mic1 - amo4; !mic1 to amo4 are the 28 items that are used MISSING ARE ALL (99); !specify that all missing values are 99 in the data file ANALYSIS: ESTIMATOR=WLSMV; PARAMETERIZATION=THETA; !Theta is used along with WLSMV ROTATION=GEOMIN(OBLIQUE, .5); MODEL: F1-F7 BY mic1 - amo4 (*1); ! Specify the ESEM model to be tested which is equivalent in that case to EFA. OUTPUT: TECH1; stand; tech4; mod; sampstat;
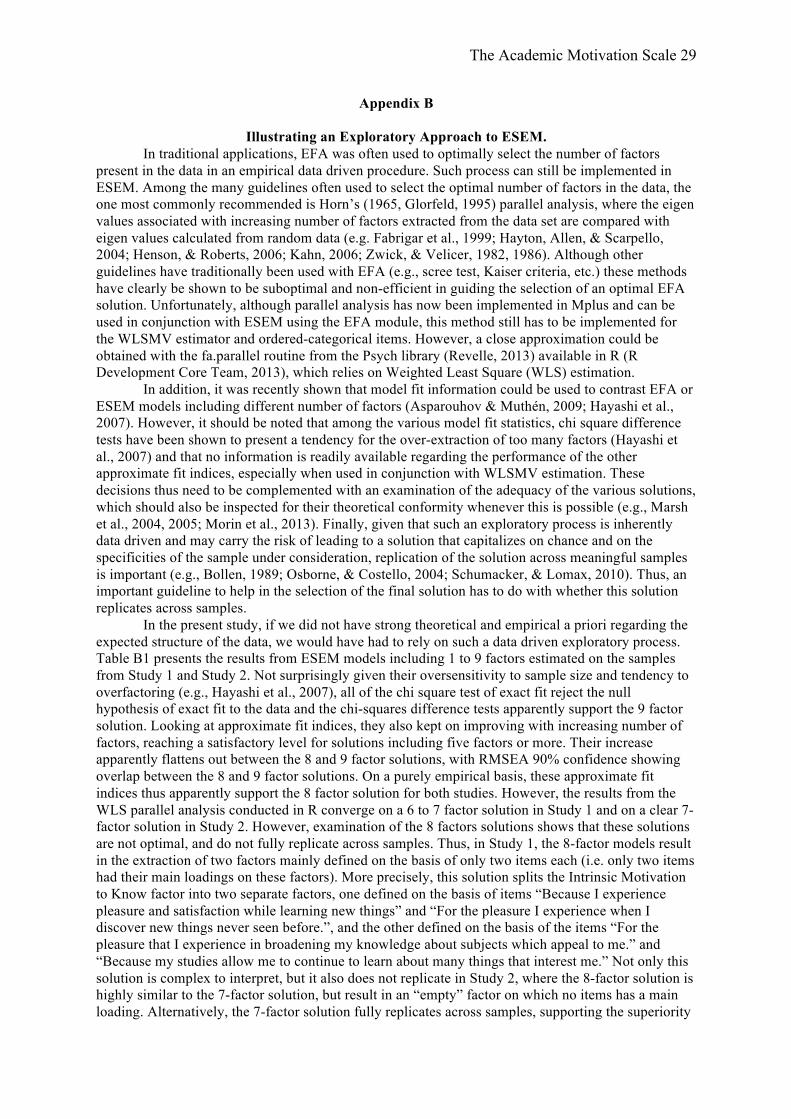
The Academic Motivation Scale 29
Appendix B
Illustrating an Exploratory Approach to ESEM. In traditional applications, EFA was often used to optimally select the number of factors
present in the data in an empirical data driven procedure. Such process can still be implemented in ESEM. Among the many guidelines often used to select the optimal number of factors in the data, the one most commonly recommended is Horn’s (1965, Glorfeld, 1995) parallel analysis, where the eigen values associated with increasing number of factors extracted from the data set are compared with eigen values calculated from random data (e.g. Fabrigar et al., 1999; Hayton, Allen, & Scarpello, 2004; Henson, & Roberts, 2006; Kahn, 2006; Zwick, & Velicer, 1982, 1986). Although other guidelines have traditionally been used with EFA (e.g., scree test, Kaiser criteria, etc.) these methods have clearly be shown to be suboptimal and non-efficient in guiding the selection of an optimal EFA solution. Unfortunately, although parallel analysis has now been implemented in Mplus and can be used in conjunction with ESEM using the EFA module, this method still has to be implemented for the WLSMV estimator and ordered-categorical items. However, a close approximation could be obtained with the fa.parallel routine from the Psych library (Revelle, 2013) available in R (R Development Core Team, 2013), which relies on Weighted Least Square (WLS) estimation.
In addition, it was recently shown that model fit information could be used to contrast EFA or ESEM models including different number of factors (Asparouhov & Muthén, 2009; Hayashi et al., 2007). However, it should be noted that among the various model fit statistics, chi square difference tests have been shown to present a tendency for the over-extraction of too many factors (Hayashi et al., 2007) and that no information is readily available regarding the performance of the other approximate fit indices, especially when used in conjunction with WLSMV estimation. These decisions thus need to be complemented with an examination of the adequacy of the various solutions, which should also be inspected for their theoretical conformity whenever this is possible (e.g., Marsh et al., 2004, 2005; Morin et al., 2013). Finally, given that such an exploratory process is inherently data driven and may carry the risk of leading to a solution that capitalizes on chance and on the specificities of the sample under consideration, replication of the solution across meaningful samples is important (e.g., Bollen, 1989; Osborne, & Costello, 2004; Schumacker, & Lomax, 2010). Thus, an important guideline to help in the selection of the final solution has to do with whether this solution replicates across samples.
In the present study, if we did not have strong theoretical and empirical a priori regarding the expected structure of the data, we would have had to rely on such a data driven exploratory process. Table B1 presents the results from ESEM models including 1 to 9 factors estimated on the samples from Study 1 and Study 2. Not surprisingly given their oversensitivity to sample size and tendency to overfactoring (e.g., Hayashi et al., 2007), all of the chi square test of exact fit reject the null hypothesis of exact fit to the data and the chi-squares difference tests apparently support the 9 factor solution. Looking at approximate fit indices, they also kept on improving with increasing number of factors, reaching a satisfactory level for solutions including five factors or more. Their increase apparently flattens out between the 8 and 9 factor solutions, with RMSEA 90% confidence showing overlap between the 8 and 9 factor solutions. On a purely empirical basis, these approximate fit indices thus apparently support the 8 factor solution for both studies. However, the results from the WLS parallel analysis conducted in R converge on a 6 to 7 factor solution in Study 1 and on a clear 7-factor solution in Study 2. However, examination of the 8 factors solutions shows that these solutions are not optimal, and do not fully replicate across samples. Thus, in Study 1, the 8-factor models result in the extraction of two factors mainly defined on the basis of only two items each (i.e. only two items had their main loadings on these factors). More precisely, this solution splits the Intrinsic Motivation to Know factor into two separate factors, one defined on the basis of items “Because I experience pleasure and satisfaction while learning new things” and “For the pleasure I experience when I discover new things never seen before.”, and the other defined on the basis of the items “For the pleasure that I experience in broadening my knowledge about subjects which appeal to me.” and “Because my studies allow me to continue to learn about many things that interest me.” Not only this solution is complex to interpret, but it also does not replicate in Study 2, where the 8-factor solution is highly similar to the 7-factor solution, but result in an “empty” factor on which no items has a main loading. Alternatively, the 7-factor solution fully replicates across samples, supporting the superiority

The Academic Motivation Scale 30
of this solution which would have been retained in this more exploratory illustration.
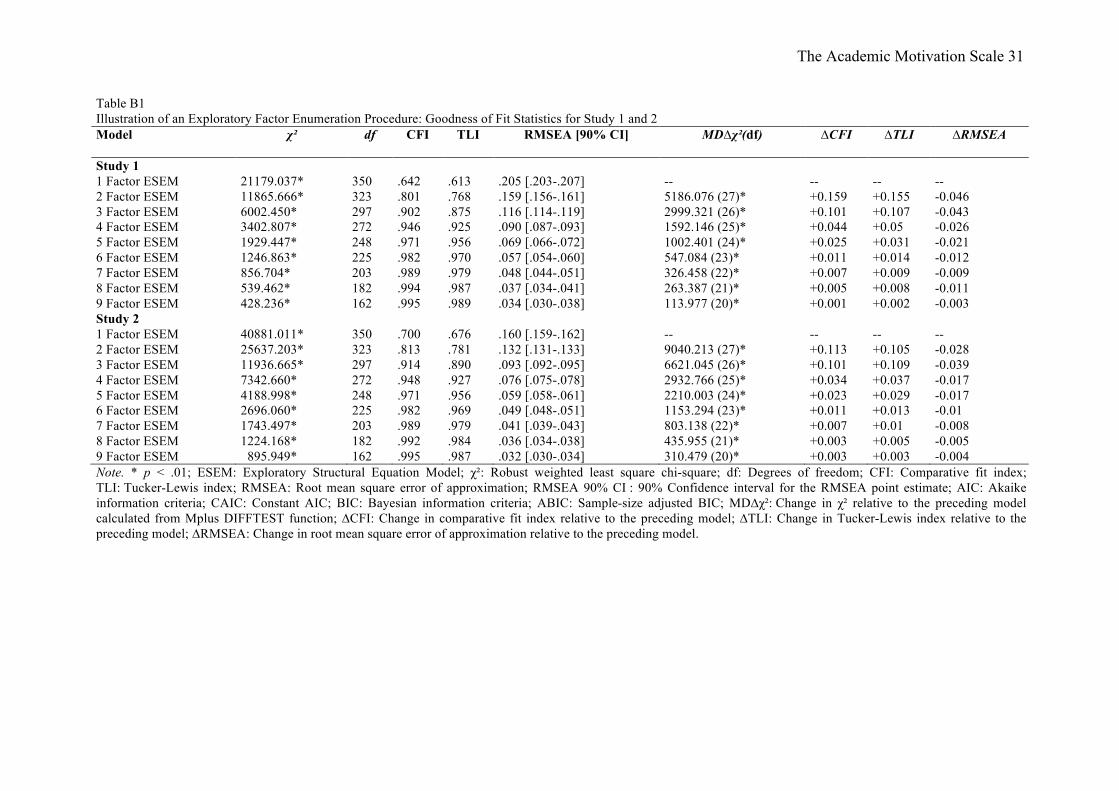
The Academic Motivation Scale 31
Table B1 Illustration of an Exploratory Factor Enumeration Procedure: Goodness of Fit Statistics for Study 1 and 2 Model χ² df CFI TLI RMSEA [90% CI] MD∆χ²(df) ∆CFI ∆TLI ∆RMSEA Study 1 1 Factor ESEM 21179.037* 350 .642 .613 .205 [.203-.207] -- -- -- -- 2 Factor ESEM 11865.666* 323 .801 .768 .159 [.156-.161] 5186.076 (27)* +0.159 +0.155 -0.046 3 Factor ESEM 6002.450* 297 .902 .875 .116 [.114-.119] 2999.321 (26)* +0.101 +0.107 -0.043 4 Factor ESEM 3402.807* 272 .946 .925 .090 [.087-.093] 1592.146 (25)* +0.044 +0.05 -0.026 5 Factor ESEM 1929.447* 248 .971 .956 .069 [.066-.072] 1002.401 (24)* +0.025 +0.031 -0.021 6 Factor ESEM 1246.863* 225 .982 .970 .057 [.054-.060] 547.084 (23)* +0.011 +0.014 -0.012 7 Factor ESEM 856.704* 203 .989 .979 .048 [.044-.051] 326.458 (22)* +0.007 +0.009 -0.009 8 Factor ESEM 539.462* 182 .994 .987 .037 [.034-.041] 263.387 (21)* +0.005 +0.008 -0.011 9 Factor ESEM 428.236* 162 .995 .989 .034 [.030-.038] 113.977 (20)* +0.001 +0.002 -0.003 Study 2 1 Factor ESEM 40881.011* 350 .700 .676 .160 [.159-.162] -- -- -- -- 2 Factor ESEM 25637.203* 323 .813 .781 .132 [.131-.133] 9040.213 (27)* +0.113 +0.105 -0.028 3 Factor ESEM 11936.665* 297 .914 .890 .093 [.092-.095] 6621.045 (26)* +0.101 +0.109 -0.039 4 Factor ESEM 7342.660* 272 .948 .927 .076 [.075-.078] 2932.766 (25)* +0.034 +0.037 -0.017 5 Factor ESEM 4188.998* 248 .971 .956 .059 [.058-.061] 2210.003 (24)* +0.023 +0.029 -0.017 6 Factor ESEM 2696.060* 225 .982 .969 .049 [.048-.051] 1153.294 (23)* +0.011 +0.013 -0.01 7 Factor ESEM 1743.497* 203 .989 .979 .041 [.039-.043] 803.138 (22)* +0.007 +0.01 -0.008 8 Factor ESEM 1224.168* 182 .992 .984 .036 [.034-.038] 435.955 (21)* +0.003 +0.005 -0.005 9 Factor ESEM 895.949* 162 .995 .987 .032 [.030-.034] 310.479 (20)* +0.003 +0.003 -0.004 Note. * p < .01; ESEM: Exploratory Structural Equation Model; χ²: Robust weighted least square chi-square; df: Degrees of freedom; CFI: Comparative fit index; TLI: Tucker-Lewis index; RMSEA: Root mean square error of approximation; RMSEA 90% CI : 90% Confidence interval for the RMSEA point estimate; AIC: Akaike information criteria; CAIC: Constant AIC; BIC: Bayesian information criteria; ABIC: Sample-size adjusted BIC; MD∆χ²: Change in χ² relative to the preceding model calculated from Mplus DIFFTEST function; ∆CFI: Change in comparative fit index relative to the preceding model; ∆TLI: Change in Tucker-Lewis index relative to the preceding model; ∆RMSEA: Change in root mean square error of approximation relative to the preceding model.
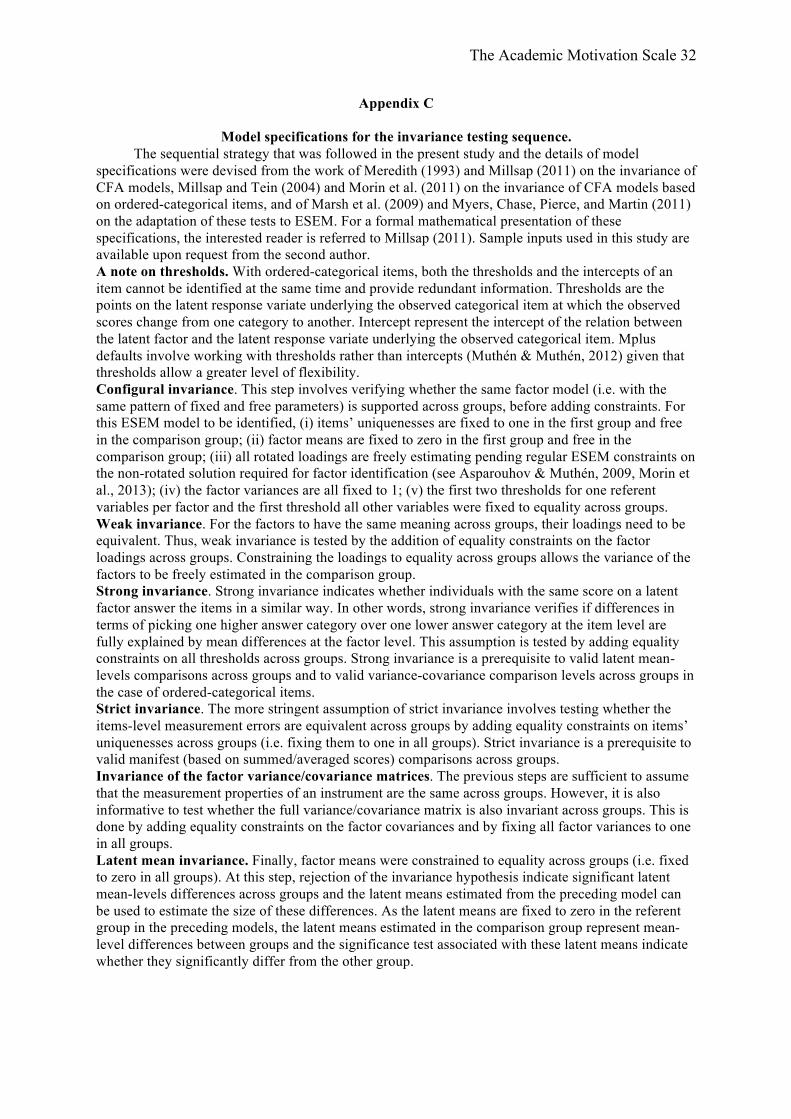
The Academic Motivation Scale 32
Appendix C
Model specifications for the invariance testing sequence. The sequential strategy that was followed in the present study and the details of model
specifications were devised from the work of Meredith (1993) and Millsap (2011) on the invariance of CFA models, Millsap and Tein (2004) and Morin et al. (2011) on the invariance of CFA models based on ordered-categorical items, and of Marsh et al. (2009) and Myers, Chase, Pierce, and Martin (2011) on the adaptation of these tests to ESEM. For a formal mathematical presentation of these specifications, the interested reader is referred to Millsap (2011). Sample inputs used in this study are available upon request from the second author. A note on thresholds. With ordered-categorical items, both the thresholds and the intercepts of an item cannot be identified at the same time and provide redundant information. Thresholds are the points on the latent response variate underlying the observed categorical item at which the observed scores change from one category to another. Intercept represent the intercept of the relation between the latent factor and the latent response variate underlying the observed categorical item. Mplus defaults involve working with thresholds rather than intercepts (Muthén & Muthén, 2012) given that thresholds allow a greater level of flexibility. Configural invariance. This step involves verifying whether the same factor model (i.e. with the same pattern of fixed and free parameters) is supported across groups, before adding constraints. For this ESEM model to be identified, (i) items’ uniquenesses are fixed to one in the first group and free in the comparison group; (ii) factor means are fixed to zero in the first group and free in the comparison group; (iii) all rotated loadings are freely estimating pending regular ESEM constraints on the non-rotated solution required for factor identification (see Asparouhov & Muthén, 2009, Morin et al., 2013); (iv) the factor variances are all fixed to 1; (v) the first two thresholds for one referent variables per factor and the first threshold all other variables were fixed to equality across groups. Weak invariance. For the factors to have the same meaning across groups, their loadings need to be equivalent. Thus, weak invariance is tested by the addition of equality constraints on the factor loadings across groups. Constraining the loadings to equality across groups allows the variance of the factors to be freely estimated in the comparison group. Strong invariance. Strong invariance indicates whether individuals with the same score on a latent factor answer the items in a similar way. In other words, strong invariance verifies if differences in terms of picking one higher answer category over one lower answer category at the item level are fully explained by mean differences at the factor level. This assumption is tested by adding equality constraints on all thresholds across groups. Strong invariance is a prerequisite to valid latent mean-levels comparisons across groups and to valid variance-covariance comparison levels across groups in the case of ordered-categorical items. Strict invariance. The more stringent assumption of strict invariance involves testing whether the items-level measurement errors are equivalent across groups by adding equality constraints on items’ uniquenesses across groups (i.e. fixing them to one in all groups). Strict invariance is a prerequisite to valid manifest (based on summed/averaged scores) comparisons across groups. Invariance of the factor variance/covariance matrices. The previous steps are sufficient to assume that the measurement properties of an instrument are the same across groups. However, it is also informative to test whether the full variance/covariance matrix is also invariant across groups. This is done by adding equality constraints on the factor covariances and by fixing all factor variances to one in all groups. Latent mean invariance. Finally, factor means were constrained to equality across groups (i.e. fixed to zero in all groups). At this step, rejection of the invariance hypothesis indicate significant latent mean-levels differences across groups and the latent means estimated from the preceding model can be used to estimate the size of these differences. As the latent means are fixed to zero in the referent group in the preceding models, the latent means estimated in the comparison group represent mean-level differences between groups and the significance test associated with these latent means indicate whether they significantly differ from the other group.