Embed Size (px)
Citation preview
APPLICATION OF DUPONT’S DIRTY DOZEN FRAMEWORK
TO COMMERCIAL AVIATION MAINTENANCE INCIDENTS
By
Greg Michael Mellema
A Dissertation Submitted to the College of Aviation
in Partial Fulfillment of the Requirements for the Degree of
Doctor of Philosophy in Aviation
Embry-Riddle Aeronautical University
Daytona Beach, Florida
September 2018
ii
© 2018 Greg Michael Mellema
All Rights Reserved.
iii
APPLICATION OF DUPONT’S DIRTY DOZEN FRAMEWORK
TO COMMERCIAL AVIATION MAINTENANCE INCIDENTS
By
Greg Michael Mellema
This Dissertation was prepared under the direction of the candidate’s Dissertation
Committee Chair, Dr. Haydee Cuevas, and has been approved by the members
of the dissertation committee. It was submitted to the College of Aviation and
was accepted in partial fulfillment of the requirements for the
Degree of
Doctor of Philosophy in Aviation
Haydee M. Cuevas, Ph.D.
Committee Chair
David A. Esser, Ph.D. Antonio I. Cortés, Ph.D.
Committee Member Associate Dean, School of Graduate
Studies, College of Aviation
Bruce A. Conway, Ph.D. Alan J. Stolzer, Ph.D.
Committee Member Dean, College of Aviation
Shari L. Frisinger, D. EL.
Committee Member (External)
Lon D. Moeller, J.D.
Senior Vice President for Academic
Affairs and Provost
____________________
Date
iv
ABSTRACT
Researcher: Greg Michael Mellema
Title: APPLICATION OF DUPONT’S DIRTY DOZEN FRAMEWORK TO
COMMERCIAL AVIATION MAINTENANCE INCIDENTS
Institution: Embry-Riddle Aeronautical University
Degree: Doctor of Philosophy in Aviation
Year: 2018
This study examined the 12 preconditions for maintenance errors commonly known as
the Dirty Dozen and applied them to actual incident and accident data provided by a
participating airline (PA). The data provided by the PA consisted of Maintenance Event
Reports (MERs) (reactive), Maintenance Operations Safety Assessment (MOSA) reports
(proactive), and the results of the 2017 Maintenance Climate Awareness Survey (MCAS)
(subjective). The MER and MOSA reports were coded by aviation maintenance subject
matter experts (SMEs) using the 12 Dirty Dozen categories as the coding scheme, while
the MCAS responses were parsed according to the precondition category they best
represented. An examination and qualitative analysis of these data sets as they related to
the Dirty Dozen categories answered the following research questions: (1) How does the
reactive data (MER) analysis compare to the proactive (MOSA) analysis in terms of the
Dirty Dozen? Do they echo similar Dirty Dozen categories, or do they seem to reflect
different aspects of the Dirty Dozen? (2) What other preconditions for maintenance error
become apparent from the analyses? What do they have in common? How complete is
the Dirty Dozen? (3) What insights can be gleaned from the subjective report data
(MCAS) with regard to maintenance personnel’s perceptions of the organization’s safety
culture? The results revealed not only the presence of each Dirty Dozen category to
v
some degree, but also the difference in sensitivity of the MER (reactive) and MOSA
(proactive) to the 12 Dirty Dozen categories. Recommendations for practice and future
research are discussed.
vi
DEDICATION
For Mom & Dad, for whom this work was completed just a little too late. We
miss you. For Cheryl, thank you for your love and patience. And for my daughter, my
reason for being, my inspiration for the past 22 years. Here it is Katie, proof that you can
do anything you set your mind to.
vii
ACKNOWLEDGMENTS
Every man is the sum-total of his reactions to experience. As your
experiences differ and multiply, you become a different man, and hence
your perspective changes. This goes on and on. Every reaction is a
learning process; every significant experience alters your perspective.
~ Hunter S. Thompson
Unlike so many fresh-faced young graduates, I wrote this dissertation at the not-
so-tender age of 55. Now, looking back at the arc of my life and an aviation career
spanning over three decades, I must acknowledge those who influenced me, those who
taught me. Those who made me better, who encouraged me when I fell into despair, and,
recognizing potential even when I did not, never let me give up on myself. In this task, I
will utterly fail as there are so many people I am grateful to… but, here goes.
For Bob Clark, who taught me that quality and craftsmanship are an aircraft
mechanic’s stock-in-trade and must never be compromised. For Al Stuhlmacher, who
saw the potential and set me on this most excellent path. For Mike Hoke and Lou
Dorworth, who took a chance on me and introduced me to the world of composites. For
all the soldiers I served with, from whom I learned what true patriotism, courage and
sacrifice look like. For my classmates in the Ph.D. program, for their time and
encouragement. For my dissertation committee members and advisor, Dr. Haydee
Cuevas, Dr. David Esser, Dr. Bruce Conway, Dr. Shari Frisinger, and Dr. Dothang
Truong, who held me to the highest standard that I may truly learn. For Dr. Alan Stolzer
for admitting me to the program and talking me down off the ledge at least twice. For Dr.
James Sands for his support and encouragement. And, for Gordon Dupont, for his
amazing insight, generosity, and dedication to our industry. Thank you all, here’s to
hoping I was worth the trouble. Cheers!
viii
TABLE OF CONTENTS
Page
Signature Page .................................................................................................................. iii
Abstract ............................................................................................................................. iv
Dedication ......................................................................................................................... vi
Acknowledgements .......................................................................................................... vii
List of Tables ................................................................................................................... xii
List of Figures ................................................................................................................. xiii
Chapter I Introduction ................................................................................................ 1
Statement of the Problem ............................................................... 4
Significance of the Study ............................................................... 4
Purpose Statement .......................................................................... 5
Research Questions ........................................................................ 6
Delimitations .................................................................................. 7
Limitations and Assumptions ........................................................ 8
Definitions of Terms ...................................................................... 9
List of Acronyms ......................................................................... 13
Chapter II Review of the Relevant Literature ........................................................... 15
Human Factors in Aviation Maintenance .................................... 16
Error Types .................................................................................. 17
Human Error Classification ......................................................... 20
Threat and Error Management (TEM) ......................................... 22
TEM, LOSA, and M-LOSA......................................................... 24
Preconditions for Maintenance Errors: The Dirty Dozen ............ 26
ix
Summary ...................................................................................... 32
Chapter III Methodology ........................................................................................... 34
Data Collection and Treatment .................................................... 36
Report Data .................................................................................. 39
Survey Data .................................................................................. 41
Rater Selection ............................................................................. 43
Reliability and Validity ................................................................ 43
Reliability ......................................................................... 44
Validity ............................................................................ 44
Summary ...................................................................................... 47
Chapter IV Results ...................................................................................................... 48
Maintenance Event Reports ......................................................... 48
Maintenance Operations Safety Reports ...................................... 51
MER – MOSA Ratings Comparison............................................ 53
Maintenance Climate Assessment Survey (MCAS) Report ........ 59
Survey Mapping ............................................................... 60
Lack of Communication .................................................. 63
Lack of Resources ............................................................ 64
Lack of Knowledge .......................................................... 65
Fatigue.............................................................................. 66
Pressure ............................................................................ 67
Stress ................................................................................ 67
Summary ...................................................................................... 71
x
Chapter V Discussion, Conclusions, and Recommendations .................................... 73
Discussion .................................................................................... 74
MER – MOSA Comparison ......................................................... 74
Insights from Maintenance Climate Assessment Survey............. 78
Lack of Communication .................................................. 79
Lack of Resources ............................................................ 79
Lack of Knowledge .......................................................... 80
Fatigue.............................................................................. 80
Pressure ............................................................................ 81
Stress ................................................................................ 81
Prevalence of Dirty Dozen Categories ......................................... 84
Conclusions .................................................................................. 86
Study Limitations ......................................................................... 88
Recommendations for Practice .................................................... 88
Recommendations for Future Research ....................................... 90
References ........................................................................................................................ 91
Appendices ....................................................................................................................... 98
A Rater Biographies ......................................................................... 98
B The Dirty Dozen Posters ............................................................ 102
C MER Scores for Raters A and B ................................................ 106
D MOSA Scores for Raters A and B ............................................. 114
E PA Maintenance Operations Safety Assessment (MOSA) Form 122
F MCAS Questions Used in Analysis ............................................ 127
xi
G Histograms for MCAS Questions .............................................. 130
xii
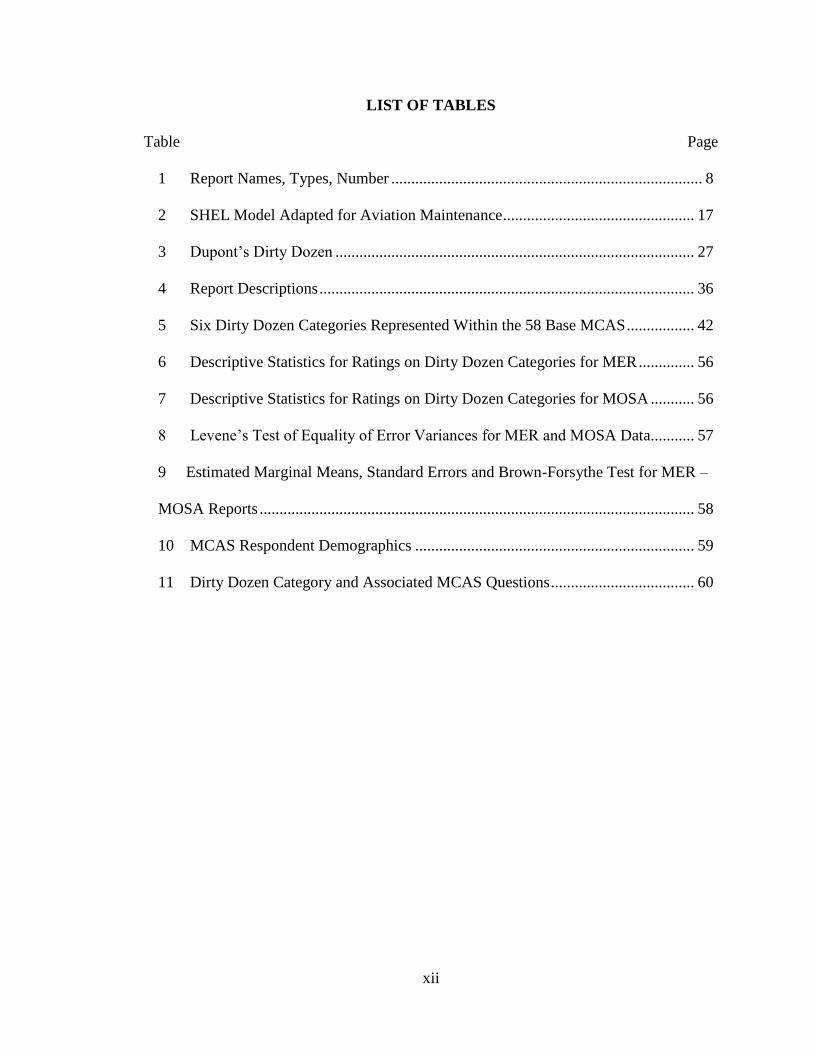
LIST OF TABLES
Table Page
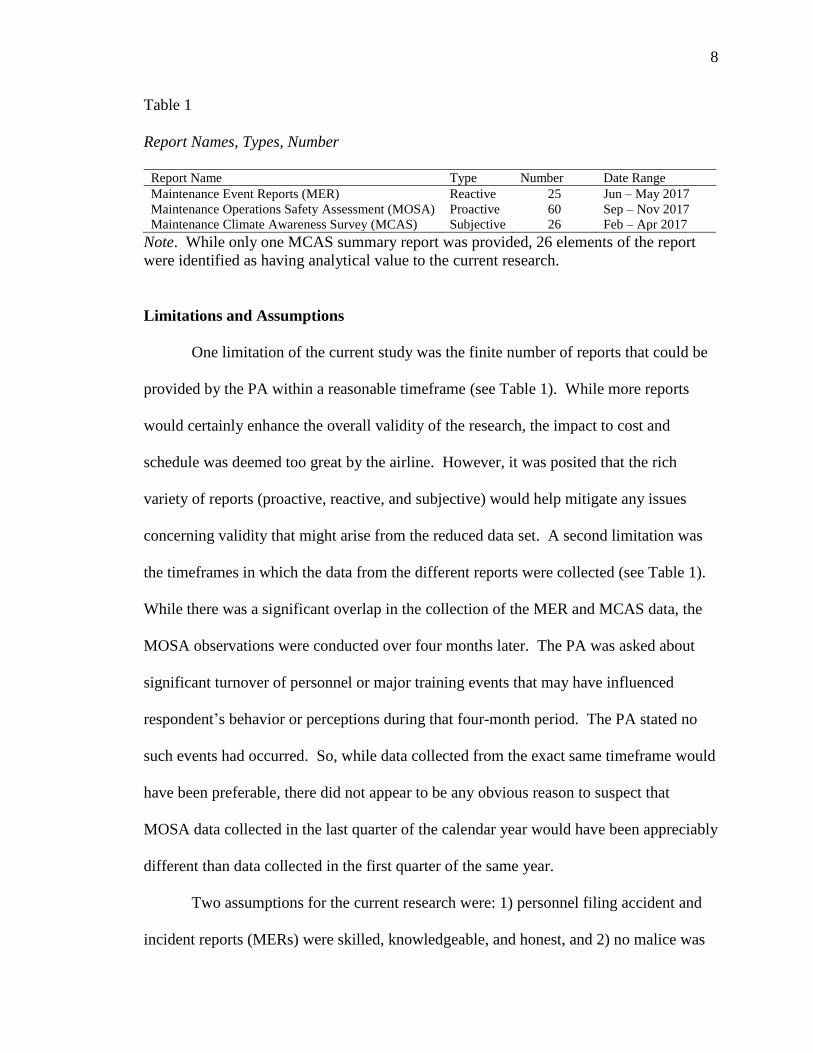
1 Report Names, Types, Number .............................................................................. 8
2 SHEL Model Adapted for Aviation Maintenance ................................................ 17
3 Dupont’s Dirty Dozen .......................................................................................... 27
4 Report Descriptions .............................................................................................. 36
5 Six Dirty Dozen Categories Represented Within the 58 Base MCAS ................. 42
6 Descriptive Statistics for Ratings on Dirty Dozen Categories for MER .............. 56
7 Descriptive Statistics for Ratings on Dirty Dozen Categories for MOSA ........... 56
8 Levene’s Test of Equality of Error Variances for MER and MOSA Data........... 57
9 Estimated Marginal Means, Standard Errors and Brown-Forsythe Test for MER –
MOSA Reports ............................................................................................................. 58
10 MCAS Respondent Demographics ...................................................................... 59
11 Dirty Dozen Category and Associated MCAS Questions .................................... 60
xiii
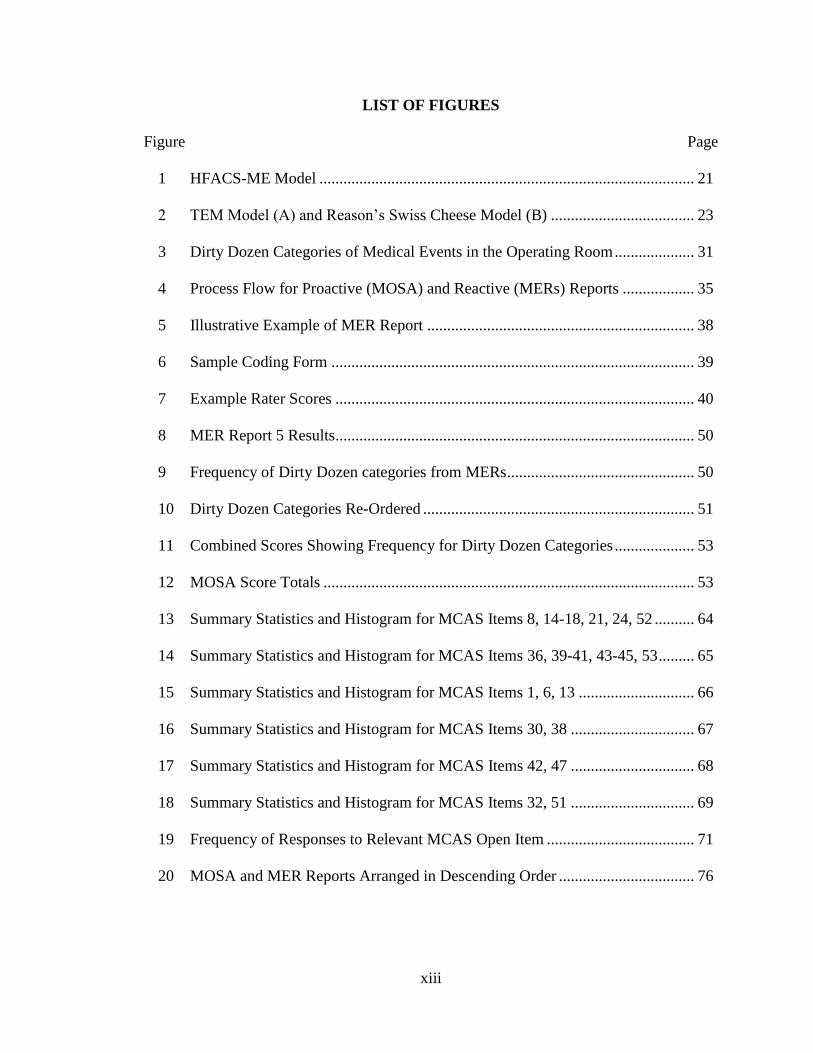
LIST OF FIGURES
Figure Page
1 HFACS-ME Model .............................................................................................. 21
2 TEM Model (A) and Reason’s Swiss Cheese Model (B) .................................... 23
3 Dirty Dozen Categories of Medical Events in the Operating Room .................... 31
4 Process Flow for Proactive (MOSA) and Reactive (MERs) Reports .................. 35
5 Illustrative Example of MER Report ................................................................... 38
6 Sample Coding Form ........................................................................................... 39
7 Example Rater Scores .......................................................................................... 40
8 MER Report 5 Results .......................................................................................... 50
9 Frequency of Dirty Dozen categories from MERs ............................................... 50
10 Dirty Dozen Categories Re-Ordered .................................................................... 51
11 Combined Scores Showing Frequency for Dirty Dozen Categories .................... 53
12 MOSA Score Totals ............................................................................................. 53
13 Summary Statistics and Histogram for MCAS Items 8, 14-18, 21, 24, 52 .......... 64
14 Summary Statistics and Histogram for MCAS Items 36, 39-41, 43-45, 53 ......... 65
15 Summary Statistics and Histogram for MCAS Items 1, 6, 13 ............................. 66
16 Summary Statistics and Histogram for MCAS Items 30, 38 ............................... 67
17 Summary Statistics and Histogram for MCAS Items 42, 47 ............................... 68
18 Summary Statistics and Histogram for MCAS Items 32, 51 ............................... 69
19 Frequency of Responses to Relevant MCAS Open Item ..................................... 71
20 MOSA and MER Reports Arranged in Descending Order .................................. 76
1
CHAPTER I
INTRODUCTION
This study examined the 12 preconditions for maintenance errors commonly
known as the Dirty Dozen and applied them to actual accident and incident data provided
by a participating airline (PA). These 12 preconditions for maintenance error were
originally conceived by Gordon Dupont of Transport Canada in the early 1990s (Dupont,
1997). Since then, the Dirty Dozen framework has been widely accepted by
airworthiness authorities comprising 11 countries: Canada, Australia, Singapore, China,
Sweden, Holland, Hungary, the United Kingdom, Ireland, Portugal, and the United States
(CASA, 2013; G. Dupont, personal communication, October 28, 2017). However,
despite this industry acceptance, the amount of scientific research that exists to support
the framework is limited, especially when compared to the volumes of research dedicated
to understanding aircrew and pilot error and their underlying causes. For example, the
literature review for the current research revealed a general disparity between human
factors research concerning flight crew and mechanics. To help illustrate this disparity, a
search in Google Scholar for “aircraft maintenance error” returned 238,000 results while
a search for “pilot error” returned over 2.5 million results. While this hardly qualifies as
empirical evidence, it does underline the inconsistency in research efforts. The study
sought to develop a new way in which to systematically identify preconditions to
maintenance error, allowing an organization to take steps to preclude these preconditions
from manifesting as incidents or accidents.
The examination of human factors research in terms of aviation maintenance
surged around 1990, presumably from a series of high-profile air disasters in the 70s and
2
80s in which aircraft maintenance was implicated (Chang & Wang, 2010; Dorn, 1996;
Gramopadhye & Drury, 2000). Certain human error models and theories developed
during this timeframe have become widely if not universally accepted. Examples include
Reason’s (1990) Swiss Cheese model which illustrates how “holes” in an organization’s
systematic defenses can line up, allowing an accident to occur. Also, Dorn’s (1996)
adaptation of Edward’s (1988) Software, Hardware, Environment, Liveware, or SHEL
model characterized the interaction of these elements within a system such as aircraft
maintenance operations. Additional contemporary works by Shappell and Weigmann
(2000), Merritt and Klinect, (2006), Maurino (2005), and others have developed models
or reactive systems and taxonomies designed to help accident investigators determine
what maintenance error occurred, but these systems do not necessarily offer any insight
as to why it occurred.
During this same period, certain proactive systems were developed such as
Maintenance Line Operations Safety Assessments, or M-LOSA (Crayton, Hackworth,
Roberts, & King, 2017; IACO, 2002). M-LOSA and M-LOSA-like systems are thought
to reduce the chance of maintenance errors occurring through regular auditing
(observation) of personnel on the job (Klinect, 2008) in order to identify and stem
potentially hazardous activities before they are able to manifest as incidents or accidents.
However, while M-LOSA reports and their kind may offer an explanation as to a
maintenance error’s proximate cause, they do not actively seek to identify any higher-
order distal cause such as preconditions for maintenance error that may be present.
In 1993, Gordon Dupont of Transport Canada examined as many as 2,000
maintenance-related accident and incident reports previously attributed to human error.
3
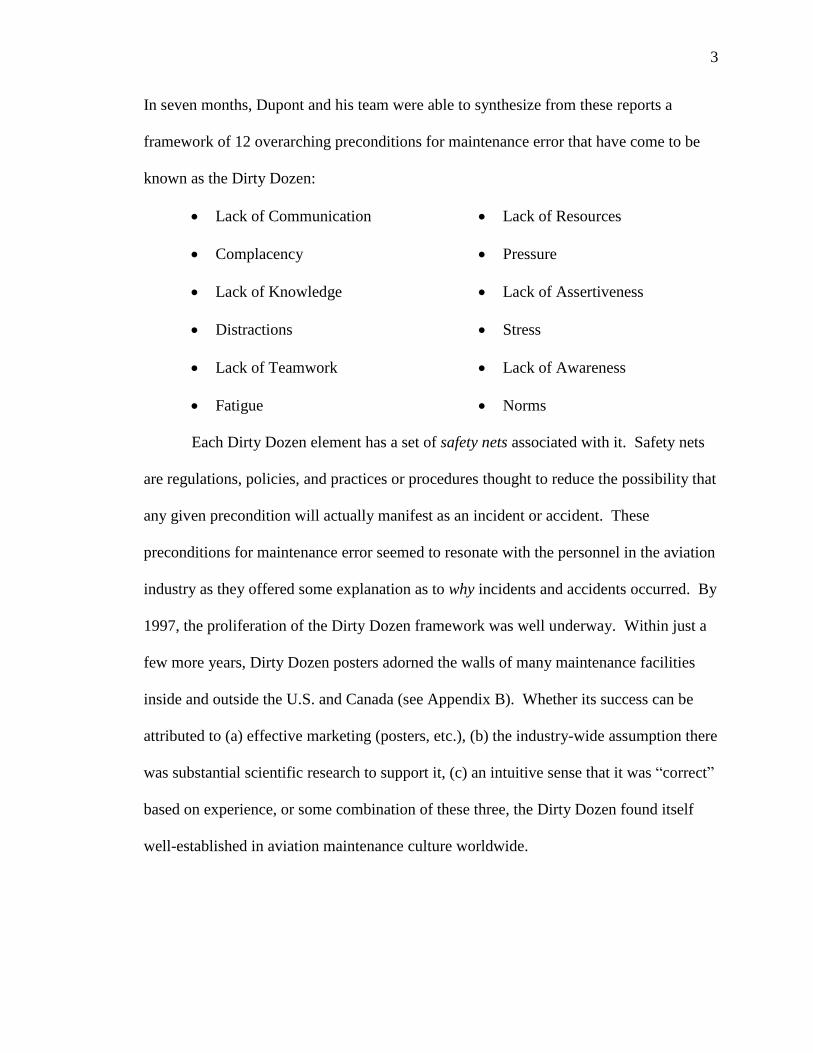
In seven months, Dupont and his team were able to synthesize from these reports a
framework of 12 overarching preconditions for maintenance error that have come to be
known as the Dirty Dozen:
Lack of Communication
Complacency
Lack of Knowledge
Distractions
Lack of Teamwork
Fatigue
Lack of Resources
Pressure
Lack of Assertiveness
Stress
Lack of Awareness
Norms
Each Dirty Dozen element has a set of safety nets associated with it. Safety nets
are regulations, policies, and practices or procedures thought to reduce the possibility that
any given precondition will actually manifest as an incident or accident. These
preconditions for maintenance error seemed to resonate with the personnel in the aviation
industry as they offered some explanation as to why incidents and accidents occurred. By
1997, the proliferation of the Dirty Dozen framework was well underway. Within just a
few more years, Dirty Dozen posters adorned the walls of many maintenance facilities
inside and outside the U.S. and Canada (see Appendix B). Whether its success can be
attributed to (a) effective marketing (posters, etc.), (b) the industry-wide assumption there
was substantial scientific research to support it, (c) an intuitive sense that it was “correct”
based on experience, or some combination of these three, the Dirty Dozen found itself
well-established in aviation maintenance culture worldwide.
4
Statement of the Problem
The aviation industry is perpetually looking for new means to enhance safety and
reduce costs, even if only incrementally. Proactive means (e.g., preventative measures)
are preferred over reactive means (e.g., post-mishap analysis), as they do not require that
an incident or accident has already occurred along with all the attendant damage, cost,
and potential loss of life. However, most proactive means lack sufficient prognosticative
power and are therefore of limited value. As such, in order to decrease maintenance
errors, it is important to evaluate both reactive and proactive data to expose existing
preconditions for error. This is a key element missing from the literature and thus forms
the basis for the research problem – more effective analytical methodologies are needed
to continue to drive maintenance errors down. To address this problem, it is posited that
an examination of an organization’s maintenance culture through the construct of the
Dirty Dozen will yield useful information identifying the presence of preconditions for
maintenance errors. Once uncovered, a mitigating strategy can be devised to address the
specific preconditions that are present, thereby reducing the total number of incidents and
accidents that are able to manifest as a result.
Significance of the Study
As stated previously, the aviation industry has sought new ways to enhance safety
almost since the Wright brothers first powered flight in 1903. Throughout these many
decades, the professionals dedicated to enhancing aviation safety do not recognize a point
of diminishing returns, at least not in the traditional sense. Thus, the aviation culture
traditionally welcomes safety improvements great and small. The results of the current
research provide the industry with yet another tool, another means by which to enhance
5
safety by reducing the number of incidents and accidents that come to fruition by
identifying and ultimately reducing the existence of preconditions to maintenance error in
the organization.
The International Civil Aviation Organization (ICAO) lists over 300 potential
preconditions for error (ICAO, 1993). However, these are general preconditions and are
not specific to aircraft maintenance. While it may never have been intended as such, the
Dirty Dozen’s popularity has essentially made it a standard in terms of what are
considered the most common preconditions specific to maintenance error. Since this
standard has been embraced so thoroughly across the aviation maintenance and safety
culture, it would be useful to have some assurance that it is both complete and effective.
Ma and Grower (2016), and even Dupont himself, have suggested that the Dirty Dozen
may or may not be suitably complete as is. Therefore, evidence suggesting the
completeness, or lack thereof, of the Dirty Dozen construct will be important and useful
to any organization seeking to reduce its maintenance errors by identifying and reducing
its preconditions for maintenance error.
Purpose Statement
The purpose of this qualitative study was to explore the possibility of using
DuPont’s Dirty Dozen for more than just a simple list of preconditions for maintenance
error of which mechanics should be wary. Specifically, the study used the Dirty Dozen
to examine three types of reports from a PA for evidence suggesting the presence of one
or more preconditions for error. It was posited that if the preconditions for maintenance
error are present, the maintenance errors themselves are likely not far behind.
Additionally, the more prevalent the precondition, the more likely the maintenance error
6
is thought to occur (Hobbs & Williamson, 2003). Therefore, the results of the study
yielded specific areas for the PA to focus on to enhance its safety culture.
The types and titles of the reports made available by the PA were (a) reactive -
maintenance event reports (MER), (b) proactive - maintenance operations safety
assessments (MOSA), and (c) subjective - results from the airline’s maintenance climate
awareness survey (MCAS). Such an examination of any one of these reports would yield
useful information about the PA’s maintenance culture. However, since proactive,
reactive, and subjective data each have their own strengths and weaknesses, the
examination of all three types of reports was posited to illustrate the PA’s maintenance
culture in a more holistic and complete manner. Additional details concerning the reports
and how they were analyzed will be discussed in Chapter III.
Research Questions
The aviation industry has recognized the Dirty Dozen as the 12 most common
preconditions for maintenance error for roughly two decades. The Dirty Dozen has been
used extensively in aviation human factors training in the U.S. and abroad and figures
prominently in the Federal Aviation Administration’s (FAA) (2008) aviation
maintenance handbook, human factors addendum. Unfortunately, its potential has been
leveraged for little else. The current research used the Dirty Dozen to examine three
types of reports provided by the PA and, in doing so, answered the following research
questions:
1. How does the reactive data (MER) analysis compare to the proactive (MOSA)
analysis in terms of the Dirty Dozen? Do they echo similar Dirty Dozen
categories, or do they seem to reflect different aspects of the Dirty Dozen?
7
2. What other preconditions for maintenance error become apparent from the
analyses? What do they have in common, or are any of them similar to the
additional preconditions suggested by Ma and Grower (2016)? In terms of
typical preconditions for maintenance error, how complete is the Dirty
Dozen?
3. What insights can be gleaned from the subjective report data (MCAS) with
regard to maintenance personnel’s perceptions of the organization’s safety
culture?
Delimitations
The PA operates a fleet of over 100 Boeing 737 aircraft to destinations in eight
different countries. The PA also employs approximately 3,000 maintenance-related
personnel full-time. The number and type of reports and their scope can be seen in Table
1. Despite the limitations described below, the process is generalizable since the Dirty
Dozen framework is largely agnostic in terms of its application across the aviation
operational spectrum, be it maintenance personnel involved in commercial, cargo, or
agricultural aviation. However, specific results of the application would be expected to
vary from one airline to another due to the host of ethnographic variables in play at any
given organization (i.e., airlines in different countries).
8
Table 1
Report Names, Types, Number
Report Name Type Number Date Range
Maintenance Event Reports (MER) Reactive 25 Jun – May 2017
Maintenance Operations Safety Assessment (MOSA) Proactive 60 Sep – Nov 2017
Maintenance Climate Awareness Survey (MCAS) Subjective 26 Feb – Apr 2017
Note. While only one MCAS summary report was provided, 26 elements of the report
were identified as having analytical value to the current research.
Limitations and Assumptions
One limitation of the current study was the finite number of reports that could be
provided by the PA within a reasonable timeframe (see Table 1). While more reports
would certainly enhance the overall validity of the research, the impact to cost and
schedule was deemed too great by the airline. However, it was posited that the rich
variety of reports (proactive, reactive, and subjective) would help mitigate any issues
concerning validity that might arise from the reduced data set. A second limitation was
the timeframes in which the data from the different reports were collected (see Table 1).
While there was a significant overlap in the collection of the MER and MCAS data, the
MOSA observations were conducted over four months later. The PA was asked about
significant turnover of personnel or major training events that may have influenced
respondent’s behavior or perceptions during that four-month period. The PA stated no
such events had occurred. So, while data collected from the exact same timeframe would
have been preferable, there did not appear to be any obvious reason to suspect that
MOSA data collected in the last quarter of the calendar year would have been appreciably
different than data collected in the first quarter of the same year.
Two assumptions for the current research were: 1) personnel filing accident and
incident reports (MERs) were skilled, knowledgeable, and honest, and 2) no malice was
9
associated with their reporting. The primary assumption made for MOSA reports was
that the observers were also skilled and knowledgeable personnel making sincere efforts
to proactively identify potential errors or preconditions for errors. The PA had specific
requirements for being a MOSA observer. MOSA observers must:
have more than four years of experience as a mechanic
be qualified in the tasks observed
have knowledge of the PA’s procedures
have knowledge of technical English
have taken the required safety course
personal characteristics that reveal ethics, neutrality, and good interpersonal
relationships
ability to generate a report with clarity and objectivity
It is further assumed that the respondents to the MCAS answered honestly and accurately
to the best of their individual abilities.
Definitions of Terms
Accident “An occurrence associated with the operation of
an aircraft that takes place between the time any
person boards the aircraft with the intention of
flight and all such persons have disembarked,
and in which any person suffers death or serious
injury, or in which the aircraft receives
substantial damage” (U.S. Dept. of
Transportation, 2016, p. 1).
10
Aircraft Maintenance “ ‘Maintenance’ includes inspection, overhaul,
repair, preservation, and the replacement of
parts, but excludes preventive maintenance”
(Aeronautics and Space, 2018, p. 10).
Crew Resource Management “The effective use of all available resources for
flight crew personnel to assure a safe and
efficient operation, reducing error, avoiding
stress and increasing efficiency” (FAA, 2004, p.
1).
Dirty Dozen “The Dirty Dozen are the 12 most common
causes of a maintenance person making an error
in judgment which results in a maintenance
error. They are lack of communication,
complacency, lack of knowledge, distraction,
lack of teamwork, fatigue, lack of resources,
pressure, lack of assertiveness, stress, lack of
awareness, and norms” (Dupont, 1997, p. 1).
Federal Aviation
Administration “An agency of the United States Department of
Transportation with authority to regulate and
oversee all aspects of civil aviation in the United
States” (FAA, 2009, p. G-2).
General Aviation All civil aviation operations other than
scheduled air services and nonscheduled air
11
transport operations for remuneration or hire
(Fabry, 1990, p. 238).
Human Factors “A multidisciplinary field encompassing the
behavioral and social sciences, engineering, and
physiology, to consider the variables that
influence individual and crew performance for
the purpose of optimizing human performance
and reducing errors” (FAA, 2009, G-3).
Incident “An occurrence other than an accident that
affects or could affect the safety of operations”
(Transportation, 2016).
Line Operations
Safety Assessment LOSA, “A formal process that requires expert
and highly trained observers to ride the jump
seat during regularly scheduled flights to collect
safety-related data on environmental conditions,
operational complexity, and flight crew
performance. Confidential data collection and
non-jeopardy assurance for pilots are
fundamental to the process” (FAA, 2006, p. 2).
This basic model has been adapted for use in
aircraft maintenance (M-LOSA) and ramp
operations (R-LOSA).
12
Pilot Error “An accident in which an action or decision
made by the pilot was the cause or a
contributing factor that led to the accident”
(FAA, 2009, p. G-4).
Preconditions for
Maintenance Error See “Dirty Dozen” definition.
Safety Management System SMS, “The formal, top-down, organization-
wide approach to managing safety risk and
assuring the effectiveness of safety risk controls.
It includes systematic procedures, practices, and
policies for the management of safety risk”
(FAA Order 8000.369, A-2).
Safety Risk Management SRM, “A process within the SMS composed of
describing the system, identifying the hazards,
and analyzing, assessing, and controlling risk”
(FAA Order 8000.369, A-2).
SHEL Model Originally posited by Edwards (1972), it is “the
relationship of human factors and the aviation
environment” (Reinhart, 1996, p. 6-10).
Specifically, the interactions of (S) software,
(H) hardware, (E) environment, and (L)
liveware within the system or aircraft.
Swiss Cheese Model Theoretical model first posited by Reason
(1990) to describe accident causation
13
comprising: a) organizational influences, b)
unsafe supervision, c) preconditions for unsafe
acts, and d) the unsafe acts themselves.
Threat Error Management “The Threat and Error Management (TEM)
model is a conceptual framework that assists in
understanding the inter-relationship between
threats, errors, and undesired aircraft states in
dynamic and challenging operational contexts”
(Maurino, 2005, p. 1).
List of Acronyms
A4A Airlines for America, formerly ATA
AC Advisory circular
AD Airworthiness directive
ASRS Aviation Safety Reporting System
A&P Airframe and power plant
CASA Civil Aviation Safety Authority
CFR Code of federal regulations
CRM Crew resource management
FAA Federal Aviation Administration
GA General aviation
HFACS-ME Human Factors Analysis and Classification System-
Maintenance Extension
IATA International Air Transport Association
LOSA Line operations safety assessment
MCAS Maintenance climate awareness survey
MEDA Maintenance Error Decision Aid

14
MER Maintenance event report
MOSA Maintenance operations safety assessment
NASA National Air & Space Administration
NTSB National Transportation Safety Board
PA Participating airline
SHEL Software, hardware, environment, liveware
SME Subject matter expert
SMS Safety management system
SRM Safety risk management
TEM Threat and error management
15
CHAPTER II
REVIEW OF THE RELEVANT LITERATURE
Before engaging in any research regarding preconditions for error as they may
relate to aircraft maintenance, a suitable structure should be established that
contextualizes maintenance errors within aviation safety as a whole. According to the
Federal Aviation Administration (FAA), while pilot error continues to be the leading
cause of hull-loss accidents in the commercial aviation industry, maintenance errors are
the second leading cause (FAA, 2014). The work of Marx and Graeber (1994) and, more
recently, Patankar and Taylor (2004) estimate the maintenance error contribution to
commercial aircraft accidents worldwide between 12% and 15%. Approaching the
problem in an even broader scope, the International Air Transportation Association
(IATA) examined safety reports filed between 2003 and 2008 and found that improper
maintenance was linked to aircraft accidents worldwide as much as 40% of the time
(IATA, 2008).
In and of themselves, these figures are cause for concern. However, since each
flight-hour results in an average of 12 maintenance man-hours (Hobbs, 2008), it is not
unreasonable to suggest that a maintenance error may be up to 12 times more likely to
occur and manifest during any given flight-hour when compared to a pilot error. Marais
and Robichaud (2012) found that the likelihood of a maintenance-related accident to
result in fatalities is approximately 6.5 times greater than non-maintenance-related
accidents. They also found that, in accidents resulting in fatalities, those accidents related
to maintenance errors generated an average of 3.6 times more fatalities, giving rise to the
theory of a “fatality risk magnifier” (Marais & Robichaud, 2012, p. 111) associated with
16
maintenance-related accidents. Regardless of the specific calculations used, it seems
clear that maintenance errors play a significant role in commercial aviation safety,
making any efforts to reduce them worthwhile.
Human Factors in Aviation Maintenance
The study of human factors as it relates to aircraft maintenance began in earnest in
the early 1990s. Experts seem to agree this was partly due to the general adoption of
human factors research, especially in terms of pilots and aircrew. However, they also
agree this was partially due to the sequence of high-profile air disasters in the 1980s in
which aircraft maintenance was implicated (Chang & Wang, 2010; Dorn, 1996;
Gramopadhye & Drury, 2000). Some of the more notable examples include the 1988
Aloha Airlines flight 243. The aircraft experienced explosive decompression attributed,
in part, to insufficient inspections on the part of the operator (Hendricks, 1991). In 1989,
a BM AirTours 737 experienced a windshield blowout owing to the incorrect bolts being
used on installation. That same year, a United Airlines DC-10 crash-landed in Sioux
City, Iowa, killing 111 passengers. The United incident, arguably one of the most
infamous of its time, was found to be due to inadequate engine inspection techniques
(Haynes, 1991; Latorella & Prabhu, 2000).
Since the early 1990s, a considerable amount of research has been conducted
attempting to characterize human factors as they relate to aircraft maintenance. As a
result, several theories and models have been developed. While the models differ
somewhat in their approach and focus, researchers seem to agree that aviation inspection
and maintenance tasks are not only varied and complex but are also performed under a
17
constant time-pressure state and often in less than ideal environmental conditions
(Hobbes, 2008; Latorella & Prabhu, 2000).
Error Types
Early maintenance human factors work conducted by Dorn (1996) utilized
Edwards’ (1988) classic SHEL model to study 101 civilian and military aircraft accidents
occurring between 1983 and 1992. This conceptual framework is used to examine the
complex interaction between four elements: a system’s software, or rules, processes, and
policies; its hardware, machinery and equipment; the often-demanding environment; and
its liveware, or the humans that operate and maintain the system. Each of these elements
typically has numerous sub-elements relevant to the particular application comprising its
taxonomy. Edwards further posited that failures could occur not only at the elemental
level but also at the interface between elements. Dorn (1996, p. 19) adapted the SHEL
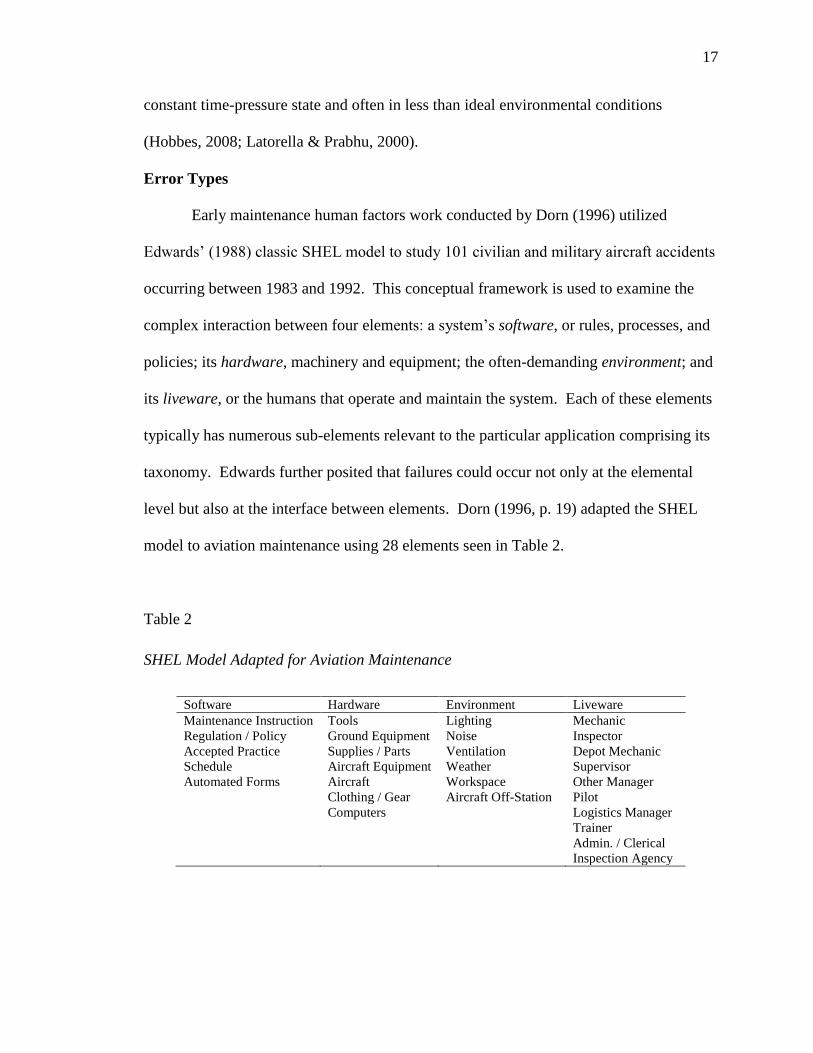
model to aviation maintenance using 28 elements seen in Table 2.
Table 2
SHEL Model Adapted for Aviation Maintenance
Software Hardware Environment Liveware
Maintenance Instruction Tools Lighting Mechanic
Regulation / Policy Ground Equipment Noise Inspector
Accepted Practice Supplies / Parts Ventilation Depot Mechanic
Schedule Aircraft Equipment Weather Supervisor
Automated Forms Aircraft Workspace Other Manager
Clothing / Gear Aircraft Off-Station Pilot
Computers Logistics Manager
Trainer
Admin. / Clerical
Inspection Agency
18
Dorn’s study showed that while maintenance instruction (software) was involved
with 63% of the accidents examined, the mechanics themselves (liveware) contributed to
58% of the accidents and were deemed the primary cause in 27 of those accidents.
Moreover, since the accident investigation boards of the day tended to stop investigating
once they uncovered the failed element, reports contained scant information about the
causes or underlying nature of these element failures. As a result, “unknown” is the first
item on Dorn’s Pareto chart describing 23 underlying causes of the failures accounting
for 39 of the 101 accidents examined.
Dorn’s (1996) work was instrumental in demonstrating the shortcomings of
aviation accident investigation and reporting, especially from a human factors point of
view. While it certainly helped to highlight the role humans and their inherent limitations
play in aviation accidents, it also illustrated the need for accident investigation and
reporting techniques to evolve and expand the breadth and depth of collected data. To
this end, Goldman, Fiedler, and King (2002) reviewed National Transportation Safety
Board (NTSB) accident investigation reports from the 10-year span between 1988 and
1997. The reports were limited to Title 14 of the Code of Federal Regulations (14 CFR),
Part 91 general aviation (GA) accidents, and did not include reports from revenue
generating operations under Parts 121 or 135. However, for the purposes of the current
research, the study revealed much about aviation maintenance professionals in general
and the types of errors likely to occur while engaged in maintenance activities. Within
the reports, the NTSB classified maintenance activities as follows (Goldman, et al., 2002,
p. 1):
19
routine maintenance
service of aircraft equipment
inspection
compliance with
airworthiness directives (AD)
annual inspection
adjustment
alignment
installation
lubrication
modification
replacement
major repair
major alteration
service bulletin/letter
design change
overhaul/major overhaul,
rebuild/remanufacture
Using these more contextual classifications, a frequency distribution was
calculated. The distribution revealed that errors associated with the installation of a
component were a factor or the primary cause of 20% of the accidents. Other factors
and/or causes included maintenance (14.7%), inspection (13.8%), and annual inspection
(8.3%). These first four factors alone comprise over 50% of the accidents reviewed.
Unfortunately, to say that 20% of maintenance-related accidents are attributable to an
installation error of some sort lacks the specificity necessary to take any meaningful
action. Additionally, while contextual schemes such as this tend to promote a more vivid
and comprehensive data collection, the relationships they reveal are most often
correlational but not necessarily causal (Latorella & Prabhu, 2000). While Goldman et
al. (2002) certainly built upon Dorn’s work to legitimize human factors in terms of
aviation maintenance as a genuine concern, the NTSB classification of maintenance
activities used was vague and of little value in terms of determining the actual events or
errors that might lead to an accident (Boyd & Stolzer, 2015).
20
Human Error Classification
Safety Management Systems (SMS) have become ubiquitous in the aviation
industry and are accepted as the most effective framework from which to build a positive
and effective safety culture (Ma & Rankin, 2012). According to Stolzer, Halford, and
Goglia (2015), one of the pillars of SMS is safety risk management (SRM) which
comprises (a) system description (design), (b) hazard identification, (c) risk analysis, (d)
risk assessment, and (e) controlling the risk. Human error classification systems are
essentially a systems approach that seeks to classify various types of human errors and
are often more qualitative in nature (Reason, 1990; Woods, Cook, & Sarter, 1995).
One highly effective application of this approach is the Human Factors Analysis
and Classification System - Maintenance Extension, or HFACS-ME. HFACS-ME
comprises aspects of Reason’s Swiss Cheese Model, Edward’s SHEL Model, as well as
Heinrich’s Domino Theory (Schmidt, Lawson, & Figlock, 2001). HFACS-ME breaks
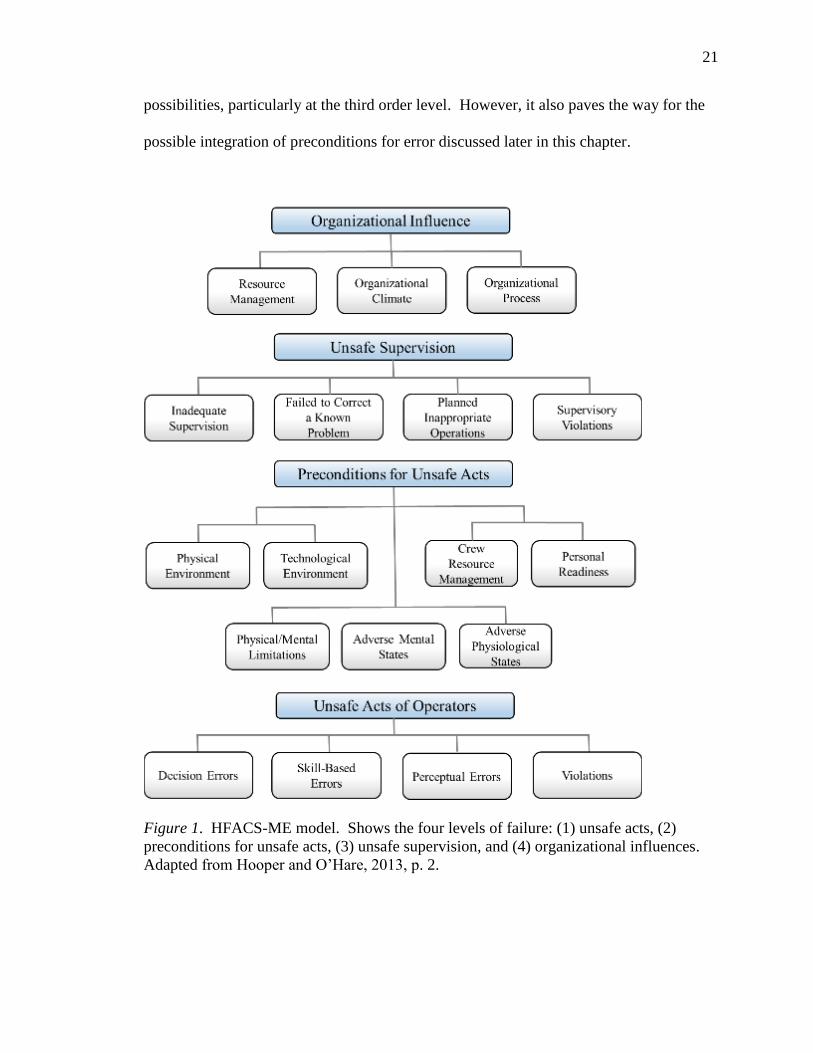
down human error into four levels (orders) as shown in Figure 1. At the first order level,
management conditions, mechanic conditions, and working conditions essentially set the
stage for a mechanic’s actions to result in an accident. The first and second order
categories help identify where issues are located within a system or organization, while
the third order categories add the necessary specificity to develop adequate intervention
strategies (Shappell & Weigmann, 2000).
The creators and advocates of HFACS-ME stress that it is a flexible and adaptable
system. The categories can, and should, be altered as necessary to fit a particular
application or organization. By itself, this flexibility generates a rich interaction of
21
possibilities, particularly at the third order level. However, it also paves the way for the
possible integration of preconditions for error discussed later in this chapter.
Figure 1. HFACS-ME model. Shows the four levels of failure: (1) unsafe acts, (2)
preconditions for unsafe acts, (3) unsafe supervision, and (4) organizational influences.
Adapted from Hooper and O’Hare, 2013, p. 2.
22
Threat and Error Management (TEM)
The Threat and Error Management (TEM) model is a conceptual framework that
aids in understanding the relationship between human performance and system
performance and how they relate to safety. The basic TEM model considers the
interaction of threats, errors, and undesired states, all of which are accepted as inherent
in complex systems, and focuses on their management in an operational setting (Merritt
& Klinect, 2006). Within this framework, these three overarching domains are further
defined in the FAA’s AC 120-90 (Appendix A, p. 1) as follows:
Threats - events or errors that (a) occur outside the influence of the flight
crew, (b) increase the operational complexity of a flight, and (c) require crew
attention and management if safety margins are to be maintained.
Errors - action or inaction that leads to a deviation from crew or
organizational intentions or expectations. Errors in the operational context
tend to reduce the margin of safety and increase the probability of adverse
events.
Undesired Aircraft State (UAS) - a position, condition, or attitude of an
aircraft that clearly reduces safety margins and is a result of actions by the
flight crew. It is a safety-compromising state that results from ineffective
error management.
Threats can be subdivided into two categories, latent and overt. Latent threats are
inherent in the system or organization and are often not identified until they manifest,
causing an accident or incident. Overt threats are active and present threats to safety
(e.g., weather conditions) and may be further classified as anticipated or unexpected
23
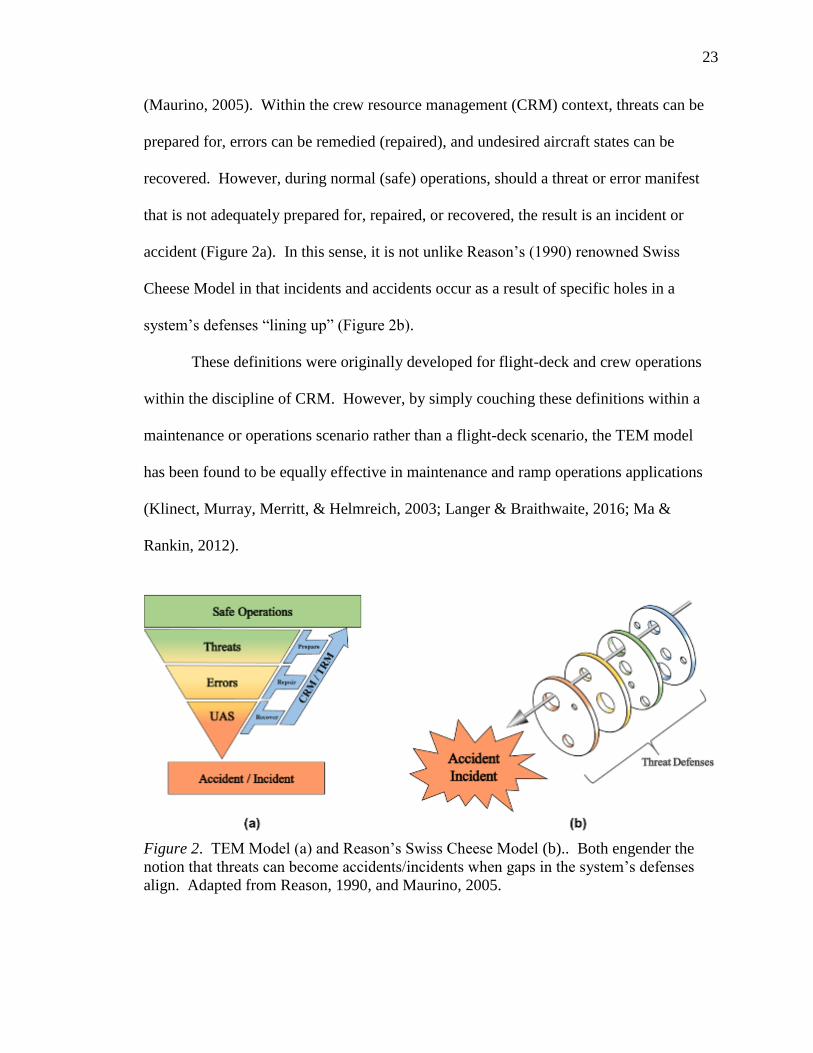
(Maurino, 2005). Within the crew resource management (CRM) context, threats can be
prepared for, errors can be remedied (repaired), and undesired aircraft states can be
recovered. However, during normal (safe) operations, should a threat or error manifest
that is not adequately prepared for, repaired, or recovered, the result is an incident or
accident (Figure 2a). In this sense, it is not unlike Reason’s (1990) renowned Swiss
Cheese Model in that incidents and accidents occur as a result of specific holes in a
system’s defenses “lining up” (Figure 2b).
These definitions were originally developed for flight-deck and crew operations
within the discipline of CRM. However, by simply couching these definitions within a
maintenance or operations scenario rather than a flight-deck scenario, the TEM model
has been found to be equally effective in maintenance and ramp operations applications
(Klinect, Murray, Merritt, & Helmreich, 2003; Langer & Braithwaite, 2016; Ma &
Rankin, 2012).
Figure 2. TEM Model (a) and Reason’s Swiss Cheese Model (b).. Both engender the
notion that threats can become accidents/incidents when gaps in the system’s defenses
align. Adapted from Reason, 1990, and Maurino, 2005.
24
TEM, LOSA, and M-LOSA
Managing threats and errors assumes they have been identified and are known to
exist. Unfortunately, this is not always the case. The Line Operations Safety Assessment
(LOSA) was originally developed, under funding from the FAA, as a joint venture
between the University of Texas at Austin Human Factors Research Project and
Continental Airlines (Crayton, Hackworth, Roberts & King, 2017; IACO, 2002).
Leveraging the TEM model, LOSA is a collection of publicly available tools for
gathering safety data during day-to-day airline operations.
LOSA is a pragmatic approach in that one of its key tenets “emphasizes
prevention through the identification of hazards and the introduction of risk mitigation
measures before the risk-bearing event occurs and adversely affects safety performance”
(Klinect, 2008, p. 6). So, while most systems prior to LOSA were reactive in nature,
responding to an accident or incident in an attempt to discover the root cause(s) and take
remedial action after-the-fact, LOSA provides a means for organizations to perform self-
assessments by monitoring routine operations to help reveal errors or threats that were
previously unknown.
This aspect of LOSA makes it an effective proactive tool in terms of threat and
error management, setting it apart from its predecessors. Another important aspect of
LOSA and LOSA-like systems is their subscription to the notion that threats and errors
can never be eliminated completely, but constant monitoring and analysis can allow an
organization to chip away at them, incrementally reducing the effects of threats and errors
over time in a cost-effective manner (FAA, 2013; Helmreich, Klinect, & Wilhelm, 2017).
Since its operational deployment in March 2001, LOSA has demonstrated its
25
effectiveness and is now in widespread use in airlines worldwide and is endorsed by the
FAA, EASA, and ICAO (FAA, 2013).
After the success of LOSA in flight operations, the FAA sponsored a project in
2008 to examine the basic LOSA methodology to determine its applicability to
maintenance and ramp operations. Together with Airlines for America (A4A, formerly
the Air Transport Association), the FAA formed the Maintenance and Ramp Human
Factors Taskforce committee. After three years of development, R-LOSA (Ramp-LOSA)
and M-LOSA (Maintenance-LOSA) were finally realized (Ma & Rankin, 2012). In order
to assure the fledgling methodology’s survival, the committee developed and tested an
entire suite of data collection tools and made them publicly available on the FAA’s
website. These tools include observation forms (ramp and maintenance operations), error
codes, threat codes, electronic database templates, basic LOSA procedures, as well as
training packages for ramp and maintenance operations (Crayton et al., 2017). The
committee also made available detailed instructions for deploying these systems as well
as cost-benefit analysis tools to help support the business case for implementation of
these systems in an organization.
Heinrich, Petersen, and Roos (1980) first presented the theory of the Heinrich
Ratio. This theory suggests that the relatively small number of catastrophic accidents are
actually just “the-tip-of-the-iceberg” and that “for every major accident, there are 10 less
serious accidents, 30 incidents, and 600 hazardous acts” (FAA, 2015, p. 6). If valid, this
theory suggests the reactive investigation of every accident has something to offer in
terms of mitigating or eliminating future accidents, thereby reducing risk. Conversely, it
also means that any proactive assessment program like M-LOSA that allows an
26
organization to discover and correct some of those 600 hazardous acts should have a
noticeable and perhaps substantial impact on accidents and incidents (Gramopadhye &
Drury, 2000). In this way, M-LOSA represents a significant improvement in the
industry’s ability to reduce accidents by working the problem of maintenance errors in
both a reactive and proactive sense. Looking more broadly at the evolution of human
factors as a discipline, it can fairly be said that incremental progress has been the norm.
Preconditions for Maintenance Errors: The Dirty Dozen
In reviewing the extant literature concerning aviation maintenance errors, a
substantial amount of research supports models and theories of human behavior as it
relates to maintenance errors (Gramopadhye & Drury, 2000; Langer & Braithwaite,
2016; Reason, 1990; Schmidt, Lawson, & Figlock, 2001). Additionally, significant effort
has been applied to generating taxonomies to accompany these models and theories to
help researchers understand what happened in terms of a given maintenance error.
However, little research exists to explain why it happened. Historically, accident
investigators have applied one or more of the aforementioned models and taxonomies to
their investigations to essentially reverse-engineer the sequence of events that made the
accident manifest physically. Boeing’s Maintenance Error Decision Aid (MEDA),
introduced in the mid-1990s, took a systems approach to merge accepted theories of
accident causation (Reason, 1990; Schmidt, Lawson, & Figlock, 2001) with a host of
contributing factors, some of which are also Dirty Dozen categories (Boeing, 2013).
MEDA’s novel approach allowed it to perform reasonably well as a reactive investigation
tool. However, much as the scientific axiom states - correlation does not equal causation,
revealing what failed in a system does not necessarily reveal the underlying reason that it
27
failed and, may even belie it to some degree. For this and other reasons, it is worthwhile
to examine the contributing factors or preconditions for maintenance errors.
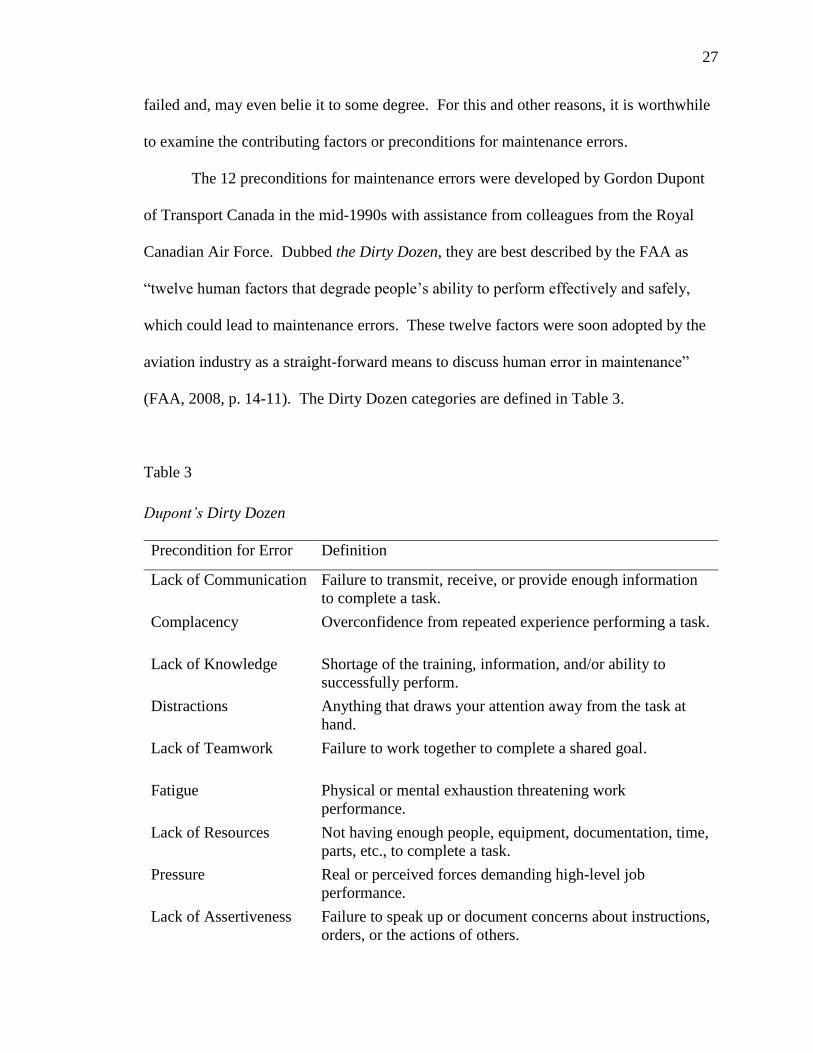
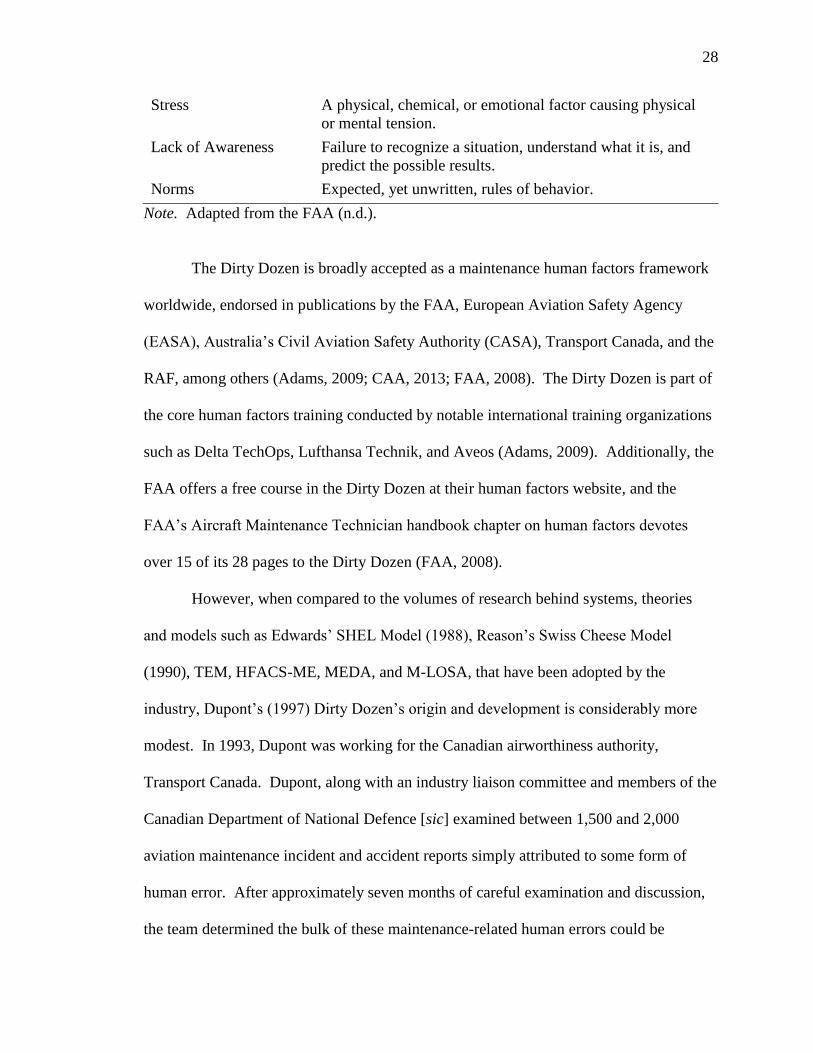
The 12 preconditions for maintenance errors were developed by Gordon Dupont
of Transport Canada in the mid-1990s with assistance from colleagues from the Royal
Canadian Air Force. Dubbed the Dirty Dozen, they are best described by the FAA as
“twelve human factors that degrade people’s ability to perform effectively and safely,
which could lead to maintenance errors. These twelve factors were soon adopted by the
aviation industry as a straight-forward means to discuss human error in maintenance”
(FAA, 2008, p. 14-11). The Dirty Dozen categories are defined in Table 3.
Table 3
Dupont’s Dirty Dozen
Precondition for Error Definition
Lack of Communication Failure to transmit, receive, or provide enough information
to complete a task.
Complacency Overconfidence from repeated experience performing a task.
Lack of Knowledge Shortage of the training, information, and/or ability to
successfully perform.
Distractions Anything that draws your attention away from the task at
hand.
Lack of Teamwork Failure to work together to complete a shared goal.
Fatigue Physical or mental exhaustion threatening work
performance.
Lack of Resources Not having enough people, equipment, documentation, time,
parts, etc., to complete a task.
Pressure Real or perceived forces demanding high-level job
performance.
Lack of Assertiveness Failure to speak up or document concerns about instructions,
orders, or the actions of others.
28
Stress A physical, chemical, or emotional factor causing physical
or mental tension.
Lack of Awareness Failure to recognize a situation, understand what it is, and
predict the possible results.
Norms Expected, yet unwritten, rules of behavior.
Note. Adapted from the FAA (n.d.).
The Dirty Dozen is broadly accepted as a maintenance human factors framework
worldwide, endorsed in publications by the FAA, European Aviation Safety Agency
(EASA), Australia’s Civil Aviation Safety Authority (CASA), Transport Canada, and the
RAF, among others (Adams, 2009; CAA, 2013; FAA, 2008). The Dirty Dozen is part of
the core human factors training conducted by notable international training organizations
such as Delta TechOps, Lufthansa Technik, and Aveos (Adams, 2009). Additionally, the
FAA offers a free course in the Dirty Dozen at their human factors website, and the
FAA’s Aircraft Maintenance Technician handbook chapter on human factors devotes
over 15 of its 28 pages to the Dirty Dozen (FAA, 2008).
However, when compared to the volumes of research behind systems, theories
and models such as Edwards’ SHEL Model (1988), Reason’s Swiss Cheese Model
(1990), TEM, HFACS-ME, MEDA, and M-LOSA, that have been adopted by the
industry, Dupont’s (1997) Dirty Dozen’s origin and development is considerably more
modest. In 1993, Dupont was working for the Canadian airworthiness authority,
Transport Canada. Dupont, along with an industry liaison committee and members of the
Canadian Department of National Defence [sic] examined between 1,500 and 2,000
aviation maintenance incident and accident reports simply attributed to some form of
human error. After approximately seven months of careful examination and discussion,
the team determined the bulk of these maintenance-related human errors could be
29
attributed to one or more of 12 basic preconditions for error (G. Dupont, personal
communication, August 10, 2017). These preconditions quickly became known as the
“Dirty Dozen”. Shortly after the run of aircraft accidents in the 80s and 90s, the FAA’s
Dr. Bill Shepherd initiated a series of meetings aimed at investigating the issue of human
factors as it relates to aircraft maintenance operations (Dupont, n.d.). It was at these
meetings between 1993 and 1997 Dupont first presented the Dirty Dozen to the
international consortium co-sponsored by the United States, Canada, and the United
Kingdom. Although, at that point, the popularity of the program was undeniable as
thousands of posters depicting the Dirty Dozen had already been ordered and shipped to
organizations worldwide (Dupont, 1997). All 12 Dirty Dozen posters can be seen in
Appendix B.
Unfortunately, the seemingly universal acceptance of the Dirty Dozen across the
aviation maintenance industry belies the amount of scientific research supporting it. The
Dirty Dozen is mentioned in a modicum of peer-reviewed publications (Latorella &
Prabhu, 2000; Patankar & Taylor, 2001). It is also discussed in the FAA’s human factors
quarterly newsletter in an article by Ma and Grower (2016) in which the authors posit the
possibility of three additional preconditions: not admitting to limitations, lack of
operational integrity, and lack of professionalism. Hobbs and Williamson (2003)
examined 17 contributing factors (preconditions) for error from several taxonomies and
found a relationship between certain types of errors and certain contributing factors.
Unfortunately, only five of the Dirty Dozen preconditions were represented in the study.
A brief mention of the Dirty Dozen is also in a NASA’s (2008) Aviation Safety
Reporting System (ASRS) monthly safety bulletin, Callback, referencing seven ASRS
30
reported accidents and how some of the 12 preconditions played a role. Apart from
these, very little scientific evidence supporting the framework’s validity in aviation
exists. This seems incongruent in an industry that has historically required a relatively
high level of rigor in terms of policies and programs it embraces.
As odd as it may seem, some level of validity and scientific rigor was found in the
field of medical science. In 2015, Marquardt, Treffenstadt, Gerstmeyer, and Gades-
Buettrich noted a lack of validated, applied models addressing cognitive performance in
the medical industry. Reasoning the technical requirements and complexity of surgical
operations are presumed to be equivalent to highly demanding work settings in other
fields, the researchers designed a survey with categories based on the Dirty Dozen
(Marquardt et al., 2015). Using the survey instrument, the researchers queried 215
practicing surgical ophthalmologists to measure any degradation of cognitive
performance of the surgical team.
This might seem like a labored analogy; however, it is not the first time aircraft
maintenance has been likened to the medical profession. In 1999, Taylor compared the
cultural attributes of aircraft mechanics, pilots, and surgeons and concluded mechanics
and surgeons shared a strong sense of individualism on the job. Later, Hobbs equated the
invasive nature and iatrogenic risk of many medical and surgical procedures to the
domain of aircraft maintenance, stating “preventative maintenance in aviation often
requires us to disassemble and inspect normally functioning systems, with the attendant
risk of error” (Hobbs, 2008, p. 2).
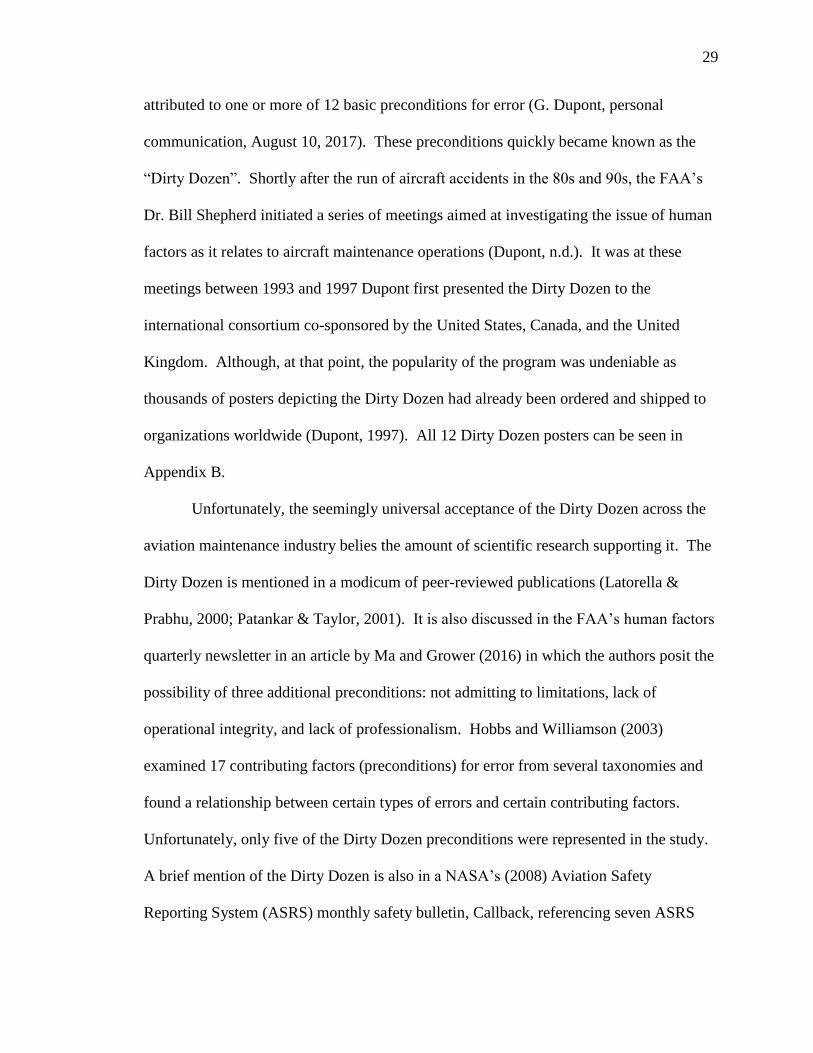
The study by Marquardt et al. (2015) noted the surveyed surgeons felt the
categories were very similar in terms of their impact on cognitive performance (Figure 3)
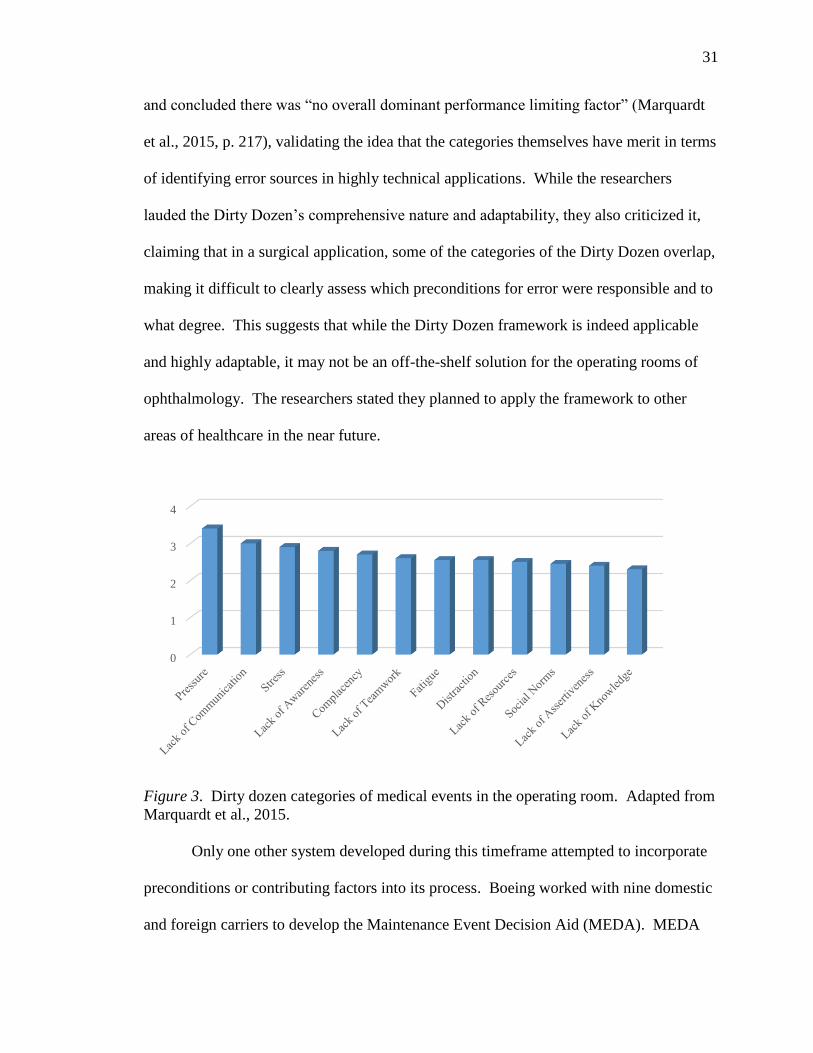
31
and concluded there was “no overall dominant performance limiting factor” (Marquardt
et al., 2015, p. 217), validating the idea that the categories themselves have merit in terms
of identifying error sources in highly technical applications. While the researchers
lauded the Dirty Dozen’s comprehensive nature and adaptability, they also criticized it,
claiming that in a surgical application, some of the categories of the Dirty Dozen overlap,
making it difficult to clearly assess which preconditions for error were responsible and to
what degree. This suggests that while the Dirty Dozen framework is indeed applicable
and highly adaptable, it may not be an off-the-shelf solution for the operating rooms of
ophthalmology. The researchers stated they planned to apply the framework to other
areas of healthcare in the near future.
Figure 3. Dirty dozen categories of medical events in the operating room. Adapted from
Marquardt et al., 2015.
Only one other system developed during this timeframe attempted to incorporate
preconditions or contributing factors into its process. Boeing worked with nine domestic
and foreign carriers to develop the Maintenance Event Decision Aid (MEDA). MEDA
0
1
2
3
4
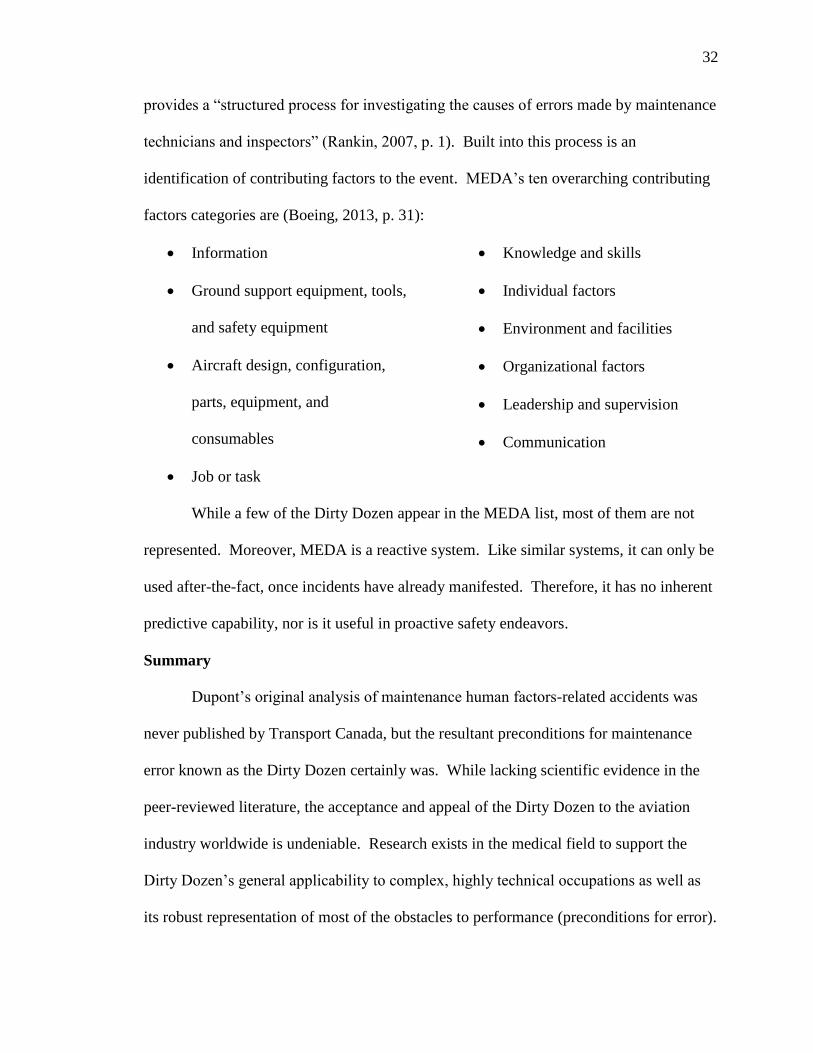
32
provides a “structured process for investigating the causes of errors made by maintenance
technicians and inspectors” (Rankin, 2007, p. 1). Built into this process is an
identification of contributing factors to the event. MEDA’s ten overarching contributing
factors categories are (Boeing, 2013, p. 31):
Information
Ground support equipment, tools,
and safety equipment
Aircraft design, configuration,
parts, equipment, and
consumables
Job or task
Knowledge and skills
Individual factors
Environment and facilities
Organizational factors
Leadership and supervision
Communication
While a few of the Dirty Dozen appear in the MEDA list, most of them are not
represented. Moreover, MEDA is a reactive system. Like similar systems, it can only be
used after-the-fact, once incidents have already manifested. Therefore, it has no inherent
predictive capability, nor is it useful in proactive safety endeavors.
Summary
Dupont’s original analysis of maintenance human factors-related accidents was
never published by Transport Canada, but the resultant preconditions for maintenance
error known as the Dirty Dozen certainly was. While lacking scientific evidence in the
peer-reviewed literature, the acceptance and appeal of the Dirty Dozen to the aviation
industry worldwide is undeniable. Research exists in the medical field to support the
Dirty Dozen’s general applicability to complex, highly technical occupations as well as
its robust representation of most of the obstacles to performance (preconditions for error).
33
Additionally, on more than one occasion, researchers have likened aircraft maintenance
to elements of the medical profession and have even gone so far as to associate certain
cultural attributes between aircraft mechanics and surgeons. One possible, albeit
simplistic explanation for the popularity and proliferation of the Dirty Dozen framework
is simply that it makes sense to aviation maintenance professionals. That is, on some
cognitive level, they recognize most or all of the 12 preconditions for maintenance errors
and identify with them based on personal experience. Whatever the reason, the Dirty
Dozen is firmly ensconced in the aviation maintenance culture around the globe.
34
CHAPTER III
METHODOLOGY
Due to the narrative nature of much of the data provided by the PA, a qualitative
research approach was proposed. Archival data were examined for the presence of the
preconditions for maintenance error known as the Dirty Dozen in order to answer the
research questions below:
1. How does the reactive data (MER) analysis compare to the proactive (MOSA)
analysis in terms of the Dirty Dozen? Do they echo similar Dirty Dozen
categories, or do they seem to reflect different aspects of the Dirty Dozen?
2. What other preconditions for maintenance error become apparent from the
analyses? What do they have in common, or are any of them similar to the
additional preconditions suggested by Ma and Grower (2016)? In terms of
typical preconditions for maintenance error, how complete is the Dirty
Dozen?
3. What insights can be gleaned from the subjective report data (MCAS) with
regard to maintenance personnel’s perceptions of the organization’s safety
culture?
The research was performed in two phases. The first phase used subject matter
experts (SMEs) to code two different types of reports (MER and MOSA) from the same
airline within the construct of the Dirty Dozen (see Figure 4). The second phase of the
research examined the PA’s most recent Maintenance Climate Awareness Survey for
insights on the organization’s safety culture. The results illustrated the overall presence
(frequency) of Dirty Dozen elements as well as measured their prevalence (intensity)
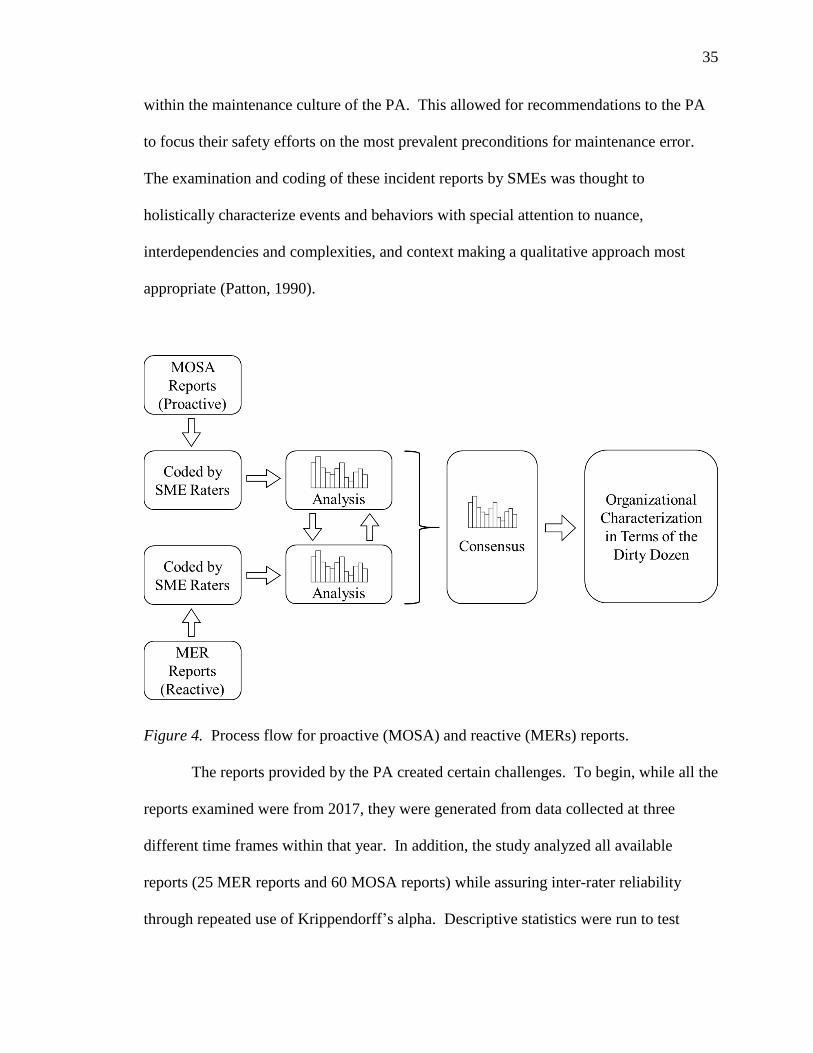
35
within the maintenance culture of the PA. This allowed for recommendations to the PA
to focus their safety efforts on the most prevalent preconditions for maintenance error.
The examination and coding of these incident reports by SMEs was thought to
holistically characterize events and behaviors with special attention to nuance,
interdependencies and complexities, and context making a qualitative approach most
appropriate (Patton, 1990).
Figure 4. Process flow for proactive (MOSA) and reactive (MERs) reports.
The reports provided by the PA created certain challenges. To begin, while all the
reports examined were from 2017, they were generated from data collected at three
different time frames within that year. In addition, the study analyzed all available
reports (25 MER reports and 60 MOSA reports) while assuring inter-rater reliability
through repeated use of Krippendorff’s alpha. Descriptive statistics were run to test
36
normality of distributions. However, none of Dupont’s previous work suggest an
assumption of normality in terms of the distribution of the Dirty Dozen in any given
organization. Thus, the limited number of reports and the nature of the data precluded
conducting certain inferential statistical analyses. Accordingly, most of the exploration
and comparisons in the current research relied on descriptive statistics and parametric
statistical analyses where appropriate (e.g., Cronbach’s alpha and Multivariate Analysis
of Variance or MANOVA). A discussion of potential impacts to reliability and validity
can be found at the end of this chapter.
Data Collection and Treatment
The first phase of the current research used aircraft maintenance SMEs to
examine and code two different sets of reports from the PA. These reports were
Maintenance Event Reports (MER) and Maintenance Operations Safety Assessments
(MOSA). The airline provided a total of 25 MERs collected between January and May
2017, and 60 MOSA reports collected between September and November 2017. Results
from the airline’s Maintenance Climate Awareness Survey (MCAS) conducted between
February and April 2017 were also provided (see Table 4).
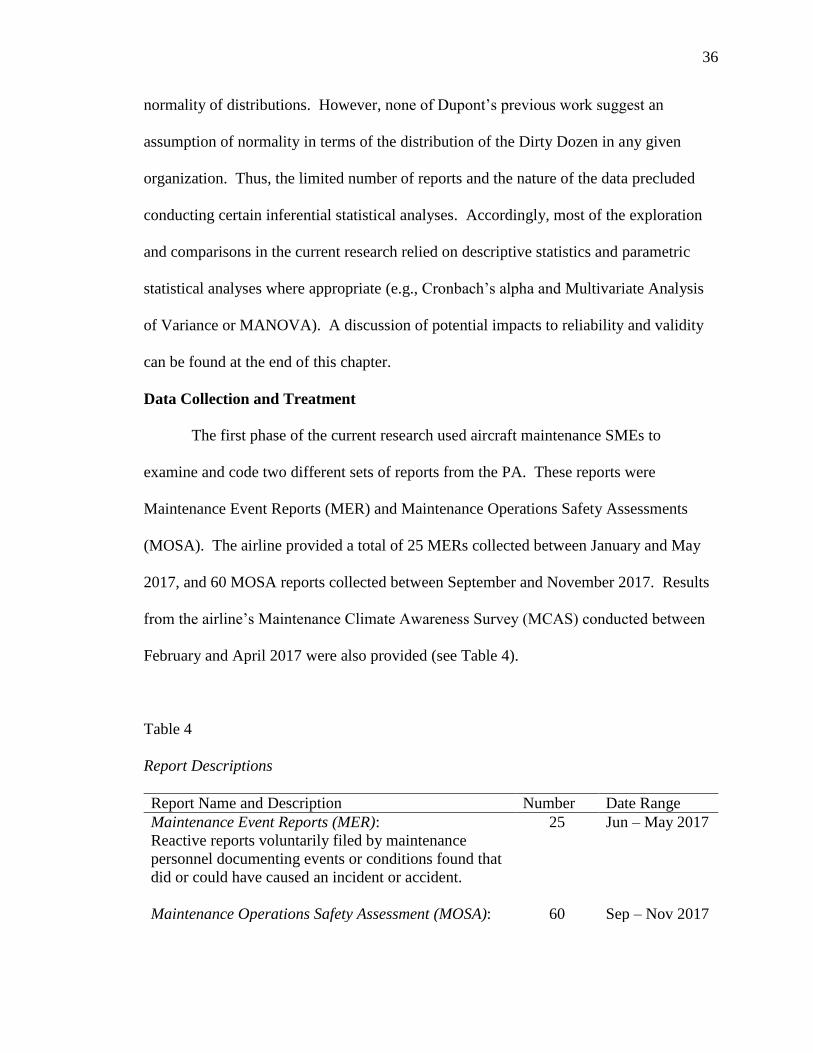
Table 4
Report Descriptions
Report Name and Description Number Date Range
Maintenance Event Reports (MER):
Reactive reports voluntarily filed by maintenance
personnel documenting events or conditions found that
did or could have caused an incident or accident.
25 Jun – May 2017
Maintenance Operations Safety Assessment (MOSA): 60 Sep – Nov 2017
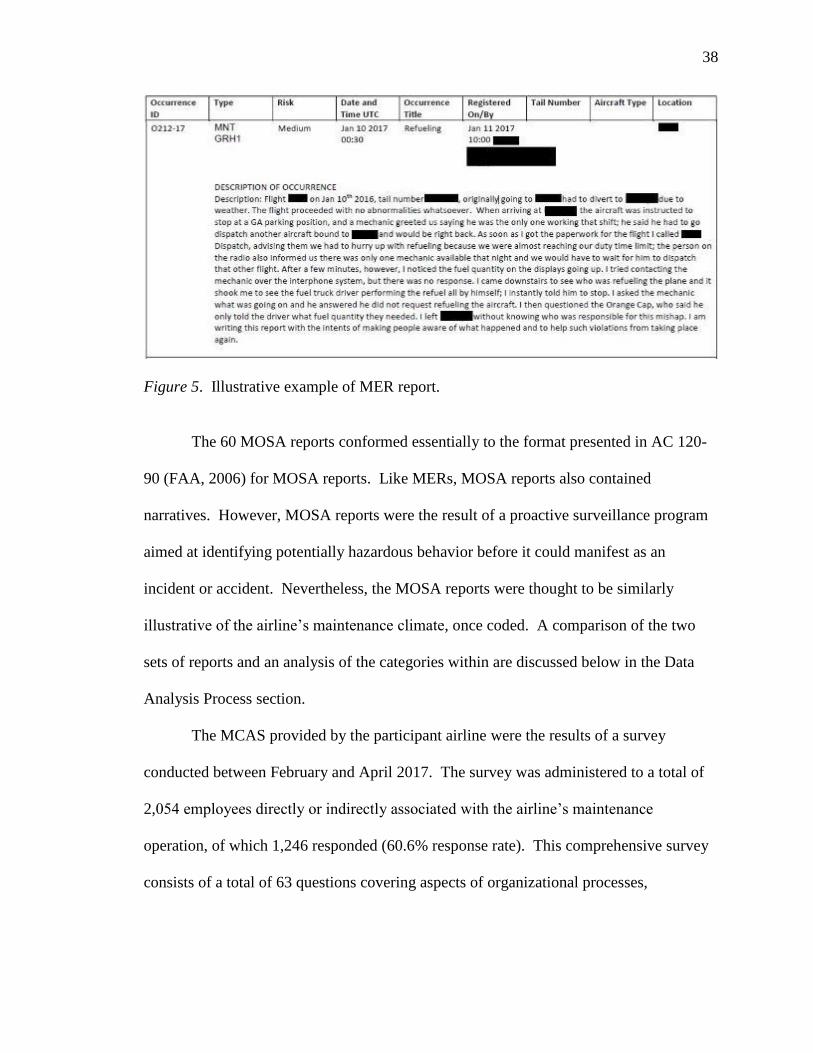
37
Proactive reports generated by periodic internal MOSA
team assessments during which trained MOSA auditors
observe a variety of maintenance tasks. Specific
categories of observations can be found in Appendix E.
Maintenance Climate Awareness Survey (MCAS):
Results of an anonymous survey (subjective) to which
1,246 maintenance related personnel responded. The
four categories of the survey included organizational
processes, organization climate, resources, and
supervision. The survey also included five additional
open-response questions.
26 Feb – Apr 2017
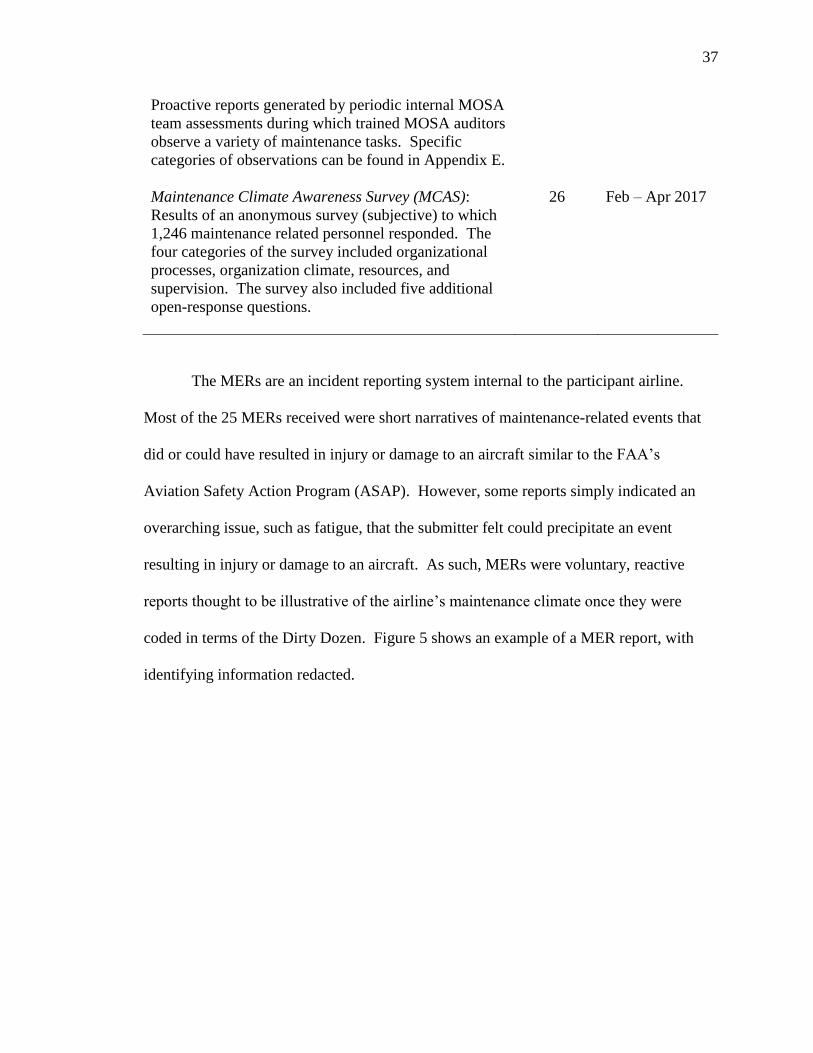
The MERs are an incident reporting system internal to the participant airline.
Most of the 25 MERs received were short narratives of maintenance-related events that
did or could have resulted in injury or damage to an aircraft similar to the FAA’s
Aviation Safety Action Program (ASAP). However, some reports simply indicated an
overarching issue, such as fatigue, that the submitter felt could precipitate an event
resulting in injury or damage to an aircraft. As such, MERs were voluntary, reactive
reports thought to be illustrative of the airline’s maintenance climate once they were
coded in terms of the Dirty Dozen. Figure 5 shows an example of a MER report, with
identifying information redacted.
38
Figure 5. Illustrative example of MER report.
The 60 MOSA reports conformed essentially to the format presented in AC 120-
90 (FAA, 2006) for MOSA reports. Like MERs, MOSA reports also contained
narratives. However, MOSA reports were the result of a proactive surveillance program
aimed at identifying potentially hazardous behavior before it could manifest as an
incident or accident. Nevertheless, the MOSA reports were thought to be similarly
illustrative of the airline’s maintenance climate, once coded. A comparison of the two
sets of reports and an analysis of the categories within are discussed below in the Data
Analysis Process section.
The MCAS provided by the participant airline were the results of a survey
conducted between February and April 2017. The survey was administered to a total of
2,054 employees directly or indirectly associated with the airline’s maintenance
operation, of which 1,246 responded (60.6% response rate). This comprehensive survey
consists of a total of 63 questions covering aspects of organizational processes,
39
organizational climate, resources, and supervision. Five open questions were posed at the
end of the survey, one of which was deemed relevant and was examined as well.
While not every category of the Dirty Dozen was reflected in the survey, many of
them were. Moreover, some categories of the Dirty Dozen were often represented by
multiple survey questions, making the MCAS a robust portrayal of the maintenance
climate at the PA as viewed by its maintenance personnel.
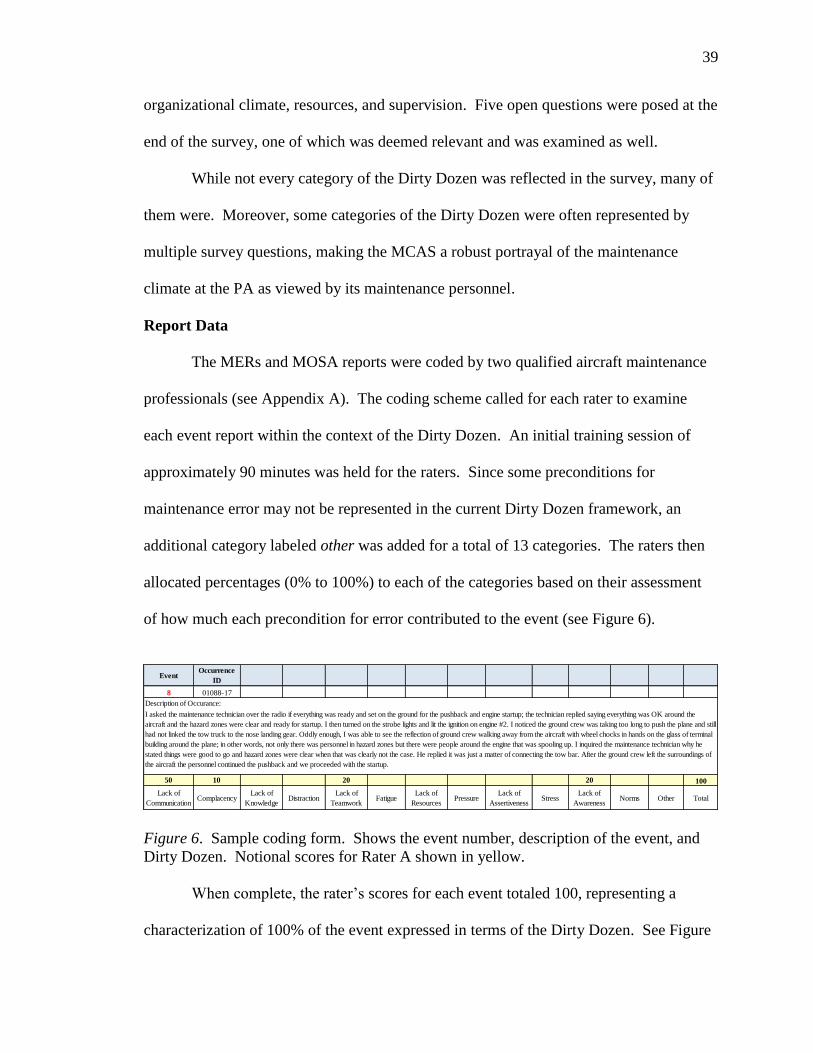
Report Data
The MERs and MOSA reports were coded by two qualified aircraft maintenance
professionals (see Appendix A). The coding scheme called for each rater to examine
each event report within the context of the Dirty Dozen. An initial training session of
approximately 90 minutes was held for the raters. Since some preconditions for
maintenance error may not be represented in the current Dirty Dozen framework, an
additional category labeled other was added for a total of 13 categories. The raters then
allocated percentages (0% to 100%) to each of the categories based on their assessment
of how much each precondition for error contributed to the event (see Figure 6).
Figure 6. Sample coding form. Shows the event number, description of the event, and
Dirty Dozen. Notional scores for Rater A shown in yellow.
When complete, the rater’s scores for each event totaled 100, representing a
characterization of 100% of the event expressed in terms of the Dirty Dozen. See Figure
EventOccurrence
ID
8 01088-17
50 10 20 20 100
Lack of
CommunicationComplacency
Lack of
KnowledgeDistraction
Lack of
TeamworkFatigue
Lack of
ResourcesPressure
Lack of
AssertivenessStress
Lack of
AwarenessNorms Other Total
Description of Occurance:
I asked the maintenance technician over the radio if everything was ready and set on the ground for the pushback and engine startup; the technician replied saying everything was OK around the
aircraft and the hazard zones were clear and ready for startup. I then turned on the strobe lights and lit the ignition on engine #2. I noticed the ground crew was taking too long to push the plane and still
had not linked the tow truck to the nose landing gear. Oddly enough, I was able to see the reflection of ground crew walking away from the aircraft with wheel chocks in hands on the glass of terminal
building around the plane; in other words, not only there was personnel in hazard zones but there were people around the engine that was spooling up. I inquired the maintenance technician why he
stated things were good to go and hazard zones were clear when that was clearly not the case. He replied it was just a matter of connecting the tow bar. After the ground crew left the surroundings of
the aircraft the personnel continued the pushback and we proceeded with the startup.
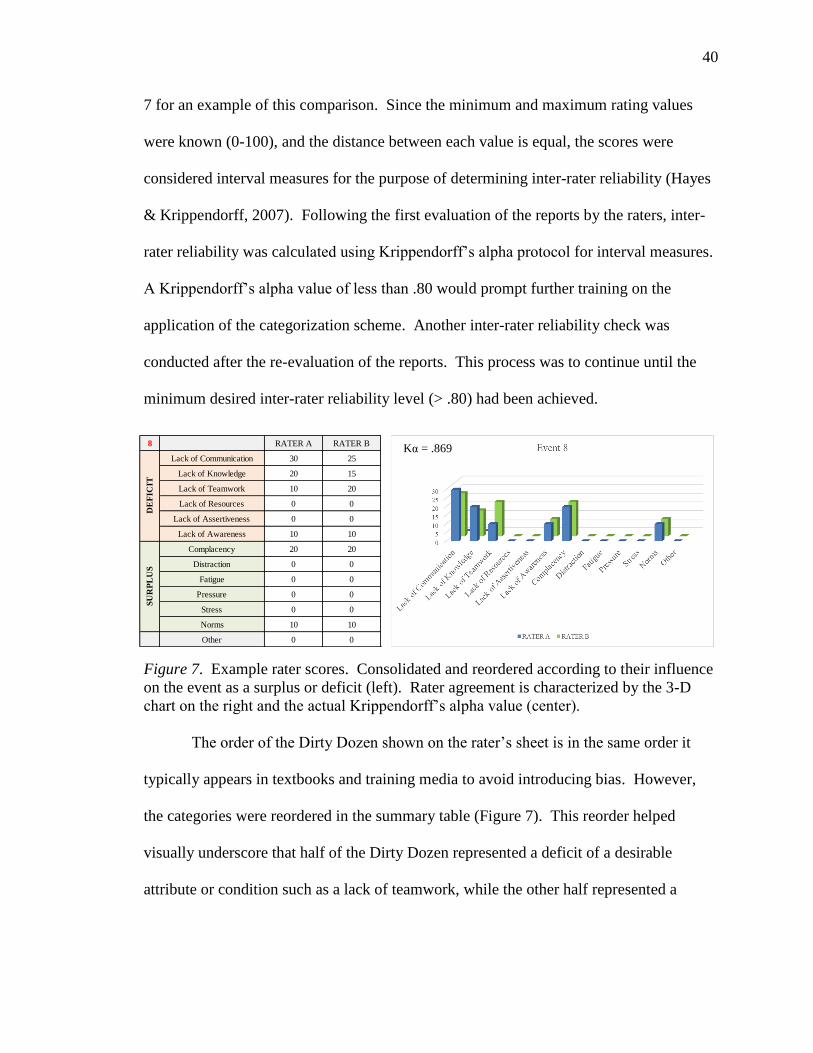
40
7 for an example of this comparison. Since the minimum and maximum rating values
were known (0-100), and the distance between each value is equal, the scores were
considered interval measures for the purpose of determining inter-rater reliability (Hayes
& Krippendorff, 2007). Following the first evaluation of the reports by the raters, inter-
rater reliability was calculated using Krippendorff’s alpha protocol for interval measures.
A Krippendorff’s alpha value of less than .80 would prompt further training on the
application of the categorization scheme. Another inter-rater reliability check was
conducted after the re-evaluation of the reports. This process was to continue until the
minimum desired inter-rater reliability level (> .80) had been achieved.
Figure 7. Example rater scores. Consolidated and reordered according to their influence
on the event as a surplus or deficit (left). Rater agreement is characterized by the 3-D
chart on the right and the actual Krippendorff’s alpha value (center).
The order of the Dirty Dozen shown on the rater’s sheet is in the same order it
typically appears in textbooks and training media to avoid introducing bias. However,
the categories were reordered in the summary table (Figure 7). This reorder helped
visually underscore that half of the Dirty Dozen represented a deficit of a desirable
attribute or condition such as a lack of teamwork, while the other half represented a
8 RATER A RATER B Krippendorff's α
Lack of Communication 30 25 (Interval)
Lack of Knowledge 20 15 .938
Lack of Teamwork 10 20
Lack of Resources 0 0
Lack of Assertiveness 0 0
Lack of Awareness 10 10
Complacency 20 20
Distraction 0 0
Fatigue 0 0
Pressure 0 0
Stress 0 0
Norms 10 10
Other 0 0
DE
FIC
ITS
UR
PL
US
Kα = .869
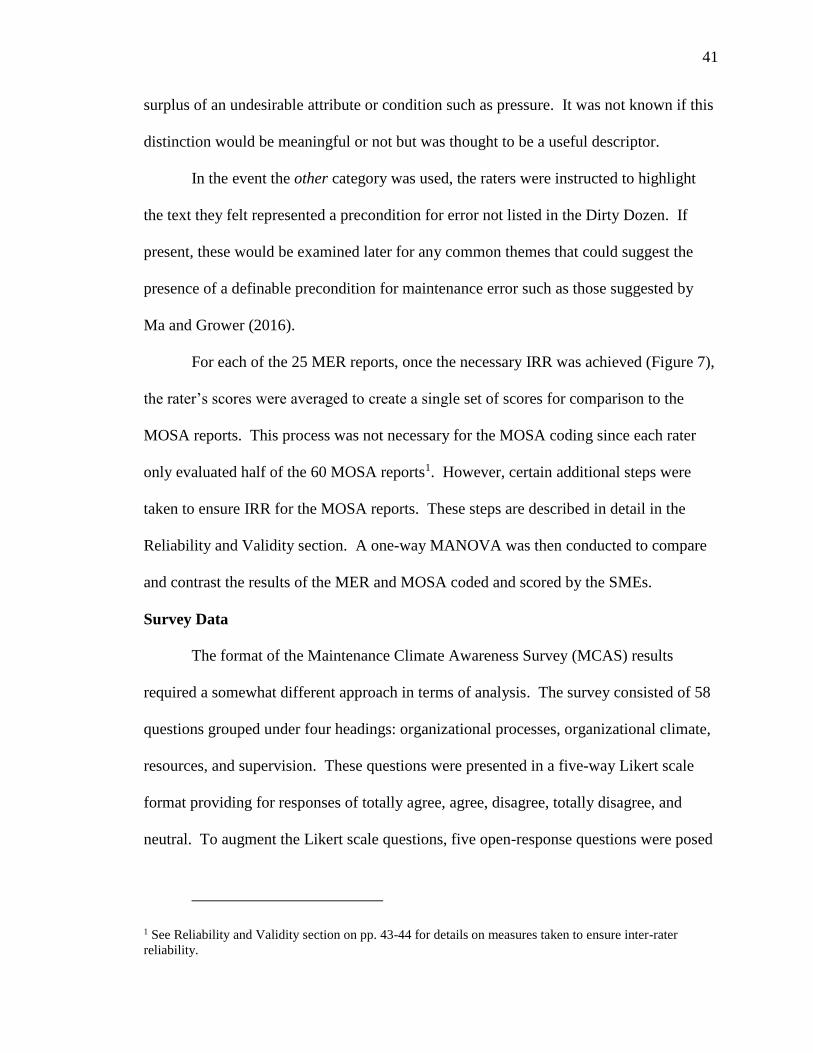
41
surplus of an undesirable attribute or condition such as pressure. It was not known if this
distinction would be meaningful or not but was thought to be a useful descriptor.
In the event the other category was used, the raters were instructed to highlight
the text they felt represented a precondition for error not listed in the Dirty Dozen. If
present, these would be examined later for any common themes that could suggest the
presence of a definable precondition for maintenance error such as those suggested by
Ma and Grower (2016).
For each of the 25 MER reports, once the necessary IRR was achieved (Figure 7),
the rater’s scores were averaged to create a single set of scores for comparison to the
MOSA reports. This process was not necessary for the MOSA coding since each rater
only evaluated half of the 60 MOSA reports1. However, certain additional steps were
taken to ensure IRR for the MOSA reports. These steps are described in detail in the
Reliability and Validity section. A one-way MANOVA was then conducted to compare
and contrast the results of the MER and MOSA coded and scored by the SMEs.
Survey Data
The format of the Maintenance Climate Awareness Survey (MCAS) results
required a somewhat different approach in terms of analysis. The survey consisted of 58
questions grouped under four headings: organizational processes, organizational climate,
resources, and supervision. These questions were presented in a five-way Likert scale
format providing for responses of totally agree, agree, disagree, totally disagree, and
neutral. To augment the Likert scale questions, five open-response questions were posed
1 See Reliability and Validity section on pp. 43-44 for details on measures taken to ensure inter-rater
reliability.
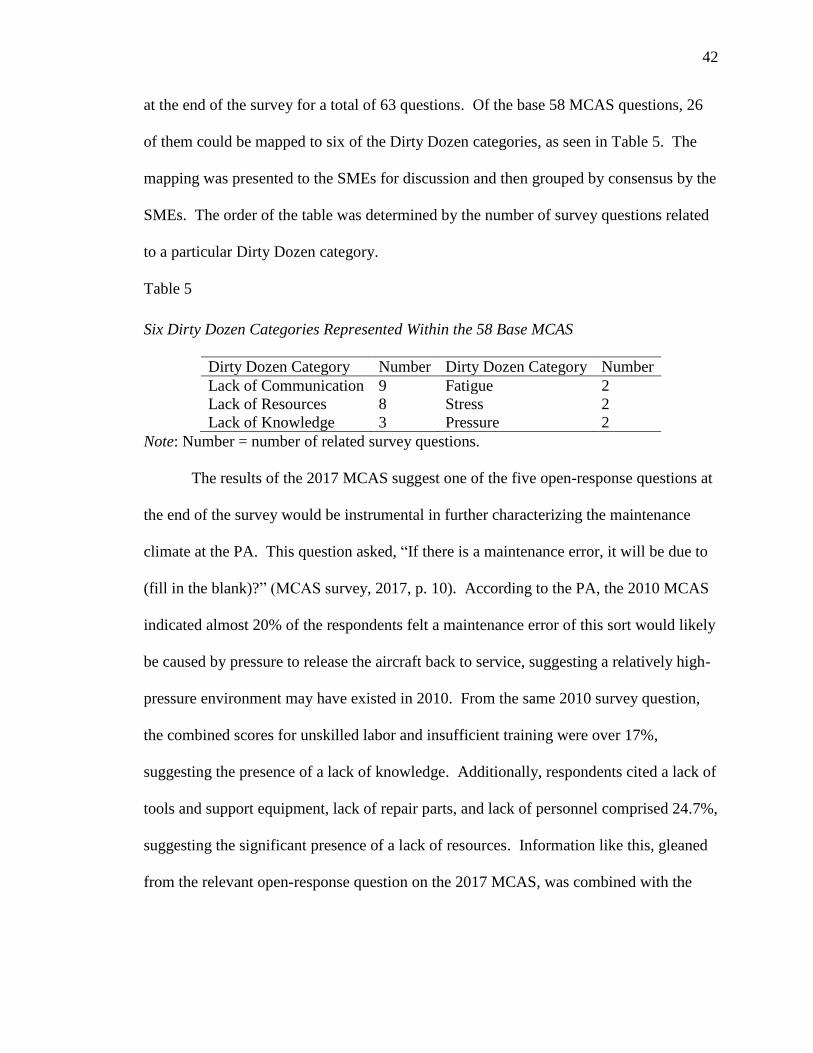
42
at the end of the survey for a total of 63 questions. Of the base 58 MCAS questions, 26
of them could be mapped to six of the Dirty Dozen categories, as seen in Table 5. The
mapping was presented to the SMEs for discussion and then grouped by consensus by the
SMEs. The order of the table was determined by the number of survey questions related
to a particular Dirty Dozen category.
Table 5
Six Dirty Dozen Categories Represented Within the 58 Base MCAS
Dirty Dozen Category Number Dirty Dozen Category Number
Lack of Communication 9 Fatigue 2
Lack of Resources 8 Stress 2
Lack of Knowledge 3 Pressure 2
Note: Number = number of related survey questions.
The results of the 2017 MCAS suggest one of the five open-response questions at
the end of the survey would be instrumental in further characterizing the maintenance
climate at the PA. This question asked, “If there is a maintenance error, it will be due to
(fill in the blank)?” (MCAS survey, 2017, p. 10). According to the PA, the 2010 MCAS
indicated almost 20% of the respondents felt a maintenance error of this sort would likely
be caused by pressure to release the aircraft back to service, suggesting a relatively high-
pressure environment may have existed in 2010. From the same 2010 survey question,
the combined scores for unskilled labor and insufficient training were over 17%,
suggesting the presence of a lack of knowledge. Additionally, respondents cited a lack of
tools and support equipment, lack of repair parts, and lack of personnel comprised 24.7%,
suggesting the significant presence of a lack of resources. Information like this, gleaned
from the relevant open-response question on the 2017 MCAS, was combined with the
43
characterization derived from the analysis of the other 58 survey questions to synthesize
and illustrate the organizational character in terms of the Dirty Dozen.
The three-pronged analysis of proactive data (MOSA), reactive data (MERs), and
subjective data (MCAS) in this study was thought to yield an insightful report with
actionable components within the Dirty Dozen construct despite the paucity of certain
data. These components were then prioritized to recommend maintenance error
mitigation strategies for the PA.
Rater Selection
The two raters were selected based on the following criteria established a priori.
The candidates must be FAA certificated Airframe & Power Plant (A&P) mechanics,
preferably certificated for 20 years or more. The candidates must have knowledge and
experience with the Dirty Dozen, preferably in a training and/or human factors
environment. The use of raters with such specific qualifications was thought to enhance
overall reliability and validity of the study. Biographies of the raters can be found in
Appendix A.
Reliability and Validity
Since the data used in the current research had been collected previously, certain
issues had to be addressed in order to improve aspects of reliability and validity
throughout the study. A variety of steps were taken to address these issues including
frequent use of Krippendorff’s alpha to ensure inter-rater reliability for MER and MOSA
reports as well as Crohnbach’s alpha to quantify the internal consistency of the MCAS
survey.
44
Reliability. Statistical reliability, as it applies to the current research, concerns
itself with the consistency of the data used. Of particular concern was the reliability of
the raters as they coded the MER and MOSA reports, as well as the reliability of the
MCAS as a survey instrument. To enhance reliability of the coding process, the SMEs
underwent approximately 90 minutes of initial training. The training was conducted by
the researcher and covered report types (reactive: MER vs. proactive: MOSA), scoring
each event in the reports, and the importance of inter-rater reliability (IRR) and how it
was to be calculated using a Krippendorff’s alpha protocol. Although many ways exist to
calculate IRR, Krippendorff’s alpha lends itself to this study particularly well since it is a
robust calculation tolerant of differing sample sizes, missing data, number of coders, and
most metrics (e.g., nominal, ordinal, interval, and ratio). Since the minimum and
maximum rating values were known (0-100) and the distance between each value is
equal, the scores were considered interval measures for the purpose of calculating IRR.
In accordance with Krippendorff’s (2007) suggestion, the minimum alpha level for the
study was established as α ≥ 0.80. Any alpha values calculated lower than .80 constituted
grounds for retraining of the raters. Reliability, in terms of the MCAS survey, was
characterized by calculating its internal consistency using Cronbach’s alpha calculation
with a minimal acceptable value of α ≥ 0.70.
Validity. The validity of the data is likewise of statistical concern as it is
important to know the methods used actually demonstrate what the researcher claims they
will demonstrate. Since the validity of the coding process for the MER and MOSA
reports depended so heavily on the experience of the raters selected, certain qualifications
became mandatory such as the raters must be (a) FAA rated A&P mechanics, (b) have
45
more than 20 years in said rating, and (c) be intimately familiar with Dupont’s Dirty
Dozen, preferably from experience gained in a teaching capacity. The codes used by the
SMEs are considered valid since the codes, or categories, used by the raters are Dupont’s
Dirty Dozen preconditions being sought. However, since the literature suggests that
other preconditions may exist, a thirteenth category (other) was added to the initial 12
codes to account for this possibility.
Prior to being issued the entire set of reports, a calibration set was sent to each
rater. For the MERs, the calibration set consisted of three reports (≈10%) randomly
selected from the 25 cases provided by the PA. Since each rater was to evaluate all 25
reports, any disparity between them would be easily identified. For the 60 MOSA
reports, six reports (10%) were randomly selected and sent to the raters for calibration.
Once satisfied with an IRR α ≥ 0.80, reports 1-30 were sent to Rater A and 31-60 to Rater
B. In addition, Rater A received three randomly selected reports from the 30 sent to
Rater B, and Rater B was sent three randomly selected reports from the 30 sent to Rater
A. Again, the Krippendorff’s alpha calculation was applied to verify IRR in the final
MOSA analysis.
During a separate meeting, the SMEs were asked to review the MCAS questions
to establish which Dirty Dozen category, if any, was represented by that question. It was
apparent that not all of the Dirty Dozen categories would be well represented, particularly
in a survey not consciously designed with the Dirty Dozen in mind. However, a
consensus was reached, and the raters agreed that nine questions related to a lack of
communication, eight questions related to a lack of resources, three questions related to a
lack of knowledge, and two questions each related to fatigue, pressure, and stress. The
46
characterization of these six categories were expected to agree, to some extent, with the
characterization developed in the analysis of the MER and MOSA reports. In this sense,
although all 12 of the Dirty Dozen are not represented, the MCAS analysis was to serve
as a confirmatory evaluation of relationships found to exist between the MER and MOSA
reports. Also, in accordance with the findings of Johnson (1997) and Golafshani (2003),
the use of two raters with such specific qualifications coupled with a third document type
(MCAS) was thought to enhance overall validity, a technique called triangulation.
Ethical Considerations
This research relied on three types of reports provided by the PA. While these
data are not publicly available, the data are archival in nature, and all references to
personnel names and employee numbers were expunged from the data prior to being
delivered to the researcher for analysis. Nevertheless, in accordance with university
policy, an application for Institutional Review Board (IRB) for Exempt Determination
was submitted on January 2nd, 2018. Since the researcher, committee members, and
raters had signed non-disclosure agreements with the PA and there was no way to trace
report results back to airline personnel, the research was granted exempt status by the
IRB on January 5th, 2018.
Data Analysis Process
Once the 25 MER reports were coded by the SMEs and IRR was assured as
described in the previous section, a single set of Dirty Dozen scores were needed to
enable a comparison to the MOSA reports. Considering the lowest IRR value was .918,
any disparate scores between raters were averaged to create a single score for that Dirty
Dozen category in that particular case. This process was not needed for the MOSA
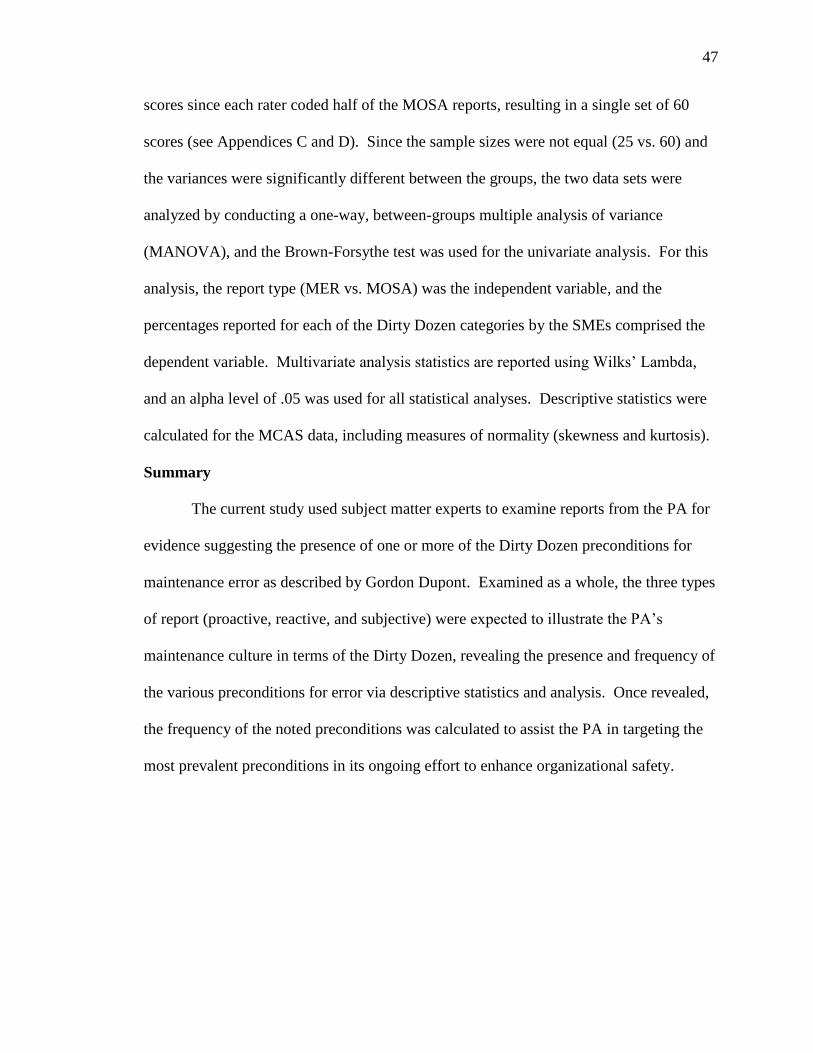
47
scores since each rater coded half of the MOSA reports, resulting in a single set of 60
scores (see Appendices C and D). Since the sample sizes were not equal (25 vs. 60) and
the variances were significantly different between the groups, the two data sets were
analyzed by conducting a one-way, between-groups multiple analysis of variance
(MANOVA), and the Brown-Forsythe test was used for the univariate analysis. For this
analysis, the report type (MER vs. MOSA) was the independent variable, and the
percentages reported for each of the Dirty Dozen categories by the SMEs comprised the
dependent variable. Multivariate analysis statistics are reported using Wilks’ Lambda,
and an alpha level of .05 was used for all statistical analyses. Descriptive statistics were
calculated for the MCAS data, including measures of normality (skewness and kurtosis).
Summary
The current study used subject matter experts to examine reports from the PA for
evidence suggesting the presence of one or more of the Dirty Dozen preconditions for
maintenance error as described by Gordon Dupont. Examined as a whole, the three types
of report (proactive, reactive, and subjective) were expected to illustrate the PA’s
maintenance culture in terms of the Dirty Dozen, revealing the presence and frequency of
the various preconditions for error via descriptive statistics and analysis. Once revealed,
the frequency of the noted preconditions was calculated to assist the PA in targeting the
most prevalent preconditions in its ongoing effort to enhance organizational safety.
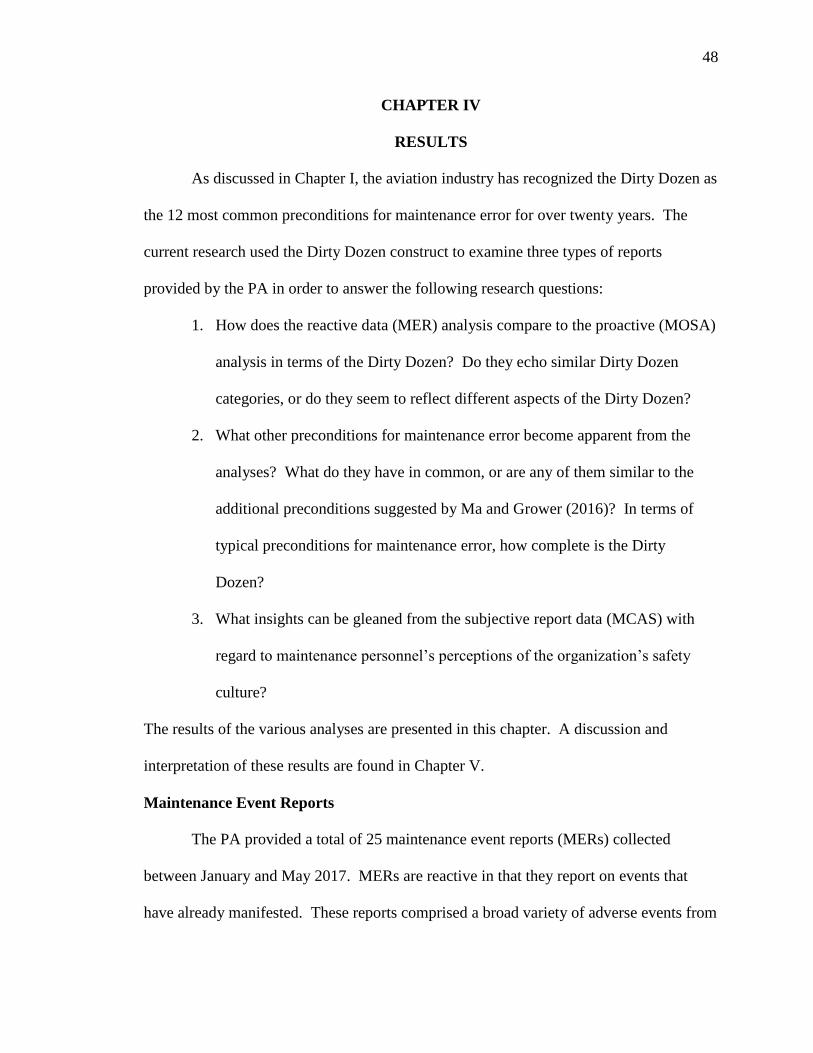
48
CHAPTER IV
RESULTS
As discussed in Chapter I, the aviation industry has recognized the Dirty Dozen as
the 12 most common preconditions for maintenance error for over twenty years. The
current research used the Dirty Dozen construct to examine three types of reports
provided by the PA in order to answer the following research questions:
1. How does the reactive data (MER) analysis compare to the proactive (MOSA)
analysis in terms of the Dirty Dozen? Do they echo similar Dirty Dozen
categories, or do they seem to reflect different aspects of the Dirty Dozen?
2. What other preconditions for maintenance error become apparent from the
analyses? What do they have in common, or are any of them similar to the
additional preconditions suggested by Ma and Grower (2016)? In terms of
typical preconditions for maintenance error, how complete is the Dirty
Dozen?
3. What insights can be gleaned from the subjective report data (MCAS) with
regard to maintenance personnel’s perceptions of the organization’s safety
culture?
The results of the various analyses are presented in this chapter. A discussion and
interpretation of these results are found in Chapter V.
Maintenance Event Reports
The PA provided a total of 25 maintenance event reports (MERs) collected
between January and May 2017. MERs are reactive in that they report on events that
have already manifested. These reports comprised a broad variety of adverse events from
49
simple miscommunications, to pointing out procedural issues, to understaffing, to a host
of other safety issues. As discussed in Chapter III, the minimum and maximum rating
values are known (0-100), and the distance between each value is equal, thus the scores
were considered interval measures for the purpose of calculating inter-rater reliability. A
Krippendorff’s alpha value of .80 was established as the minimum acceptable value.
After an initial 90-minute training session, the raters each examined and scored a sample
of the MERs (six, or ≈ 20%). Inter-rater reliability (IRR) was calculated at .55. Since a
minimum desired score was .80, the raters received additional training on the application
of the Dirty Dozen categorization scheme discussed in Chapter III. Six new MERs were
selected and given to the raters to evaluate, and another IRR test was conducted. This
time the lowest Krippendorff’s alpha value was .92. With IRR well above the minimum
level, each rater was given the remainder of the 25 MERs to assess. Reliability was
calculated one last time resulting in a mean value of .97. The results for report number 5
are shown in Figure 8 as an example. The summary results for all 25 reports can be
found in Appendix C. The 25 MER results were then combined to show the contribution
of each Dirty Dozen element to the overarching characterization created by the MERs
(see Figure 9).
50
Figure 8. MER report 5 results.. Includes Krippendorff’s alpha value.
Figure 9. Frequency of Dirty Dozen categories from MERs.
As posited in Chapter III, each category of the Dirty Dozen can be thought of as
either a surplus of an undesirable trait, such as distraction or fatigue, or a deficit of a
desirable trait, such as knowledge or resources. To characterize the relationship between
these two factors, the categories were re-ordered by frequency, as shown in Figure 10.
5 RATER A RATER B Krippendorff's α
Lack of Communication 0 0 (Interval)
Lack of Knowledge 0 0 .928
Lack of Teamwork 0 0
Lack of Resources 0 0
Lack of Assertiveness 0 0
Lack of Awareness 20 30
Complacency 20 20
Distraction 20 20
Fatigue 20 20
Pressure 20 10
Stress 0 0
Norms 0 0
Other 0 0
DE
FIC
ITS
UR
PL
US
Krippendorff’s
alpha = .928
Lack of Communication 428
Lack of Knowledge 223
Lack of Teamwork 260
Lack of Resources 338
Lack of Assertiveness 78
Lack of Awareness 233
Complacency 293
Distraction 45
Fatigue 158
Pressure 133
Stress 38
Norms 278
Other 0
Combined MER Values
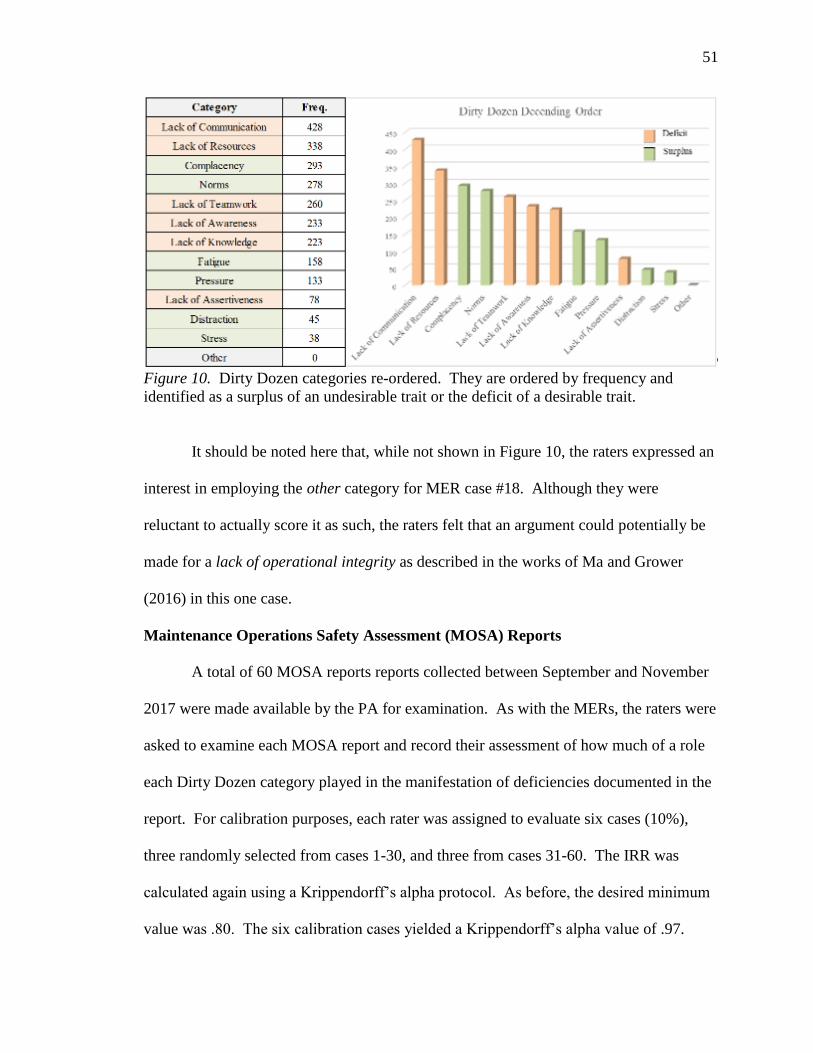
51
Figure 10. Dirty Dozen categories re-ordered. They are ordered by frequency and
identified as a surplus of an undesirable trait or the deficit of a desirable trait.
It should be noted here that, while not shown in Figure 10, the raters expressed an
interest in employing the other category for MER case #18. Although they were
reluctant to actually score it as such, the raters felt that an argument could potentially be
made for a lack of operational integrity as described in the works of Ma and Grower
(2016) in this one case.
Maintenance Operations Safety Assessment (MOSA) Reports
A total of 60 MOSA reports reports collected between September and November
2017 were made available by the PA for examination. As with the MERs, the raters were
asked to examine each MOSA report and record their assessment of how much of a role
each Dirty Dozen category played in the manifestation of deficiencies documented in the
report. For calibration purposes, each rater was assigned to evaluate six cases (10%),
three randomly selected from cases 1-30, and three from cases 31-60. The IRR was
calculated again using a Krippendorff’s alpha protocol. As before, the desired minimum
value was .80. The six calibration cases yielded a Krippendorff’s alpha value of .97.
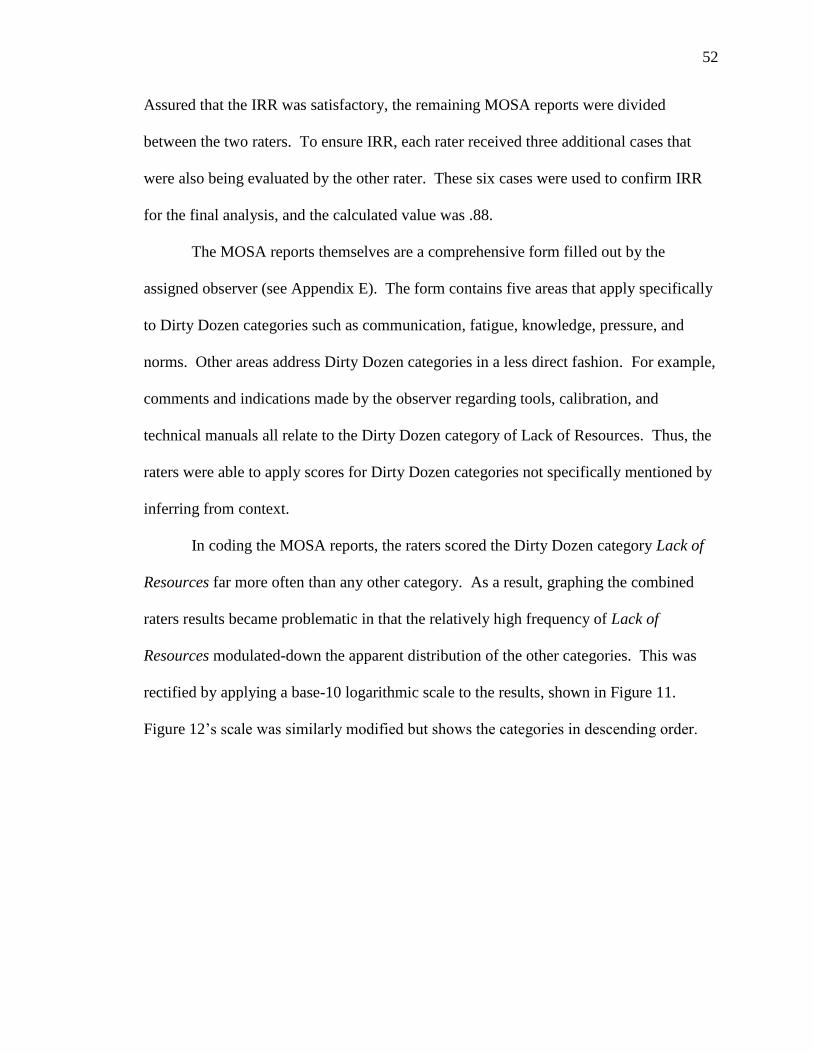
52
Assured that the IRR was satisfactory, the remaining MOSA reports were divided
between the two raters. To ensure IRR, each rater received three additional cases that
were also being evaluated by the other rater. These six cases were used to confirm IRR
for the final analysis, and the calculated value was .88.
The MOSA reports themselves are a comprehensive form filled out by the
assigned observer (see Appendix E). The form contains five areas that apply specifically
to Dirty Dozen categories such as communication, fatigue, knowledge, pressure, and
norms. Other areas address Dirty Dozen categories in a less direct fashion. For example,
comments and indications made by the observer regarding tools, calibration, and
technical manuals all relate to the Dirty Dozen category of Lack of Resources. Thus, the
raters were able to apply scores for Dirty Dozen categories not specifically mentioned by
inferring from context.
In coding the MOSA reports, the raters scored the Dirty Dozen category Lack of
Resources far more often than any other category. As a result, graphing the combined
raters results became problematic in that the relatively high frequency of Lack of
Resources modulated-down the apparent distribution of the other categories. This was
rectified by applying a base-10 logarithmic scale to the results, shown in Figure 11.
Figure 12’s scale was similarly modified but shows the categories in descending order.
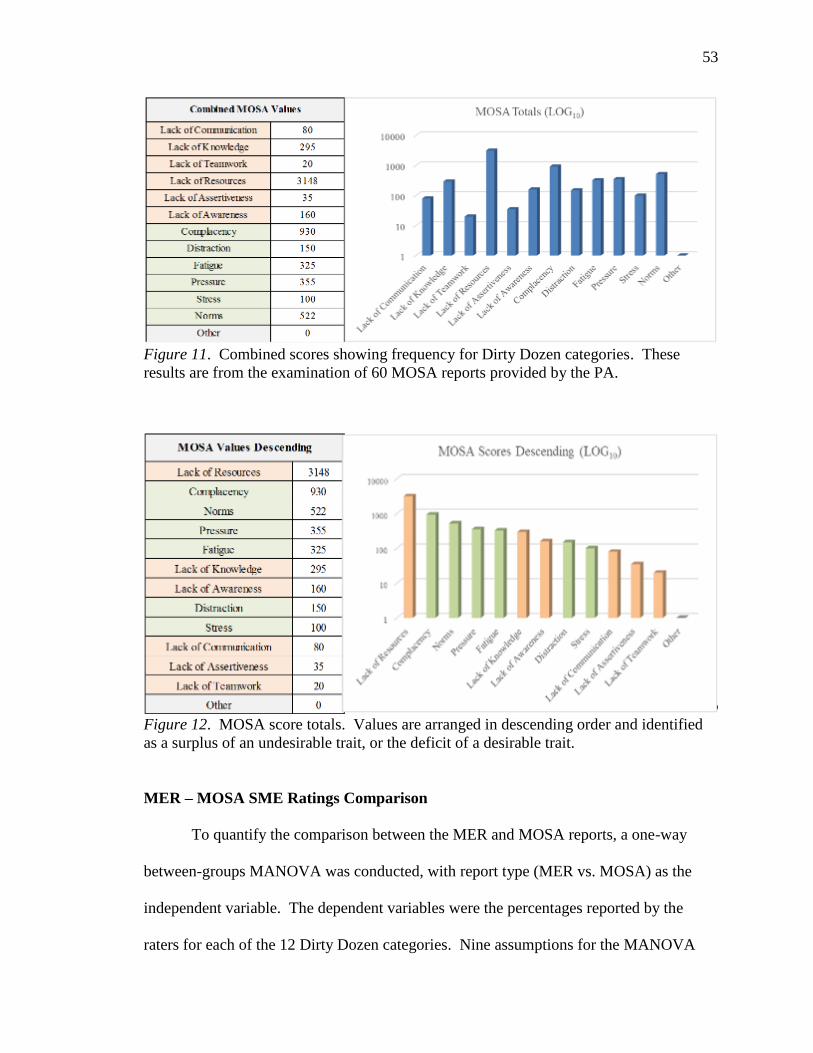
53
Figure 11. Combined scores showing frequency for Dirty Dozen categories. These
results are from the examination of 60 MOSA reports provided by the PA.
Figure 12. MOSA score totals. Values are arranged in descending order and identified
as a surplus of an undesirable trait, or the deficit of a desirable trait.
MER – MOSA SME Ratings Comparison
To quantify the comparison between the MER and MOSA reports, a one-way
between-groups MANOVA was conducted, with report type (MER vs. MOSA) as the
independent variable. The dependent variables were the percentages reported by the
raters for each of the 12 Dirty Dozen categories. Nine assumptions for the MANOVA
54
were examined, following the guidance provided in Hair, Black, Babin, and Anderson
(2010). These assumptions are discussed in turn.
Assumption #1: Two or more dependent variables measured at the interval or
ratio level. Assumption met since the ratings were continuous variables,
measured from 0 to 100.
Assumption #2: Independent variable consisted of two or more categorical,
independent groups. Assumption met since report type consisted of two groups
(MER and MOSA).
Assumption #3: Independence of observations. Assumption met since the two
types of reports (MER, MOSA) were independent.
Assumption #4: Adequate sample size. Assumption met since more cases were in
each group (MER = 25; MOSA = 60) than the number of dependent variables
(Dirty Dozen categories = 12) analyzed.
Assumption #5: No multivariate outliers. Assumption partially met. Four of the
95 cases showed multivariate outliers, as assessed by Mahalanobis distance (p <
.001).
Assumption #6: Multivariate and univariate normality. Assumption not met. The
Shapiro-Wilk test of normality was significant (p < .001) across all dependent
variables. However, as noted earlier, the relatively high frequency of Lack of
Resources modulated down the apparent distribution of the other categories. With
regard to univariate normality, the ratio of both skewness and kurtosis to their
respective standard error can be used as a test for normality of a distribution. A
distribution can be considered normal so long as the absolute value of skewness
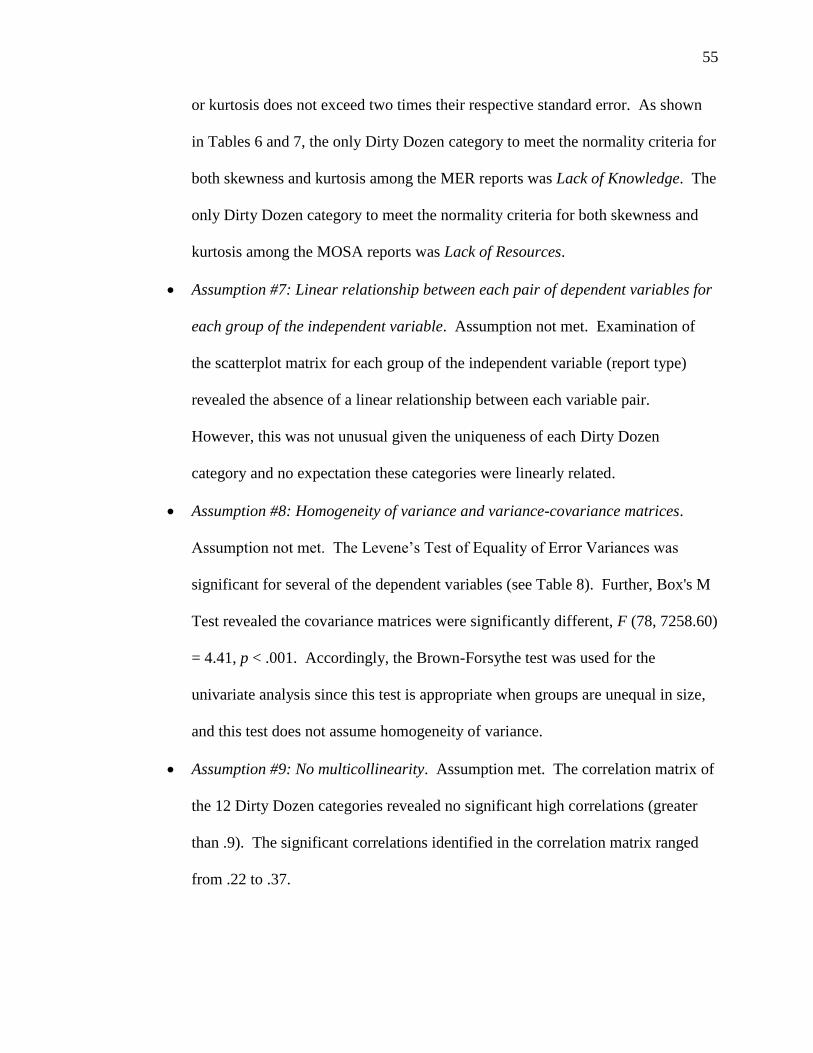
55
or kurtosis does not exceed two times their respective standard error. As shown
in Tables 6 and 7, the only Dirty Dozen category to meet the normality criteria for
both skewness and kurtosis among the MER reports was Lack of Knowledge. The
only Dirty Dozen category to meet the normality criteria for both skewness and
kurtosis among the MOSA reports was Lack of Resources.
Assumption #7: Linear relationship between each pair of dependent variables for
each group of the independent variable. Assumption not met. Examination of
the scatterplot matrix for each group of the independent variable (report type)
revealed the absence of a linear relationship between each variable pair.
However, this was not unusual given the uniqueness of each Dirty Dozen
category and no expectation these categories were linearly related.
Assumption #8: Homogeneity of variance and variance-covariance matrices.
Assumption not met. The Levene’s Test of Equality of Error Variances was
significant for several of the dependent variables (see Table 8). Further, Box's M
Test revealed the covariance matrices were significantly different, F (78, 7258.60)
= 4.41, p < .001. Accordingly, the Brown-Forsythe test was used for the
univariate analysis since this test is appropriate when groups are unequal in size,
and this test does not assume homogeneity of variance.
Assumption #9: No multicollinearity. Assumption met. The correlation matrix of
the 12 Dirty Dozen categories revealed no significant high correlations (greater
than .9). The significant correlations identified in the correlation matrix ranged
from .22 to .37.
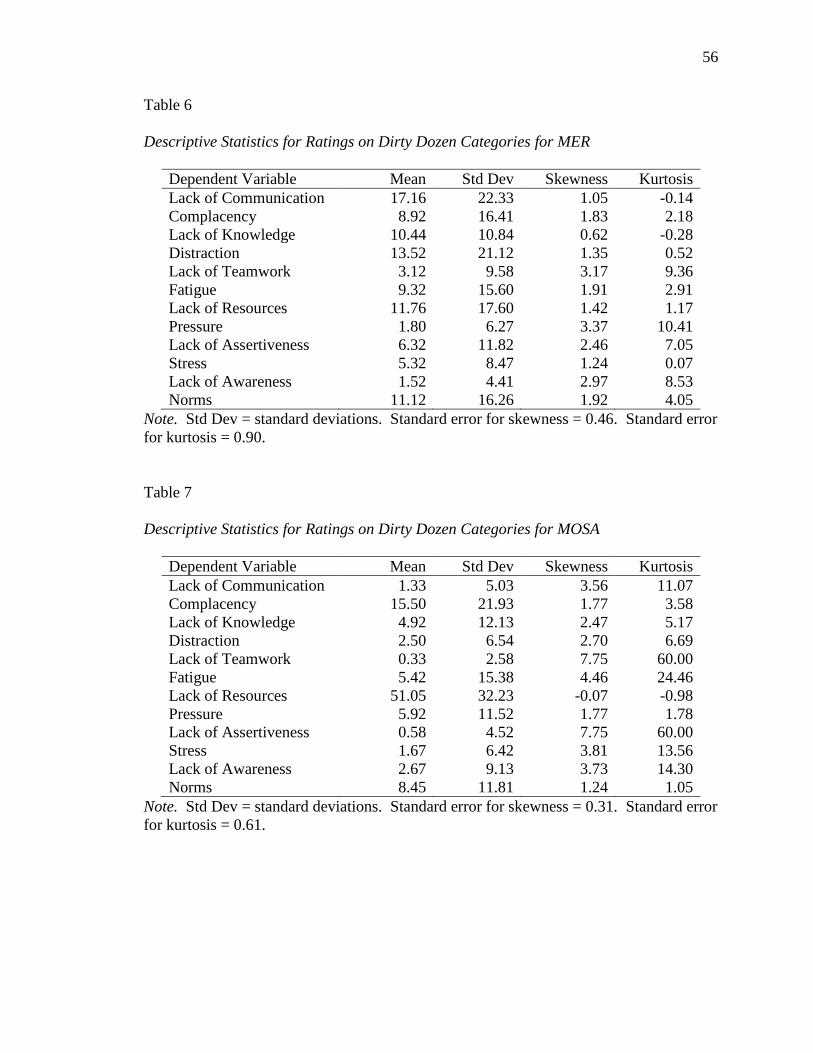
56
Table 6
Descriptive Statistics for Ratings on Dirty Dozen Categories for MER
Dependent Variable Mean Std Dev Skewness Kurtosis
Lack of Communication 17.16 22.33 1.05 -0.14
Complacency 8.92 16.41 1.83 2.18
Lack of Knowledge 10.44 10.84 0.62 -0.28
Distraction 13.52 21.12 1.35 0.52
Lack of Teamwork 3.12 9.58 3.17 9.36
Fatigue 9.32 15.60 1.91 2.91
Lack of Resources 11.76 17.60 1.42 1.17
Pressure 1.80 6.27 3.37 10.41
Lack of Assertiveness 6.32 11.82 2.46 7.05
Stress 5.32 8.47 1.24 0.07
Lack of Awareness 1.52 4.41 2.97 8.53
Norms 11.12 16.26 1.92 4.05
Note. Std Dev = standard deviations. Standard error for skewness = 0.46. Standard error
for kurtosis = 0.90.
Table 7
Descriptive Statistics for Ratings on Dirty Dozen Categories for MOSA
Dependent Variable Mean Std Dev Skewness Kurtosis
Lack of Communication 1.33 5.03 3.56 11.07
Complacency 15.50 21.93 1.77 3.58
Lack of Knowledge 4.92 12.13 2.47 5.17
Distraction 2.50 6.54 2.70 6.69
Lack of Teamwork 0.33 2.58 7.75 60.00
Fatigue 5.42 15.38 4.46 24.46
Lack of Resources 51.05 32.23 -0.07 -0.98
Pressure 5.92 11.52 1.77 1.78
Lack of Assertiveness 0.58 4.52 7.75 60.00
Stress 1.67 6.42 3.81 13.56
Lack of Awareness 2.67 9.13 3.73 14.30
Norms 8.45 11.81 1.24 1.05
Note. Std Dev = standard deviations. Standard error for skewness = 0.31. Standard error
for kurtosis = 0.61.
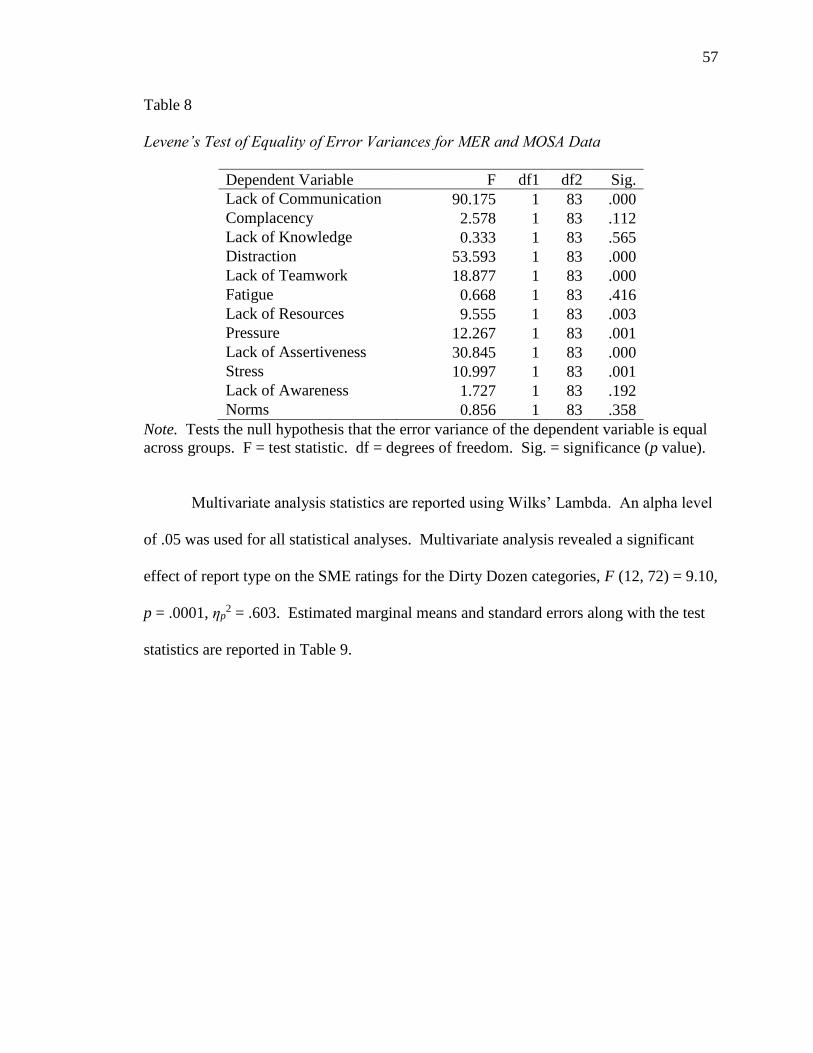
57
Table 8
Levene’s Test of Equality of Error Variances for MER and MOSA Data
Dependent Variable F df1 df2 Sig.
Lack of Communication 90.175 1 83 .000
Complacency 2.578 1 83 .112
Lack of Knowledge 0.333 1 83 .565
Distraction 53.593 1 83 .000
Lack of Teamwork 18.877 1 83 .000
Fatigue 0.668 1 83 .416
Lack of Resources 9.555 1 83 .003
Pressure 12.267 1 83 .001
Lack of Assertiveness 30.845 1 83 .000
Stress 10.997 1 83 .001
Lack of Awareness 1.727 1 83 .192
Norms 0.856 1 83 .358
Note. Tests the null hypothesis that the error variance of the dependent variable is equal
across groups. F = test statistic. df = degrees of freedom. Sig. = significance (p value).
Multivariate analysis statistics are reported using Wilks’ Lambda. An alpha level
of .05 was used for all statistical analyses. Multivariate analysis revealed a significant
effect of report type on the SME ratings for the Dirty Dozen categories, F (12, 72) = 9.10,
p = .0001, ηp2 = .603. Estimated marginal means and standard errors along with the test
statistics are reported in Table 9.
58
Table 9
Estimated Marginal Means, Standard Errors, and Brown-Forsythe Test Results for
Ratings on Dirty Dozen Categories by Report Type
Dependent Variable MER MOSA Statistic df Sig.
Lack of Communication 17.16 (2.55) 1.33 (1.64) 12.30 1, 25.02 .002
Complacency 8.92 (4.10) 15.50 (2.65) 2.31 1, 59.61 .134
Lack of Knowledge 10.44 (2.35) 4.92 (1.52) 4.27 1, 50.04 .044
Distraction 13.52 (2.53) 2.50 (1.63) 6.55 1, 25.94 .017
Lack of Teamwork 3.12 (1.12) 0.33 (0.72) 2.06 1, 25.47 .164
Fatigue 9.32 (3.09) 5.42 (1.99) 1.11 1, 44.44 .297
Lack of Resources 11.76 (5.76) 51.05 (3.72) 51.96 1, 76.88 .001
Pressure 1.80 (2.06) 5.92 (1.33) 4.48 1, 76.99 .038
Lack of Assertiveness 6.32 (1.48) 0.58 (0.96) 5.55 1, 26.97 .026
Stress 5.32 (1.42) 1.67 (0.91) 3.75 1, 36.04 .061
Lack of Awareness 1.52 (1.61) 2.67 (1.04) 0.61 1, 81.11 .438
Norms 11.12 (2.65) 8.45 (1.71) 0.55 1, 35.04 .462
Note. MER = Maintenance Event Report. MOSA = Maintenance Operations Safety
Assessment. Standard errors presented in parentheses following means. df = degrees of
freedom. Sig. = significance (p value).
Univariate tests revealed a significant effect of report type on six Dirty Dozen
categories: Lack of Communication, Lack of Knowledge, Distraction, Lack of Resources,
Pressure, and Lack of Assertiveness. Lack of Communication, Lack of Knowledge,
Distraction, and Lack of Assertiveness were rated significantly higher on the MER than
the MOSA. Lack of Resources and Pressure were rated significantly higher on the
MOSA than the MER. No significant differences were found on the other six Dirty
Dozen categories: Complacency, Lack of Teamwork, Fatigue, Stress, Lack of Awareness,
and Norms.
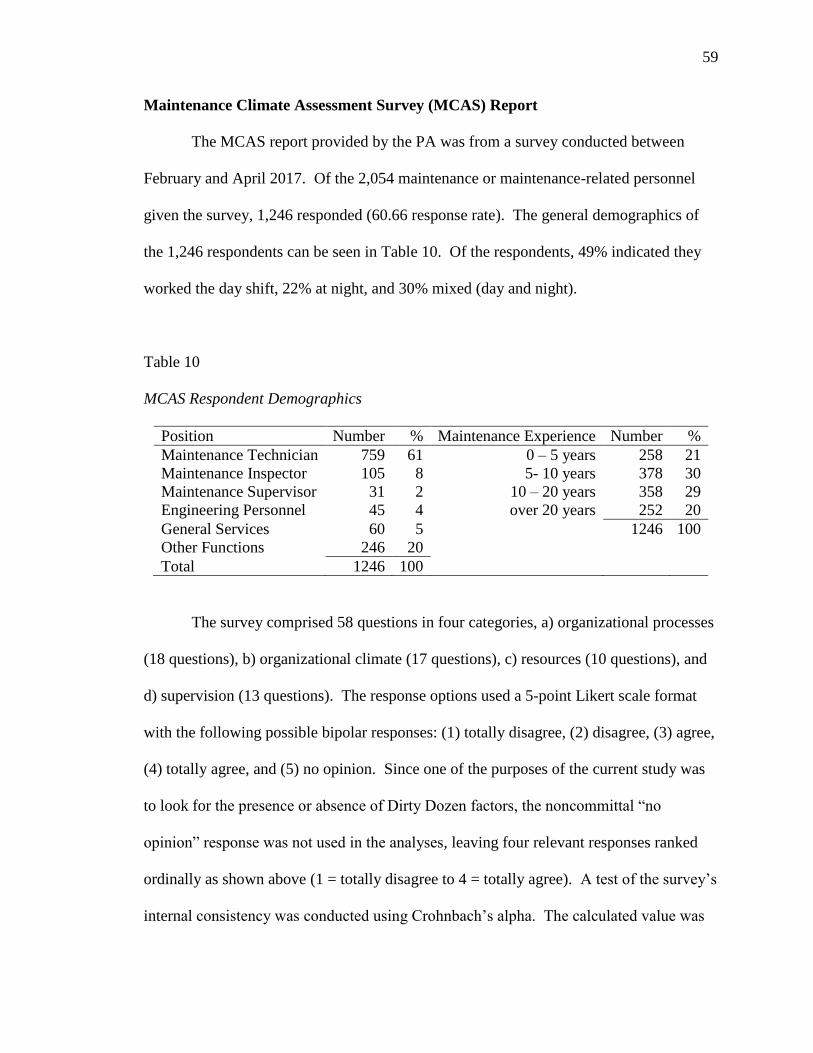
59
Maintenance Climate Assessment Survey (MCAS) Report
The MCAS report provided by the PA was from a survey conducted between
February and April 2017. Of the 2,054 maintenance or maintenance-related personnel
given the survey, 1,246 responded (60.66 response rate). The general demographics of
the 1,246 respondents can be seen in Table 10. Of the respondents, 49% indicated they
worked the day shift, 22% at night, and 30% mixed (day and night).
Table 10
MCAS Respondent Demographics
Position Number % Maintenance Experience Number %
Maintenance Technician 759 61 0 – 5 years 258 21
Maintenance Inspector 105 8 5- 10 years 378 30
Maintenance Supervisor 31 2 10 – 20 years 358 29
Engineering Personnel 45 4 over 20 years 252 20
General Services 60 5 1246 100
Other Functions 246 20
Total 1246 100
The survey comprised 58 questions in four categories, a) organizational processes
(18 questions), b) organizational climate (17 questions), c) resources (10 questions), and
d) supervision (13 questions). The response options used a 5-point Likert scale format
with the following possible bipolar responses: (1) totally disagree, (2) disagree, (3) agree,
(4) totally agree, and (5) no opinion. Since one of the purposes of the current study was
to look for the presence or absence of Dirty Dozen factors, the noncommittal “no
opinion” response was not used in the analyses, leaving four relevant responses ranked
ordinally as shown above (1 = totally disagree to 4 = totally agree). A test of the survey’s
internal consistency was conducted using Crohnbach’s alpha. The calculated value was
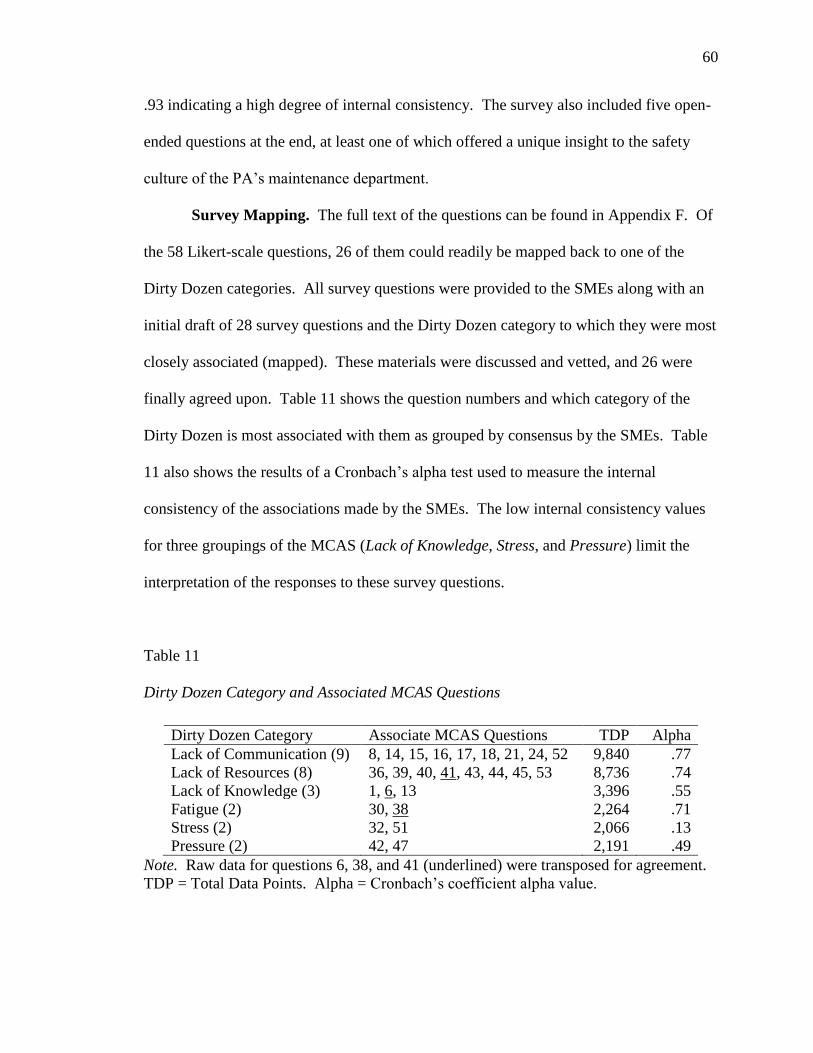
60
.93 indicating a high degree of internal consistency. The survey also included five open-
ended questions at the end, at least one of which offered a unique insight to the safety
culture of the PA’s maintenance department.
Survey Mapping. The full text of the questions can be found in Appendix F. Of
the 58 Likert-scale questions, 26 of them could readily be mapped back to one of the
Dirty Dozen categories. All survey questions were provided to the SMEs along with an
initial draft of 28 survey questions and the Dirty Dozen category to which they were most
closely associated (mapped). These materials were discussed and vetted, and 26 were
finally agreed upon. Table 11 shows the question numbers and which category of the
Dirty Dozen is most associated with them as grouped by consensus by the SMEs. Table
11 also shows the results of a Cronbach’s alpha test used to measure the internal
consistency of the associations made by the SMEs. The low internal consistency values
for three groupings of the MCAS (Lack of Knowledge, Stress, and Pressure) limit the
interpretation of the responses to these survey questions.
Table 11
Dirty Dozen Category and Associated MCAS Questions
Dirty Dozen Category Associate MCAS Questions TDP Alpha
Lack of Communication (9) 8, 14, 15, 16, 17, 18, 21, 24, 52 9,840 .77
Lack of Resources (8) 36, 39, 40, 41, 43, 44, 45, 53 8,736 .74
Lack of Knowledge (3) 1, 6, 13 3,396 .55
Fatigue (2) 30, 38 2,264 .71
Stress (2) 32, 51 2,066 .13
Pressure (2) 42, 47 2,191 .49
Note. Raw data for questions 6, 38, and 41 (underlined) were transposed for agreement.
TDP = Total Data Points. Alpha = Cronbach’s coefficient alpha value.
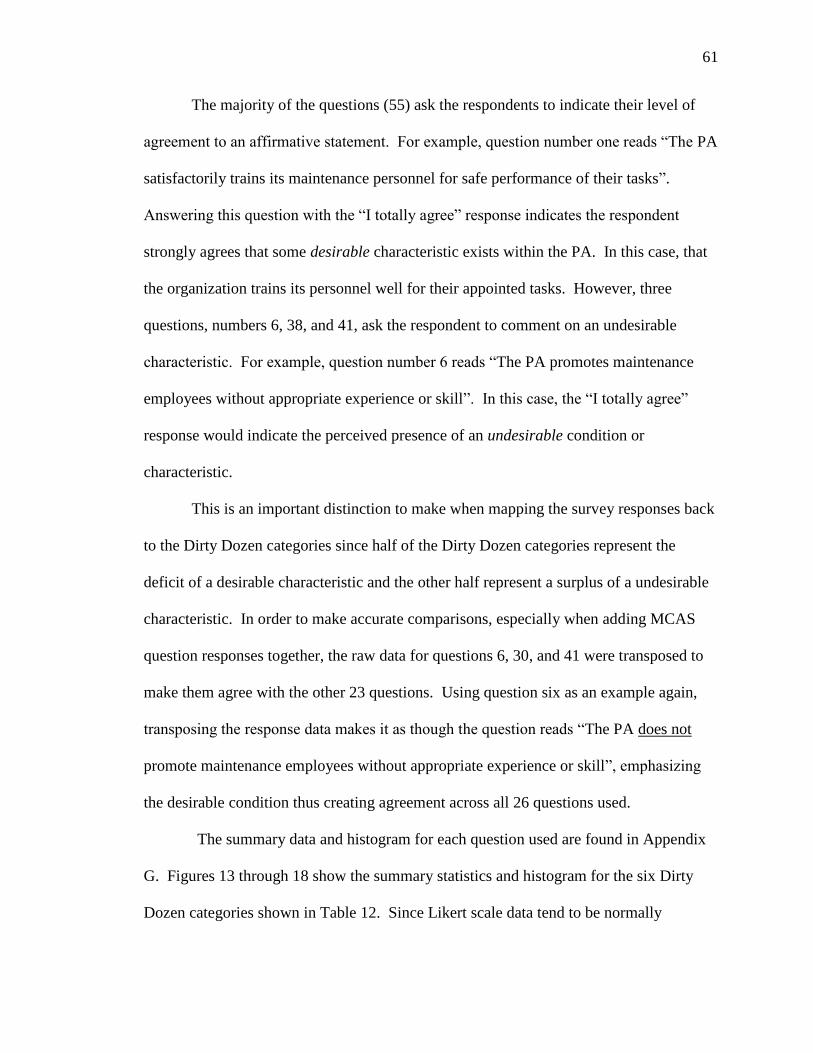
61
The majority of the questions (55) ask the respondents to indicate their level of
agreement to an affirmative statement. For example, question number one reads “The PA
satisfactorily trains its maintenance personnel for safe performance of their tasks”.
Answering this question with the “I totally agree” response indicates the respondent
strongly agrees that some desirable characteristic exists within the PA. In this case, that
the organization trains its personnel well for their appointed tasks. However, three
questions, numbers 6, 38, and 41, ask the respondent to comment on an undesirable
characteristic. For example, question number 6 reads “The PA promotes maintenance
employees without appropriate experience or skill”. In this case, the “I totally agree”
response would indicate the perceived presence of an undesirable condition or
characteristic.
This is an important distinction to make when mapping the survey responses back
to the Dirty Dozen categories since half of the Dirty Dozen categories represent the
deficit of a desirable characteristic and the other half represent a surplus of a undesirable
characteristic. In order to make accurate comparisons, especially when adding MCAS
question responses together, the raw data for questions 6, 30, and 41 were transposed to
make them agree with the other 23 questions. Using question six as an example again,
transposing the response data makes it as though the question reads “The PA does not
promote maintenance employees without appropriate experience or skill”, emphasizing
the desirable condition thus creating agreement across all 26 questions used.
The summary data and histogram for each question used are found in Appendix
G. Figures 13 through 18 show the summary statistics and histogram for the six Dirty
Dozen categories shown in Table 12. Since Likert scale data tend to be normally
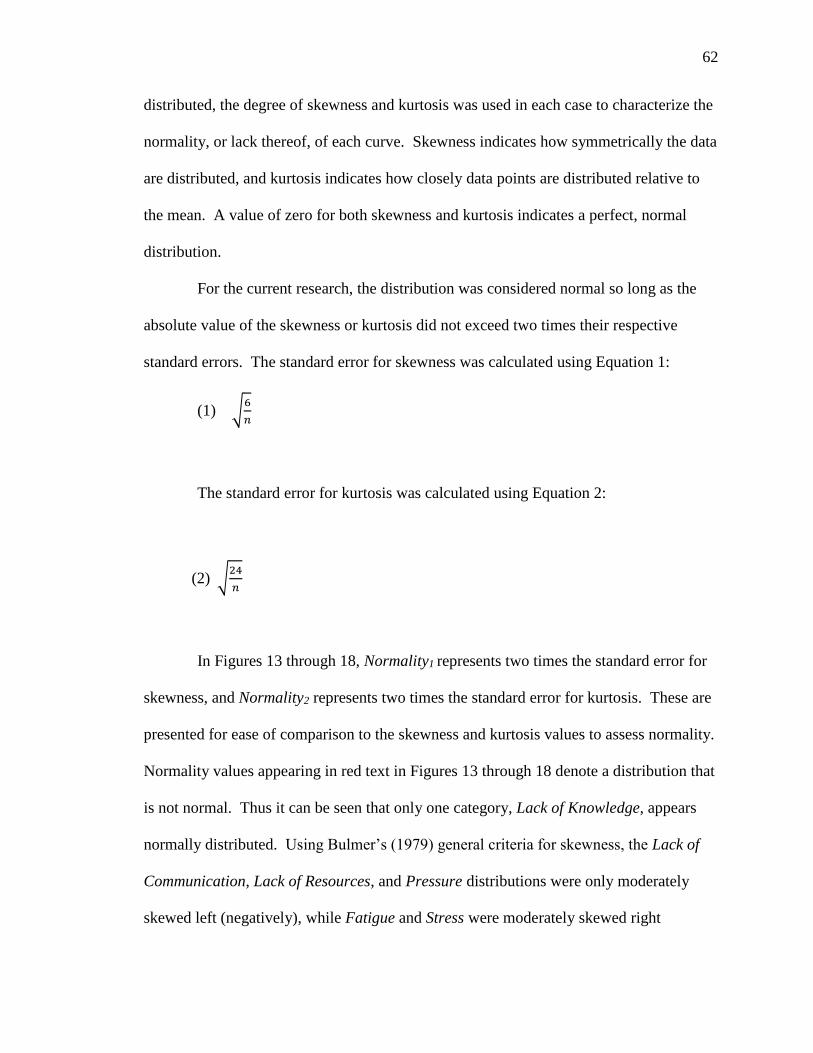
62
distributed, the degree of skewness and kurtosis was used in each case to characterize the
normality, or lack thereof, of each curve. Skewness indicates how symmetrically the data
are distributed, and kurtosis indicates how closely data points are distributed relative to
the mean. A value of zero for both skewness and kurtosis indicates a perfect, normal
distribution.
For the current research, the distribution was considered normal so long as the
absolute value of the skewness or kurtosis did not exceed two times their respective
standard errors. The standard error for skewness was calculated using Equation 1:
(1) √6
𝑛
The standard error for kurtosis was calculated using Equation 2:
(2) √24
𝑛
In Figures 13 through 18, Normality1 represents two times the standard error for
skewness, and Normality2 represents two times the standard error for kurtosis. These are
presented for ease of comparison to the skewness and kurtosis values to assess normality.
Normality values appearing in red text in Figures 13 through 18 denote a distribution that
is not normal. Thus it can be seen that only one category, Lack of Knowledge, appears
normally distributed. Using Bulmer’s (1979) general criteria for skewness, the Lack of
Communication, Lack of Resources, and Pressure distributions were only moderately
skewed left (negatively), while Fatigue and Stress were moderately skewed right
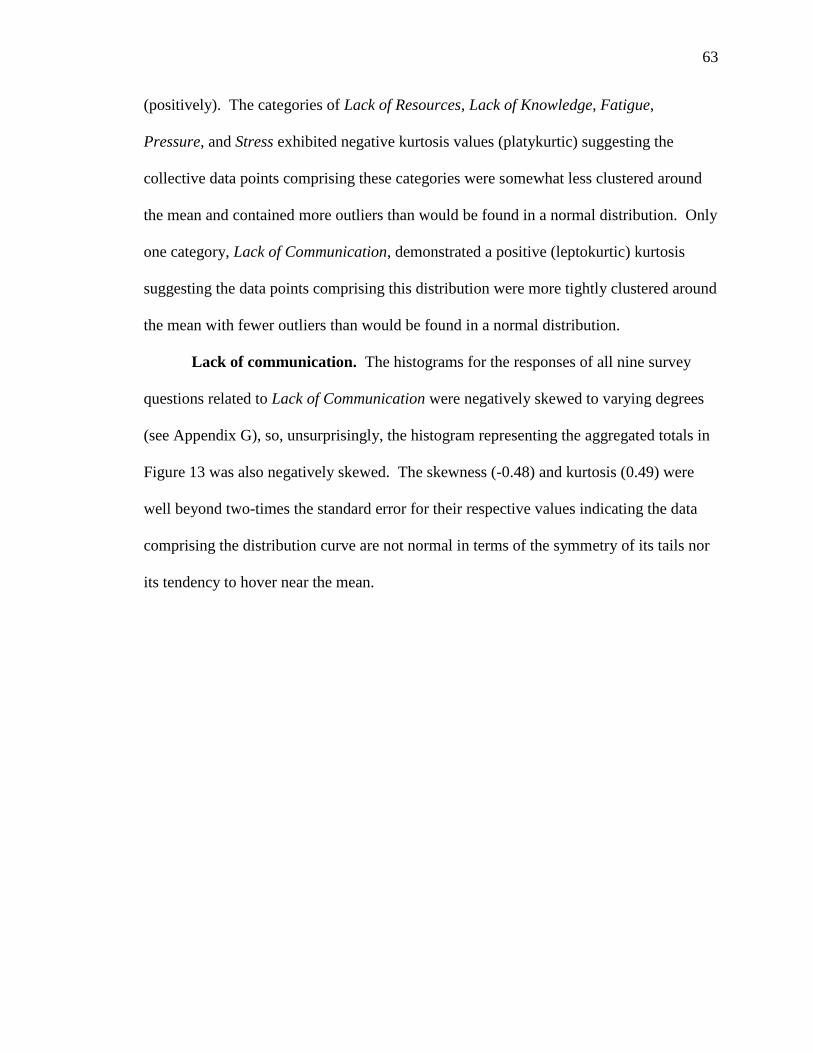
63
(positively). The categories of Lack of Resources, Lack of Knowledge, Fatigue,
Pressure, and Stress exhibited negative kurtosis values (platykurtic) suggesting the
collective data points comprising these categories were somewhat less clustered around
the mean and contained more outliers than would be found in a normal distribution. Only
one category, Lack of Communication, demonstrated a positive (leptokurtic) kurtosis
suggesting the data points comprising this distribution were more tightly clustered around
the mean with fewer outliers than would be found in a normal distribution.
Lack of communication. The histograms for the responses of all nine survey
questions related to Lack of Communication were negatively skewed to varying degrees
(see Appendix G), so, unsurprisingly, the histogram representing the aggregated totals in
Figure 13 was also negatively skewed. The skewness (-0.48) and kurtosis (0.49) were
well beyond two-times the standard error for their respective values indicating the data
comprising the distribution curve are not normal in terms of the symmetry of its tails nor
its tendency to hover near the mean.
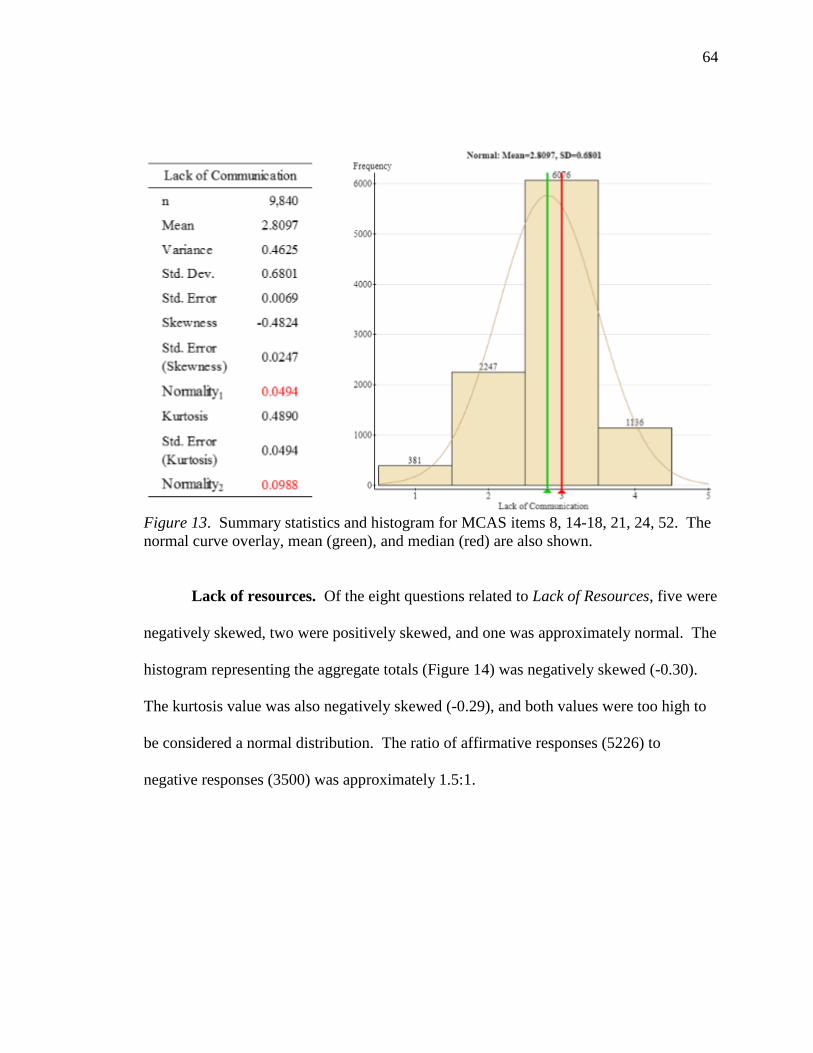
64
Figure 13. Summary statistics and histogram for MCAS items 8, 14-18, 21, 24, 52. The
normal curve overlay, mean (green), and median (red) are also shown.
Lack of resources. Of the eight questions related to Lack of Resources, five were
negatively skewed, two were positively skewed, and one was approximately normal. The
histogram representing the aggregate totals (Figure 14) was negatively skewed (-0.30).
The kurtosis value was also negatively skewed (-0.29), and both values were too high to
be considered a normal distribution. The ratio of affirmative responses (5226) to
negative responses (3500) was approximately 1.5:1.
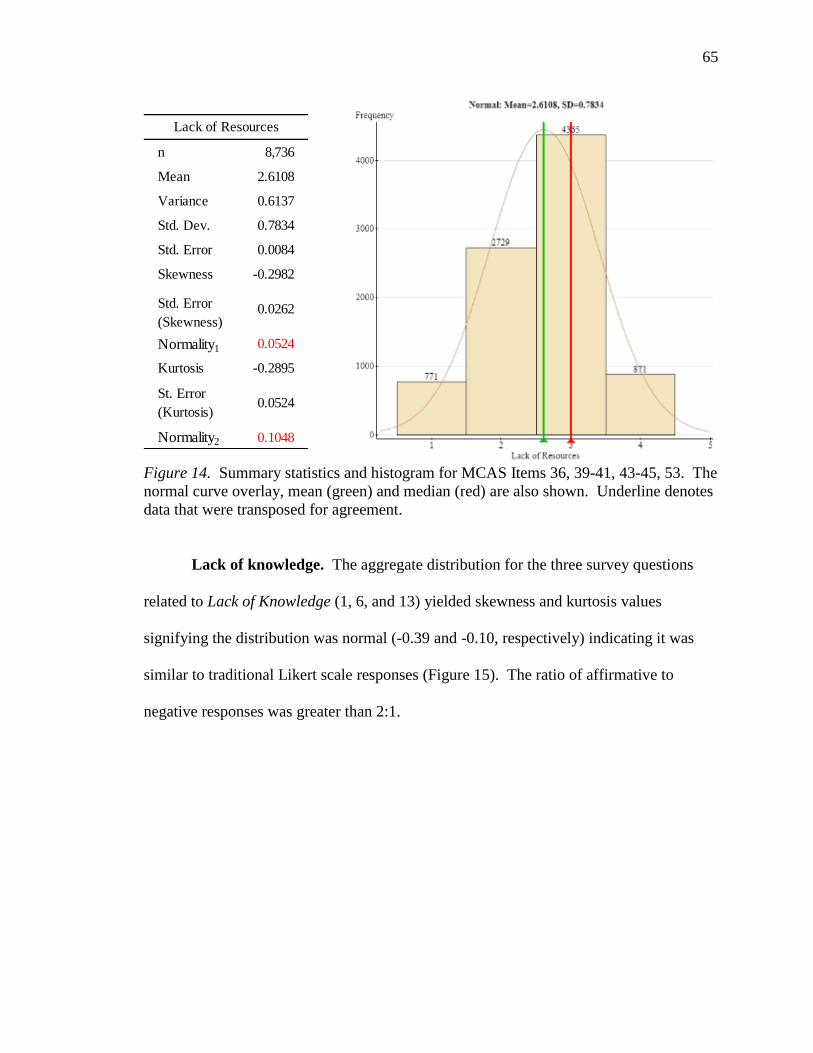
65
Figure 14. Summary statistics and histogram for MCAS Items 36, 39-41, 43-45, 53. The
normal curve overlay, mean (green) and median (red) are also shown. Underline denotes
data that were transposed for agreement.
Lack of knowledge. The aggregate distribution for the three survey questions
related to Lack of Knowledge (1, 6, and 13) yielded skewness and kurtosis values
signifying the distribution was normal (-0.39 and -0.10, respectively) indicating it was
similar to traditional Likert scale responses (Figure 15). The ratio of affirmative to
negative responses was greater than 2:1.
n 8,736
Mean 2.6108
Variance 0.6137
Std. Dev. 0.7834
Std. Error 0.0084
Skewness -0.2982
Std. Error
(Skewness)0.0262
Normality1 0.0524
Kurtosis -0.2895
St. Error
(Kurtosis)0.0524
Normality2 0.1048
Lack of Resources
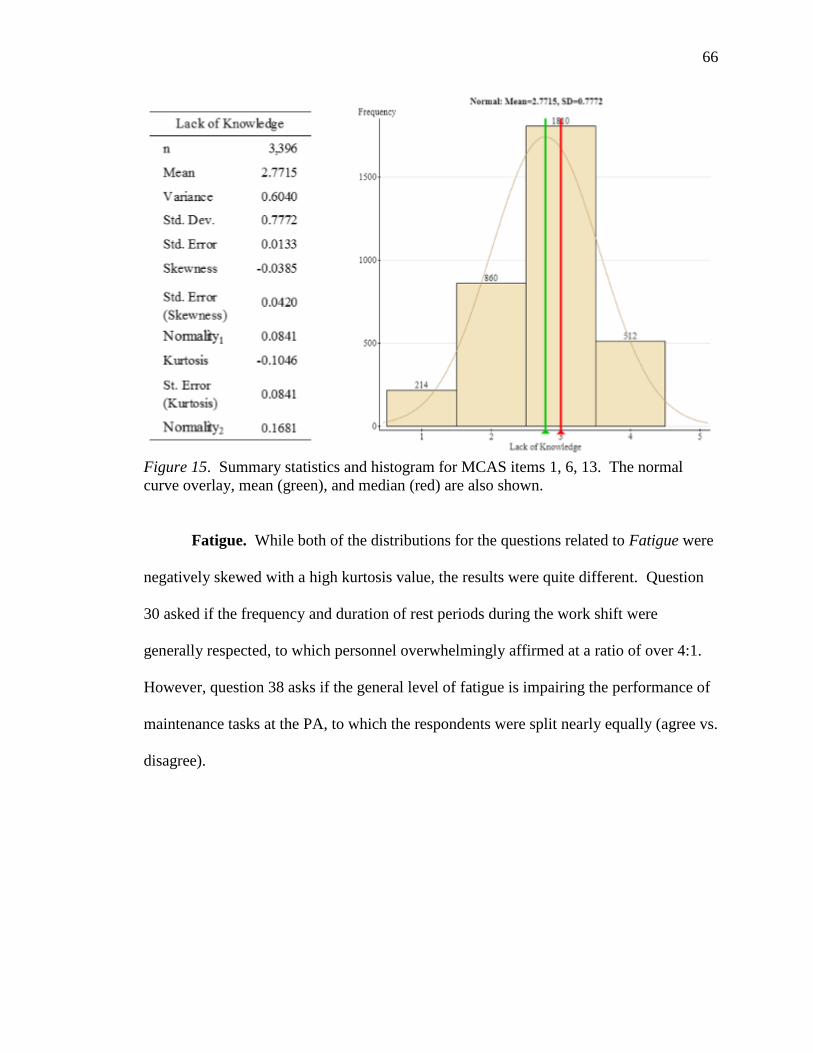
66
Figure 15. Summary statistics and histogram for MCAS items 1, 6, 13. The normal
curve overlay, mean (green), and median (red) are also shown.
Fatigue. While both of the distributions for the questions related to Fatigue were
negatively skewed with a high kurtosis value, the results were quite different. Question
30 asked if the frequency and duration of rest periods during the work shift were
generally respected, to which personnel overwhelmingly affirmed at a ratio of over 4:1.
However, question 38 asks if the general level of fatigue is impairing the performance of
maintenance tasks at the PA, to which the respondents were split nearly equally (agree vs.
disagree).
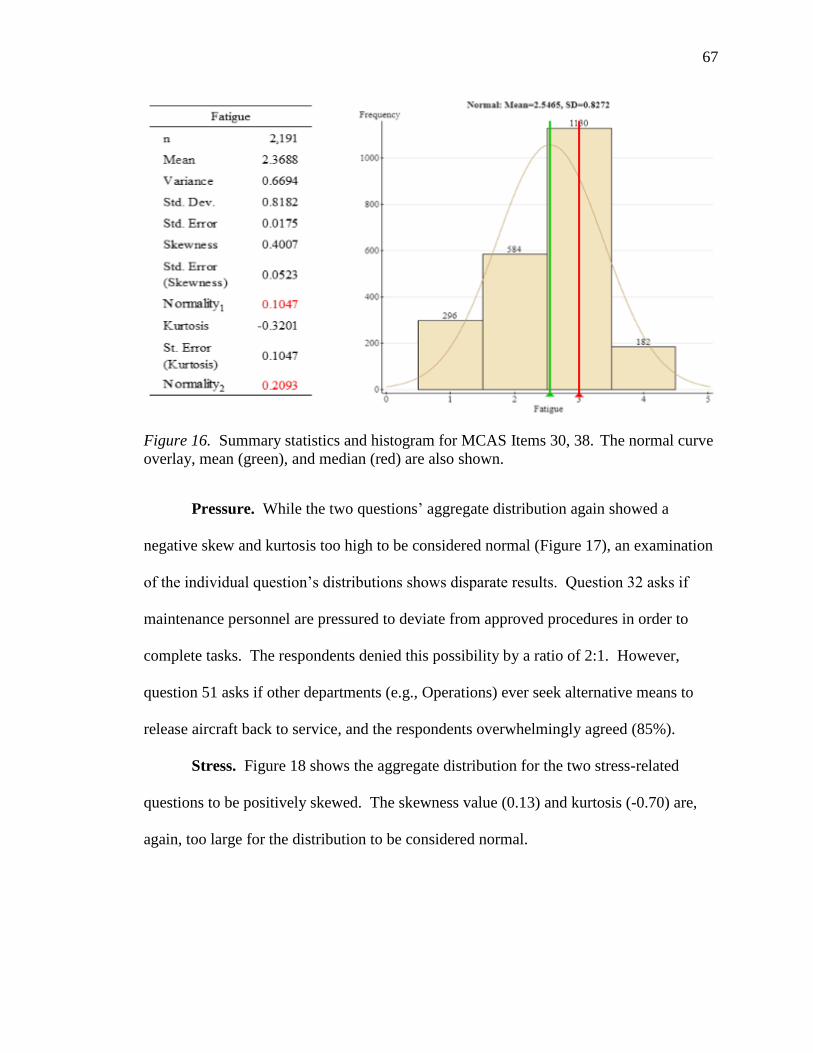
67
Figure 16. Summary statistics and histogram for MCAS Items 30, 38. The normal curve
overlay, mean (green), and median (red) are also shown.
Pressure. While the two questions’ aggregate distribution again showed a
negative skew and kurtosis too high to be considered normal (Figure 17), an examination
of the individual question’s distributions shows disparate results. Question 32 asks if
maintenance personnel are pressured to deviate from approved procedures in order to
complete tasks. The respondents denied this possibility by a ratio of 2:1. However,
question 51 asks if other departments (e.g., Operations) ever seek alternative means to
release aircraft back to service, and the respondents overwhelmingly agreed (85%).
Stress. Figure 18 shows the aggregate distribution for the two stress-related
questions to be positively skewed. The skewness value (0.13) and kurtosis (-0.70) are,
again, too large for the distribution to be considered normal.
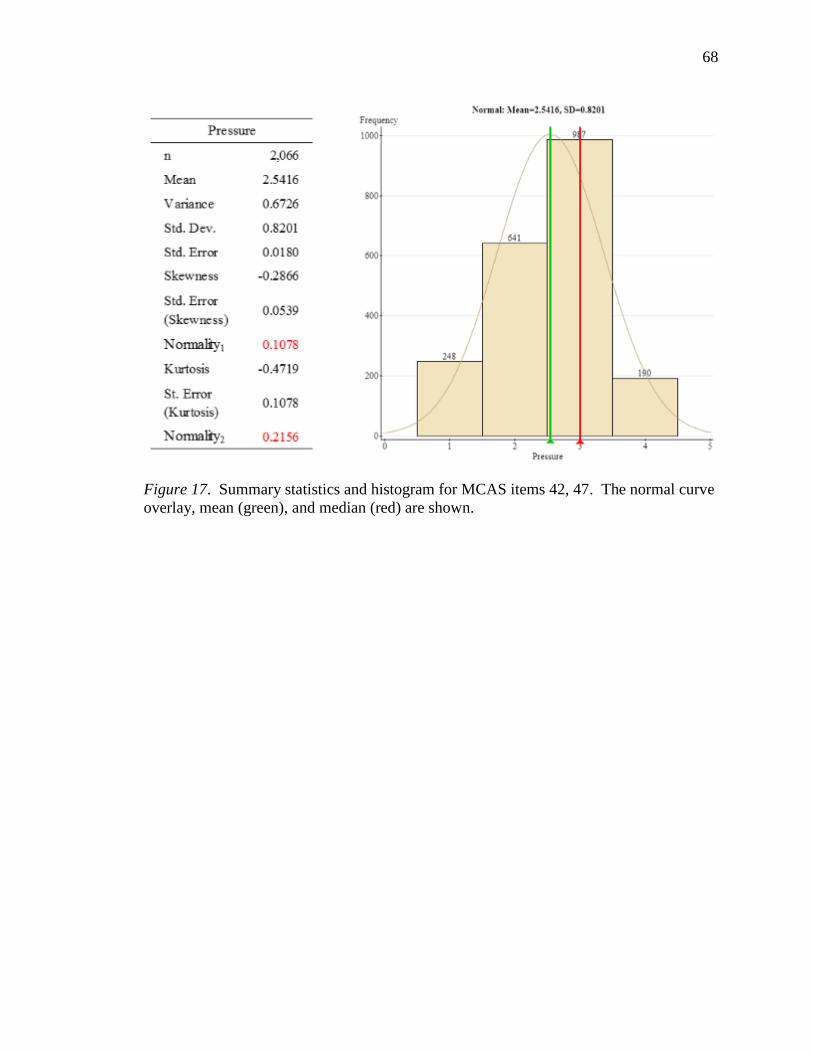
68
Figure 17. Summary statistics and histogram for MCAS items 42, 47. The normal curve
overlay, mean (green), and median (red) are shown.
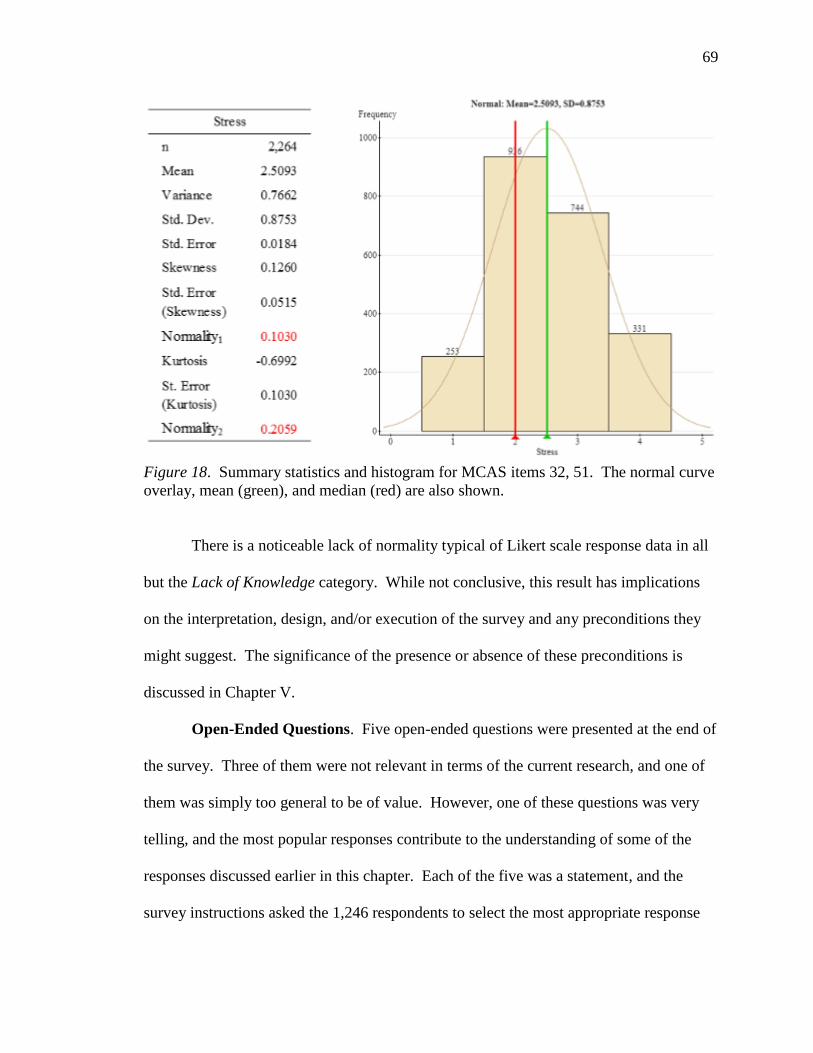
69
Figure 18. Summary statistics and histogram for MCAS items 32, 51. The normal curve
overlay, mean (green), and median (red) are also shown.
There is a noticeable lack of normality typical of Likert scale response data in all
but the Lack of Knowledge category. While not conclusive, this result has implications
on the interpretation, design, and/or execution of the survey and any preconditions they
might suggest. The significance of the presence or absence of these preconditions is
discussed in Chapter V.
Open-Ended Questions. Five open-ended questions were presented at the end of
the survey. Three of them were not relevant in terms of the current research, and one of
them was simply too general to be of value. However, one of these questions was very
telling, and the most popular responses contribute to the understanding of some of the
responses discussed earlier in this chapter. Each of the five was a statement, and the
survey instructions asked the 1,246 respondents to select the most appropriate response
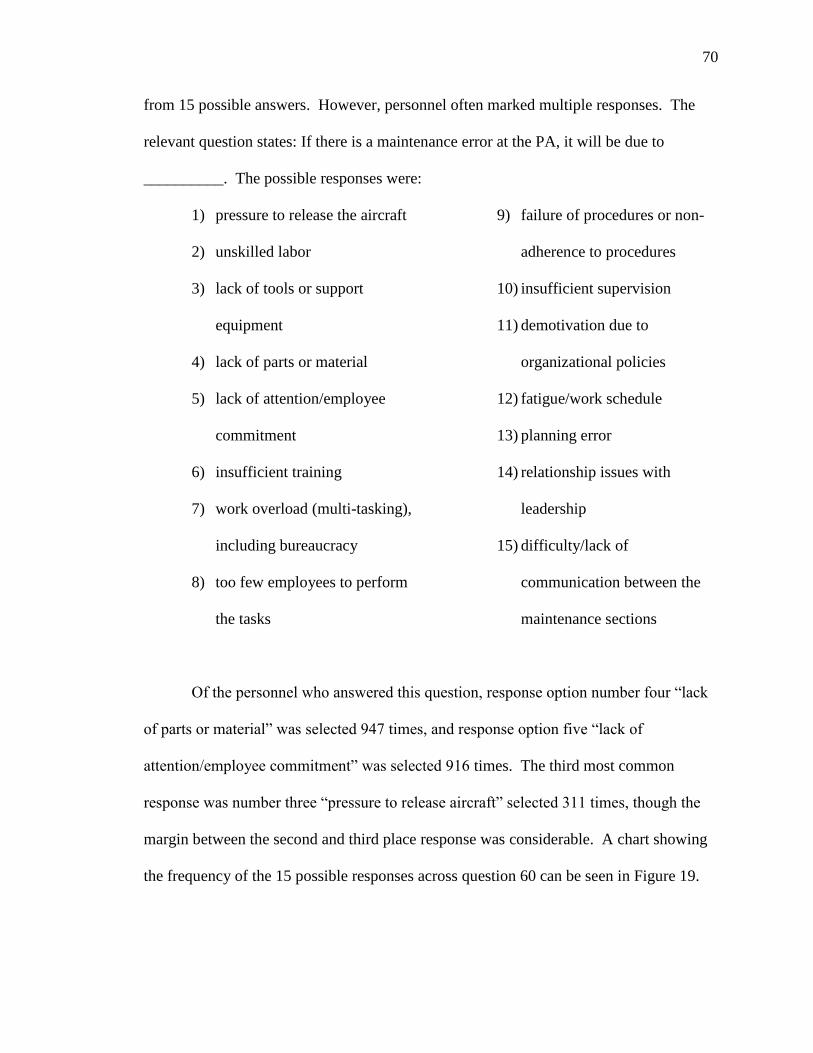
70
from 15 possible answers. However, personnel often marked multiple responses. The
relevant question states: If there is a maintenance error at the PA, it will be due to
__________. The possible responses were:
1) pressure to release the aircraft
2) unskilled labor
3) lack of tools or support
equipment
4) lack of parts or material
5) lack of attention/employee
commitment
6) insufficient training
7) work overload (multi-tasking),
including bureaucracy
8) too few employees to perform
the tasks
9) failure of procedures or non-
adherence to procedures
10) insufficient supervision
11) demotivation due to
organizational policies
12) fatigue/work schedule
13) planning error
14) relationship issues with
leadership
15) difficulty/lack of
communication between the
maintenance sections
Of the personnel who answered this question, response option number four “lack
of parts or material” was selected 947 times, and response option five “lack of
attention/employee commitment” was selected 916 times. The third most common
response was number three “pressure to release aircraft” selected 311 times, though the
margin between the second and third place response was considerable. A chart showing
the frequency of the 15 possible responses across question 60 can be seen in Figure 19.
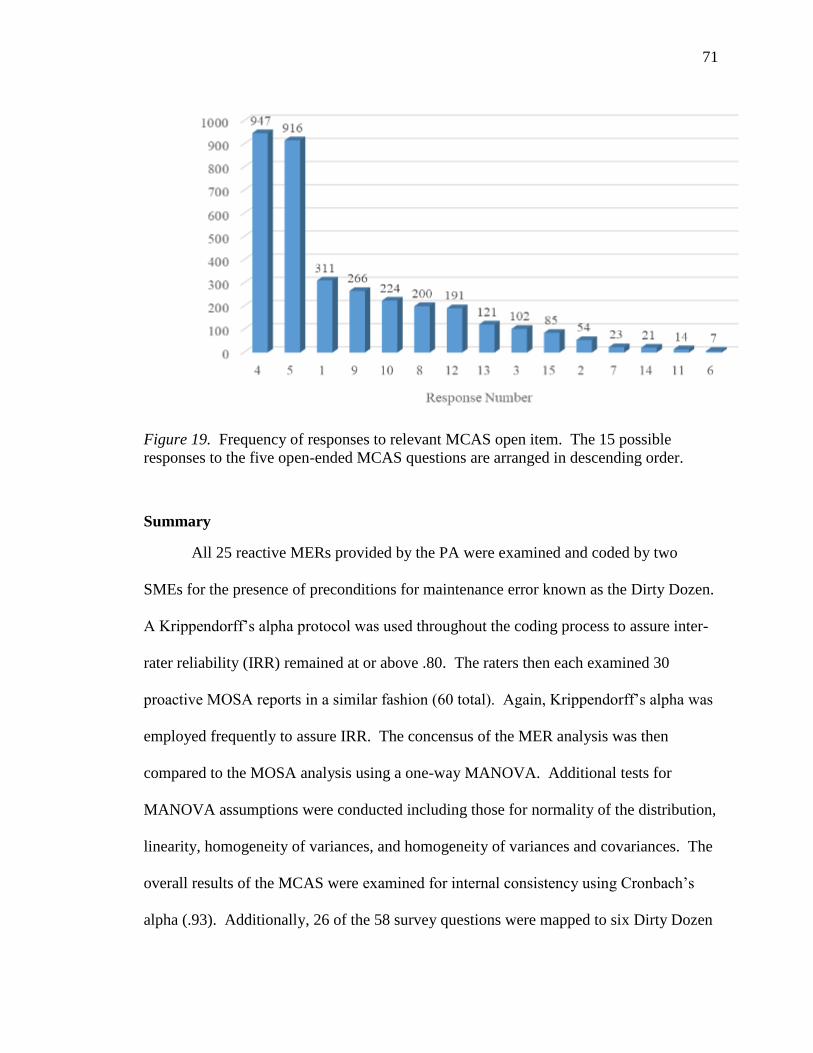
71
Figure 19. Frequency of responses to relevant MCAS open item. The 15 possible
responses to the five open-ended MCAS questions are arranged in descending order.
Summary
All 25 reactive MERs provided by the PA were examined and coded by two
SMEs for the presence of preconditions for maintenance error known as the Dirty Dozen.
A Krippendorff’s alpha protocol was used throughout the coding process to assure inter-
rater reliability (IRR) remained at or above .80. The raters then each examined 30
proactive MOSA reports in a similar fashion (60 total). Again, Krippendorff’s alpha was
employed frequently to assure IRR. The concensus of the MER analysis was then
compared to the MOSA analysis using a one-way MANOVA. Additional tests for
MANOVA assumptions were conducted including those for normality of the distribution,
linearity, homogeneity of variances, and homogeneity of variances and covariances. The
overall results of the MCAS were examined for internal consistency using Cronbach’s
alpha (.93). Additionally, 26 of the 58 survey questions were mapped to six Dirty Dozen
72
categories and grouped by consensus by the SMEs. Cronbach’s alpha was again used to
assess the internal consistency of the questions within each of these six Dirty Dozen
categories. Finally, of the five open-response questions at the end of the MCAS, one was
thought to be particularly relevant to the current research. An examination of the
responses indicated respondents felt a lack of parts or material, and a lack of attention /
employee commitment were a significant concern.
73
CHAPTER V
DISCUSSION, CONCLUSIONS, AND RECOMMENDATIONS
The crux of the literature review for the current research (Chapter II) is, despite
the aviation industry’s broad acceptance of the Dirty Dozen as the 12 primary
preconditions for aircraft maintenance errors, no research has been conducted that
leverages this broadly accepted framework for its potential analytical value. As stated in
Chapter I, the research problem is more effective analytical methodologies are needed to
continue to drive maintenance errors down. To address this problem, it is posited that an
examination of an organization’s maintenance culture through the construct of the Dirty
Dozen will yield useful information identifying the presence of preconditions for
maintenance errors. It is further posited that maintenance-related reports and surveys can
be coded and analyzed using SMEs in such a way as to illustrate the organization’s
maintenance culture and reveal the presence of these preconditions for maintenance
errors. Once revealed, a mitigating strategy can be devised to address the specific
preconditions that are present, thereby reducing the total number of incidents and
accidents that are able to manifest as a result.
The reports used were Maintenance Event Reports (MERs), which are reactive in
nature; Maintenance Operations Safety Assessments (MOSAs), which are proactive in
nature; and the results of the PA’s 2017 Maintenance Climate Awareness Survey
(MCAS), a subjective approach comprising survey responses from PA employees
performing maintenance-related functions. The 25 MERs and 60 MOSA reports were
coded by aviation maintenance SMEs looking for evidence of one or more Dirty Dozen
elements, while the responses to 26 of the MCAS survey questions were mapped to Dirty
74
Dozen categories and grouped by consensus by the SMEs. Examined as a whole, the
three types of report (proactive, reactive, and subjective) were expected to illustrate the
PA’s maintenance culture in terms of the Dirty Dozen, revealing the presence and
frequency of the various preconditions for error.
Discussion
MER – MOSA Comparison
The first research question asked - How does the reactive data (MER) analysis
compare to the proactive (MOSA) analysis in terms of the Dirty Dozen? Do they echo
similar Dirty Dozen categories, or do they seem to reflect different aspects of the Dirty
Dozen? Results showed significant differences between the MER and MOSA in the
SME ratings of the Dirty Dozen categories, as discussed next.
To begin, the categories of Complacency, Lack of Teamwork, Fatigue, Stress,
Lack of Awareness, and Norms were not significantly different between the two types of
report. However, Lack of Communication, Lack of Knowledge, Distraction, Lack of
Resources, Pressure, and Lack of Assertiveness were rated significantly higher on the
MER than the MOSA, while Lack of Resources and Pressure were rated significantly
higher on the MOSA than the MER. This suggests the two types of report seem to echo
each other in terms of some Dirty Dozen categories (Complacency, Lack of Teamwork,
Fatigue, Stress, Lack of Awareness, and Norms). In contrast, the data suggest MERs
appear to have somewhat greater sensitivity when applied to situations in which the
categories of Lack of Communication, Lack of Knowledge, Distraction, Lack of
Resources, Pressure, and Lack of Assertiveness are prevalent. Whereas, the MOSAs
75
appear to be more sensitive when applied to situations in which Lack of Resources or
Pressure are in evidence.
As stated previously, six of the Dirty Dozen represent the deficit of a desirable
characteristic (e.g., teamwork), and the other six represent a surplus of an undesirable
feature (e.g., fatigue). The Dirty Dozen totals for both the MERs and MOSA reports
were color coded for deficit (orange) and surplus (green), rearranged in descending order,
and compared in Figure 19. A visible inspection of the two graphs shows no apparent
relationship in terms of surplus versus deficit across the two types of reports. However,
what can be seen is the prevalence of Lack of Resources across both reports, followed by
Complacency and Norms.
Two notable issues became apparent in the examination of the MOSA reports.
First, the Lack of Resources category was used so frequently by the raters that its total for
the 60 MOSA cases was 3148. To put this into perspective, the next highest value was
Complacency at 930, hence the use of a LOG10 algorithm to keep the other categories
meaningful on the graph. Second, while Lack of Communication was the number one
precondition revealed in the MER reports, it ranked tenth (of thirteen) on the MOSA
reports. Being reactive in nature, the MER reports document events that have actually
come to fruition, unlike the MOSA reports which speculate to a large degree what forces
are at work during an observation by a third party and are heavily influenced by the
specific items on the MOSA checklist. Therefore, for the purposes of the current
research, the MERs are considered more directly grounded in reality and more
representative of actual circumstances in the maintenance department. If this is indeed
the case, it prompts the questions – why is Lack of Communication ranked so low on the
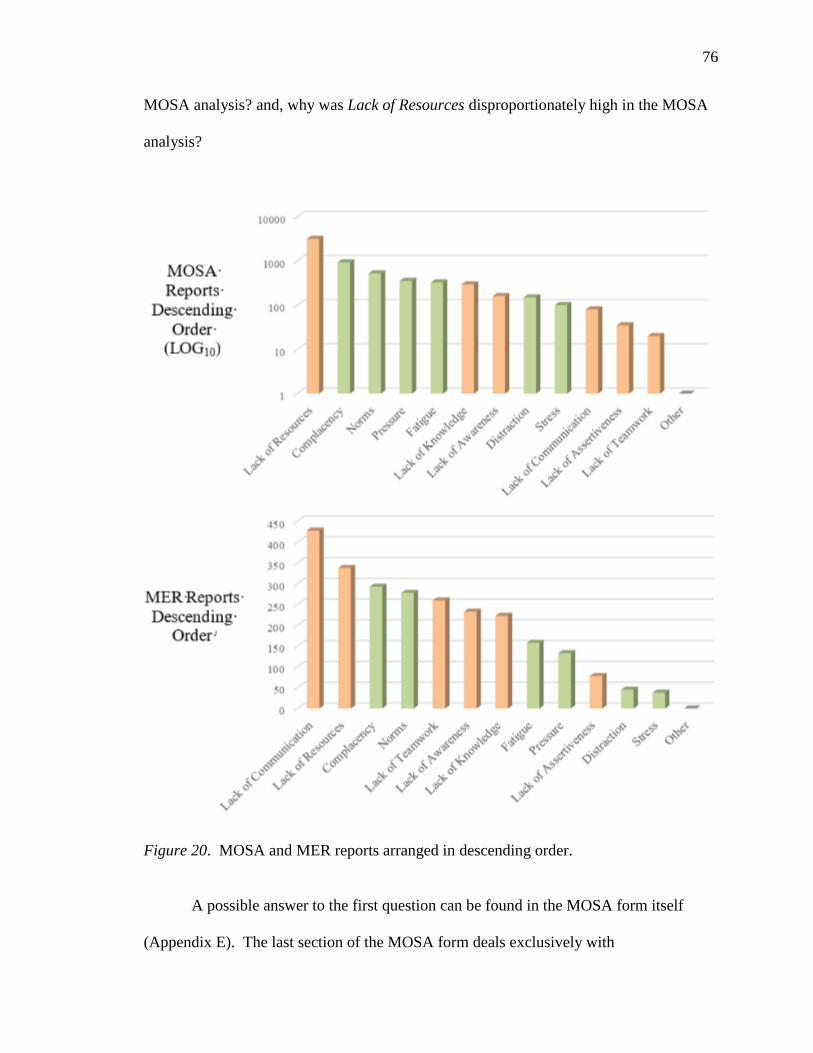
76
MOSA analysis? and, why was Lack of Resources disproportionately high in the MOSA
analysis?
Figure 20. MOSA and MER reports arranged in descending order.
A possible answer to the first question can be found in the MOSA form itself
(Appendix E). The last section of the MOSA form deals exclusively with
77
communication. It asks the observer to assess six types of communication:
communication between departments, between shifts, among technicians, between
technicians and supervisors, technicians and inspectors, and between supervision and
management. The observer is instructed to check one of three boxes next to each of the
six types of communication labeled ‘Yes’, ‘No’, or ‘N/A’. Lack of Communication
ranked low on the MOSA analysis since, more often than not, the ‘Yes’ box was checked
for all six types of communication. However, even if it is assumed that communication is
observed at all six levels, which seems unlikely given the MER analysis, there is no
mechanism on the MOSA form for an observer to indicate the effectiveness of said
communication. Thus, it can be seen that three possibilities exist to explain the disparity
between the MER and MOSA report analyses: (a) communication is not, in fact, being
observed at all six levels; (b) communication is being observed at all six levels, but the
effectiveness of the communication is often poor; or (c) some combination of a and b.
Since few matters involving human behavior are purely binary, odds favor ‘c’ as the
more likely explanation. Therefore, the way in which ‘communication’ is handled in
terms of both the construct of the MOSA form as well as training of the observers should
be examined further by the PA.
An answer to the Lack of Resources question can also be found in the MOSA
form itself (Appendix E). For maintenance personnel, the term resources is broadly
defined. Maintenance manuals, tools, materials, parts, consumables, and more comprise
a mechanic’s resources. With this in mind, an examination of the MOSA form shows
that many of the headings (orange bars) contain several questions that can fairly be said
to reflect ‘resources’; notably, 18 of the 60 questions (30%) on the form relate to
78
resources in some way. Since no other precondition for maintenance error is so well
represented, this sets up any analysis of the MOSA reports to be more sensitive to
resources in general, and therefore creates a certain degree of bias in the results.
However, given that Lack of Resources was coded by the raters more than the next
highest category (complacency) by a ratio greater than 3:1, it seems likely that Lack of
Resources would still rank very high in the MOSA analysis even if the bias were
somehow accounted for.
The second research question concerns itself with how complete the Dirty Dozen
framework seems to be and whether additional preconditions may have been encountered
during coding and analysis, particularly those suggested by Ma and Grower (2016).
During one of the training events conducted with the SME raters, MER event #18 was
brought up. One of the raters felt the case could possibly be a candidate for a
precondition for maintenance error referred to by Ma and Grower (2016) as Lack of
Personal Integrity. While it was a compelling argument, that assessment required
inferences that the team agreed could not be made with the limited information at hand.
Thus, the current research seems to support the notion that the Dirty Dozen is robust and
complete in its current state. However, future researchers should remain vigilant for
other preconditions for maintenance error, particularly those suggested by Ma and
Grower (2016).
Insights from Maintenance Climate Assessment Survey
Of the 58 survey questions, 26 could be mapped back directly to a Dirty Dozen
category: nine questions for Lack of Communication, eight for Lack of Resources, three
for Lack of Knowledge, and two each for Fatigue, Pressure, and Stress (see Table 5 for a
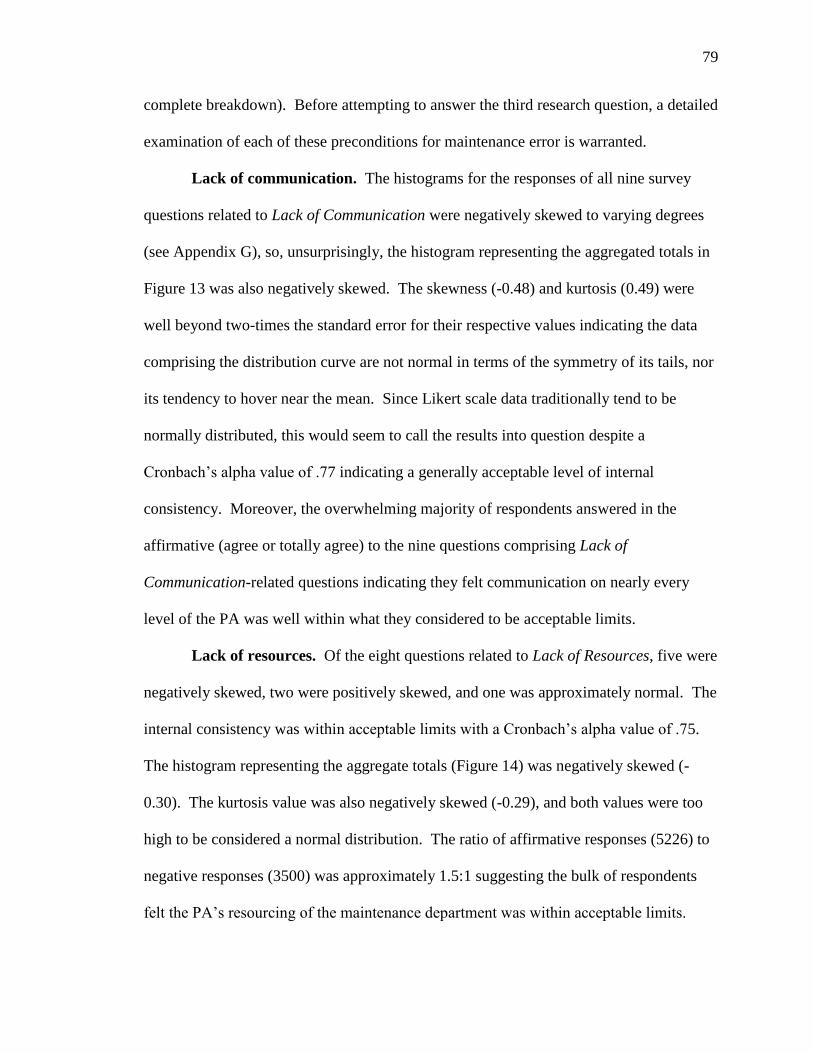
79
complete breakdown). Before attempting to answer the third research question, a detailed
examination of each of these preconditions for maintenance error is warranted.
Lack of communication. The histograms for the responses of all nine survey
questions related to Lack of Communication were negatively skewed to varying degrees
(see Appendix G), so, unsurprisingly, the histogram representing the aggregated totals in
Figure 13 was also negatively skewed. The skewness (-0.48) and kurtosis (0.49) were
well beyond two-times the standard error for their respective values indicating the data
comprising the distribution curve are not normal in terms of the symmetry of its tails, nor
its tendency to hover near the mean. Since Likert scale data traditionally tend to be
normally distributed, this would seem to call the results into question despite a
Cronbach’s alpha value of .77 indicating a generally acceptable level of internal
consistency. Moreover, the overwhelming majority of respondents answered in the
affirmative (agree or totally agree) to the nine questions comprising Lack of
Communication-related questions indicating they felt communication on nearly every
level of the PA was well within what they considered to be acceptable limits.
Lack of resources. Of the eight questions related to Lack of Resources, five were
negatively skewed, two were positively skewed, and one was approximately normal. The
internal consistency was within acceptable limits with a Cronbach’s alpha value of .75.
The histogram representing the aggregate totals (Figure 14) was negatively skewed (-
0.30). The kurtosis value was also negatively skewed (-0.29), and both values were too
high to be considered a normal distribution. The ratio of affirmative responses (5226) to
negative responses (3500) was approximately 1.5:1 suggesting the bulk of respondents
felt the PA’s resourcing of the maintenance department was within acceptable limits.
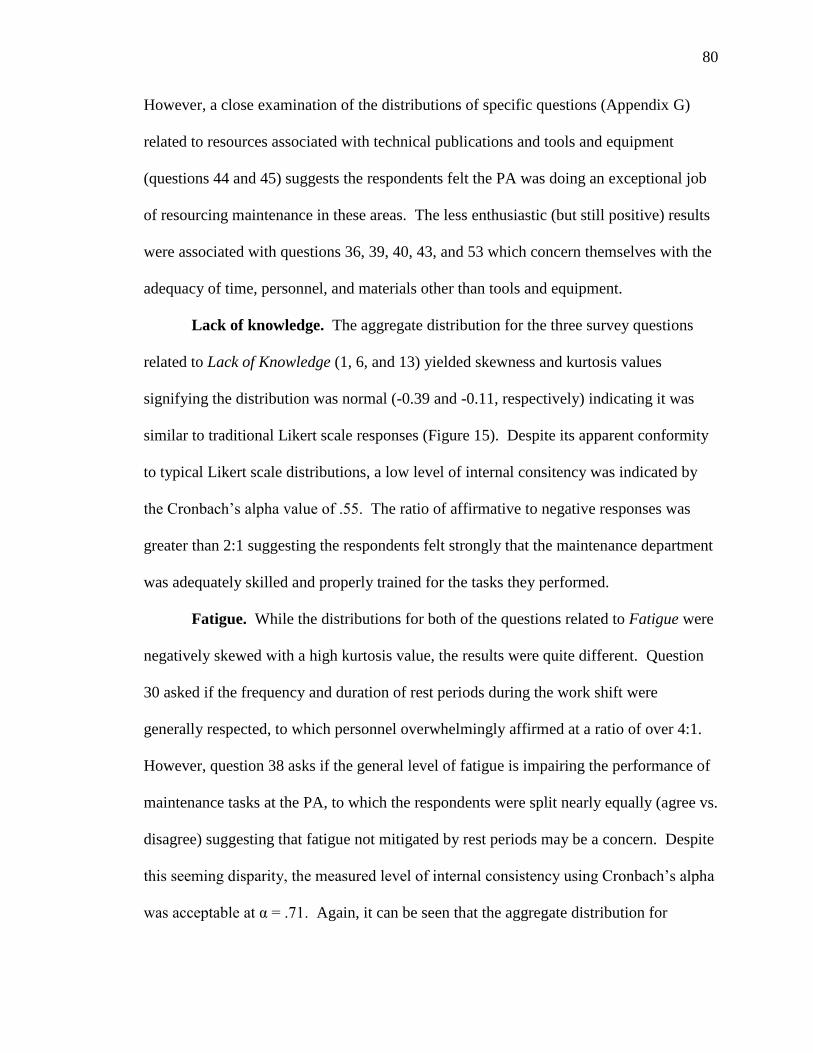
80
However, a close examination of the distributions of specific questions (Appendix G)
related to resources associated with technical publications and tools and equipment
(questions 44 and 45) suggests the respondents felt the PA was doing an exceptional job
of resourcing maintenance in these areas. The less enthusiastic (but still positive) results
were associated with questions 36, 39, 40, 43, and 53 which concern themselves with the
adequacy of time, personnel, and materials other than tools and equipment.
Lack of knowledge. The aggregate distribution for the three survey questions
related to Lack of Knowledge (1, 6, and 13) yielded skewness and kurtosis values
signifying the distribution was normal (-0.39 and -0.11, respectively) indicating it was
similar to traditional Likert scale responses (Figure 15). Despite its apparent conformity
to typical Likert scale distributions, a low level of internal consitency was indicated by
the Cronbach’s alpha value of .55. The ratio of affirmative to negative responses was
greater than 2:1 suggesting the respondents felt strongly that the maintenance department
was adequately skilled and properly trained for the tasks they performed.
Fatigue. While the distributions for both of the questions related to Fatigue were
negatively skewed with a high kurtosis value, the results were quite different. Question
30 asked if the frequency and duration of rest periods during the work shift were
generally respected, to which personnel overwhelmingly affirmed at a ratio of over 4:1.
However, question 38 asks if the general level of fatigue is impairing the performance of
maintenance tasks at the PA, to which the respondents were split nearly equally (agree vs.
disagree) suggesting that fatigue not mitigated by rest periods may be a concern. Despite
this seeming disparity, the measured level of internal consistency using Cronbach’s alpha
was acceptable at α = .71. Again, it can be seen that the aggregate distribution for
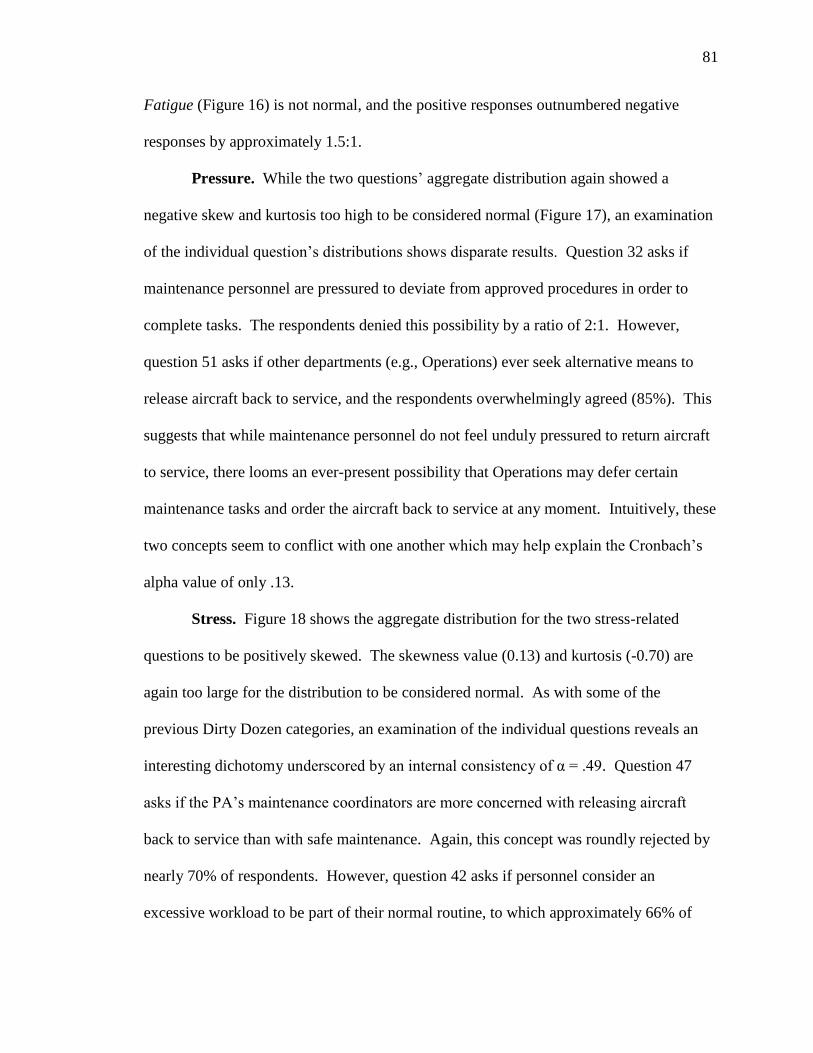
81
Fatigue (Figure 16) is not normal, and the positive responses outnumbered negative
responses by approximately 1.5:1.
Pressure. While the two questions’ aggregate distribution again showed a
negative skew and kurtosis too high to be considered normal (Figure 17), an examination
of the individual question’s distributions shows disparate results. Question 32 asks if
maintenance personnel are pressured to deviate from approved procedures in order to
complete tasks. The respondents denied this possibility by a ratio of 2:1. However,
question 51 asks if other departments (e.g., Operations) ever seek alternative means to
release aircraft back to service, and the respondents overwhelmingly agreed (85%). This
suggests that while maintenance personnel do not feel unduly pressured to return aircraft
to service, there looms an ever-present possibility that Operations may defer certain
maintenance tasks and order the aircraft back to service at any moment. Intuitively, these
two concepts seem to conflict with one another which may help explain the Cronbach’s
alpha value of only .13.
Stress. Figure 18 shows the aggregate distribution for the two stress-related
questions to be positively skewed. The skewness value (0.13) and kurtosis (-0.70) are
again too large for the distribution to be considered normal. As with some of the
previous Dirty Dozen categories, an examination of the individual questions reveals an
interesting dichotomy underscored by an internal consistency of α = .49. Question 47
asks if the PA’s maintenance coordinators are more concerned with releasing aircraft
back to service than with safe maintenance. Again, this concept was roundly rejected by
nearly 70% of respondents. However, question 42 asks if personnel consider an
excessive workload to be part of their normal routine, to which approximately 66% of
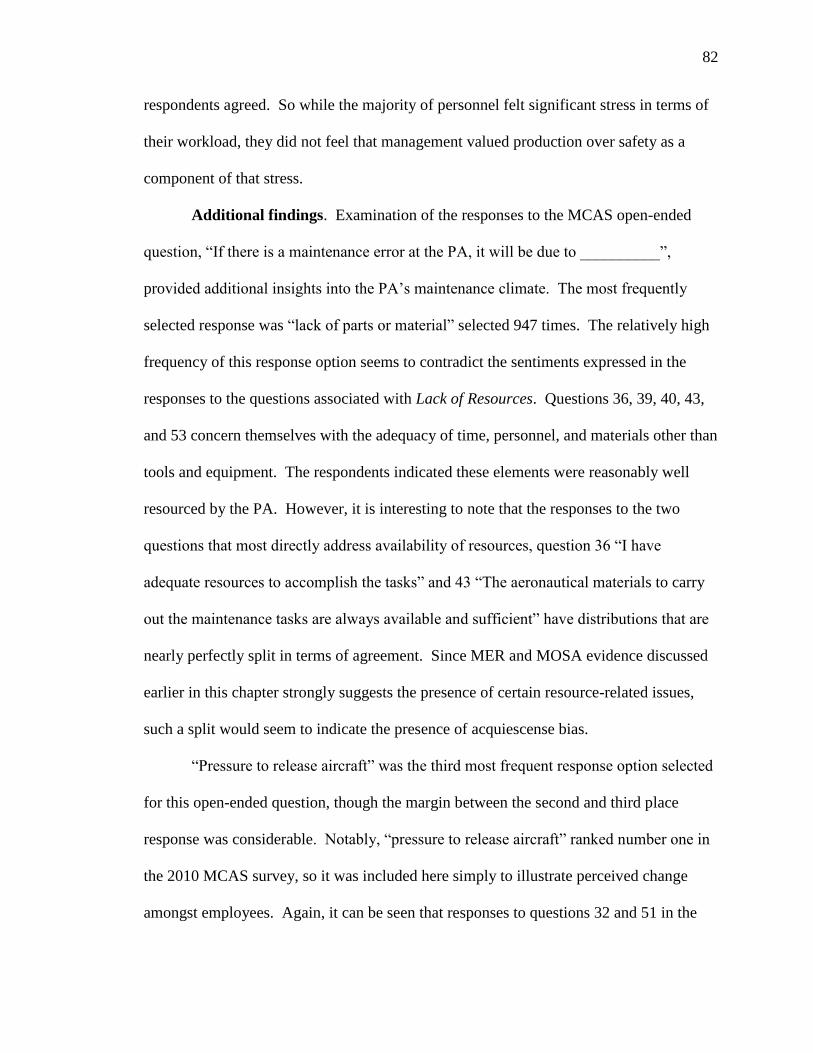
82
respondents agreed. So while the majority of personnel felt significant stress in terms of
their workload, they did not feel that management valued production over safety as a
component of that stress.
Additional findings. Examination of the responses to the MCAS open-ended
question, “If there is a maintenance error at the PA, it will be due to __________”,
provided additional insights into the PA’s maintenance climate. The most frequently
selected response was “lack of parts or material” selected 947 times. The relatively high
frequency of this response option seems to contradict the sentiments expressed in the
responses to the questions associated with Lack of Resources. Questions 36, 39, 40, 43,
and 53 concern themselves with the adequacy of time, personnel, and materials other than
tools and equipment. The respondents indicated these elements were reasonably well
resourced by the PA. However, it is interesting to note that the responses to the two
questions that most directly address availability of resources, question 36 “I have
adequate resources to accomplish the tasks” and 43 “The aeronautical materials to carry
out the maintenance tasks are always available and sufficient” have distributions that are
nearly perfectly split in terms of agreement. Since MER and MOSA evidence discussed
earlier in this chapter strongly suggests the presence of certain resource-related issues,
such a split would seem to indicate the presence of acquiescense bias.
“Pressure to release aircraft” was the third most frequent response option selected
for this open-ended question, though the margin between the second and third place
response was considerable. Notably, “pressure to release aircraft” ranked number one in
the 2010 MCAS survey, so it was included here simply to illustrate perceived change
amongst employees. Again, it can be seen that responses to questions 32 and 51 in the
83
body of the survey do not support this assertion. Respondents rejected question 32’s
assertion that personnel were pressured to deviate from approved procedures 2:1.
However, in answering question 51, respondents overwhelmingly agreed (85%) that other
departments (like Operations) were ready and willing to defer certain maintenance tasks
in order to get the aircraft back in service. The disparity between responses to question
32 and the 311 times “pressure to release aircraft” was selected could also be a result of
acquiescence bias. Examined as a whole, it seems reasonable to assume that while
respondents deny their supervisors and immediate management personnel would ever
suggest deviating from established processes and no small amount of pressure exists to
return aircraft to service, the survey results suggest it comes from outside the
maintenance department.
This conflict, as well as other seeming irregularities in the survey data, are not
uncommon when using a Likert scale survey instrument. Acquiescence bias is the
tendency for a respondent to agree with a statement in order to avoid attracting attention
or being seen as dissident (Allen, 2007; Gross, 2018), even when respondents are assured
their anonymity. The positive or negative wording of questions has also been seen to
contribute to acquiescence bias (Colosi, 2005) as has culture (Lee, 2002). The conflict
mentioned above as well as a number of apparent discrepencies noted in the specific
discussion of the six Dirty Dozen categories earlier in this chapter could be accounted for
by the presence of acquiescence bias. A literature review was conducted looking for
ways to correct for this type of bias. Unfortunately, none were found that might help
after the survey questions are written and after the data have been collected.
84
Prevalence of Dirty Dozen Categories
Coding and subsequent analyses of the MERs and the MOSA reports showed the
presence of all twelve Dirty Dozen preconditions for maintenance error to one degree or
another. It also demonstrated that while there are some Dirty Dozen categories that were
revealed equally by both types of report, MERs were more sensitive to some categories
and MOSA to others. Lack of Resources ranked second most frequent in the MER
analysis and the most frequent in the MOSA analysis. Notably, Lack of Resources was
disproportionately high in the MOSA analysis for reasons already discussed. While the
responses to the questions in the body of the MCAS survey generally refuted this, the
responses to the relevant open question confirmed this finding (see Additional Findings).
So while the collective analyses of these proactive, reactive, and subjective reports
suggest a notable lack of resources, that should not be construed to mean the PA is
knowingly under-resourcing the maintenance department. In a recent article for Director
of Maintenance magazine (2018), Gordon Dupont described traits exhibited consistently
by maintenance personnel, including “doesn’t like to ask for help, tends to be self-
sufficient, tends to think things through on their own and not share thoughts too
frequently or thoroughly” (Dupont, 2018, p. 14). Dupont goes on to say that, because of
these and other traits, mechanics often do not ask for the resources they need. Therefore,
it is entirely possible that the PA is unaware of much of the under-resourcing experienced
in the maintenance department.
Being reactive in nature, the MERs document events that have already occurred
and thus are considered somewhat more reliable than their proactive (MOSA)
counterpart. As such, it is difficult to ignore the most frequent Dirty Dozen category
85
found in the MER analysis. In first place, Lack of Communication ranked approximately
25% higher than the second-place category (Lack of Resources). However, the MOSA
analysis did not confirm a lack of communication was present. Given the issue in
documenting the quality of communication present in the MOSA forms, a distinct issue
with communication could well exist, but would be difficult to detect given these
limitations.
Norms and Complacency were the last categories prevalent in the top of the MER
and MOSA analyses. It seems worth noting that Norms was the fourth most prevalent
category in the MER analysis and third in the MOSA, while Complacency ranked third in
the MER analysis and second in the MOSA analysis. This suggests both Norms and
Complacency as preconditions for maintenance error are present and active in the PA’s
maintenance department as well.
The presence of Lack of Resources was discovered in the MER and MOSA
analyses, and, to some extent, in the insights gleaned from examining the MCAS
responses. However, it should be noted that the insights from the MCAS were not so
much due to the responses to the base survey questions, which were essentially split, but
to the responses to the relevant open question which strongly indicated a lack of
resources, specifically parts and materials. The skewness and kurtosis values of five of
the six aggregate distributions were too high to be considered normal, calling their
accuracy into question to some degree since Likert scale results tend to be normally
distributed. Only the aggregate distribution for Lack of Knowledge was normal and thus
within traditional Likert scale bounds despite poor internal consistency.
86
Conclusions
The current research sought to examine three types of commercial airline reports
for signs of Dupont’s Dirty Dozen. The Dirty Dozen are widely accepted to be the 12
most common preconditions for maintenance error in the aviation industry. The
assumption being that if preconditions for maintenance error are found to exist, the errors
themselves are likely not far behind. The reports documented the PA’s maintenance
activities from three points-of-view: reactive (MERs), proactive (MOSA), and subjective
(MCAS). It was posited that a detailed examination of these maintenance-related reports
through the framework of the Dirty Dozen would illustrate and highlight these
preconditions, thus helping the PA understand where best to allocate resources to reduce
these preconditons, thereby reducing the chance for errors to come to fruition.
The first research question asks – “How does the reactive data (MER) analysis
compare to the proactive (MOSA) analysis in terms of the Dirty Dozen? And, do they
echo similar Dirty Dozen categories, or do they seem to reflect different aspects of the
Dirty Dozen?” The results from the analysis show the difference between the MER and
MOSA reports is complex, with the MER reports detecting certain Dirty Dozen
categories better than the MOSA and vice-versa. There also seems to be a subset of
categories that the MER and MOSA reports detect equally well.
The second research question addresses the completeness of Dupont’s Dirty
Dozen and asks if other preconditions for maintenance error become apparent from these
analyses. While discussion among the raters gave creedence to Lack of Organizational
Integrity as posited by Ma and Grower (2016) as a legitimate precondition for error, it
was ultimately decided the case information lacked sufficient granularity to make this
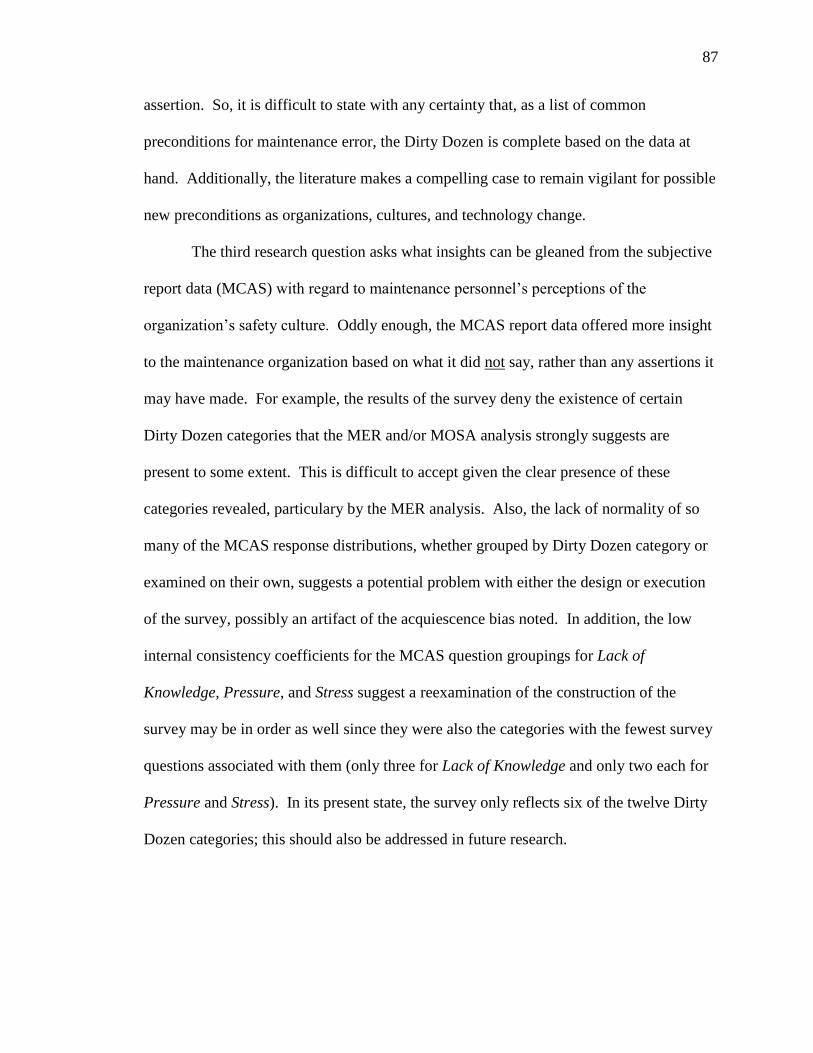
87
assertion. So, it is difficult to state with any certainty that, as a list of common
preconditions for maintenance error, the Dirty Dozen is complete based on the data at
hand. Additionally, the literature makes a compelling case to remain vigilant for possible
new preconditions as organizations, cultures, and technology change.
The third research question asks what insights can be gleaned from the subjective
report data (MCAS) with regard to maintenance personnel’s perceptions of the
organization’s safety culture. Oddly enough, the MCAS report data offered more insight
to the maintenance organization based on what it did not say, rather than any assertions it
may have made. For example, the results of the survey deny the existence of certain
Dirty Dozen categories that the MER and/or MOSA analysis strongly suggests are
present to some extent. This is difficult to accept given the clear presence of these
categories revealed, particulary by the MER analysis. Also, the lack of normality of so
many of the MCAS response distributions, whether grouped by Dirty Dozen category or
examined on their own, suggests a potential problem with either the design or execution
of the survey, possibly an artifact of the acquiescence bias noted. In addition, the low
internal consistency coefficients for the MCAS question groupings for Lack of
Knowledge, Pressure, and Stress suggest a reexamination of the construction of the
survey may be in order as well since they were also the categories with the fewest survey
questions associated with them (only three for Lack of Knowledge and only two each for
Pressure and Stress). In its present state, the survey only reflects six of the twelve Dirty
Dozen categories; this should also be addressed in future research.
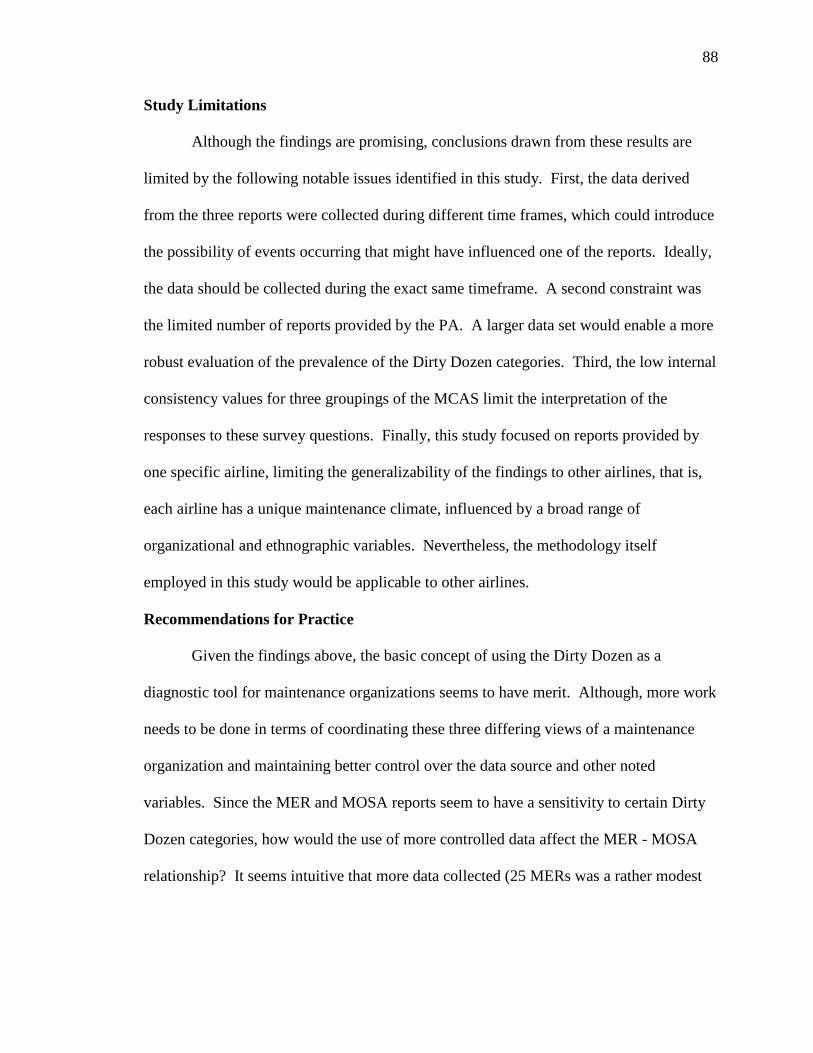
88
Study Limitations
Although the findings are promising, conclusions drawn from these results are
limited by the following notable issues identified in this study. First, the data derived
from the three reports were collected during different time frames, which could introduce
the possibility of events occurring that might have influenced one of the reports. Ideally,
the data should be collected during the exact same timeframe. A second constraint was
the limited number of reports provided by the PA. A larger data set would enable a more
robust evaluation of the prevalence of the Dirty Dozen categories. Third, the low internal
consistency values for three groupings of the MCAS limit the interpretation of the
responses to these survey questions. Finally, this study focused on reports provided by
one specific airline, limiting the generalizability of the findings to other airlines, that is,
each airline has a unique maintenance climate, influenced by a broad range of
organizational and ethnographic variables. Nevertheless, the methodology itself
employed in this study would be applicable to other airlines.
Recommendations for Practice
Given the findings above, the basic concept of using the Dirty Dozen as a
diagnostic tool for maintenance organizations seems to have merit. Although, more work
needs to be done in terms of coordinating these three differing views of a maintenance
organization and maintaining better control over the data source and other noted
variables. Since the MER and MOSA reports seem to have a sensitivity to certain Dirty
Dozen categories, how would the use of more controlled data affect the MER - MOSA
relationship? It seems intuitive that more data collected (25 MERs was a rather modest
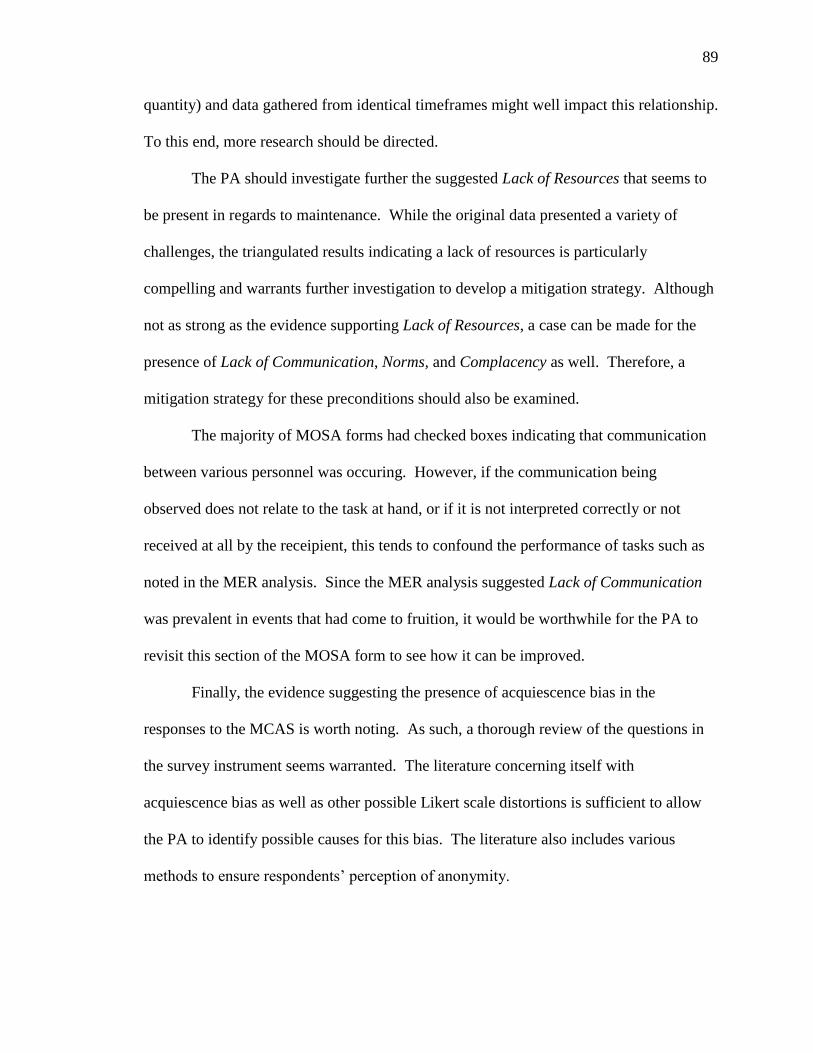
89
quantity) and data gathered from identical timeframes might well impact this relationship.
To this end, more research should be directed.
The PA should investigate further the suggested Lack of Resources that seems to
be present in regards to maintenance. While the original data presented a variety of
challenges, the triangulated results indicating a lack of resources is particularly
compelling and warrants further investigation to develop a mitigation strategy. Although
not as strong as the evidence supporting Lack of Resources, a case can be made for the
presence of Lack of Communication, Norms, and Complacency as well. Therefore, a
mitigation strategy for these preconditions should also be examined.
The majority of MOSA forms had checked boxes indicating that communication
between various personnel was occuring. However, if the communication being
observed does not relate to the task at hand, or if it is not interpreted correctly or not
received at all by the receipient, this tends to confound the performance of tasks such as
noted in the MER analysis. Since the MER analysis suggested Lack of Communication
was prevalent in events that had come to fruition, it would be worthwhile for the PA to
revisit this section of the MOSA form to see how it can be improved.
Finally, the evidence suggesting the presence of acquiescence bias in the
responses to the MCAS is worth noting. As such, a thorough review of the questions in
the survey instrument seems warranted. The literature concerning itself with
acquiescence bias as well as other possible Likert scale distortions is sufficient to allow
the PA to identify possible causes for this bias. The literature also includes various
methods to ensure respondents’ perception of anonymity.
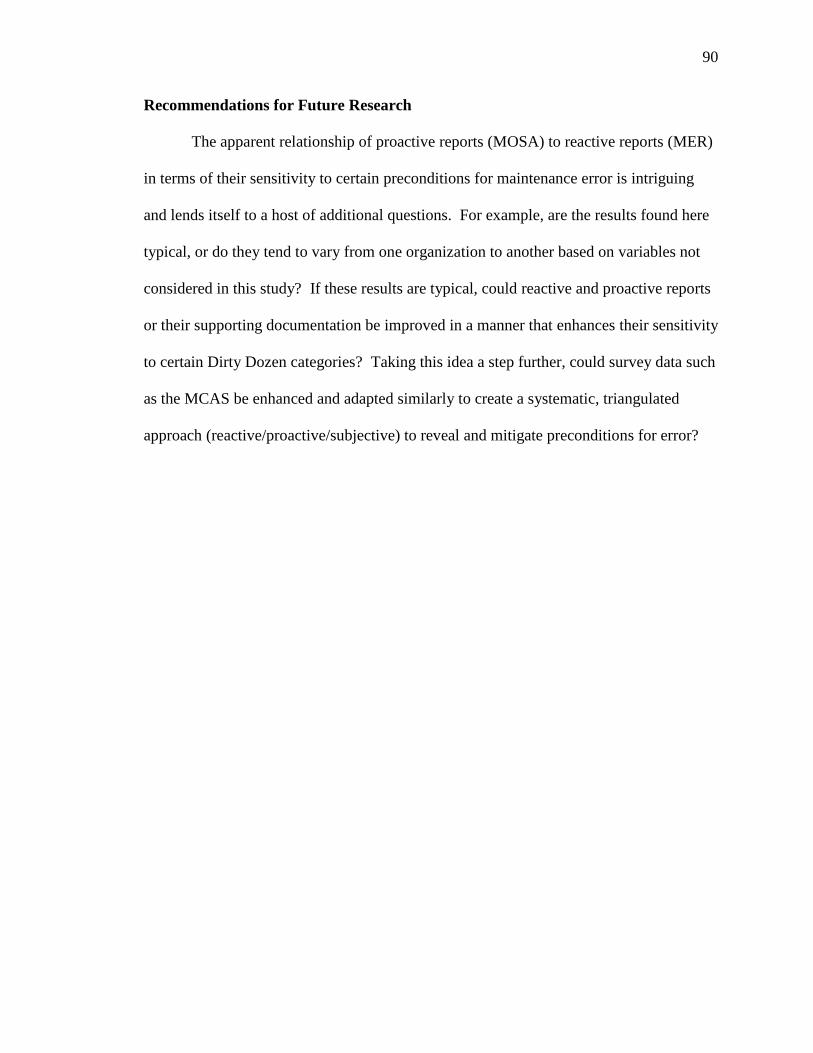
90
Recommendations for Future Research
The apparent relationship of proactive reports (MOSA) to reactive reports (MER)
in terms of their sensitivity to certain preconditions for maintenance error is intriguing
and lends itself to a host of additional questions. For example, are the results found here
typical, or do they tend to vary from one organization to another based on variables not
considered in this study? If these results are typical, could reactive and proactive reports
or their supporting documentation be improved in a manner that enhances their sensitivity
to certain Dirty Dozen categories? Taking this idea a step further, could survey data such
as the MCAS be enhanced and adapted similarly to create a systematic, triangulated
approach (reactive/proactive/subjective) to reveal and mitigate preconditions for error?
91
REFERENCES
Aeronautics and Space, 14 CFR §1.1 (2018). Retrieved from https://www.ecfr.gov/cgi-
bin/text-idx?rgn=div8&node=14:1.0.1.1.1.0.1.1
Allen, I. E., & Seaman, C. A. (2007). Likert scales and data analyses. Quality Progress,
40(7), 64.
Babbie, E. (2013). The practice of social research. Belmont, CA: Wadsworth Cengage
Learning.
Boeing (2013). Maintenance error decision aid (MEDA)© user’s guide. Maintenance
Human Factors, Boeing Commercial Aviation Services. Retrieved from
https://www.faa.gov/about/initiatives/maintenance_hf/library/documents/media/m
edia/MEDA_Users_Guide_Updated_09-25-13.pdf
Boyd, D., & Stolzer, A. (2015). Causes and trends in maintenance-related accidents in
FAA-certified single engine piston aircraft. Journal of Aviation Technology and
Engineering, 5(1), 17.
Bulmer, M. G. (1979). Principles of statistics. New York: Dover.
Chang, Y., & Wang, Y. (2010). Significant human risk factors in aircraft maintenance
technicians. Safety Science, 48 (1), 54-62. Retrieved from
https://doi.org/10.1016/j.ssci.2009.05.004
Civil Aviation Safety Authority (2013). Safety behaviours: Human factors for engineers.
Canberra ACT, Australia: Civil Aviation Safety Authority. Retrieved from
www.casa.gov.au.
Colosi, R. (2005). Negatively worded questions cause respondent confusion. Proceedings
of the Survey Research Methods Section, American Statistical Association, 2896-
2903.
92
Crayton, L., Hackworth, C., Roberts, C., & King, J. (2017). Line operations safety
assessments (LOSA) in maintenance and ramp environments. (DOT/FAA/AM-
17/7) Washington, D.C.: Office of Aerospace Medicine.
Dorn, M. D. (1996). Effects of maintenance human factors in maintenance-related
aircraft accidents. Transportation Research Record, 1517, 17- 28.
Dupont, G. (1997). The Dirty Dozen errors in aviation maintenance. In meeting
proceedings of 11th Federal Aviation Administration Meeting on Human Factors
Issues in Aircraft Maintenance and Inspection: Human error in aviation
maintenance (pp. 45-49). Washington, D.C.: Federal Aviation
Administration/Office of Aviation Medicine.
Dupont, G. (June, 2018). I’m only an AME. Director of Maintenance (DOM), 12-16.
Edwards, E. (1988). Introductory Overview. In E.L. Wiener & D.C. Nagel (Eds.), Human
factors in aviation (pp. 3-25). San Diego, CA: Academic Press.
FAA. (n.d.). Avoid the dirty dozen: 12 common causes of human factors errors. Retrieved
from https://www.faasafety.gov/files/gslac/library/documents/
2012/Nov/71574/DirtyDozenWeb3.pdf
FAA. (2004). Crew resource management training. (Advisory Circular 120-51e).
Washington, D.C.: Government Printing Office.
FAA. (2006). Advisory Circular: Line Operations Safety Audits (AC No: 120-90):
Federal Aviation Administration.
FAA (2008). Aviation maintenance handbook – general. FAA-H-8083-30 Chapter 14
(addendum). Oklahoma City, OK: Author. Retrieved from
https://www.faa.gov/regulations_policies/handbooks_manuals/aircraft/media/AM
T_Handbook_Addendum_Human_Factors.pdf
FAA. (2009). Risk management handbook. Washington, D.C.: Government Printing
Office.
93
FAA. (2013). Considerations for implementing maintenance line operations safety
assessment (M-LOSA) (v.5, August 2013). Retrieved from
https://www.faa.gov/about/initiatives/maintenance_hf/losa/training/media/training
_modules/Considerations_for_Implementing_M-LOSA.ppt
FAA. (2014). Operator’s manual: Human factors in aviation maintenance. Washington
D.C.: U.S. Government printing office.
FAA. (2015). Introduction to maintenance error analysis. Naval Safety Center, School of
Aviation Safety. Retrieved from https://www.faa.gov/about/initiatives/
maintenance_hf/library/documents/media/hfacs/1_introduction.pdf
Fabry, J. M. (1990). A glossary of terms, definitions, acronyms, and abbreviations related
to the National Airspace System (NAS) (No. DOT/FAA/CT-TN89/53). Atlantic
City, NJ: Federal Aviation Administration Technical Center.
Goldman, S. M., Fiedler, E. R., & King, R. E. (2002). General aviation maintenance-
related accidents: A review of ten years of NTSB Data (No. DOT/FAA/AM-
02/23). Oklahoma City OK: Federal Aviation Administration Civil Aeromedical
Institute.
Golafshani, N. (2003). Understanding reliability and validity in qualitative research. The
Qualitative Report, 8(4), 597-606. Retrieved from
http://nsuworks.nova.edu/tqr/vol8/iss4/6
Gramopadhye, A. K., Drury, C. G. (2000). Human factors in aviation maintenance: How
we got to where we are, International Journal of Industrial Ergonomics, 26(2),
125-131, ISSN 0169-8141. Retrieved from http://dx.doi.org/10.1016/S0169-
8141(99)00062-1.
Gross, E. (2018). The Likert scale explained — with examples & sample questions.
https://www.fieldboom.com/blog/likert-scale/
94
Hair, J., Black, W., Babin, B., Anderson, R. (2010). Multivariate data analysis (7th ed.).
Upper Saddle River, NJ: Prentice Hall.
Hayes, A.F. & Krippendorff, K. (2007) Answering the call for a standard reliability
measure for coding data, Communication Methods and Measures, 1:1, 77-89,
DOI: 10.1080/19312450709336664
Haynes, A. (1991). The crash of United flight 232. Edwards, California: NASA Ames
Research Center Dryden Flight Research Facility.
Heinrich, H. W., Petersen, D., & Roos, N. (1980). Industrial accident prevention: A
safety management approach (5th ed.) New York: McGraw-Hill. Retrieved from
https://www.faa.gov/about/initiatives/maintenance_hf/library/documents/media/hf
acs/1_introduction.pdf.
Helmreich, R. L., Klinect, J. R., & Wilhelm, J. A. (2017). System safety and threat and
error management: The line operational safety audit (LOSA). In Proceedings of
the Eleventh International Symposium on Aviation Psychology. Dayton, OH: Ohio
State University.
Hendricks, W. R. (1991) The Aloha Airlines accident — A new era for aging aircraft. In
S.N., Atluri, S.G., Sampath, & P. Tong (Eds.), Structural integrity of aging
airplanes (pp. 153-165). Springer, Berlin, Heidelberg: Springer Series in
Computational Mechanics.
Hobbs, A. (2008). An overview of human factors in aviation maintenance: Aviation
research and analysis report – AR-2008-055. Canberra, Australia: Australian
Transport Safety Bureau.
Hobbs, A., & Williamson, A. (2003). Associations between errors and contributing
factors in aircraft maintenance. Human Factors, 45(2), 186–201.
95
Hooper, B. & O'Hare, D. (2013). Exploring human error in military aviation flight safety
events using post-incident classification systems. Aviation, Space, and
Environmental Medicine, 84, 803-813. 10.3357/ASEM.3176.2013.
IATA (2008). Safety report 2008. Retrieved from http://www.iata.org/docx/IATA-
Safety-Report-2008.pdf
ICAO (1993). Human factors digest No. 7: Investigation of human factors in accidents
and incidents. Circular 240-AN/144. International Civil Aviation Organization.
ICAO (2002). Line operations safety audit, Doc 9803 AN/761. International Civil
Aviation Organization.
Johnson, B. R. (1997). Examining the validity structure of qualitative research.
Education, 118(3), 282-292.
Klinect, J. (2008). Line operations safety audit (LOSA): A practical overview.
ICAO/ASPA Regional Seminar TEM, LOSA & NOSS – Essential SMS Tools
Mexico City, Mexico. Retrieved from
https://www.icao.int/Meetings/AMC/MA/2008/ASPA/ASPA_LOSA_Klinect.pdf
Klinect, J. R., Murray, P., Merritt, A., & Helmreich, R. (2003). Line operations safety
audit (LOSA): Definition and operating characteristics. In Proceedings of the 12th
International Symposium on Aviation Psychology (pp. 663-668). Dayton, OH:
Ohio State University.
Langer, M., & Braithwaite, G. R. (2016). The development and deployment of a
Maintenance Operations Safety Survey. Human Factors, 58(7), 986-1006.
http://doi.org/10.1177/0018720816656085
Latorella, K. A., Prabhu, P. V. (2000). A review of human error in aviation maintenance
and inspection. International Journal of Industrial Ergonomics, 26(2), 133-161.
Retrieved from https://doi.org/10.1016/S0169-8141(99)00063-3
96
Lee, J. W., Jones, P. S., Mineyama, Y. and Zhang, X. E. (2002). Cultural differences in
responses to a Likert scale. Res. Nurs. Health, 25, 295-306.
doi:10.1002/nur.10041
Ma, M. J., & Grower, J. (2016). From “dirty dozen” to “filthy fifteen” -- Professionalism
in aircraft maintenance. Aviation MX Human Factors Quarterly, 4(2), 7-9.
Retrieved from https://www.faa.gov/about/initiatives/maintenance
_hf/fatigue/publications/media/december_2016_newsletter.pdf
Ma, M. J., & Rankin, W. L. (2012). Implementation guideline for maintenance line
operations safety assessment (M-LOSA) and ramp LOSA (R-LOSA) programs.
DOT/FAA/AM-12/9.
Marais, K. B., & Robichaud, M. R. (2012). Analysis of trends in aviation maintenance
risk: An empirical approach. Reliability Engineering & System Safety, 106, 104-
118.
Marquardt, N., Treffenstadt, C., Gerstmeyer, K., & Gades-Buettrich, R. (2015). Mental
workload and cognitive performance in operating rooms. International Journal of
Psychology Research, 10(2), 209-233.
Marx, D. A., & Graeber, R. C. (1994). Human error in aircraft maintenance. In N.
Johnston, N. McDonald, & R. Fuller (Eds.), Aviation psychology in practice (pp.
87-104). Aldershot, UK: Avebury.
Maurino, D., & Seminar, C. A. S. (2005, April). Threat and error management (TEM).
Canadian Aviation Safety Seminar (CASS). Vancouver, BC, 18-20 April 2005.
Merritt, A. C., & Klinect, J. R. (2006). Defensive flying for pilots: An introduction to
threat and error management. University of Texas Human Factors Research
Project, The LOSA Collaborative.
Patankar, M. S., & Taylor, J. C. (2008). MRM training, evaluation, and safety
management. International Journal of Aviation Psychology, 18(1), 61-71.
97
Patton, M. Q. (1990). Qualitative evaluation and research methods (2nd ed.). Newbury
Park, CA: Sage.
Rankin, W. (2007). MEDA investigation process. AERO Magazine QTR 2.07, 26.
Retrieved from http://www.boeing.com/commercial/aeromagazine
/articles/qtr_2_07/article_03_1.html.
Reason, J. (1990). Human error. New York, NY: Cambridge University Press.
Reinhart R. O. (1996). Basic flight physiology (2nd ed.). New York, NY: McGraw-Hill.
Schmidt, J., Lawson, D., & Figlock, R. (2001). Human factors analysis and classification
system – maintenance extension (HFACS-ME). Department of the Navy. Prepared
for the U.S. Department of Transportation, Federal Aviation Administration.
Shappell, S. A., & Wiegmann, D. A. (2000). The human factors analysis and
classification system--HFACS (No. DOT/FAA/AM-00/7). U.S. Federal Aviation
Administration, Office of Aviation Medicine.
Stolzer, A. J., Halford, C. D., & Goglia, J. J. (2015). Safety management systems in
aviation. Burlington, VT: Aldershot; Hampshire, England: Ashgate.
Taylor, J. C. (1999). Some effects of national culture in aviation maintenance (SAE Tech.
Paper No. 1999-01-2980). Vancouver, Canada: SAE Airframe/Engine
Maintenance and Repair Conference.
U.S. Department of Transportation (2017). Notification and reporting of aircraft
accidents or incidents and overdue aircraft, and preservation of aircraft
wreckage, mail, cargo, and records, 49 C.F.R. § 830.2.
Woods, D., Johannesen, L., Cook, R., & Sarter, N. (1995). Behind human error:
Cognitive systems, computers, and hindsight. Wright-Patterson Air Force Base,
OH: Crew Systems Ergonomics Information and Analysis Center.

98
APPENDIX A
Rater Biographies
99
Rater Biographies
David Castellar - Born and raised in New York City, Mr. Castellar attended
Aviation High school in Long Island City where he graduated in 1980 with his Airframe
& Powerplant certificates. He graduated in June of 1980 and started working for
Lockheed in July of that same year. He worked the L1011 line for a few months before
he was moved into the manufacturing of the first seven F-117 Night Hawks where he
remained for three years. Mr. Castellar also worked sheet metal, rigging, and hydraulics
on American Airlines’ DC-10 aircraft until he ultimately found his way to United
Airlines in San Francisco. He began working as a structural mechanic and quickly found
he had a gift for repairing composite structures. By 1991, he was teaching composite
repair for United Airlines’ maintenance workforce worldwide. In addition, he helped
develop United’s composite repair training program.
In 1993, Mr. Castellar became a member of the Commercial Aircraft Composite
Repair Committee (CACRC); he was a participating member to help the Commercial
industry try to set standards in the composite world. He was chairman of the Composite
task group for several years and is still very active with this committee. Mr. Castellar is
also a member of the Advanced Materials for Transport Aircraft Structures (AMTAS). In
2005, Mr. Castellar left United Airlines to go work for Abaris Training Resources Inc. in
Reno, Nevada, and became the chief instructor for Abaris Training. He has taught for
many different companies and has worked closely with the FAA to help set standards.
His 30 plus years of composite experience has helped train people from all over the
world.
100
Jose (Joe) Escobar – Mr. Escobar is the editorial director and co-founder of D.
O. M. magazine and has worked in the aviation industry for almost 30 years. Escobar
started working as a mechanic’s helper in 1988 at NAS Corpus Christi, TX. Quickly
working his way up the ranks maintaining Navy T-34s and T-44s, he earned his A&P
certificate in 1993. In 1997, after earning his Inspection Authorization (I.A.), Mr.
Escobar was promoted to the Quality Assurance department as a QA inspector. He was
instrumental in developing and writing work instructions for the company in conjunction
with receiving ISO 9000 certification in 1998. As part of his QA duties, he performed
regular audits of the maintenance operations. He also helped the maintenance team
perform root cause analysis whenever incidents or accidents occurred in order to develop
appropriate corrective actions to prevent future occurrences. As part of his interest in
root cause analysis, Mr. Escobar started to research Human Factors in 1998. His intent
was not only to learn more about Human Factors, but also to develop a Human Factors
training program for the company to use, especially for Inspection Authorization renewal
requirements for company employees who were stationed in remote sites.
In 1999, Mr. Escobar was selected as editor of Aircraft Maintenance Technology
(AMT) magazine. While at AMT, he researched topics on all areas of aircraft
maintenance in order to write technical articles for the magazine. After eight years of
working at AMT magazine, Mr. Escobar and two other colleagues had an idea of
launching a new publication. In April 2008, he left AMT magazine and launched
Director of Maintenance (D.O.M.) magazine with two business partners. The magazine
covers leadership and management subjects that help educate both current and future
aviation maintenance leaders. Mr. Escobar continues to promote Human Factors
101
education to this date. Gordon Dupont, the “father of the dirty dozen,” is a regular
contributor to D.O.M. magazine.
102
APPENDIX B
The Dirty Dozen Posters
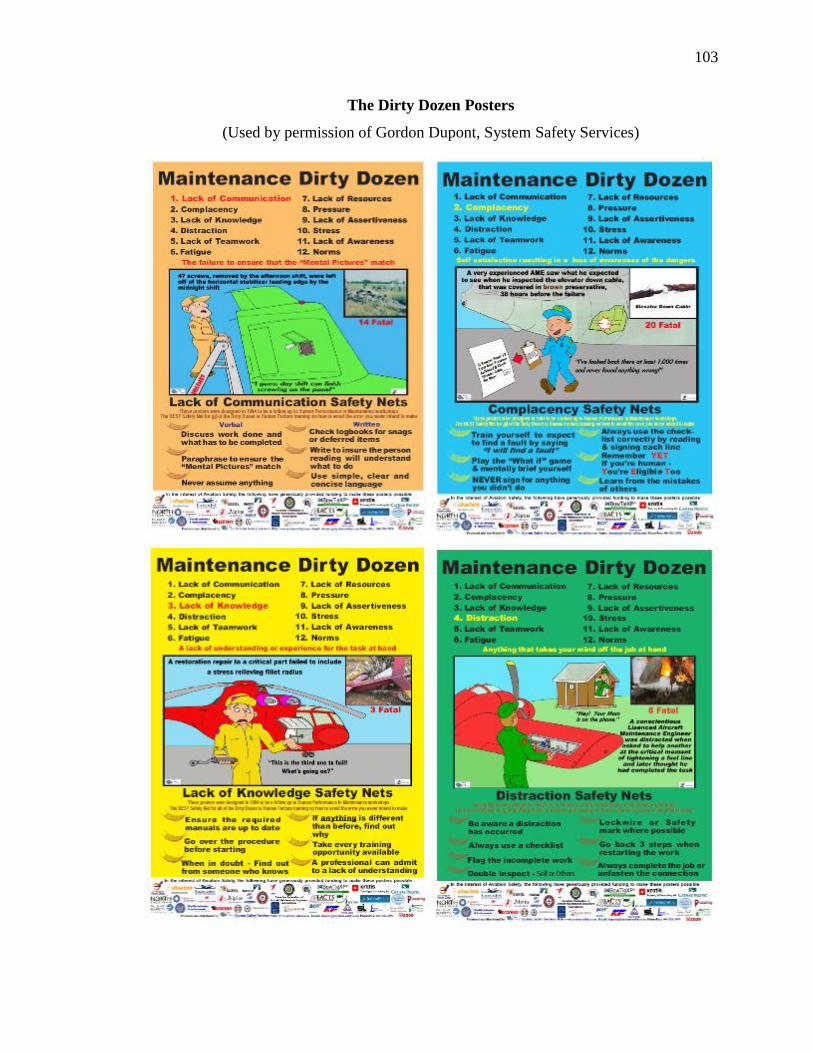
103
The Dirty Dozen Posters
(Used by permission of Gordon Dupont, System Safety Services)
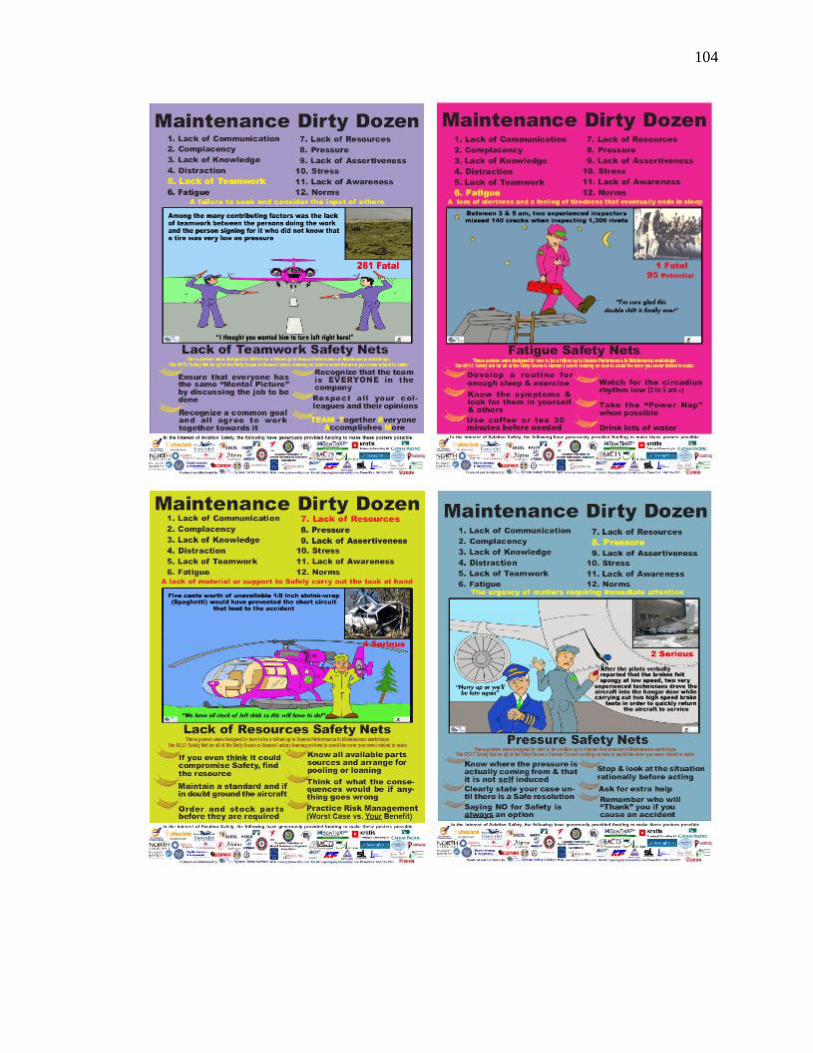
104
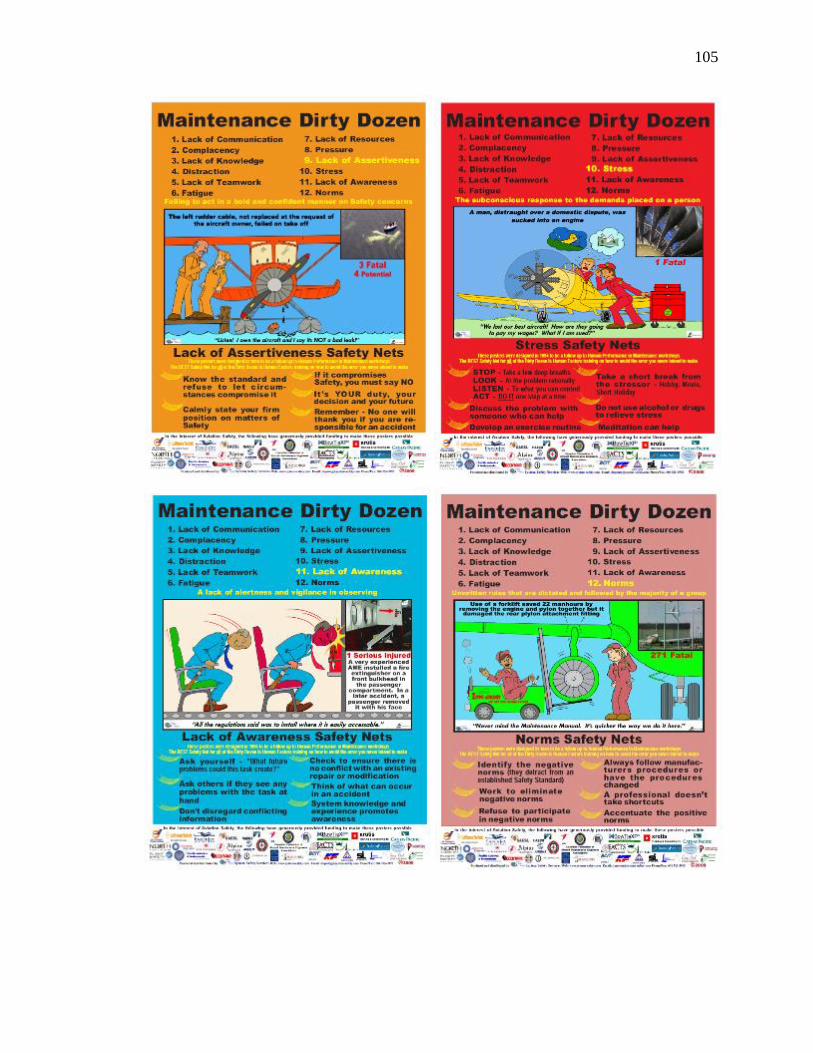
105

106
APPENDIX C
MER Scores for Raters A and B

107
MER Scores
1 RATER A RATER B Krippendorff's α
Lack of Communication 0 0 (Interval)
Lack of Knowledge 50 50 .97
Lack of Teamwork 0 0
Lack of Resources 30 40
Lack of Assertiveness 0 0
Lack of Awareness 0 0
Complacency 0 0
Distraction 0 0
Fatigue 0 0
Pressure 0 0
Stress 0 0
Norms 20 10
Other 0 0
2 RATER A RATER B Krippendorff's α
Lack of Communication 70 70 (Interval)
Lack of Knowledge 0 0 1.0
Lack of Teamwork 20 20
Lack of Resources 0 0
Lack of Assertiveness 0 0
Lack of Awareness 10 10
Complacency 0 0
Distraction 0 0
Fatigue 0 0
Pressure 0 0
Stress 0 0
Norms 0 0
Other 0 0
3 RATER A RATER B Krippendorff's α
Lack of Communication 50 50 (Interval)
Lack of Knowledge 0 0 .96
Lack of Teamwork 20 10
Lack of Resources 10 20
Lack of Assertiveness 0 0
Lack of Awareness 0 0
Complacency 0 0
Distraction 0 0
Fatigue 0 0
Pressure 10 10
Stress 0 0
Norms 10 10
Other 0 0
4 RATER A RATER B Krippendorff's α
Lack of Communication 0 0 (Interval)
Lack of Knowledge 0 0 .96
Lack of Teamwork 10 10
Lack of Resources 0 0
Lack of Assertiveness 0 0
Lack of Awareness 0 0
Complacency 40 30
Distraction 0 0
Fatigue 10 20
Pressure 0 0
Stress 0 0
Norms 40 40
Other 0 0
SU
RP
LU
SD
EF
ICIT
SU
RP
LU
SD
EF
ICIT
SU
RP
LU
SD
EF
ICIT
SU
RP
LU
SD
EF
ICIT
0
10
20
30
40
50
Event 1
RATER A RATER B
0
10
20
30
40
50
60
70
Event 2
RATER A RATER B
0
10
20
30
40
50
Event 3
RATER A RATER B
05
10152025303540
Event 4
RATER A RATER B
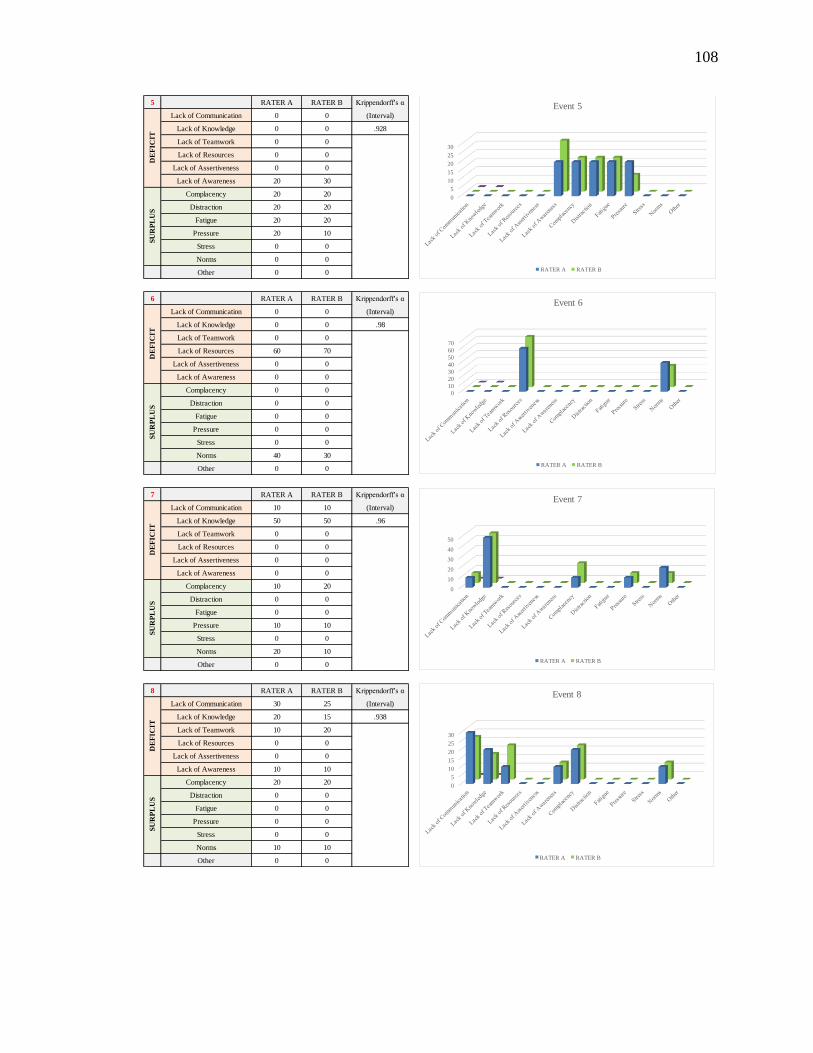
108
5 RATER A RATER B Krippendorff's α
Lack of Communication 0 0 (Interval)
Lack of Knowledge 0 0 .928
Lack of Teamwork 0 0
Lack of Resources 0 0
Lack of Assertiveness 0 0
Lack of Awareness 20 30
Complacency 20 20
Distraction 20 20
Fatigue 20 20
Pressure 20 10
Stress 0 0
Norms 0 0
Other 0 0
6 RATER A RATER B Krippendorff's α
Lack of Communication 0 0 (Interval)
Lack of Knowledge 0 0 .98
Lack of Teamwork 0 0
Lack of Resources 60 70
Lack of Assertiveness 0 0
Lack of Awareness 0 0
Complacency 0 0
Distraction 0 0
Fatigue 0 0
Pressure 0 0
Stress 0 0
Norms 40 30
Other 0 0
7 RATER A RATER B Krippendorff's α
Lack of Communication 10 10 (Interval)
Lack of Knowledge 50 50 .96
Lack of Teamwork 0 0
Lack of Resources 0 0
Lack of Assertiveness 0 0
Lack of Awareness 0 0
Complacency 10 20
Distraction 0 0
Fatigue 0 0
Pressure 10 10
Stress 0 0
Norms 20 10
Other 0 0
8 RATER A RATER B Krippendorff's α
Lack of Communication 30 25 (Interval)
Lack of Knowledge 20 15 .938
Lack of Teamwork 10 20
Lack of Resources 0 0
Lack of Assertiveness 0 0
Lack of Awareness 10 10
Complacency 20 20
Distraction 0 0
Fatigue 0 0
Pressure 0 0
Stress 0 0
Norms 10 10
Other 0 0
DE
FIC
ITS
UR
PL
US
DE
FIC
ITS
UR
PL
US
DE
FIC
ITS
UR
PL
US
DE
FIC
ITS
UR
PL
US
0
5
10
15
20
25
30
Event 5
RATER A RATER B
0
10
20
30
40
50
60
70
Event 6
RATER A RATER B
0
10
20
30
40
50
Event 7
RATER A RATER B
0
5
10
15
20
25
30
Event 8
RATER A RATER B
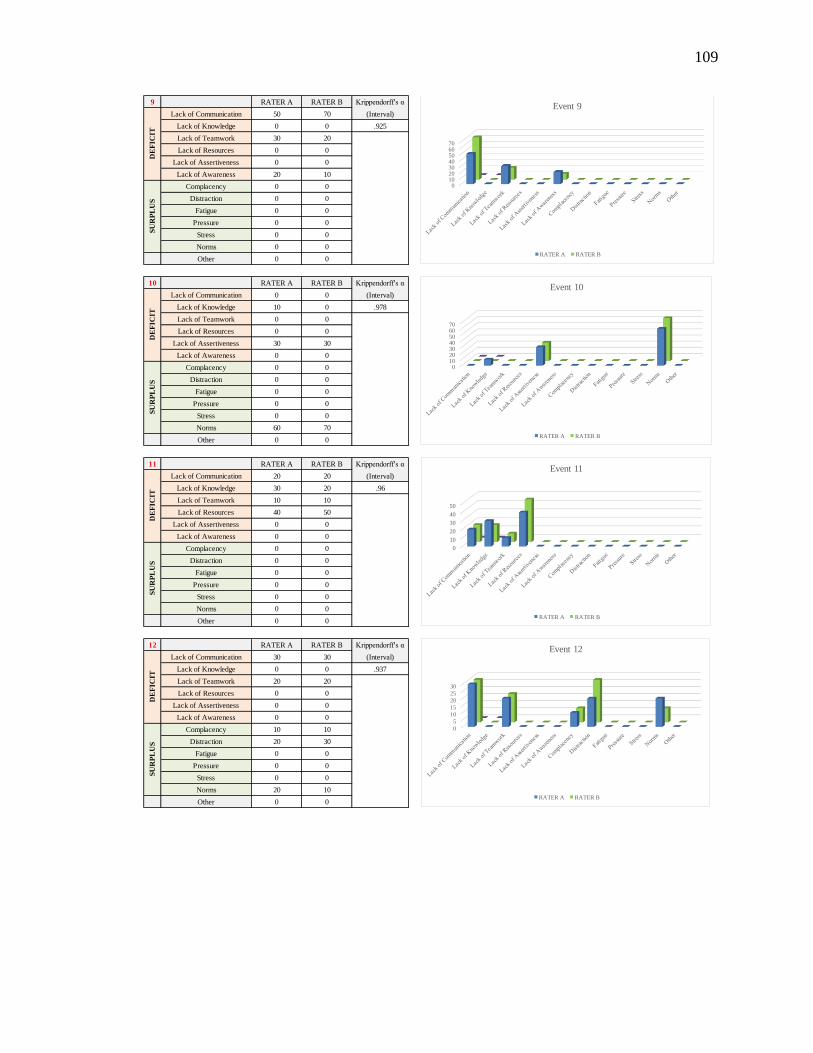
109
9 RATER A RATER B Krippendorff's α
Lack of Communication 50 70 (Interval)
Lack of Knowledge 0 0 .925
Lack of Teamwork 30 20
Lack of Resources 0 0
Lack of Assertiveness 0 0
Lack of Awareness 20 10
Complacency 0 0
Distraction 0 0
Fatigue 0 0
Pressure 0 0
Stress 0 0
Norms 0 0
Other 0 0
10 RATER A RATER B Krippendorff's α
Lack of Communication 0 0 (Interval)
Lack of Knowledge 10 0 .978
Lack of Teamwork 0 0
Lack of Resources 0 0
Lack of Assertiveness 30 30
Lack of Awareness 0 0
Complacency 0 0
Distraction 0 0
Fatigue 0 0
Pressure 0 0
Stress 0 0
Norms 60 70
Other 0 0
11 RATER A RATER B Krippendorff's α
Lack of Communication 20 20 (Interval)
Lack of Knowledge 30 20 .96
Lack of Teamwork 10 10
Lack of Resources 40 50
Lack of Assertiveness 0 0
Lack of Awareness 0 0
Complacency 0 0
Distraction 0 0
Fatigue 0 0
Pressure 0 0
Stress 0 0
Norms 0 0
Other 0 0
12 RATER A RATER B Krippendorff's α
Lack of Communication 30 30 (Interval)
Lack of Knowledge 0 0 .937
Lack of Teamwork 20 20
Lack of Resources 0 0
Lack of Assertiveness 0 0
Lack of Awareness 0 0
Complacency 10 10
Distraction 20 30
Fatigue 0 0
Pressure 0 0
Stress 0 0
Norms 20 10
Other 0 0
DE
FIC
ITS
UR
PL
US
DE
FIC
ITS
UR
PL
US
DE
FIC
ITS
UR
PL
US
SU
RP
LU
SD
EF
ICIT
010203040506070
Event 9
RATER A RATER B
010203040506070
Event 10
RATER A RATER B
0
10
20
30
40
50
Event 11
RATER A RATER B
0
5
10
15
20
25
30
Event 12
RATER A RATER B
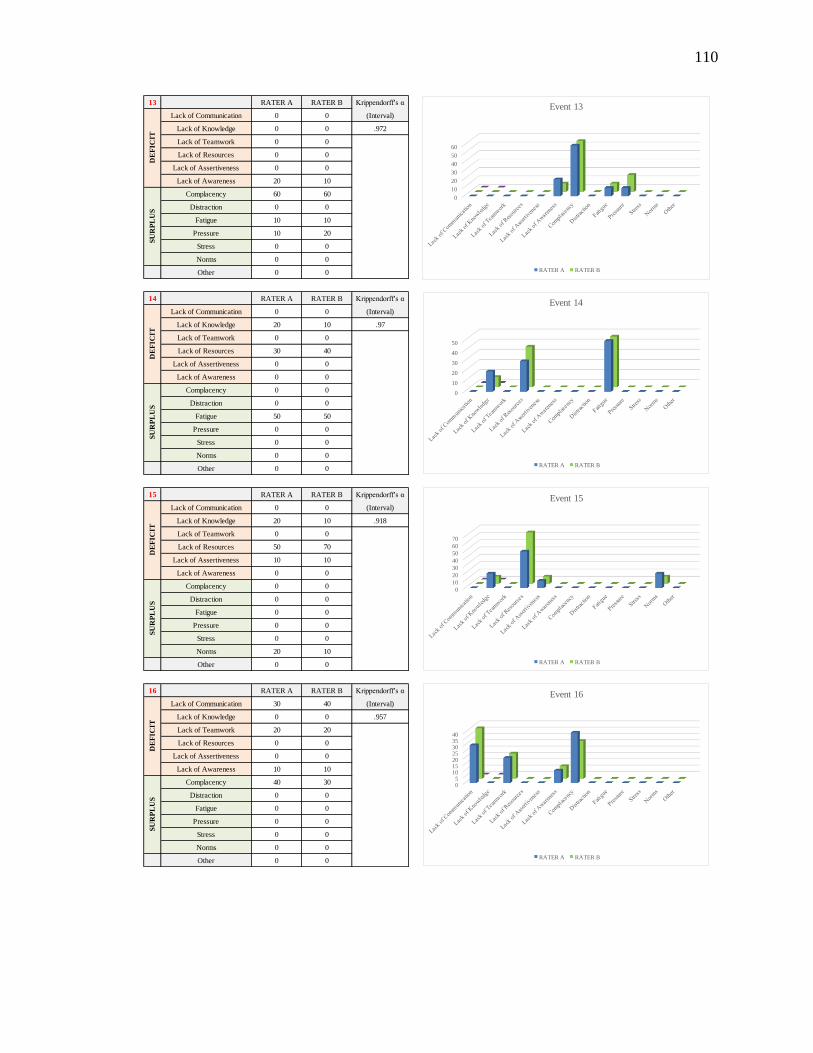
110
13 RATER A RATER B Krippendorff's α
Lack of Communication 0 0 (Interval)
Lack of Knowledge 0 0 .972
Lack of Teamwork 0 0
Lack of Resources 0 0
Lack of Assertiveness 0 0
Lack of Awareness 20 10
Complacency 60 60
Distraction 0 0
Fatigue 10 10
Pressure 10 20
Stress 0 0
Norms 0 0
Other 0 0
14 RATER A RATER B Krippendorff's α
Lack of Communication 0 0 (Interval)
Lack of Knowledge 20 10 .97
Lack of Teamwork 0 0
Lack of Resources 30 40
Lack of Assertiveness 0 0
Lack of Awareness 0 0
Complacency 0 0
Distraction 0 0
Fatigue 50 50
Pressure 0 0
Stress 0 0
Norms 0 0
Other 0 0
15 RATER A RATER B Krippendorff's α
Lack of Communication 0 0 (Interval)
Lack of Knowledge 20 10 .918
Lack of Teamwork 0 0
Lack of Resources 50 70
Lack of Assertiveness 10 10
Lack of Awareness 0 0
Complacency 0 0
Distraction 0 0
Fatigue 0 0
Pressure 0 0
Stress 0 0
Norms 20 10
Other 0 0
16 RATER A RATER B Krippendorff's α
Lack of Communication 30 40 (Interval)
Lack of Knowledge 0 0 .957
Lack of Teamwork 20 20
Lack of Resources 0 0
Lack of Assertiveness 0 0
Lack of Awareness 10 10
Complacency 40 30
Distraction 0 0
Fatigue 0 0
Pressure 0 0
Stress 0 0
Norms 0 0
Other 0 0
DE
FIC
ITS
UR
PL
US
SU
RP
LU
SD
EF
ICIT
SU
RP
LU
SD
EF
ICIT
SU
RP
LU
SD
EF
ICIT
0
10
20
30
40
50
60
Event 13
RATER A RATER B
0
10
20
30
40
50
Event 14
RATER A RATER B
0
10
20
30
40
50
60
70
Event 15
RATER A RATER B
05
10152025303540
Event 16
RATER A RATER B
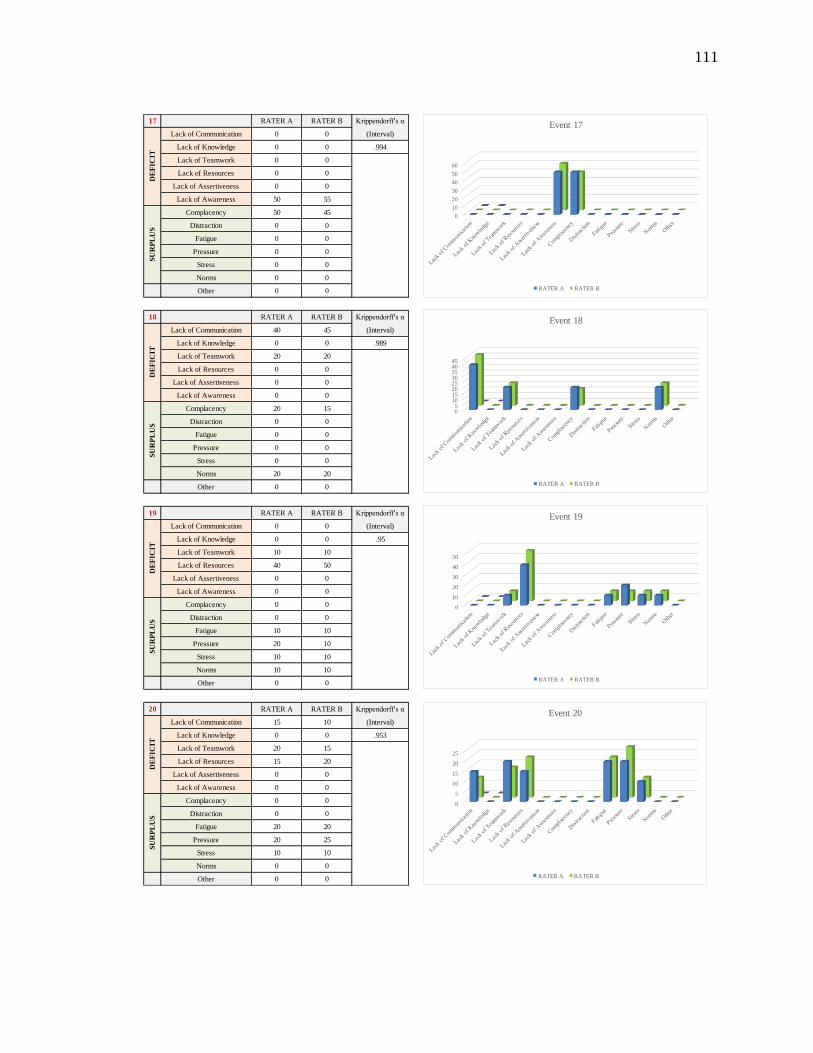
111
17 RATER A RATER B Krippendorff's α
Lack of Communication 0 0 (Interval)
Lack of Knowledge 0 0 .994
Lack of Teamwork 0 0
Lack of Resources 0 0
Lack of Assertiveness 0 0
Lack of Awareness 50 55
Complacency 50 45
Distraction 0 0
Fatigue 0 0
Pressure 0 0
Stress 0 0
Norms 0 0
Other 0 0
18 RATER A RATER B Krippendorff's α
Lack of Communication 40 45 (Interval)
Lack of Knowledge 0 0 .989
Lack of Teamwork 20 20
Lack of Resources 0 0
Lack of Assertiveness 0 0
Lack of Awareness 0 0
Complacency 20 15
Distraction 0 0
Fatigue 0 0
Pressure 0 0
Stress 0 0
Norms 20 20
Other 0 0
19 RATER A RATER B Krippendorff's α
Lack of Communication 0 0 (Interval)
Lack of Knowledge 0 0 .95
Lack of Teamwork 10 10
Lack of Resources 40 50
Lack of Assertiveness 0 0
Lack of Awareness 0 0
Complacency 0 0
Distraction 0 0
Fatigue 10 10
Pressure 20 10
Stress 10 10
Norms 10 10
Other 0 0
20 RATER A RATER B Krippendorff's α
Lack of Communication 15 10 (Interval)
Lack of Knowledge 0 0 .953
Lack of Teamwork 20 15
Lack of Resources 15 20
Lack of Assertiveness 0 0
Lack of Awareness 0 0
Complacency 0 0
Distraction 0 0
Fatigue 20 20
Pressure 20 25
Stress 10 10
Norms 0 0
Other 0 0
DE
FIC
ITS
UR
PL
US
DE
FIC
ITS
UR
PL
US
DE
FIC
ITS
UR
PL
US
DE
FIC
ITS
UR
PL
US
0
10
20
30
40
50
60
Event 17
RATER A RATER B
05
1015202530354045
Event 18
RATER A RATER B
0
10
20
30
40
50
Event 19
RATER A RATER B
0
5
10
15
20
25
Event 20
RATER A RATER B
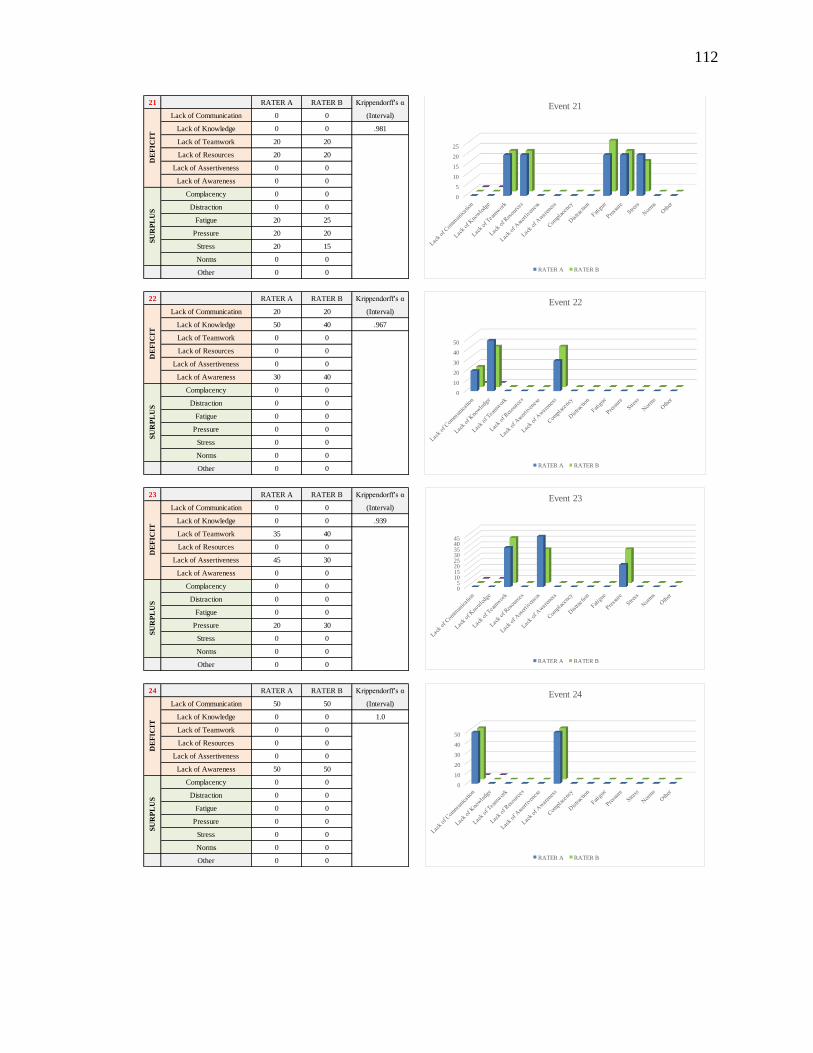
112
21 RATER A RATER B Krippendorff's α
Lack of Communication 0 0 (Interval)
Lack of Knowledge 0 0 .981
Lack of Teamwork 20 20
Lack of Resources 20 20
Lack of Assertiveness 0 0
Lack of Awareness 0 0
Complacency 0 0
Distraction 0 0
Fatigue 20 25
Pressure 20 20
Stress 20 15
Norms 0 0
Other 0 0
22 RATER A RATER B Krippendorff's α
Lack of Communication 20 20 (Interval)
Lack of Knowledge 50 40 .967
Lack of Teamwork 0 0
Lack of Resources 0 0
Lack of Assertiveness 0 0
Lack of Awareness 30 40
Complacency 0 0
Distraction 0 0
Fatigue 0 0
Pressure 0 0
Stress 0 0
Norms 0 0
Other 0 0
23 RATER A RATER B Krippendorff's α
Lack of Communication 0 0 (Interval)
Lack of Knowledge 0 0 .939
Lack of Teamwork 35 40
Lack of Resources 0 0
Lack of Assertiveness 45 30
Lack of Awareness 0 0
Complacency 0 0
Distraction 0 0
Fatigue 0 0
Pressure 20 30
Stress 0 0
Norms 0 0
Other 0 0
24 RATER A RATER B Krippendorff's α
Lack of Communication 50 50 (Interval)
Lack of Knowledge 0 0 1.0
Lack of Teamwork 0 0
Lack of Resources 0 0
Lack of Assertiveness 0 0
Lack of Awareness 50 50
Complacency 0 0
Distraction 0 0
Fatigue 0 0
Pressure 0 0
Stress 0 0
Norms 0 0
Other 0 0
DE
FIC
ITS
UR
PL
US
DE
FIC
ITS
UR
PL
US
DE
FIC
ITS
UR
PL
US
SU
RP
LU
SD
EF
ICIT
0
5
10
15
20
25
Event 21
RATER A RATER B
0
10
20
30
40
50
Event 22
RATER A RATER B
05
1015202530354045
Event 23
RATER A RATER B
0
10
20
30
40
50
Event 24
RATER A RATER B
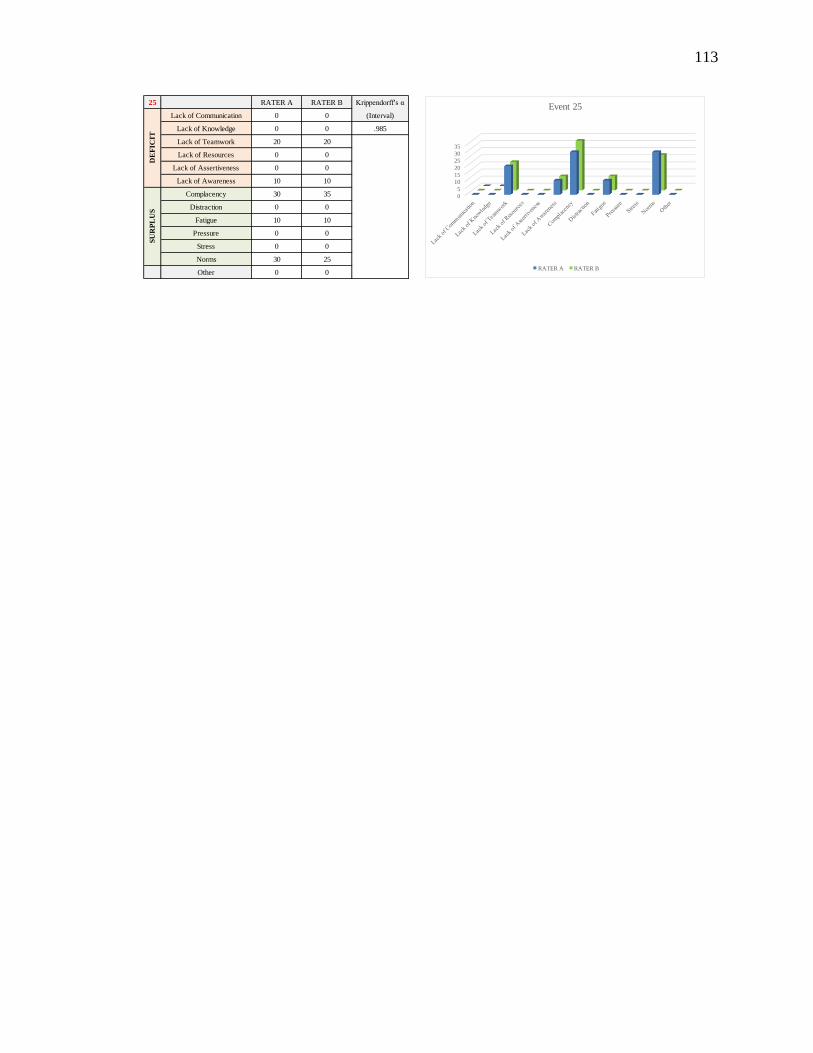
113
25 RATER A RATER B Krippendorff's α
Lack of Communication 0 0 (Interval)
Lack of Knowledge 0 0 .985
Lack of Teamwork 20 20
Lack of Resources 0 0
Lack of Assertiveness 0 0
Lack of Awareness 10 10
Complacency 30 35
Distraction 0 0
Fatigue 10 10
Pressure 0 0
Stress 0 0
Norms 30 25
Other 0 0
DE
FIC
ITS
UR
PL
US
0
5
10
15
20
25
30
35
Event 25
RATER A RATER B
114
APPENDIX D
MOSA Scores for Raters A and B
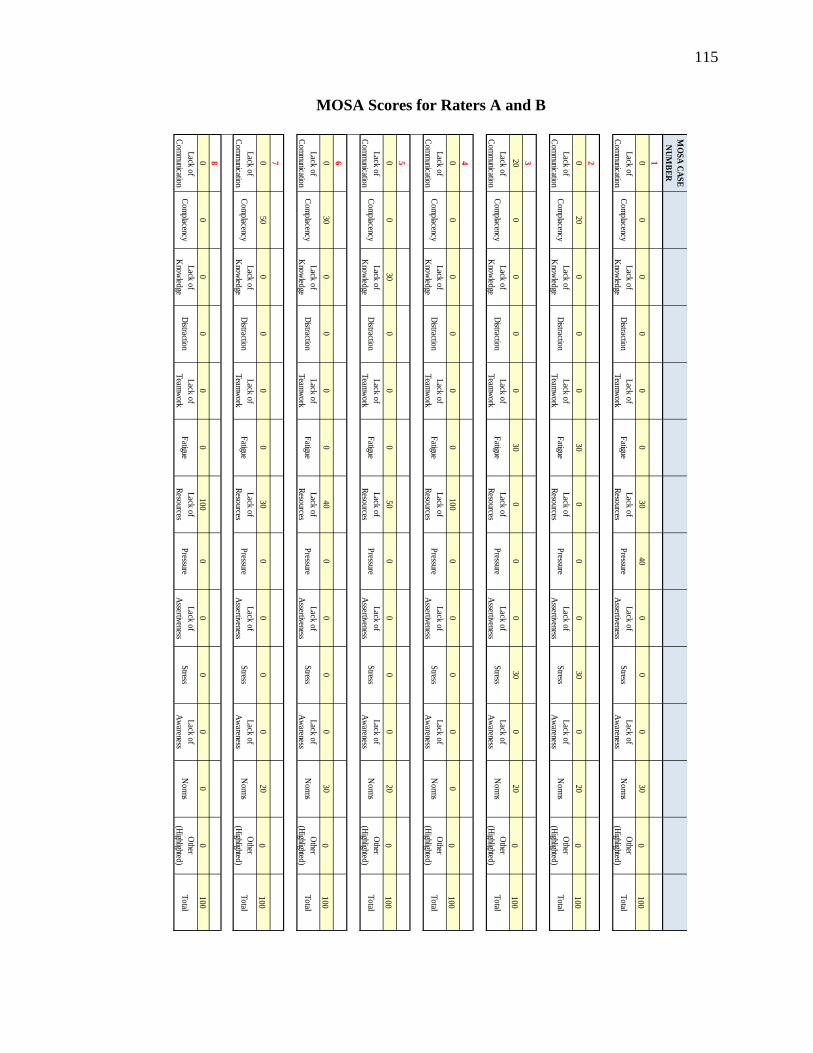
115
MOSA Scores for Raters A and B
M
OS
A C
AS
E
NU
MB
ER
100
00
00
30
40
00
030
0100
Lack
of
Com
municatio
nC
om
placency
Lack
of
Kno
wled
geD
istraction
Lack
of
Team
work
Fatigue
Lack
of
Reso
urcesP
ressureL
ack o
f
Assertiveness
Stress
Lack
of
Aw
arenessN
orm
sO
ther
(Highlighted
)T
otal
2020
00
030
00
030
020
0100
Lack
of
Com
municatio
nC
om
placency
Lack
of
Kno
wled
geD
istraction
Lack
of
Team
work
Fatigue
Lack
of
Reso
urcesP
ressureL
ack o
f
Assertiveness
Stress
Lack
of
Aw
arenessN
orm
sO
ther
(Highlighted
)T
otal
320
00
00
30
00
030
020
0100
Lack
of
Com
municatio
nC
om
placency
Lack
of
Kno
wled
geD
istraction
Lack
of
Team
work
Fatigue
Lack
of
Reso
urcesP
ressureL
ack o
f
Assertiveness
Stress
Lack
of
Aw
arenessN
orm
sO
ther
(Highlighted
)T
otal
400
00
00
100
00
00
00
100
Lack
of
Com
municatio
nC
om
placency
Lack
of
Kno
wled
geD
istraction
Lack
of
Team
work
Fatigue
Lack
of
Reso
urcesP
ressureL
ack o
f
Assertiveness
Stress
Lack
of
Aw
arenessN
orm
sO
ther
(Highlighted
)T
otal
500
30
00
050
00
00
20
0100
Lack
of
Com
municatio
nC
om
placency
Lack
of
Kno
wled
geD
istraction
Lack
of
Team
work
Fatigue
Lack
of
Reso
urcesP
ressureL
ack o
f
Assertiveness
Stress
Lack
of
Aw
arenessN
orm
sO
ther
(Highlighted
)T
otal
6030
00
00
40
00
00
30
0100
Lack
of
Com
municatio
nC
om
placency
Lack
of
Kno
wled
geD
istraction
Lack
of
Team
work
Fatigue
Lack
of
Reso
urcesP
ressureL
ack o
f
Assertiveness
Stress
Lack
of
Aw
arenessN
orm
sO
ther
(Highlighted
)T
otal
7050
00
00
30
00
00
20
0100
Lack
of
Com
municatio
nC
om
placency
Lack
of
Kno
wled
geD
istraction
Lack
of
Team
work
Fatigue
Lack
of
Reso
urcesP
ressureL
ack o
f
Assertiveness
Stress
Lack
of
Aw
arenessN
orm
sO
ther
(Highlighted
)T
otal
800
00
00
100
00
00
00
100
Lack
of
Com
municatio
nC
om
placency
Lack
of
Kno
wled
geD
istraction
Lack
of
Team
work
Fatigue
Lack
of
Reso
urcesP
ressureL
ack o
f
Assertiveness
Stress
Lack
of
Aw
arenessN
orm
sO
ther
(Highlighted
)T
otal
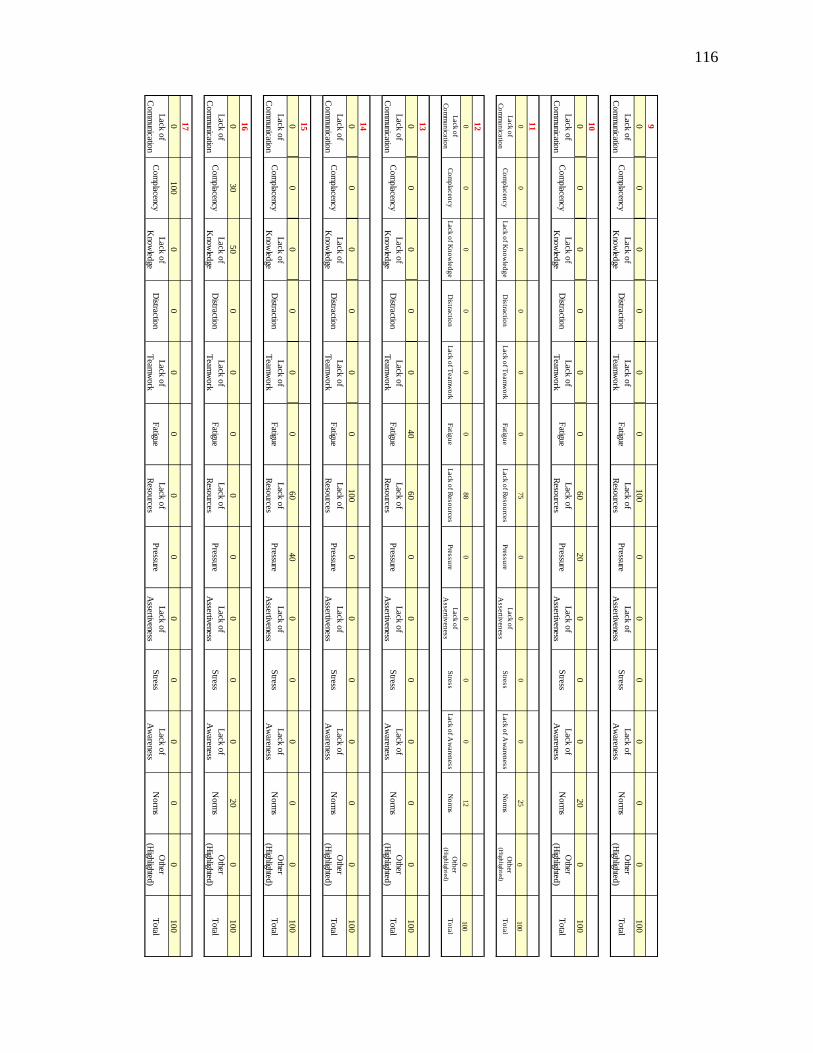
116
900
00
00
100
00
00
00
100
Lack
of
Co
mm
unication
Co
mp
lacencyL
ack o
f
Kno
wled
geD
istraction
Lack
of
Team
wo
rkF
atigueL
ack o
f
Reso
urcesP
ressureL
ack o
f
Assertiveness
Stress
Lack
of
Aw
arenessN
orm
sO
ther
(Highlighted
)T
otal
100
00
00
060
20
00
020
0100
Lack
of
Co
mm
unication
Co
mp
lacencyL
ack o
f
Kno
wled
geD
istraction
Lack
of
Team
wo
rkF
atigueL
ack o
f
Reso
urcesP
ressureL
ack o
f
Assertiveness
Stress
Lack
of
Aw
arenessN
orm
sO
ther
(Highlighted
)T
otal
110
00
00
075
00
00
25
0100
Lack o
f
Co
mm
un
icatio
nC
om
pla
cen
cy
Lack o
f Kn
ow
led
ge
Dis
tractio
nL
ack o
f Team
wo
rkF
atig
ue
Lack o
f Reso
urc
es
Pre
ssu
reL
ack o
f
Assertiv
en
ess
Stre
ss
Lack o
f Aw
are
ness
No
rms
Oth
er
(Hig
hlig
hted
)T
ota
l
120
00
00
088
00
00
12
0100
Lack o
f
Co
mm
un
icatio
nC
om
pla
cen
cy
Lack o
f Kn
ow
led
ge
Dis
tractio
nL
ack o
f Team
wo
rkF
atig
ue
Lack o
f Reso
urc
es
Pre
ssu
reL
ack o
f
Assertiv
en
ess
Stre
ss
Lack o
f Aw
are
ness
No
rms
Oth
er
(Hig
hlig
hted
)T
ota
l
130
00
00
40
60
00
00
00
100
Lack
of
Co
mm
unication
Co
mp
lacencyL
ack o
f
Kno
wled
geD
istraction
Lack
of
Team
wo
rkF
atigueL
ack o
f
Reso
urcesP
ressureL
ack o
f
Assertiveness
Stress
Lack
of
Aw
arenessN
orm
sO
ther
(Highlighted
)T
otal
140
00
00
0100
00
00
00
100
Lack
of
Co
mm
unication
Co
mp
lacencyL
ack o
f
Kno
wled
geD
istraction
Lack
of
Team
wo
rkF
atigueL
ack o
f
Reso
urcesP
ressureL
ack o
f
Assertiveness
Stress
Lack
of
Aw
arenessN
orm
sO
ther
(Highlighted
)T
otal
150
00
00
060
40
00
00
0100
Lack
of
Co
mm
unication
Co
mp
lacencyL
ack o
f
Kno
wled
geD
istraction
Lack
of
Team
wo
rkF
atigueL
ack o
f
Reso
urcesP
ressureL
ack o
f
Assertiveness
Stress
Lack
of
Aw
arenessN
orm
sO
ther
(Highlighted
)T
otal
160
30
50
00
00
00
00
20
0100
Lack
of
Co
mm
unication
Co
mp
lacencyL
ack o
f
Kno
wled
geD
istraction
Lack
of
Team
wo
rkF
atigueL
ack o
f
Reso
urcesP
ressureL
ack o
f
Assertiveness
Stress
Lack
of
Aw
arenessN
orm
sO
ther
(Highlighted
)T
otal
170
100
00
00
00
00
00
0100
Lack
of
Co
mm
unication
Co
mp
lacencyL
ack o
f
Kno
wled
geD
istraction
Lack
of
Team
wo
rkF
atigueL
ack o
f
Reso
urcesP
ressureL
ack o
f
Assertiveness
Stress
Lack
of
Aw
arenessN
orm
sO
ther
(Highlighted
)T
otal
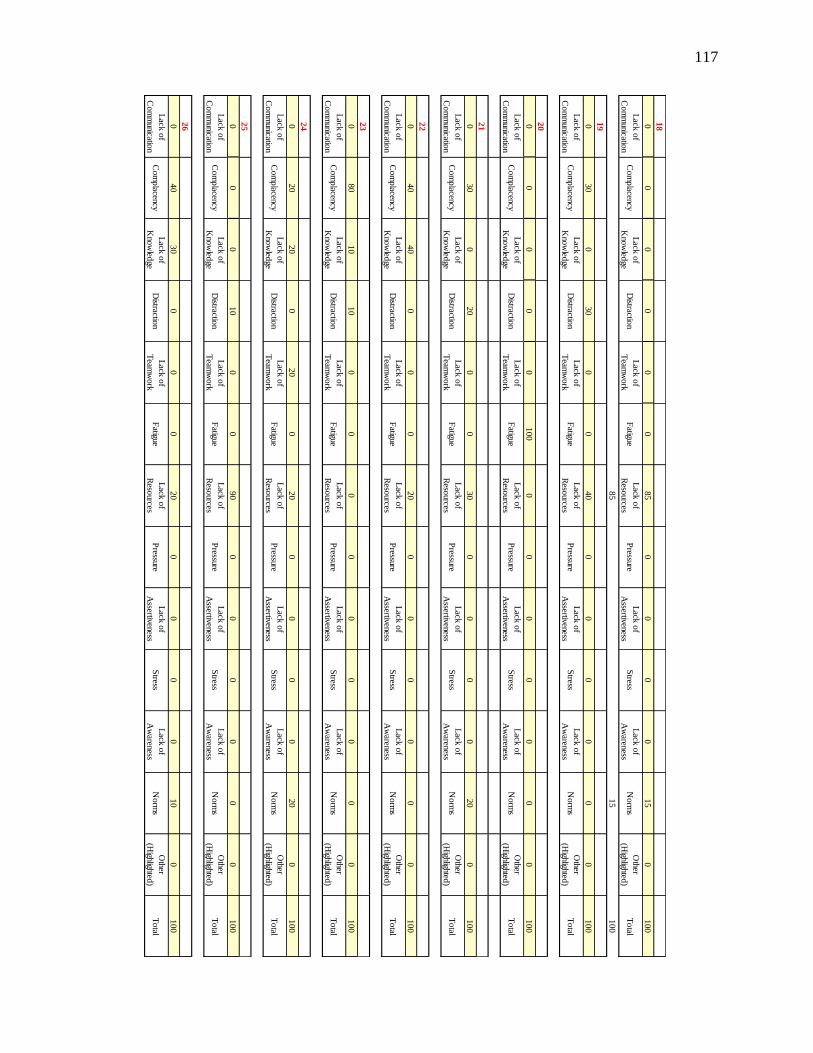
117
180
00
00
085
00
00
15
0100
Lack
of
Com
municatio
nC
om
placency
Lack
of
Kno
wled
geD
istraction
Lack
of
Team
work
Fatigue
Lack
of
Reso
urcesP
ressureL
ack o
f
Assertiveness
Stress
Lack
of
Aw
arenessN
orm
sO
ther
(Highlighted
)T
otal
85
15
100
190
30
030
00
40
00
00
00
100
Lack
of
Com
municatio
nC
om
placency
Lack
of
Kno
wled
geD
istraction
Lack
of
Team
work
Fatigue
Lack
of
Reso
urcesP
ressureL
ack o
f
Assertiveness
Stress
Lack
of
Aw
arenessN
orm
sO
ther
(Highlighted
)T
otal
200
00
00
100
00
00
00
0100
Lack
of
Com
municatio
nC
om
placency
Lack
of
Kno
wled
geD
istraction
Lack
of
Team
work
Fatigue
Lack
of
Reso
urcesP
ressureL
ack o
f
Assertiveness
Stress
Lack
of
Aw
arenessN
orm
sO
ther
(Highlighted
)T
otal
210
30
020
00
30
00
00
20
0100
Lack
of
Com
municatio
nC
om
placency
Lack
of
Kno
wled
geD
istraction
Lack
of
Team
work
Fatigue
Lack
of
Reso
urcesP
ressureL
ack o
f
Assertiveness
Stress
Lack
of
Aw
arenessN
orm
sO
ther
(Highlighted
)T
otal
220
40
40
00
020
00
00
00
100
Lack
of
Com
municatio
nC
om
placency
Lack
of
Kno
wled
geD
istraction
Lack
of
Team
work
Fatigue
Lack
of
Reso
urcesP
ressureL
ack o
f
Assertiveness
Stress
Lack
of
Aw
arenessN
orm
sO
ther
(Highlighted
)T
otal
230
80
10
10
00
00
00
00
0100
Lack
of
Com
municatio
nC
om
placency
Lack
of
Kno
wled
geD
istraction
Lack
of
Team
work
Fatigue
Lack
of
Reso
urcesP
ressureL
ack o
f
Assertiveness
Stress
Lack
of
Aw
arenessN
orm
sO
ther
(Highlighted
)T
otal
240
20
20
020
020
00
00
20
0100
Lack
of
Com
municatio
nC
om
placency
Lack
of
Kno
wled
geD
istraction
Lack
of
Team
work
Fatigue
Lack
of
Reso
urcesP
ressureL
ack o
f
Assertiveness
Stress
Lack
of
Aw
arenessN
orm
sO
ther
(Highlighted
)T
otal
250
00
10
00
90
00
00
00
100
Lack
of
Com
municatio
nC
om
placency
Lack
of
Kno
wled
geD
istraction
Lack
of
Team
work
Fatigue
Lack
of
Reso
urcesP
ressureL
ack o
f
Assertiveness
Stress
Lack
of
Aw
arenessN
orm
sO
ther
(Highlighted
)T
otal
260
40
30
00
020
00
00
10
0100
Lack
of
Com
municatio
nC
om
placency
Lack
of
Kno
wled
geD
istraction
Lack
of
Team
work
Fatigue
Lack
of
Reso
urcesP
ressureL
ack o
f
Assertiveness
Stress
Lack
of
Aw
arenessN
orm
sO
ther
(Highlighted
)T
otal
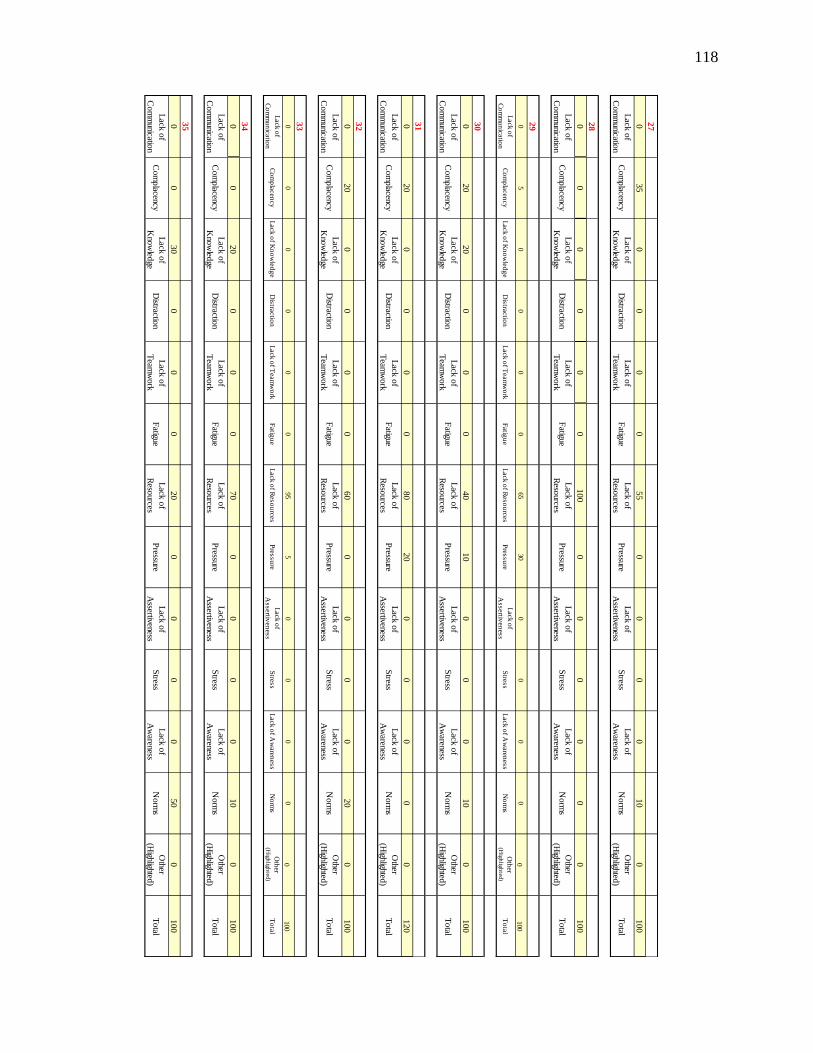
118
270
35
00
00
55
00
00
10
0100
Lack
of
Co
mm
unication
Co
mp
lacencyL
ack o
f
Kno
wled
geD
istraction
Lack
of
Team
wo
rkF
atigueL
ack o
f
Reso
urcesP
ressureL
ack o
f
Assertiveness
Stress
Lack
of
Aw
arenessN
orm
sO
ther
(Highlighted
)T
otal
280
00
00
0100
00
00
00
100
Lack
of
Co
mm
unication
Co
mp
lacencyL
ack o
f
Kno
wled
geD
istraction
Lack
of
Team
wo
rkF
atigueL
ack o
f
Reso
urcesP
ressureL
ack o
f
Assertiveness
Stress
Lack
of
Aw
arenessN
orm
sO
ther
(Highlighted
)T
otal
290
50
00
065
30
00
00
0100
Lack o
f
Co
mm
un
icatio
nC
om
pla
cen
cy
Lack o
f Kn
ow
led
ge
Dis
tractio
nL
ack o
f Team
wo
rkF
atig
ue
Lack o
f Reso
urc
es
Pre
ssu
reL
ack o
f
Assertiv
en
ess
Stre
ss
Lack o
f Aw
are
ness
No
rms
Oth
er
(Hig
hlig
hted
)T
ota
l
300
20
20
00
040
10
00
010
0100
Lack
of
Co
mm
unication
Co
mp
lacencyL
ack o
f
Kno
wled
geD
istraction
Lack
of
Team
wo
rkF
atigueL
ack o
f
Reso
urcesP
ressureL
ack o
f
Assertiveness
Stress
Lack
of
Aw
arenessN
orm
sO
ther
(Highlighted
)T
otal
310
20
00
00
80
20
00
00
0120
Lack
of
Co
mm
unication
Co
mp
lacencyL
ack o
f
Kno
wled
geD
istraction
Lack
of
Team
wo
rkF
atigueL
ack o
f
Reso
urcesP
ressureL
ack o
f
Assertiveness
Stress
Lack
of
Aw
arenessN
orm
sO
ther
(Highlighted
)T
otal
320
20
00
00
60
00
00
20
0100
Lack
of
Co
mm
unication
Co
mp
lacencyL
ack o
f
Kno
wled
geD
istraction
Lack
of
Team
wo
rkF
atigueL
ack o
f
Reso
urcesP
ressureL
ack o
f
Assertiveness
Stress
Lack
of
Aw
arenessN
orm
sO
ther
(Highlighted
)T
otal
330
00
00
095
50
00
00
100
Lack o
f
Co
mm
un
icatio
nC
om
pla
cen
cy
Lack o
f Kn
ow
led
ge
Dis
tractio
nL
ack o
f Team
wo
rkF
atig
ue
Lack o
f Reso
urc
es
Pre
ssu
reL
ack o
f
Assertiv
en
ess
Stre
ss
Lack o
f Aw
are
ness
No
rms
Oth
er
(Hig
hlig
hted
)T
ota
l
340
020
00
070
00
00
10
0100
Lack
of
Co
mm
unication
Co
mp
lacencyL
ack o
f
Kno
wled
geD
istraction
Lack
of
Team
wo
rkF
atigueL
ack o
f
Reso
urcesP
ressureL
ack o
f
Assertiveness
Stress
Lack
of
Aw
arenessN
orm
sO
ther
(Highlighted
)T
otal
350
030
00
020
00
00
50
0100
Lack
of
Co
mm
unication
Co
mp
lacencyL
ack o
f
Kno
wled
geD
istraction
Lack
of
Team
wo
rkF
atigueL
ack o
f
Reso
urcesP
ressureL
ack o
f
Assertiveness
Stress
Lack
of
Aw
arenessN
orm
sO
ther
(Highlighted
)T
otal
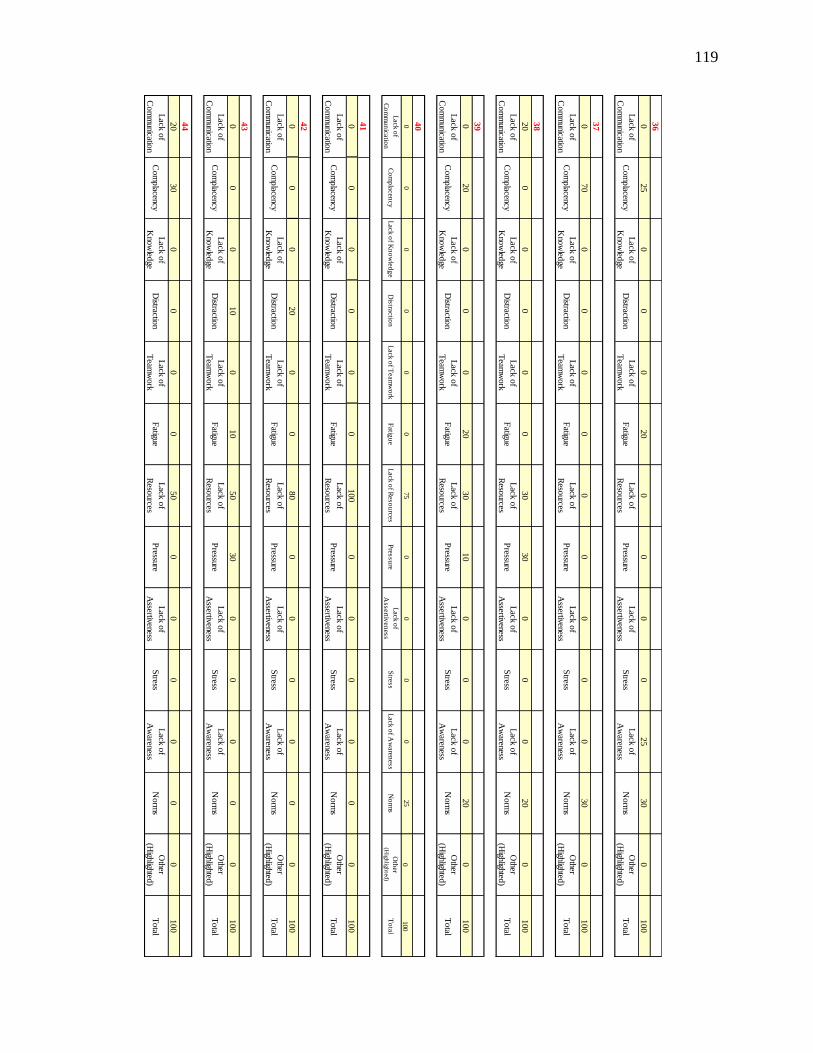
119
360
25
00
020
00
00
25
30
0100
Lack
of
Co
mm
unication
Co
mp
lacencyL
ack o
f
Kno
wled
geD
istraction
Lack
of
Team
wo
rkF
atigueL
ack o
f
Reso
urcesP
ressureL
ack o
f
Assertiveness
Stress
Lack
of
Aw
arenessN
orm
sO
ther
(Highlighted
)T
otal
370
70
00
00
00
00
030
0100
Lack
of
Co
mm
unication
Co
mp
lacencyL
ack o
f
Kno
wled
geD
istraction
Lack
of
Team
wo
rkF
atigueL
ack o
f
Reso
urcesP
ressureL
ack o
f
Assertiveness
Stress
Lack
of
Aw
arenessN
orm
sO
ther
(Highlighted
)T
otal
38
20
00
00
030
30
00
020
0100
Lack
of
Co
mm
unication
Co
mp
lacencyL
ack o
f
Kno
wled
geD
istraction
Lack
of
Team
wo
rkF
atigueL
ack o
f
Reso
urcesP
ressureL
ack o
f
Assertiveness
Stress
Lack
of
Aw
arenessN
orm
sO
ther
(Highlighted
)T
otal
390
20
00
020
30
10
00
020
0100
Lack
of
Co
mm
unication
Co
mp
lacencyL
ack o
f
Kno
wled
geD
istraction
Lack
of
Team
wo
rkF
atigueL
ack o
f
Reso
urcesP
ressureL
ack o
f
Assertiveness
Stress
Lack
of
Aw
arenessN
orm
sO
ther
(Highlighted
)T
otal
400
00
00
075
00
00
25
0100
Lack o
f
Co
mm
un
icatio
nC
om
pla
cen
cy
Lack o
f Kn
ow
led
ge
Dis
tractio
nL
ack o
f Team
wo
rkF
atig
ue
Lack o
f Reso
urc
es
Pre
ssu
reL
ack o
f
Assertiv
en
ess
Stre
ss
Lack o
f Aw
are
ness
No
rms
Oth
er
(Hig
hlig
hted
)T
ota
l
410
00
00
0100
00
00
00
100
Lack
of
Co
mm
unication
Co
mp
lacencyL
ack o
f
Kno
wled
geD
istraction
Lack
of
Team
wo
rkF
atigueL
ack o
f
Reso
urcesP
ressureL
ack o
f
Assertiveness
Stress
Lack
of
Aw
arenessN
orm
sO
ther
(Highlighted
)T
otal
420
00
20
00
80
00
00
00
100
Lack
of
Co
mm
unication
Co
mp
lacencyL
ack o
f
Kno
wled
geD
istraction
Lack
of
Team
wo
rkF
atigueL
ack o
f
Reso
urcesP
ressureL
ack o
f
Assertiveness
Stress
Lack
of
Aw
arenessN
orm
sO
ther
(Highlighted
)T
otal
430
00
10
010
50
30
00
00
0100
Lack
of
Co
mm
unication
Co
mp
lacencyL
ack o
f
Kno
wled
geD
istraction
Lack
of
Team
wo
rkF
atigueL
ack o
f
Reso
urcesP
ressureL
ack o
f
Assertiveness
Stress
Lack
of
Aw
arenessN
orm
sO
ther
(Highlighted
)T
otal
44
20
30
00
00
50
00
00
00
100
Lack
of
Co
mm
unication
Co
mp
lacencyL
ack o
f
Kno
wled
geD
istraction
Lack
of
Team
wo
rkF
atigueL
ack o
f
Reso
urcesP
ressureL
ack o
f
Assertiveness
Stress
Lack
of
Aw
arenessN
orm
sO
ther
(Highlighted
)T
otal
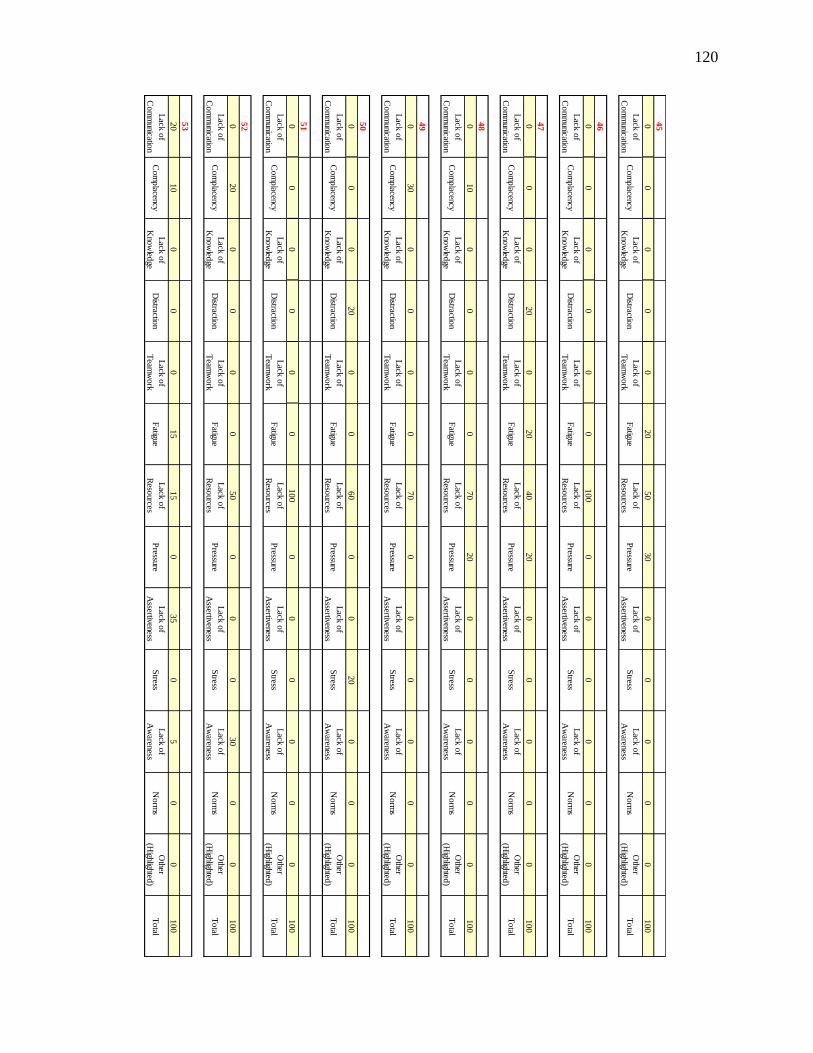
120
450
00
00
20
50
30
00
00
0100
Lack
of
Com
municatio
nC
om
placency
Lack
of
Kno
wled
geD
istraction
Lack
of
Team
work
Fatigue
Lack
of
Reso
urcesP
ressureL
ack o
f
Assertiveness
Stress
Lack
of
Aw
arenessN
orm
sO
ther
(Highlighted
)T
otal
460
00
00
0100
00
00
00
100
Lack
of
Com
municatio
nC
om
placency
Lack
of
Kno
wled
geD
istraction
Lack
of
Team
work
Fatigue
Lack
of
Reso
urcesP
ressureL
ack o
f
Assertiveness
Stress
Lack
of
Aw
arenessN
orm
sO
ther
(Highlighted
)T
otal
470
00
20
020
40
20
00
00
0100
Lack
of
Com
municatio
nC
om
placency
Lack
of
Kno
wled
geD
istraction
Lack
of
Team
work
Fatigue
Lack
of
Reso
urcesP
ressureL
ack o
f
Assertiveness
Stress
Lack
of
Aw
arenessN
orm
sO
ther
(Highlighted
)T
otal
480
10
00
00
70
20
00
00
0100
Lack
of
Com
municatio
nC
om
placency
Lack
of
Kno
wled
geD
istraction
Lack
of
Team
work
Fatigue
Lack
of
Reso
urcesP
ressureL
ack o
f
Assertiveness
Stress
Lack
of
Aw
arenessN
orm
sO
ther
(Highlighted
)T
otal
490
30
00
00
70
00
00
00
100
Lack
of
Com
municatio
nC
om
placency
Lack
of
Kno
wled
geD
istraction
Lack
of
Team
work
Fatigue
Lack
of
Reso
urcesP
ressureL
ack o
f
Assertiveness
Stress
Lack
of
Aw
arenessN
orm
sO
ther
(Highlighted
)T
otal
500
00
20
00
60
00
20
00
0100
Lack
of
Com
municatio
nC
om
placency
Lack
of
Kno
wled
geD
istraction
Lack
of
Team
work
Fatigue
Lack
of
Reso
urcesP
ressureL
ack o
f
Assertiveness
Stress
Lack
of
Aw
arenessN
orm
sO
ther
(Highlighted
)T
otal
510
00
00
0100
00
00
00
100
Lack
of
Com
municatio
nC
om
placency
Lack
of
Kno
wled
geD
istraction
Lack
of
Team
work
Fatigue
Lack
of
Reso
urcesP
ressureL
ack o
f
Assertiveness
Stress
Lack
of
Aw
arenessN
orm
sO
ther
(Highlighted
)T
otal
520
20
00
00
50
00
030
00
100
Lack
of
Com
municatio
nC
om
placency
Lack
of
Kno
wled
geD
istraction
Lack
of
Team
work
Fatigue
Lack
of
Reso
urcesP
ressureL
ack o
f
Assertiveness
Stress
Lack
of
Aw
arenessN
orm
sO
ther
(Highlighted
)T
otal
53
20
10
00
015
15
035
05
00
100
Lack
of
Com
municatio
nC
om
placency
Lack
of
Kno
wled
geD
istraction
Lack
of
Team
work
Fatigue
Lack
of
Reso
urcesP
ressureL
ack o
f
Assertiveness
Stress
Lack
of
Aw
arenessN
orm
sO
ther
(Highlighted
)T
otal
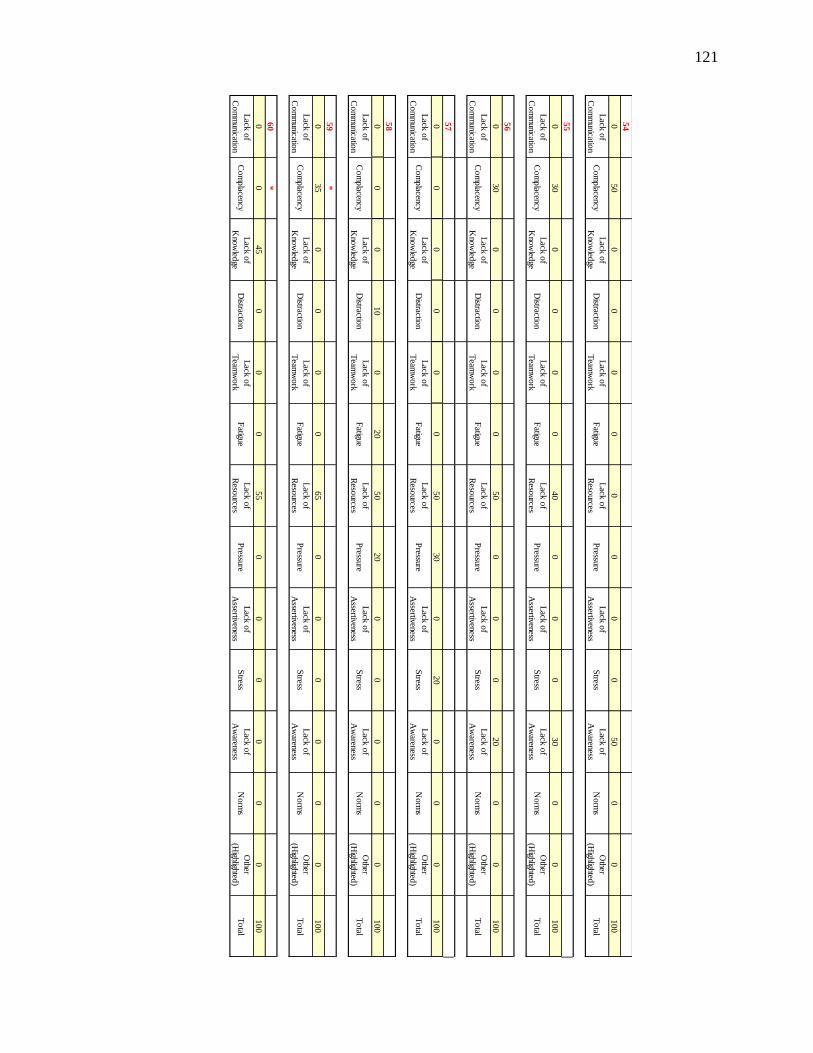
121
540
50
00
00
00
00
50
00
100
Lack
of
Co
mm
unication
Co
mp
lacencyL
ack o
f
Kno
wled
geD
istraction
Lack
of
Team
wo
rkF
atigueL
ack o
f
Reso
urcesP
ressureL
ack o
f
Assertiveness
Stress
Lack
of
Aw
arenessN
orm
sO
ther
(Highlighted
)T
otal
550
30
00
00
40
00
030
00
100
Lack
of
Co
mm
unication
Co
mp
lacencyL
ack o
f
Kno
wled
geD
istraction
Lack
of
Team
wo
rkF
atigueL
ack o
f
Reso
urcesP
ressureL
ack o
f
Assertiveness
Stress
Lack
of
Aw
arenessN
orm
sO
ther
(Highlighted
)T
otal
560
30
00
00
50
00
020
00
100
Lack
of
Co
mm
unication
Co
mp
lacencyL
ack o
f
Kno
wled
geD
istraction
Lack
of
Team
wo
rkF
atigueL
ack o
f
Reso
urcesP
ressureL
ack o
f
Assertiveness
Stress
Lack
of
Aw
arenessN
orm
sO
ther
(Highlighted
)T
otal
570
00
00
050
30
020
00
0100
Lack
of
Co
mm
unication
Co
mp
lacencyL
ack o
f
Kno
wled
geD
istraction
Lack
of
Team
wo
rkF
atigueL
ack o
f
Reso
urcesP
ressureL
ack o
f
Assertiveness
Stress
Lack
of
Aw
arenessN
orm
sO
ther
(Highlighted
)T
otal
580
00
10
020
50
20
00
00
0100
Lack
of
Co
mm
unication
Co
mp
lacencyL
ack o
f
Kno
wled
geD
istraction
Lack
of
Team
wo
rkF
atigueL
ack o
f
Reso
urcesP
ressureL
ack o
f
Assertiveness
Stress
Lack
of
Aw
arenessN
orm
sO
ther
(Highlighted
)T
otal
59
*
035
00
00
65
00
00
00
100
Lack
of
Co
mm
unication
Co
mp
lacencyL
ack o
f
Kno
wled
geD
istraction
Lack
of
Team
wo
rkF
atigueL
ack o
f
Reso
urcesP
ressureL
ack o
f
Assertiveness
Stress
Lack
of
Aw
arenessN
orm
sO
ther
(Highlighted
)T
otal
60
*
00
45
00
055
00
00
00
100
Lack
of
Co
mm
unication
Co
mp
lacencyL
ack o
f
Kno
wled
geD
istraction
Lack
of
Team
wo
rkF
atigueL
ack o
f
Reso
urcesP
ressureL
ack o
f
Assertiveness
Stress
Lack
of
Aw
arenessN
orm
sO
ther
(Highlighted
)T
otal
122
APPENDIX E
PA Maintenance Operations Safety Assessment (MOSA)
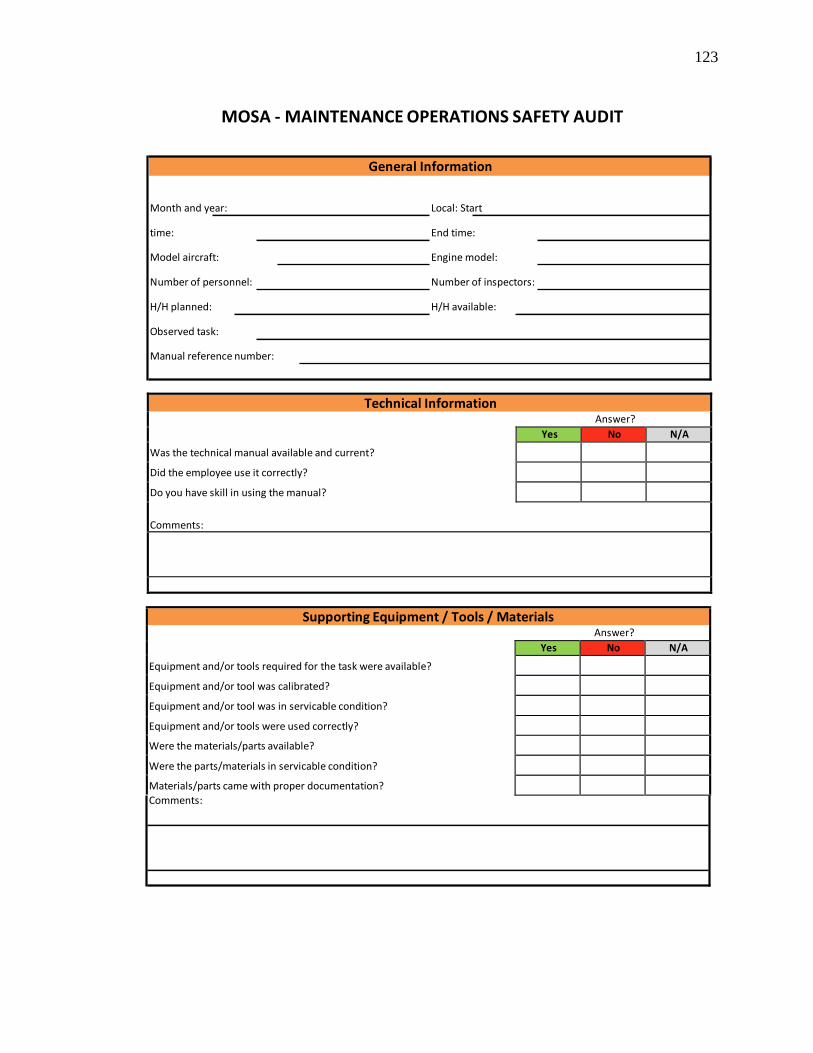
123
MOSA - MAINTENANCE OPERATIONS SAFETY AUDIT
General Information
Month and year: Local: Start
time: End time:
Model aircraft: Engine model:
Number of personnel: Number of inspectors:
H/H planned: H/H available:
Observed task:
Manual reference number:
Technical Information Answer?
Was the technical manual available and current?
Did the employee use it correctly?
Do you have skill in using the manual?
Yes No N/A
Comments:
Supporting Equipment / Tools / Materials Answer?
Equipment and/or tools required for the task were available?
Equipment and/or tool was calibrated?
Equipment and/or tool was in servicable condition?
Equipment and/or tools were used correctly?
Were the materials/parts available?
Were the parts/materials in servicable condition?
Materials/parts came with proper documentation?
Yes No N/A
Comments:
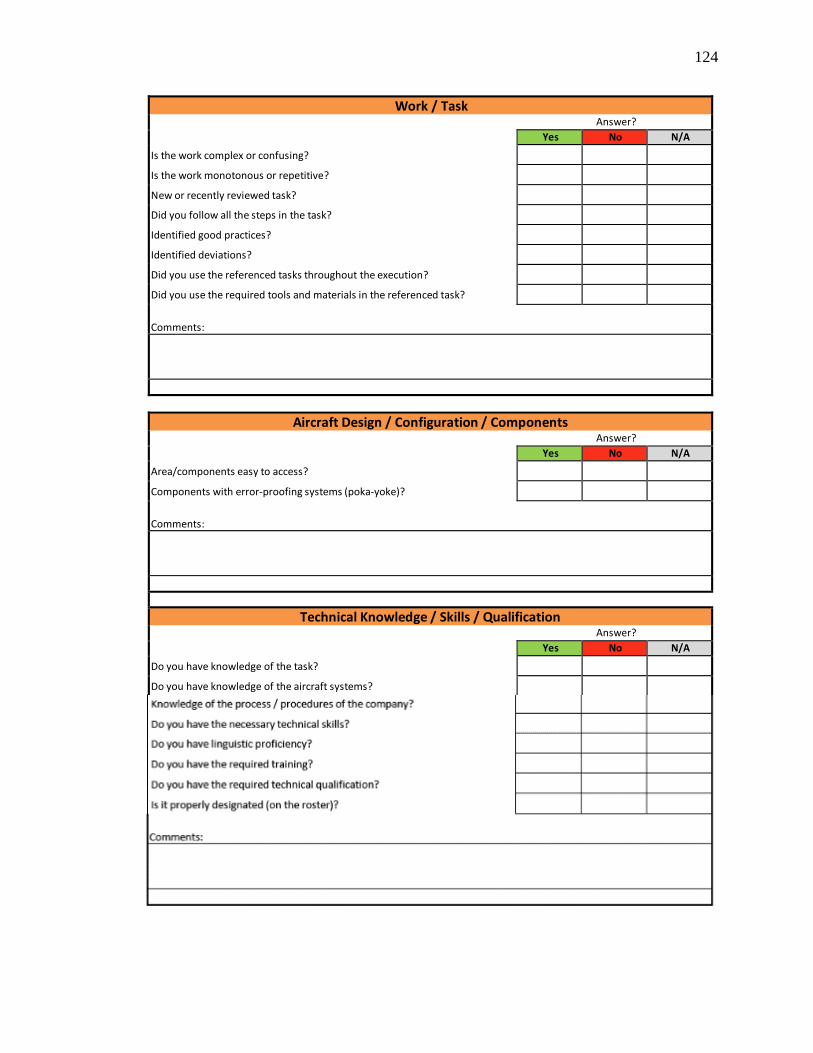
124
Aircraft Design / Configuration / Components Answer?
Area/components easy to access?
Components with error-proofing systems (poka-yoke)?
Yes No N/A
Comments:
Technical Knowledge / Skills / Qualification Answer?
Do you have knowledge of the task?
Do you have knowledge of the aircraft systems?
Yes No N/A
Work / Task Answer?
Is the work complex or confusing?
Is the work monotonous or repetitive?
New or recently reviewed task?
Did you follow all the steps in the task?
Identified good practices?
Identified deviations?
Did you use the referenced tasks throughout the execution?
Did you use the required tools and materials in the referenced task?
Yes No N/A
Comments:
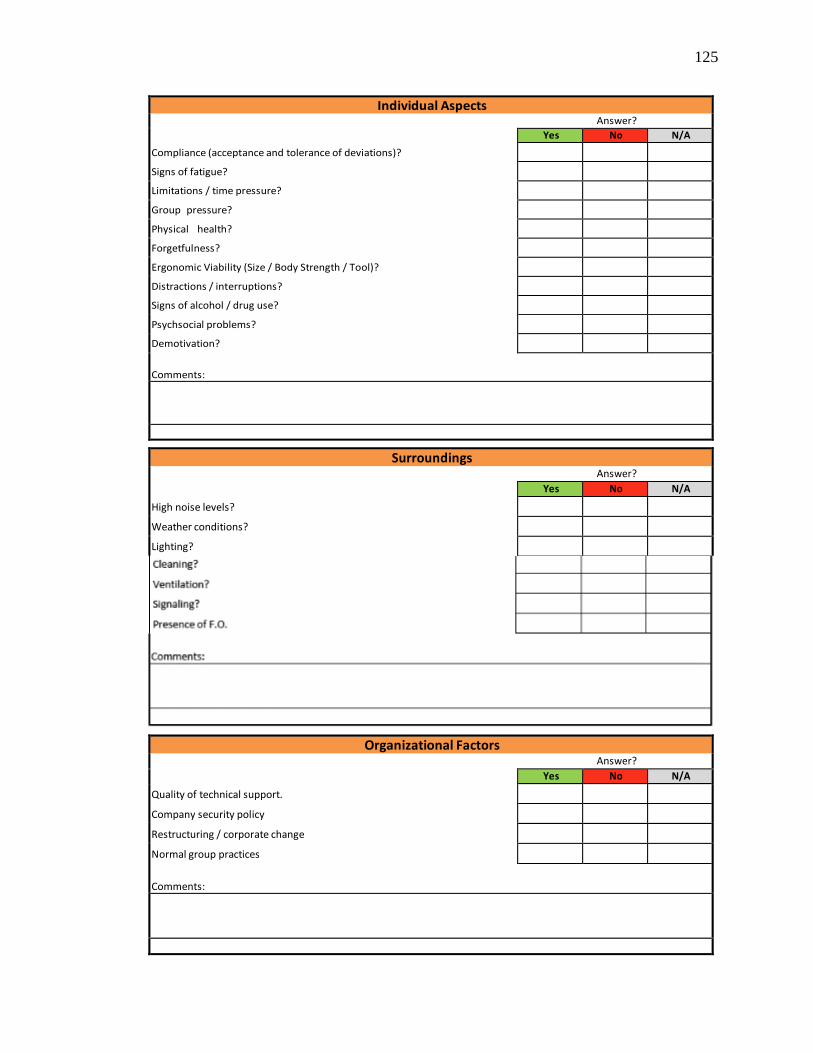
125
Individual Aspects Answer?
Compliance (acceptance and tolerance of deviations)?
Signs of fatigue?
Limitations / time pressure?
Group pressure?
Physical health?
Forgetfulness?
Ergonomic Viability (Size / Body Strength / Tool)?
Distractions / interruptions?
Signs of alcohol / drug use?
Psychsocial problems?
Demotivation?
Yes No N/A
Comments:
Surroundings
Answer?
High noise levels?
Weather conditions?
Lighting?
Yes No N/A
Organizational Factors Answer?
Quality of technical support.
Company security policy
Restructuring / corporate change
Normal group practices
Yes No N/A
Comments:
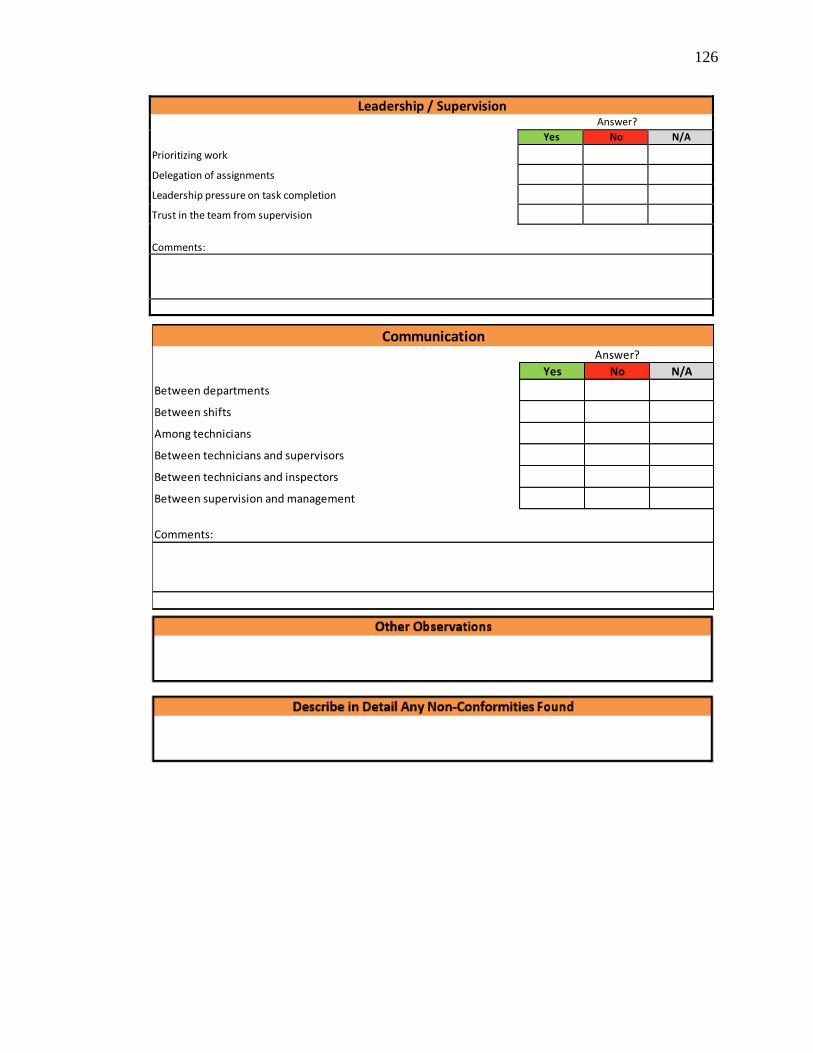
126
Leadership / Supervision Answer?
Prioritizing work
Delegation of assignments
Leadership pressure on task completion
Trust in the team from supervision
Yes No N/A
Comments:
Between departments
Between shifts
Among technicians
Between technicians and supervisors
Between technicians and inspectors
Between supervision and management
Comments:
CommunicationAnswer?
Yes No N/A
127
APPENDIX F
MCAS Questions Used in Analysis
Note: Underscored question numbers indicate data that were transposed for agreement.
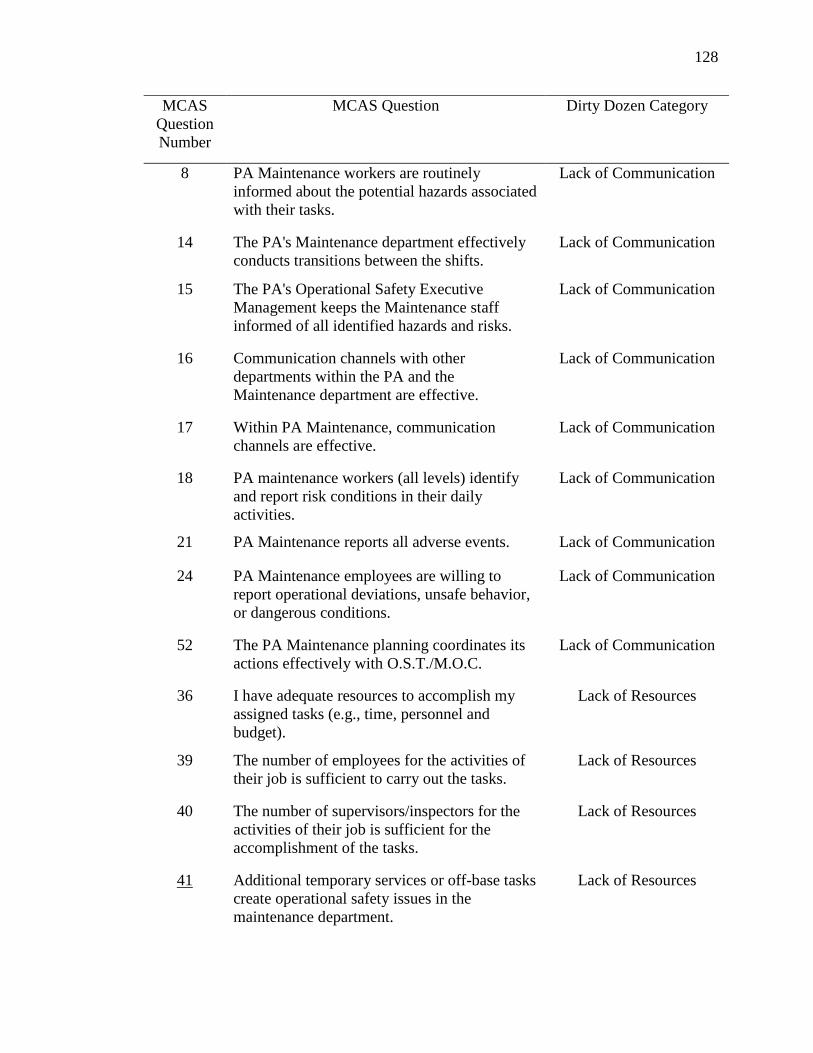
128
MCAS
Question
Number
MCAS Question Dirty Dozen Category
8 PA Maintenance workers are routinely
informed about the potential hazards associated
with their tasks.
Lack of Communication
14 The PA's Maintenance department effectively
conducts transitions between the shifts.
Lack of Communication
15 The PA's Operational Safety Executive
Management keeps the Maintenance staff
informed of all identified hazards and risks.
Lack of Communication
16 Communication channels with other
departments within the PA and the
Maintenance department are effective.
Lack of Communication
17 Within PA Maintenance, communication
channels are effective.
Lack of Communication
18 PA maintenance workers (all levels) identify
and report risk conditions in their daily
activities.
Lack of Communication
21 PA Maintenance reports all adverse events. Lack of Communication
24 PA Maintenance employees are willing to
report operational deviations, unsafe behavior,
or dangerous conditions.
Lack of Communication
52 The PA Maintenance planning coordinates its
actions effectively with O.S.T./M.O.C.
Lack of Communication
36 I have adequate resources to accomplish my
assigned tasks (e.g., time, personnel and
budget).
Lack of Resources
39 The number of employees for the activities of
their job is sufficient to carry out the tasks.
Lack of Resources
40 The number of supervisors/inspectors for the
activities of their job is sufficient for the
accomplishment of the tasks.
Lack of Resources
41 Additional temporary services or off-base tasks
create operational safety issues in the
maintenance department.
Lack of Resources
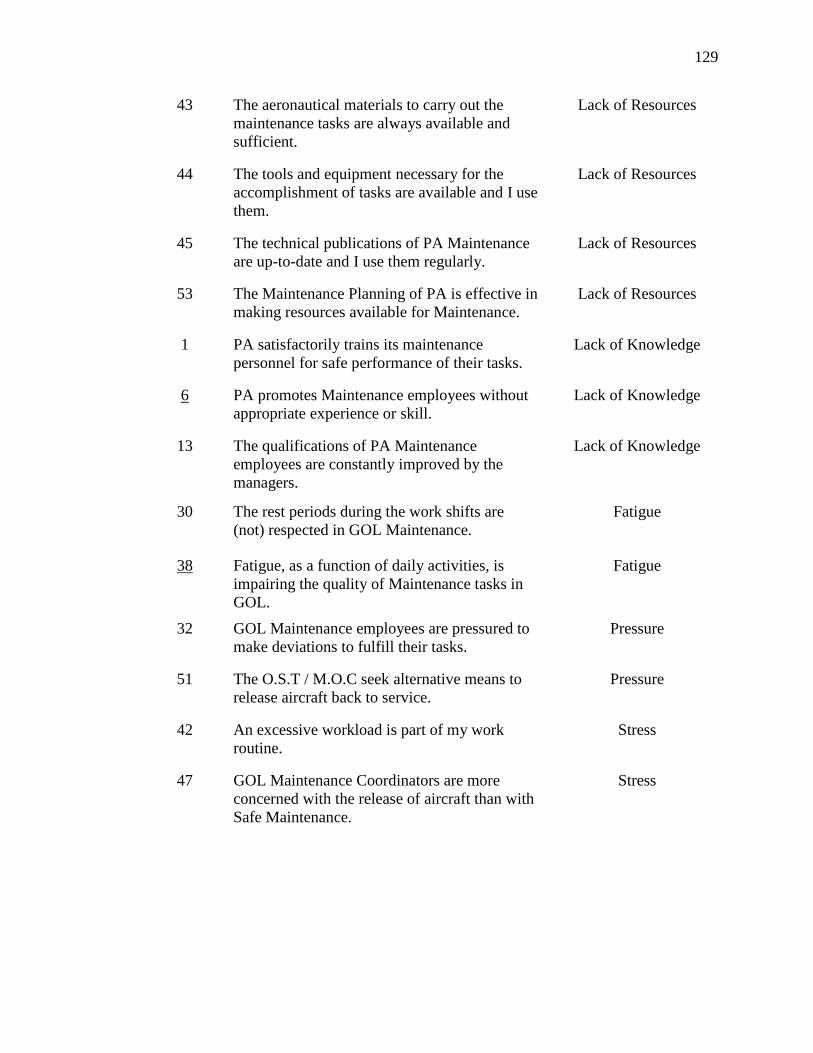
129
43 The aeronautical materials to carry out the
maintenance tasks are always available and
sufficient.
Lack of Resources
44 The tools and equipment necessary for the
accomplishment of tasks are available and I use
them.
Lack of Resources
45 The technical publications of PA Maintenance
are up-to-date and I use them regularly.
Lack of Resources
53 The Maintenance Planning of PA is effective in
making resources available for Maintenance.
Lack of Resources
1 PA satisfactorily trains its maintenance
personnel for safe performance of their tasks.
Lack of Knowledge
6 PA promotes Maintenance employees without
appropriate experience or skill.
Lack of Knowledge
13 The qualifications of PA Maintenance
employees are constantly improved by the
managers.
Lack of Knowledge
30 The rest periods during the work shifts are
(not) respected in GOL Maintenance.
Fatigue
38 Fatigue, as a function of daily activities, is
impairing the quality of Maintenance tasks in
GOL.
Fatigue
32 GOL Maintenance employees are pressured to
make deviations to fulfill their tasks.
Pressure
51 The O.S.T / M.O.C seek alternative means to
release aircraft back to service.
Pressure
42 An excessive workload is part of my work
routine.
Stress
47 GOL Maintenance Coordinators are more
concerned with the release of aircraft than with
Safe Maintenance.
Stress

130
APPENDIX G
Histograms for MCAS Questions
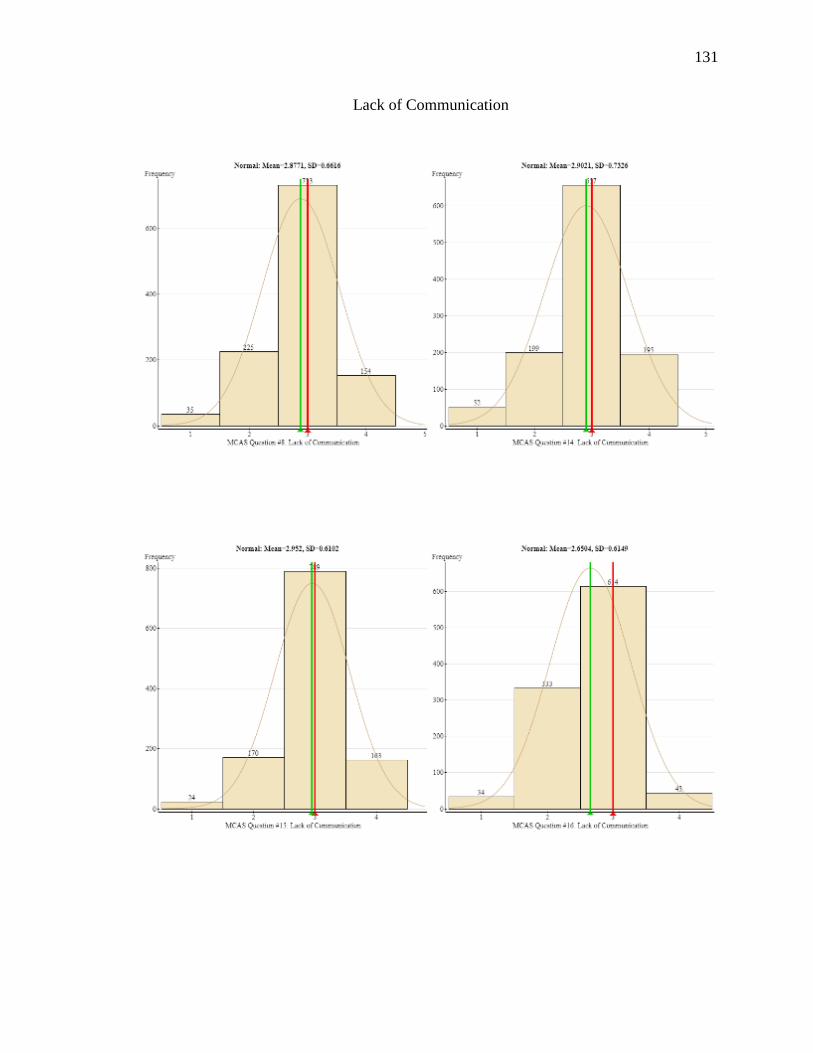
131
Lack of Communication
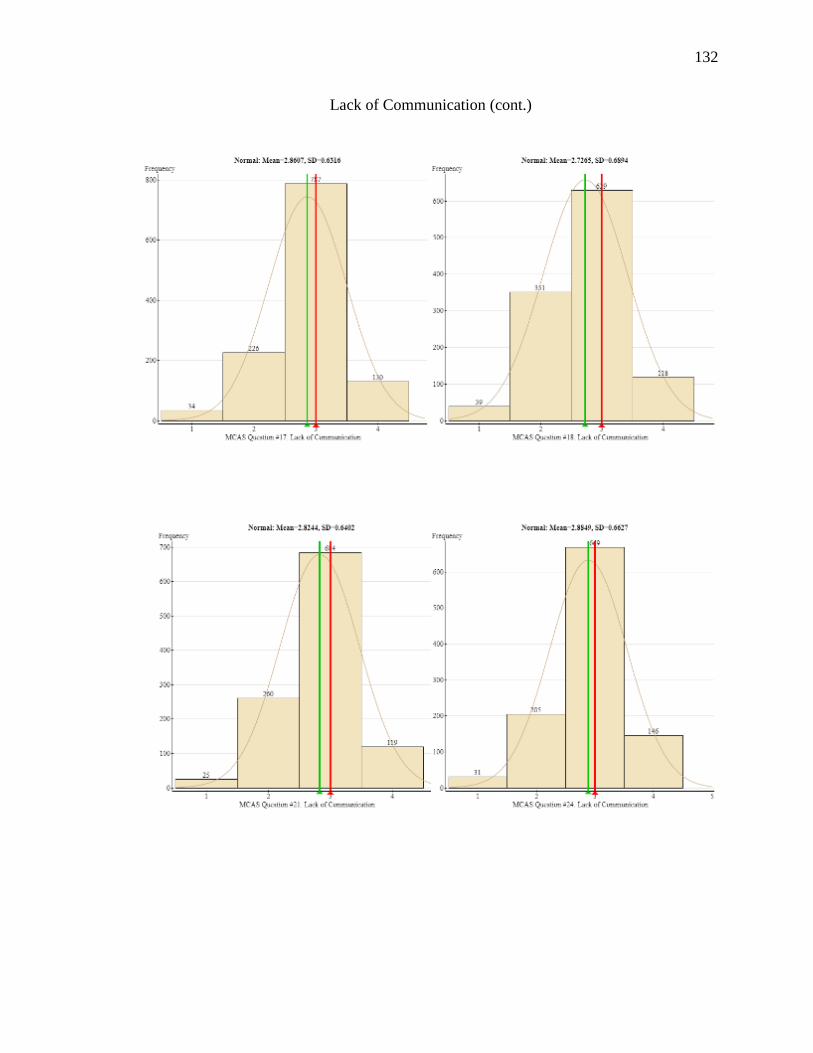
132
Lack of Communication (cont.)
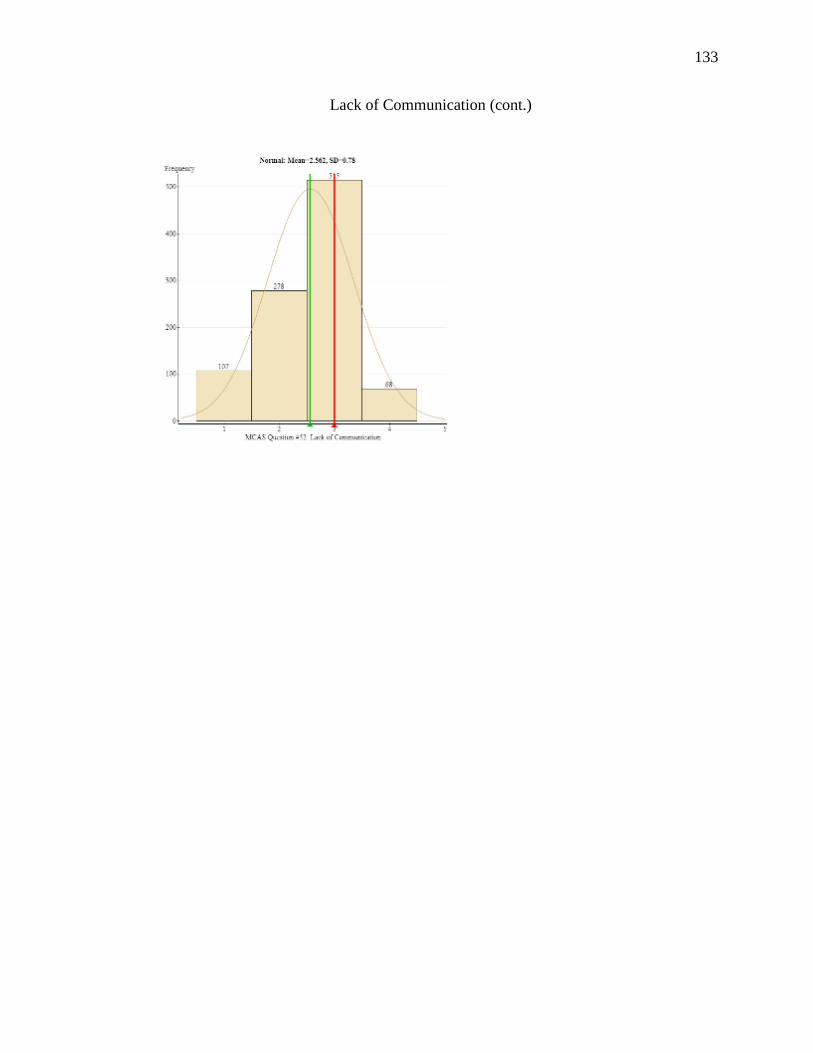
133
Lack of Communication (cont.)
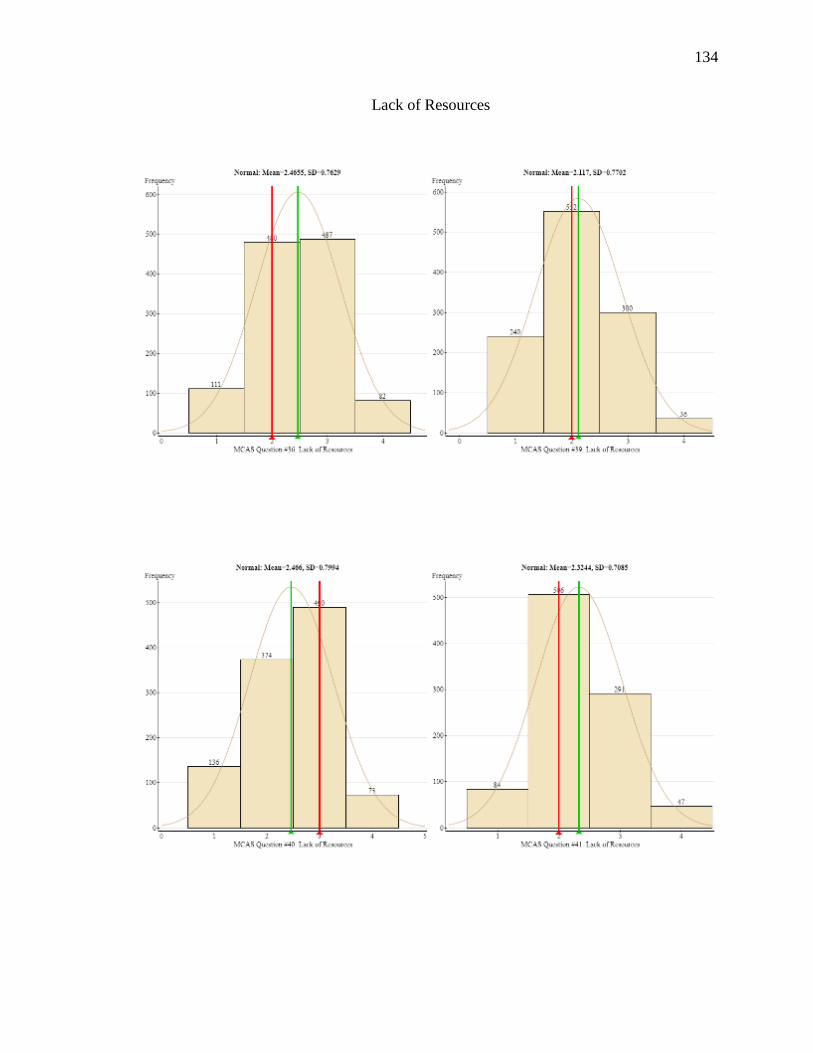
134
Lack of Resources
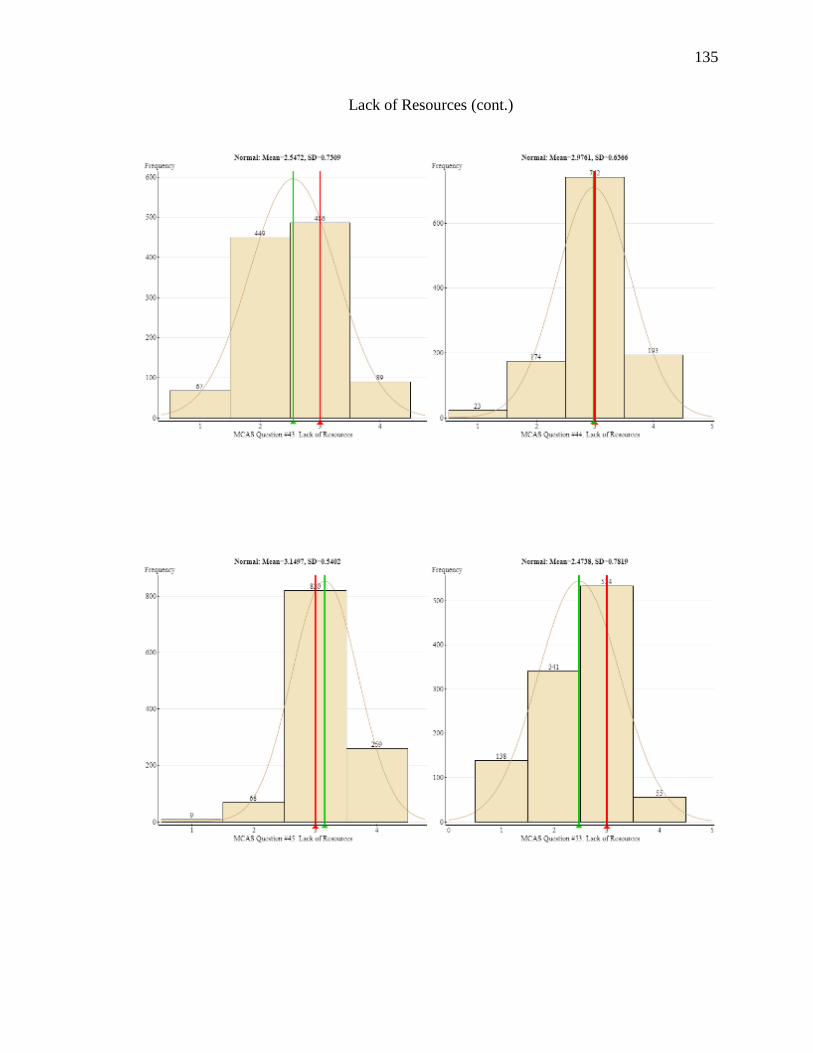
135
Lack of Resources (cont.)
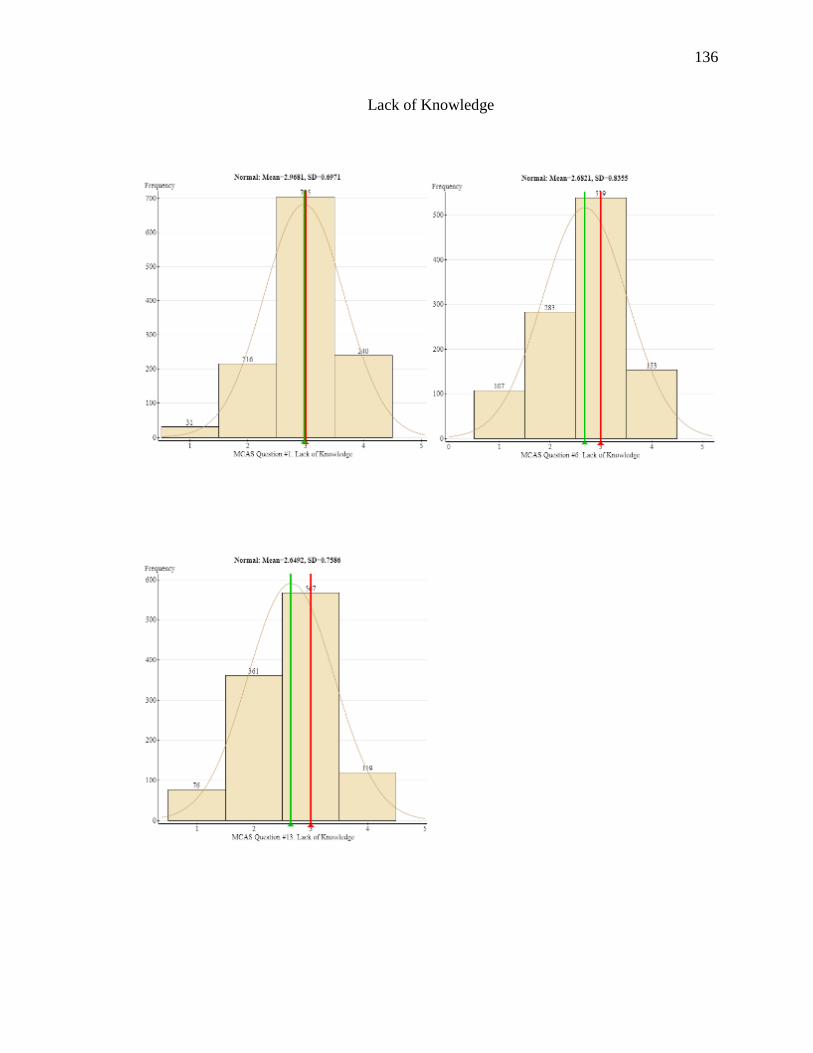
136
Lack of Knowledge
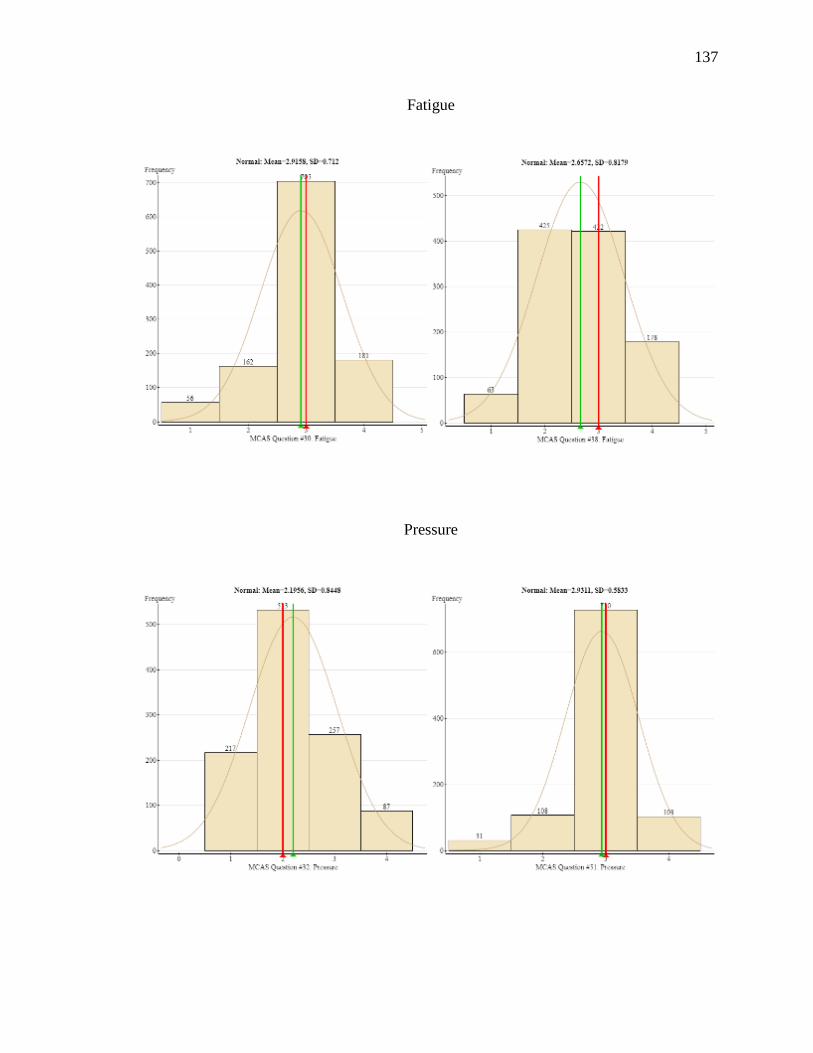
137
Fatigue
Pressure
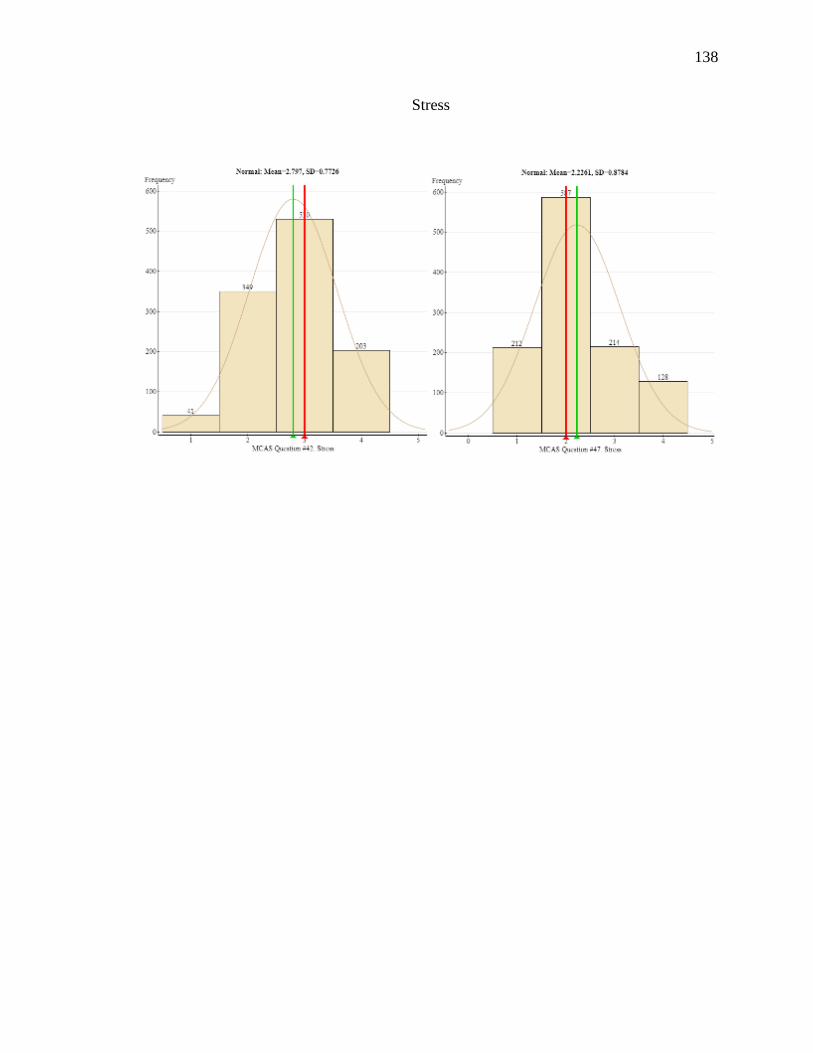
138
Stress

![THE DIRTY DOZEN - d68ej2dhhub09.cloudfront.net2).pdf · THE DIRTY DOZEN How Australia’s 12 ... [3] CAIT Climate Data ... what fossil fuel companies like those behind the Dirty Dozen](https://img.pdfslide.us/doc/110x75/5a79834d7f8b9a770a8c9787/the-dirty-dozen-2pdfthe-dirty-dozen-how-australias-12-3-cait-climate.jpg)