Embed Size (px)
Citation preview
Application of Delphi method in site selection of desalination plants
M. Sepehr1, S.M.R. Fatemi1,*, A. Danehkar2, A. Mashinchian Moradi1
1Department of Marine Biology, Science and Research Branch, Islamic Azad University, Tehran, Iran 2Department of Environmental Sciences, Faculty of Natural Resources, University of Tehran,
Tehran, Iran
ABSTRACT: Given the reduced freshwater supplies across the world, seawater desalination is one of the appropriate methods available for producing freshwater. Selecting an optimal location is crucial in the installation of these plants owing to the environmental problems they cause. The present study was conducted to identify optimal locations for installing desalination Plants in the coastal areas of southern Iran (Hormozgan Province) with application of Delphi method. To implement this technique and identify, screen and prioritize effective criteria and sub-criteria, ten experts were surveyed through questionnaires and eight criteria and 18 sub-criteria were identified. All these sub-criteria were evaluated and classified in ArcGIS into five classes as input layers. The maps were then integrated based on the modulation importance coefficient and the identified priorities using a linear Delphi model and the final map was reclassified into five categories. Environmentally sensitive areas and seawater quality were respectively the criterion and sub-criterion that received the highest importance. After combining the layers and obtaining the final map, 63 locations were identified for installing desalination plants in the coastal areas on the Persian Gulf and Oman Sea in Hormozgan Province. At the end, 27 locations were high important and had optimal environmental conditions for establishing desalination plants. Of the 27 locations, six were located in the coastal area of the Oman Sea, one in the coastal area of the Strait of Hormuz and 20 others in the coastal area of the Persian Gulf.
KEYWORDS: Delphi method; Desalination; Oman Sea; Persian Gulf ; Site selection
Global J. Environ. Sci. Manage., 3(1): 89-102, Winter 2017DOI: 10.22034/gjesm.2017.03.01.009
CASE STUDY
Received 18 August 2016; revised 20 September 2016; accepted 17 October 2016; available online 1 December 2016
*Corresponding Author Email: [email protected] Tel.: +9821 88630939 Fax: +9821 88630939Note: Discussion period for this manuscript open until March 1, 2017 on GJESM website at the “Show Article”.
INTRODUCTIONGlobal water shortage is a major challenge with
which different countries struggle (Ong et al., 2016). Continuing population growth and economic growth are continually putting pressure on world demand for water (Goh et al., 2016). Installing desalination plants to desalinate seawater is an appropriate solution to the shortage of freshwater. Desalination involves several processes to remove the excess salt and other chemicals dissolved in saltwater (Alshahri, 2016). Although desalination plants have numerous socioeconomic and environmental benefits, they
produce high-temperature brine, which may reduce the quality of coastal waters and endanger the marine environment (Lattemann and Höpner, 2008; Karbassi and Pazoki, 2015). The brine generated causes increases temperature and salinity and causes oxygen depletion (Cooley et al., 2013) and habitat degradation as well as decline in the population of phytoplankton and invertebrates and fish communities (Roberts et al., 2010) in marine ecosystems (Mezher et al., 2011). Properly site selection for desalination plants is crucial in planning the establishment of these facilities (Sanver and May, 2010), and numerous factors including environmental, economic and management criteria should be considered in order to minimize the ecological and environmental risks associated with
90
M. Sepehr et al.
the site selection. Different site selection methods are used across the world, including TOPSIS method (Yal and Akgün, 2014), analytical hierarchy process (AHP) (Chaudhary et al., 2016), fuzzy (Alavipoor et al., 2016; Kharat et al., 2016) and fuzzy-AHP (Wang et al., 2014). Additionally, environment specialists use the Delphi method, which is based on the intuitive opinions of a group of experts who comment on a specific subject to reach a consensus (Lang, 1995). The Delphi method, is thus based on the literature review, experts’ opinions (Cho and Lee, 2013) and mathematical equations and is used for site selection (Andon Petrosian et al., 2013). The processes of identifying proper locations for installing desalination plants facilities are complicated and include environmental, economic and management criteria and the use of a geographical information system (GIS) (Kallali et al., 2007). GIS is amongst the different useful tools for site selection purposes (Uyan, 2013). Middle East region is well known as an area with water scarcity (Kim et al., 2015). Iran, a middle eastern country with arid and semi-arid climate (Yavari et al., 2015) and an average annual precipitation of 250 mm is therefore considered a low rainfall region of the world (Molavi Arabshahi et al., 2016). The coastal areas of southern Iran in Hormozgan Province are faced with a shortage of freshwater owing to their dry climate with an annual average precipitation of less than 170 mm (Asadpour, 2015), population growth and growth in various industries. Hormozgan Province is regarded as an important marine area of the world owing to its proximity to the Persian Gulf and Oman Sea as well as having communities of mangrove forests (Mafi-Gholami
et al., 2015a), coral reefs (Koupaei et al., 2015), sea grass (Erftemeijer and Shuail, 2012), seaweed (Mohammadi et al., 2013) and also a variety of marine mammals (Braulik et al., 2010), fish (Daliri et al., 2012) and Sea Turtle (Pilcher et al., 2014). Few studies have been conducted on the site selection for desalination plants in these areas, in western Hormozgan Province (Basereh et al., 2014)and Qeshm Island (Kor et al., 2012). A review of studies conducted across the world indicated a lack of defined frameworks for developing and prioritizing the effective factors (contains criteria and sub-criteria) to Identify suitable locations of desalination plants. The identification of important criteria and sub-criteria, prioritization of the sub-criteria and the detection of optimal locations for installing while minimizing their destructive environmental impacts appear necessary. The aim of this study was to identify optimal locations for installing desalination plants based on different criteria with application of Delphi method. The study has been carried out in Hormozgan Province during 2015- 2016.
MATERIALS AND METHODSStudy area
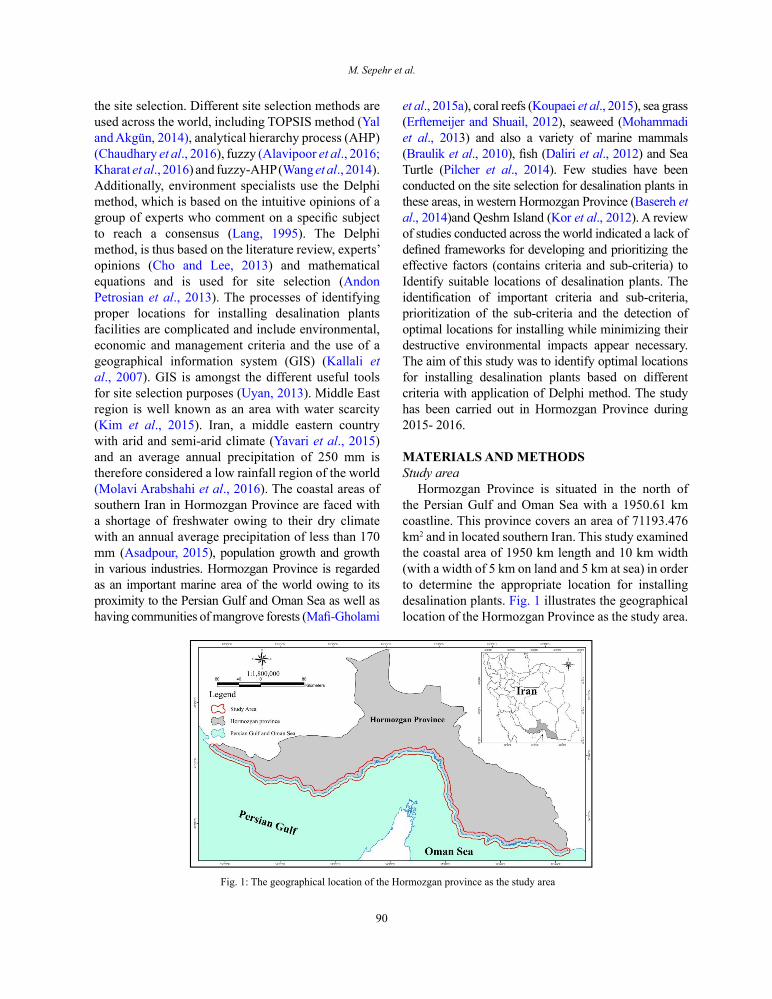
Hormozgan Province is situated in the north of the Persian Gulf and Oman Sea with a 1950.61 km coastline. This province covers an area of 71193.476 km2 and in located southern Iran. This study examined the coastal area of 1950 km length and 10 km width (with a width of 5 km on land and 5 km at sea) in order to determine the appropriate location for installing desalination plants. Fig. 1 illustrates the geographical location of the Hormozgan Province as the study area.
Fig. 1: The geographical location of the Hormozgan province as the study areaFig. 1: The geographical location of the Hormozgan province as the study area
91
Global J. Environ. Sci. Manage., 3(1): 89-102, Winter 2017
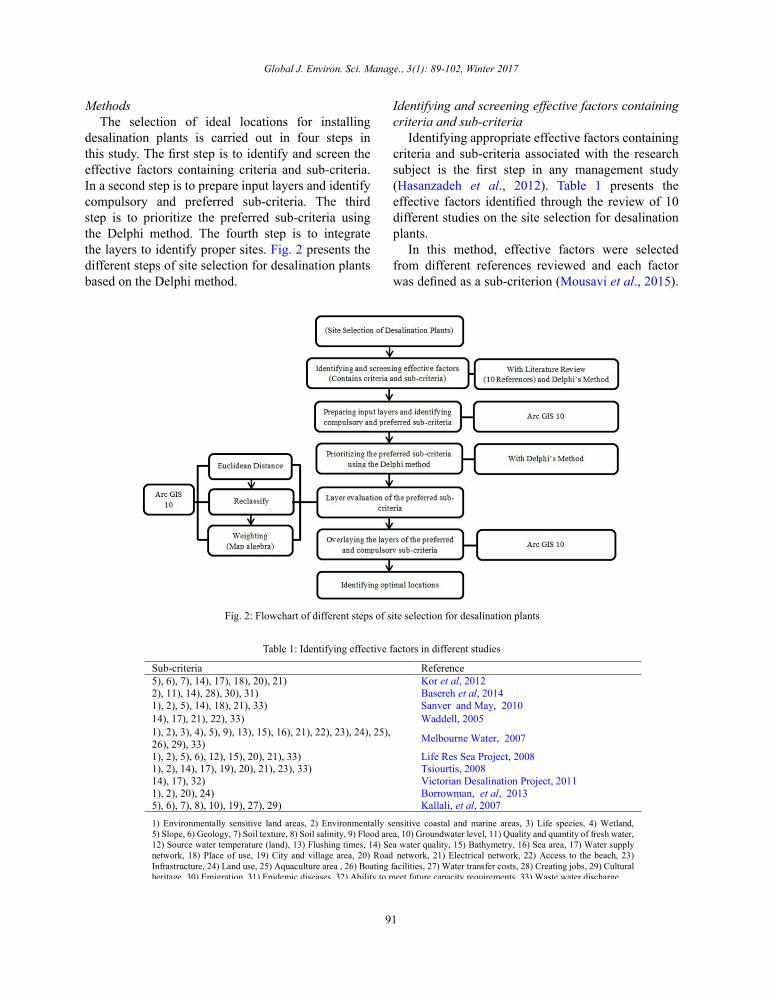
MethodsThe selection of ideal locations for installing
desalination plants is carried out in four steps in this study. The first step is to identify and screen the effective factors containing criteria and sub-criteria. In a second step is to prepare input layers and identify compulsory and preferred sub-criteria. The third step is to prioritize the preferred sub-criteria using the Delphi method. The fourth step is to integrate the layers to identify proper sites. Fig. 2 presents the different steps of site selection for desalination plants based on the Delphi method.
Identifying and screening effective factors containing criteria and sub-criteria
Identifying appropriate effective factors containing criteria and sub-criteria associated with the research subject is the first step in any management study (Hasanzadeh et al., 2012). Table 1 presents the effective factors identified through the review of 10 different studies on the site selection for desalination plants.
In this method, effective factors were selected from different references reviewed and each factor was defined as a sub-criterion (Mousavi et al., 2015).
Fig. 2: Flowchart of different steps of site selection for desalination plantsFig. 2: Flowchart of different steps of site selection for desalination plants
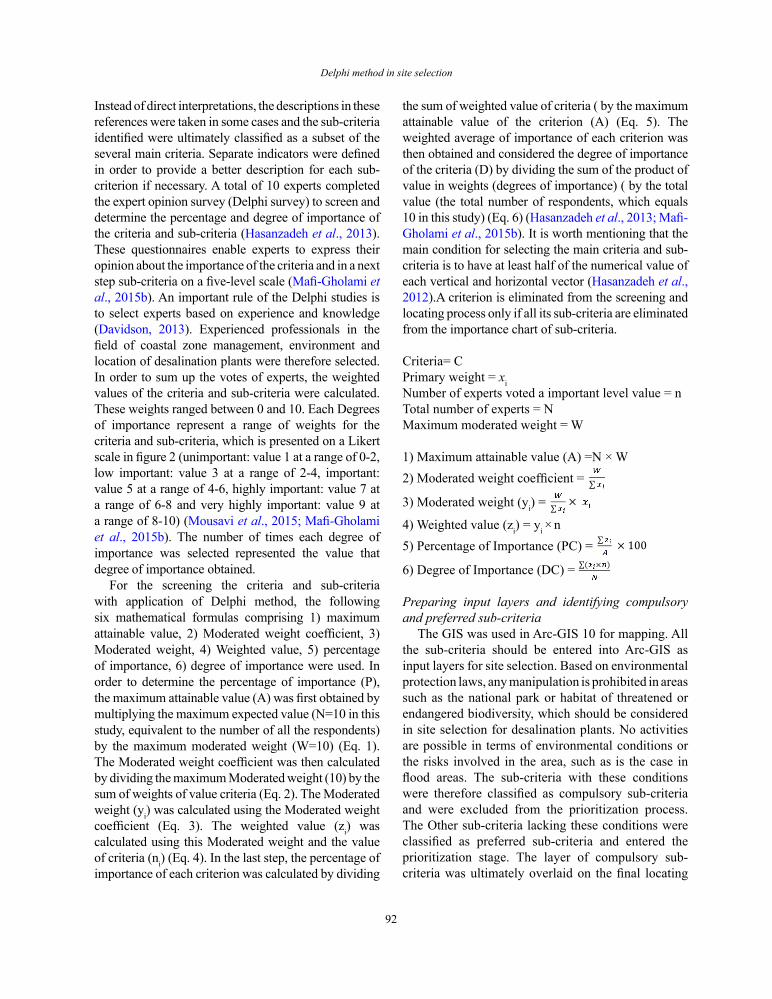
Table 1: Identifying effective factors in different studies
Sub-criteria Reference
5), 6), 7), 14), 17), 18), 20), 21) Kor et al, 2012
2), 11), 14), 28), 30), 31) Basereh et al, 2014
1), 2), 5), 14), 18), 21), 33) Sanver and May, 2010
14), 17), 21), 22), 33) Waddell, 2005
1), 2), 3), 4), 5), 9), 13), 15), 16), 21), 22), 23), 24), 25),
26), 29), 33)Melbourne Water, 2007
1), 2), 5), 6), 12), 15), 20), 21), 33) Life Res Sea Project, 20081), 2), 14), 17), 19), 20), 21), 23), 33) Tsiourtis, 2008
14), 17), 32) Victorian Desalination Project, 2011
1), 2), 20), 24) Borrowman, et al, 20135), 6), 7), 8), 10), 19), 27), 29) Kallali, et al, 2007
1) Environmentally sensitive land areas, 2) Environmentally sensitive coastal and marine areas, 3) Life species, 4) Wetland,
5) Slope, 6) Geology, 7) Soil texture, 8) Soil salinity, 9) Flood area, 10) Groundwater level, 11) Quality and quantity of fresh water,
12) Source water temperature (land), 13) Flushing times, 14) Sea water quality, 15) Bathymetry, 16) Sea area, 17) Water supply
network, 18) Place of use, 19) City and village area, 20) Road network, 21) Electrical network, 22) Access to the beach, 23)
Infrastructure, 24) Land use, 25) Aquaculture area , 26) Boating facilities, 27) Water transfer costs, 28) Creating jobs, 29) Cultural
heritage, 30) Emigration, 31) Epidemic diseases, 32) Ability to meet future capacity requirements, 33) Waste water discharge.
Table 1: Identifying effective factors in different studies
92
Delphi method in site selection
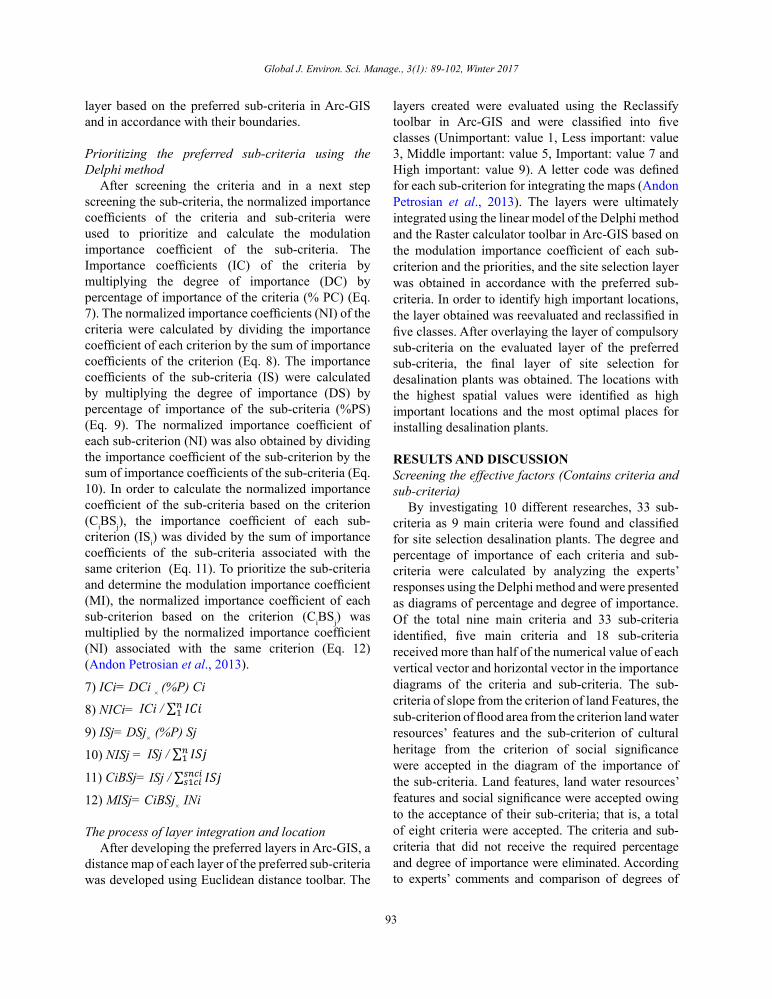
Instead of direct interpretations, the descriptions in these references were taken in some cases and the sub-criteria identified were ultimately classified as a subset of the several main criteria. Separate indicators were defined in order to provide a better description for each sub-criterion if necessary. A total of 10 experts completed the expert opinion survey (Delphi survey) to screen and determine the percentage and degree of importance of the criteria and sub-criteria (Hasanzadeh et al., 2013). These questionnaires enable experts to express their opinion about the importance of the criteria and in a next step sub-criteria on a five-level scale (Mafi-Gholami et al., 2015b). An important rule of the Delphi studies is to select experts based on experience and knowledge (Davidson, 2013). Experienced professionals in the field of coastal zone management, environment and location of desalination plants were therefore selected. In order to sum up the votes of experts, the weighted values of the criteria and sub-criteria were calculated. These weights ranged between 0 and 10. Each Degrees of importance represent a range of weights for the criteria and sub-criteria, which is presented on a Likert scale in figure 2 (unimportant: value 1 at a range of 0-2, low important: value 3 at a range of 2-4, important: value 5 at a range of 4-6, highly important: value 7 at a range of 6-8 and very highly important: value 9 at a range of 8-10) (Mousavi et al., 2015; Mafi-Gholami et al., 2015b). The number of times each degree of importance was selected represented the value that degree of importance obtained.
For the screening the criteria and sub-criteria with application of Delphi method, the following six mathematical formulas comprising 1) maximum attainable value, 2) Moderated weight coefficient, 3) Moderated weight, 4) Weighted value, 5) percentage of importance, 6) degree of importance were used. In order to determine the percentage of importance (P), the maximum attainable value (A) was first obtained by multiplying the maximum expected value (N=10 in this study, equivalent to the number of all the respondents) by the maximum moderated weight (W=10) (Eq. 1). The Moderated weight coefficient was then calculated by dividing the maximum Moderated weight (10) by the sum of weights of value criteria (Eq. 2). The Moderated weight (yi) was calculated using the Moderated weight coefficient (Eq. 3). The weighted value (zi) was calculated using this Moderated weight and the value of criteria (ni) (Eq. 4). In the last step, the percentage of importance of each criterion was calculated by dividing
the sum of weighted value of criteria ( by the maximum attainable value of the criterion (A) (Eq. 5). The weighted average of importance of each criterion was then obtained and considered the degree of importance of the criteria (D) by dividing the sum of the product of value in weights (degrees of importance) ( by the total value (the total number of respondents, which equals 10 in this study) (Eq. 6) (Hasanzadeh et al., 2013; Mafi-Gholami et al., 2015b). It is worth mentioning that the main condition for selecting the main criteria and sub-criteria is to have at least half of the numerical value of each vertical and horizontal vector (Hasanzadeh et al., 2012).A criterion is eliminated from the screening and locating process only if all its sub-criteria are eliminated from the importance chart of sub-criteria.
Criteria= C Primary weight = xiNumber of experts voted a important level value = nTotal number of experts = N Maximum moderated weight = W
1) Maximum attainable value (A) =N × W 2) Moderated weight coefficient =
1) Maximum attainable value (A) =N ×W ×
2) Moderated weight coefficient =∑
3) Moderated weight (yi) =∑
×
4) Weighted value (zi) = yi×
5) Percentage of Importance (PC) =∑
× 100
6) Degree of Importance (DC) =∑( × )
3) Moderated weight (yi) =
1) Maximum attainable value (A) =N ×W ×
2) Moderated weight coefficient =∑
3) Moderated weight (yi) =∑
×
4) Weighted value (zi) = yi×
5) Percentage of Importance (PC) =∑
× 100
6) Degree of Importance (DC) =∑( × )
4) Weighted value (zi) = yi × n5) Percentage of Importance (PC) =
1) Maximum attainable value (A) =N ×W ×
2) Moderated weight coefficient =∑
3) Moderated weight (yi) =∑
×
4) Weighted value (zi) = yi×
5) Percentage of Importance (PC) =∑
× 100
6) Degree of Importance (DC) =∑( × )
6) Degree of Importance (DC) =
1) Maximum attainable value (A) =N ×W ×
2) Moderated weight coefficient =∑
3) Moderated weight (yi) =∑
×
4) Weighted value (zi) = yi×
5) Percentage of Importance (PC) =∑
× 100
6) Degree of Importance (DC) =∑( × )
Preparing input layers and identifying compulsory and preferred sub-criteria
The GIS was used in Arc-GIS 10 for mapping. All the sub-criteria should be entered into Arc-GIS as input layers for site selection. Based on environmental protection laws, any manipulation is prohibited in areas such as the national park or habitat of threatened or endangered biodiversity, which should be considered in site selection for desalination plants. No activities are possible in terms of environmental conditions or the risks involved in the area, such as is the case in flood areas. The sub-criteria with these conditions were therefore classified as compulsory sub-criteria and were excluded from the prioritization process. The Other sub-criteria lacking these conditions were classified as preferred sub-criteria and entered the prioritization stage. The layer of compulsory sub-criteria was ultimately overlaid on the final locating
93
Global J. Environ. Sci. Manage., 3(1): 89-102, Winter 2017
layer based on the preferred sub-criteria in Arc-GIS and in accordance with their boundaries.
Prioritizing the preferred sub-criteria using the Delphi method
After screening the criteria and in a next step screening the sub-criteria, the normalized importance coefficients of the criteria and sub-criteria were used to prioritize and calculate the modulation importance coefficient of the sub-criteria. The Importance coefficients (IC) of the criteria by multiplying the degree of importance (DC) by percentage of importance of the criteria (% PC) (Eq. 7). The normalized importance coefficients (NI) of the criteria were calculated by dividing the importance coefficient of each criterion by the sum of importance coefficients of the criterion (Eq. 8). The importance coefficients of the sub-criteria (IS) were calculated by multiplying the degree of importance (DS) by percentage of importance of the sub-criteria (%PS) (Eq. 9). The normalized importance coefficient of each sub-criterion (NI) was also obtained by dividing the importance coefficient of the sub-criterion by the sum of importance coefficients of the sub-criteria (Eq. 10). In order to calculate the normalized importance coefficient of the sub-criteria based on the criterion (CiBSj), the importance coefficient of each sub-criterion (ISi) was divided by the sum of importance coefficients of the sub-criteria associated with the same criterion (Eq. 11). To prioritize the sub-criteria and determine the modulation importance coefficient (MI), the normalized importance coefficient of each sub-criterion based on the criterion (CiBSj) was multiplied by the normalized importance coefficient (NI) associated with the same criterion (Eq. 12) (Andon Petrosian et al., 2013).
7) ICi= DCi × (%P) Ci
8) NICi=
7) ICi= DCi × (%P) Ci
8) NICi= ICi / ∑ �����
9) ISj= DSj× (%P) Sj
10) NISj = ISj / ∑ �����
11) CiBSj= ISj / ∑ �����������
12) MISj= CiBSj× INi
9) ISj= DSj× (%P) Sj
10) NISj =
7) ICi= DCi × (%P) Ci
8) NICi= ICi / ∑ �����
9) ISj= DSj× (%P) Sj
10) NISj = ISj / ∑ �����
11) CiBSj= ISj / ∑ �����������
12) MISj= CiBSj× INi
11) CiBSj=
7) ICi= DCi × (%P) Ci
8) NICi= ICi / ∑ �����
9) ISj= DSj× (%P) Sj
10) NISj = ISj / ∑ �����
11) CiBSj= ISj / ∑ �����������
12) MISj= CiBSj× INi
12) MISj= CiBSj× INi
The process of layer integration and locationAfter developing the preferred layers in Arc-GIS, a
distance map of each layer of the preferred sub-criteria was developed using Euclidean distance toolbar. The
layers created were evaluated using the Reclassify toolbar in Arc-GIS and were classified into five classes (Unimportant: value 1, Less important: value 3, Middle important: value 5, Important: value 7 and High important: value 9). A letter code was defined for each sub-criterion for integrating the maps (Andon Petrosian et al., 2013). The layers were ultimately integrated using the linear model of the Delphi method and the Raster calculator toolbar in Arc-GIS based on the modulation importance coefficient of each sub-criterion and the priorities, and the site selection layer was obtained in accordance with the preferred sub-criteria. In order to identify high important locations, the layer obtained was reevaluated and reclassified in five classes. After overlaying the layer of compulsory sub-criteria on the evaluated layer of the preferred sub-criteria, the final layer of site selection for desalination plants was obtained. The locations with the highest spatial values were identified as high important locations and the most optimal places for installing desalination plants.
RESULTS AND DISCUSSIONScreening the effective factors (Contains criteria and sub-criteria)
By investigating 10 different researches, 33 sub-criteria as 9 main criteria were found and classified for site selection desalination plants. The degree and percentage of importance of each criteria and sub-criteria were calculated by analyzing the experts’ responses using the Delphi method and were presented as diagrams of percentage and degree of importance. Of the total nine main criteria and 33 sub-criteria identified, five main criteria and 18 sub-criteria received more than half of the numerical value of each vertical vector and horizontal vector in the importance diagrams of the criteria and sub-criteria. The sub-criteria of slope from the criterion of land Features, the sub-criterion of flood area from the criterion land water resources’ features and the sub-criterion of cultural heritage from the criterion of social significance were accepted in the diagram of the importance of the sub-criteria. Land features, land water resources’ features and social significance were accepted owing to the acceptance of their sub-criteria; that is, a total of eight criteria were accepted. The criteria and sub-criteria that did not receive the required percentage and degree of importance were eliminated. According to experts’ comments and comparison of degrees of
94
M. Sepehr et al.
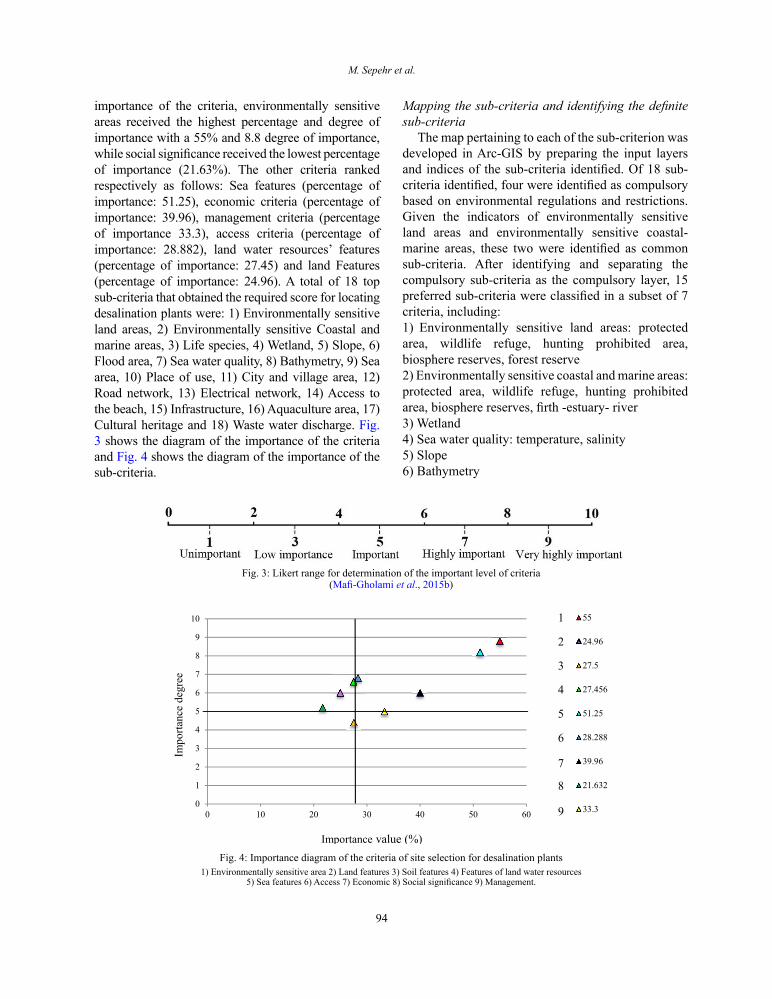
importance of the criteria, environmentally sensitive areas received the highest percentage and degree of importance with a 55% and 8.8 degree of importance, while social significance received the lowest percentage of importance (21.63%). The other criteria ranked respectively as follows: Sea features (percentage of importance: 51.25), economic criteria (percentage of importance: 39.96), management criteria (percentage of importance 33.3), access criteria (percentage of importance: 28.882), land water resources’ features (percentage of importance: 27.45) and land Features (percentage of importance: 24.96). A total of 18 top sub-criteria that obtained the required score for locating desalination plants were: 1) Environmentally sensitive land areas, 2) Environmentally sensitive Coastal and marine areas, 3) Life species, 4) Wetland, 5) Slope, 6) Flood area, 7) Sea water quality, 8) Bathymetry, 9) Sea area, 10) Place of use, 11) City and village area, 12) Road network, 13) Electrical network, 14) Access to the beach, 15) Infrastructure, 16) Aquaculture area, 17) Cultural heritage and 18) Waste water discharge. Fig. 3 shows the diagram of the importance of the criteria and Fig. 4 shows the diagram of the importance of the sub-criteria.
Mapping the sub-criteria and identifying the definite sub-criteria
The map pertaining to each of the sub-criterion was developed in Arc-GIS by preparing the input layers and indices of the sub-criteria identified. Of 18 sub-criteria identified, four were identified as compulsory based on environmental regulations and restrictions. Given the indicators of environmentally sensitive land areas and environmentally sensitive coastal-marine areas, these two were identified as common sub-criteria. After identifying and separating the compulsory sub-criteria as the compulsory layer, 15 preferred sub-criteria were classified in a subset of 7 criteria, including: 1) Environmentally sensitive land areas: protected area, wildlife refuge, hunting prohibited area, biosphere reserves, forest reserve 2) Environmentally sensitive coastal and marine areas: protected area, wildlife refuge, hunting prohibited area, biosphere reserves, firth -estuary- river 3) Wetland 4) Sea water quality: temperature, salinity 5) Slope 6) Bathymetry
Fig. 3: Likert range for determination of the important level of criteria(Mafi-Gholami et al., 2015b)
Fig. 3: Likert range for determination of the important level of criteria
(Mafi-Gholami et al., 2015b)
Fig. 4: Importance diagram of the criteria of site selection for desalination plants1) Environmentally sensitive area 2) Land features 3) Soil features 4) Features of land water resources
5) Sea features 6) Access 7) Economic 8) Social significance 9) Management.Fig. 4: Importance diagram of the criteria of site selection for desalination plants
1) Environmentally sensitive area 2) Land features 3) Soil features 4) Features of land water resources5) Sea features 6) Access 7) Economic 8) Social significance 9) Management.
0
1
2
3
4
5
6
7
8
9
10
0 10 20 30 40 50 60
55
24.96
27.5
27.456
51.25
28.288
39.96
21.632
33.3
1
2
3
4
5
6
7
8
9
Importance value (%)
Imp
ort
ance
deg
ree
95
Global J. Environ. Sci. Manage., 3(1): 89-102, Winter 2017
7) Place of use 8) City and village area 9) Road Network 10) Electrical Network 11) Access to the beach 12) Infrastructure 13) Aquaculture areas 14) Cultural Heritage15) Waste water Discharge.
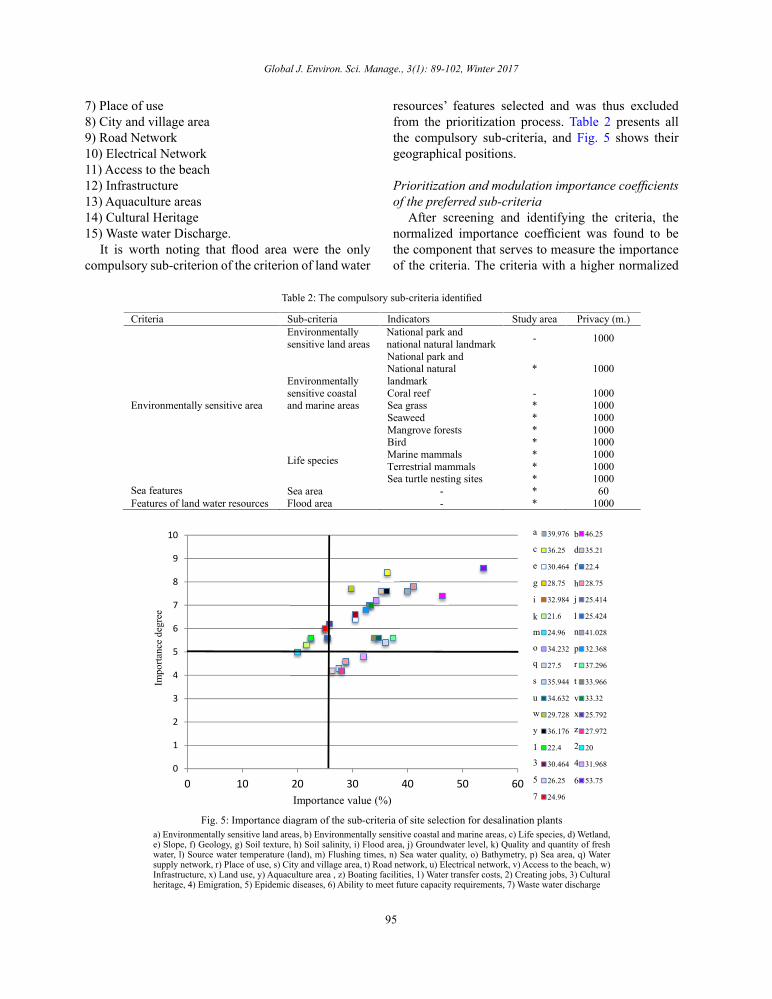
It is worth noting that flood area were the only compulsory sub-criterion of the criterion of land water
resources’ features selected and was thus excluded from the prioritization process. Table 2 presents all the compulsory sub-criteria, and Fig. 5 shows their geographical positions.
Prioritization and modulation importance coefficients of the preferred sub-criteria
After screening and identifying the criteria, the normalized importance coefficient was found to be the component that serves to measure the importance of the criteria. The criteria with a higher normalized
Table 2: The compulsory sub-criteria identified
Criteria Sub-criteria Indicators Study area Privacy (m.)
Environmentally sensitive area
Environmentally
sensitive land areas
National park and
national natural landmark- 1000
Environmentally
sensitive coastaland marine areas
National park andNational natural
landmark
* 1000
Coral reef - 1000Sea grass * 1000
Seaweed * 1000
Mangrove forests * 1000
Life species
Bird * 1000
Marine mammals * 1000
Terrestrial mammals * 1000Sea turtle nesting sites * 1000
Sea features Sea area - * 60
Features of land water resources Flood area - * 1000
Table 2: The compulsory sub-criteria identified
Fig. 5: Importance diagram of the sub-criteria of site selection for desalination plants
a) Environmentally sensitive land areas, b) Environmentally sensitive Coastal & marine areas, c) Life species, d) Wetland, e) Slope, f) Geology,
g) Soil texture, h) Soil salinity, i) Flood Area, j) Groundwater level, k) Quality and quantity of fresh water, l) Source water temperature (land), m)Flushing Times, n) Sea water quality, o) Bathymetry, p) Sea Area, q) Water supply network, r) Place of use, s) City and village area, t) Road
Network, u) Electrical Network, v) Access to the beach, w) Infrastructure, x) Land Use, y) Aquaculture area , z) Boating Facilities, 1) Water transfer
costs, 2) Creating jobs, 3) Cultural Heritage, 4) Emigration, 5) Epidemic diseases, 6) Ability to meet future capacity requirements, 7) Waste waterDischarge
0
1
2
3
4
5
6
7
8
9
10
0 10 20 30 40 50 60
39.976 46.25
36.25 35.21
30.464 22.4
28.75 28.75
32.984 25.414
21.6 25.424
24.96 41.028
34.232 32.368
27.5 37.296
35.944 33.966
34.632 33.32
29.728 25.792
36.176 27.972
22.4 20
30.464 31.968
26.25 53.75
24.96Importance value (%)
Imp
ort
ance
deg
ree
a
c
e
g
i
k
m
o
q
s
u
w
y
1
3
5
7
b
d
f
h
j
l
n
p
r
t
v
x
z
2
4
6
Fig. 5: Importance diagram of the sub-criteria of site selection for desalination plantsa) Environmentally sensitive land areas, b) Environmentally sensitive coastal and marine areas, c) Life species, d) Wetland, e) Slope, f) Geology, g) Soil texture, h) Soil salinity, i) Flood area, j) Groundwater level, k) Quality and quantity of fresh water, l) Source water temperature (land), m) Flushing times, n) Sea water quality, o) Bathymetry, p) Sea area, q) Water supply network, r) Place of use, s) City and village area, t) Road network, u) Electrical network, v) Access to the beach, w) Infrastructure, x) Land use, y) Aquaculture area , z) Boating facilities, 1) Water transfer costs, 2) Creating jobs, 3) Cultural heritage, 4) Emigration, 5) Epidemic diseases, 6) Ability to meet future capacity requirements, 7) Waste water discharge
96
Delphi method in site selection
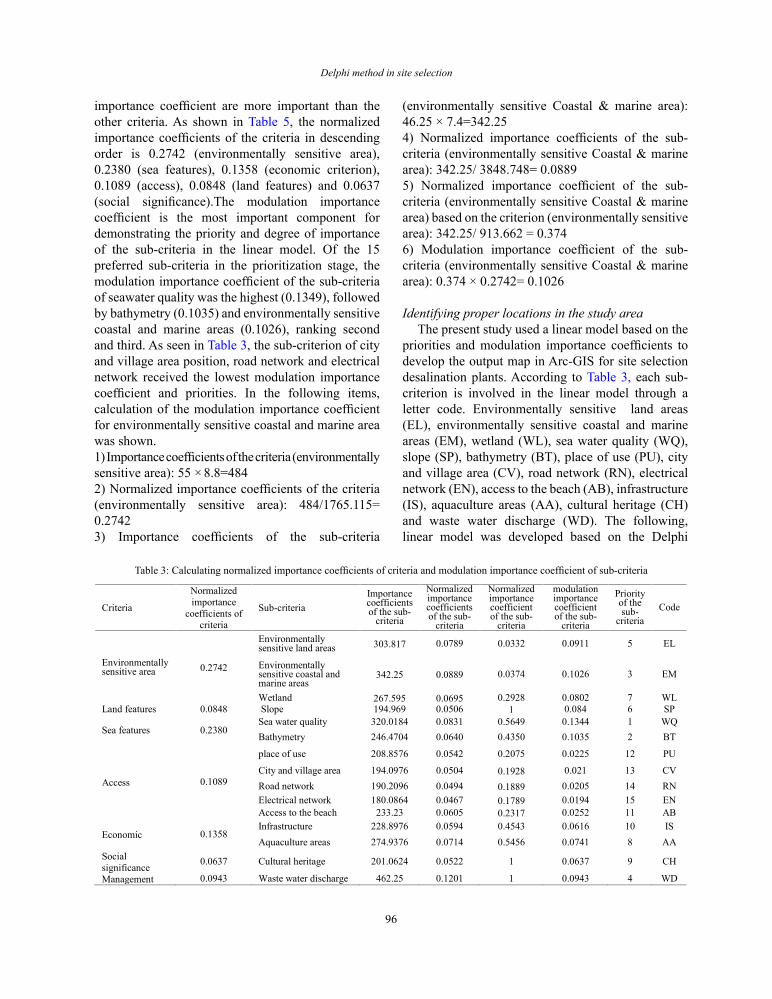
importance coefficient are more important than the other criteria. As shown in Table 5, the normalized importance coefficients of the criteria in descending order is 0.2742 (environmentally sensitive area), 0.2380 (sea features), 0.1358 (economic criterion), 0.1089 (access), 0.0848 (land features) and 0.0637 (social significance).The modulation importance coefficient is the most important component for demonstrating the priority and degree of importance of the sub-criteria in the linear model. Of the 15 preferred sub-criteria in the prioritization stage, the modulation importance coefficient of the sub-criteria of seawater quality was the highest (0.1349), followed by bathymetry (0.1035) and environmentally sensitive coastal and marine areas (0.1026), ranking second and third. As seen in Table 3, the sub-criterion of city and village area position, road network and electrical network received the lowest modulation importance coefficient and priorities. In the following items, calculation of the modulation importance coefficient for environmentally sensitive coastal and marine area was shown.1) Importance coefficients of the criteria (environmentally sensitive area): 55 × 8.8=4842) Normalized importance coefficients of the criteria (environmentally sensitive area): 484/1765.115= 0.27423) Importance coefficients of the sub-criteria
(environmentally sensitive Coastal & marine area): 46.25 × 7.4=342.254) Normalized importance coefficients of the sub-criteria (environmentally sensitive Coastal & marine area): 342.25/ 3848.748= 0.08895) Normalized importance coefficient of the sub-criteria (environmentally sensitive Coastal & marine area) based on the criterion (environmentally sensitive area): 342.25/ 913.662 = 0.374 6) Modulation importance coefficient of the sub-criteria (environmentally sensitive Coastal & marine area): 0.374 × 0.2742= 0.1026
Identifying proper locations in the study areaThe present study used a linear model based on the
priorities and modulation importance coefficients to develop the output map in Arc-GIS for site selection desalination plants. According to Table 3, each sub-criterion is involved in the linear model through a letter code. Environmentally sensitive land areas (EL), environmentally sensitive coastal and marine areas (EM), wetland (WL), sea water quality (WQ), slope (SP), bathymetry (BT), place of use (PU), city and village area (CV), road network (RN), electrical network (EN), access to the beach (AB), infrastructure (IS), aquaculture areas (AA), cultural heritage (CH) and waste water discharge (WD). The following, linear model was developed based on the Delphi
Table 3: Calculating normalized importance coefficients of criteria and modulation importance coefficient of sub-criteria
Criteria
Normalized
importance
coefficients ofcriteria
Sub-criteria
Importancecoefficientsof the sub-
criteria
Normalizedimportancecoefficientsof the sub-
criteria
Normalizedimportancecoefficientof the sub-
criteria
modulationimportancecoefficientof the sub-
criteria
Priorityof thesub-
criteria
Code
Environmentallysensitive area 0.2742
Environmentallysensitive land areas 303.817 0.0789 0.0332 0.0911 5 EL
Environmentallysensitive coastal andmarine areas
342.25 0.0889 0.0374 0.1026 3 EM
Wetland 267.595 0.0695 0.2928 0.0802 7 WL
Land features 0.0848 Slope 194.969 0.0506 1 0.084 6 SP
Sea features 0.2380Sea water quality 320.0184 0.0831 0.5649 0.1344 1 WQ
Bathymetry 246.4704 0.0640 0.4350 0.1035 2 BT
Access 0.1089
place of use 208.8576 0.0542 0.2075 0.0225 12 PU
City and village area 194.0976 0.0504 0.1928 0.021 13 CV
Road network 190.2096 0.0494 0.1889 0.0205 14 RN
Electrical network 180.0864 0.0467 0.1789 0.0194 15 EN
Access to the beach 233.23 0.0605 0.2317 0.0252 11 AB
Economic 0.1358Infrastructure 228.8976 0.0594 0.4543 0.0616 10 IS
Aquaculture areas 274.9376 0.0714 0.5456 0.0741 8 AA
Social
significance0.0637 Cultural heritage 201.0624 0.0522 1 0.0637 9 CH
Management 0.0943 Waste water discharge 462.25 0.1201 1 0.0943 4 WD
Table 3: Calculating normalized importance coefficients of criteria and modulation importance coefficient of sub-criteria
97
Global J. Environ. Sci. Manage., 3(1): 89-102, Winter 2017
method to integrate the maps for identifying proper locations for desalination plants.
Site selection for desalination plants = (WQ*0.1344) + (BT*0.1035) + (EM*0.1026) + (WD*0.0943) + (EL*0.0911) + (SP*0. 084) + (WL*0.0802) + (AA*0.0741) + (CH*0.0637) + (IS*0.0616) + (AB*0.0252) + (PU*0.0225) + (CV*0.021) + (RN*0.0205) + (EN*0.0194)
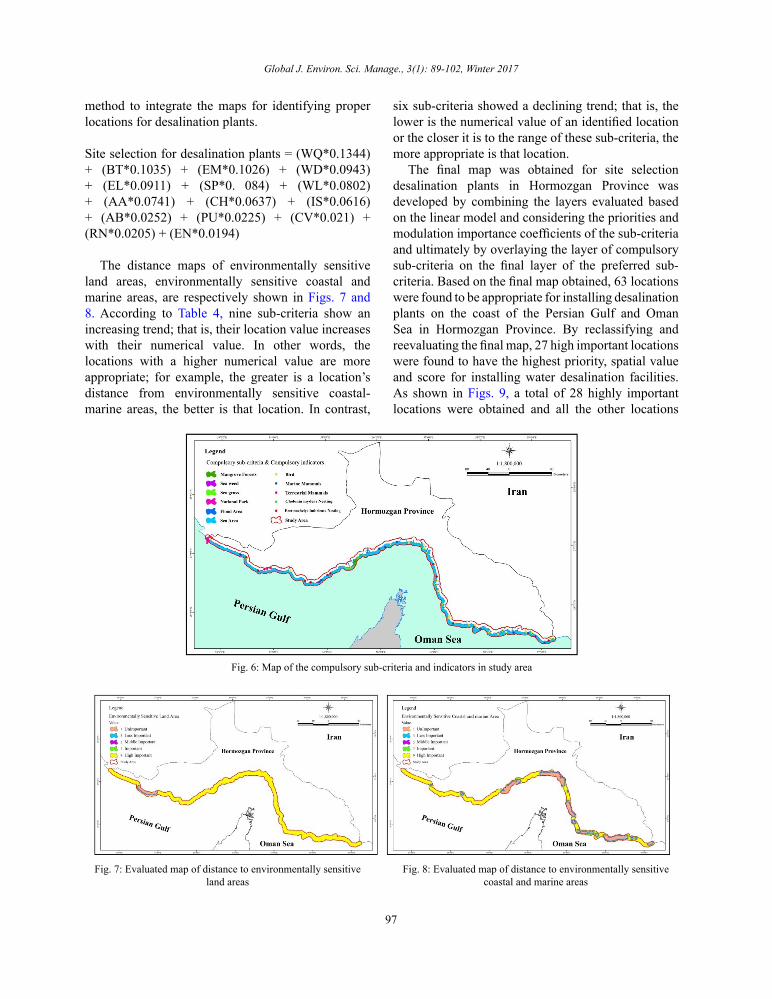
The distance maps of environmentally sensitive land areas, environmentally sensitive coastal and marine areas, are respectively shown in Figs. 7 and 8. According to Table 4, nine sub-criteria show an increasing trend; that is, their location value increases with their numerical value. In other words, the locations with a higher numerical value are more appropriate; for example, the greater is a location’s distance from environmentally sensitive coastal-marine areas, the better is that location. In contrast,
six sub-criteria showed a declining trend; that is, the lower is the numerical value of an identified location or the closer it is to the range of these sub-criteria, the more appropriate is that location.
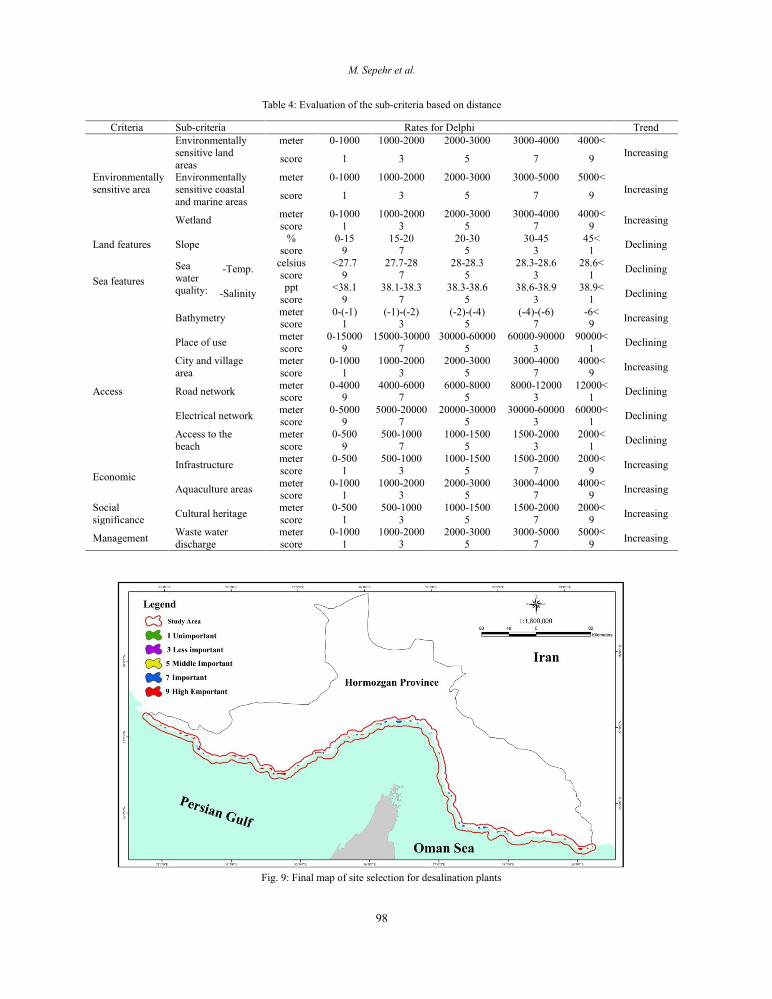
The final map was obtained for site selection desalination plants in Hormozgan Province was developed by combining the layers evaluated based on the linear model and considering the priorities and modulation importance coefficients of the sub-criteria and ultimately by overlaying the layer of compulsory sub-criteria on the final layer of the preferred sub-criteria. Based on the final map obtained, 63 locations were found to be appropriate for installing desalination plants on the coast of the Persian Gulf and Oman Sea in Hormozgan Province. By reclassifying and reevaluating the final map, 27 high important locations were found to have the highest priority, spatial value and score for installing water desalination facilities. As shown in Figs. 9, a total of 28 highly important locations were obtained and all the other locations
Fig. 6: Map of the compulsory sub-criteria and indicators in study area
Fig. 7: Evaluated map of distance to Fig. 8: Evaluated map of distance to environmentally
environmentally sensitive land areas sensitive coastal and marine areas
Fig. 6: Map of the compulsory sub-criteria and indicators in study area
Fig. 7: Evaluated map of distance to environmentally sensitive land areas
Fig. 8: Evaluated map of distance to environmentally sensitive coastal and marine areas
98
M. Sepehr et al.
Table 4: Evaluation of the sub-criteria based on distanceTable 4: Evaluation of the sub-criteria based on distance
TrendRates for DelphiSub-criteriaCriteria
Increasing
4000<3000-40002000-30001000-20000-1000meterEnvironmentally
sensitive land
areasEnvironmentally
sensitive area
97531score
Increasing
5000<3000-50002000-30001000-20000-1000meterEnvironmentally
sensitive coastal
and marine areas97531score
Increasing4000<3000-40002000-30001000-20000-1000meter
Wetland97531score
Declining45<30-4520-3015-200-15%
SlopeLand features13579score
Declining28.6<28.3-28.628-28.327.7-28<27.7celsius
-Temp.Sea
waterquality:
Sea features13579score
Declining38.9<38.6-38.938.3-38.638.1-38.3<38.1ppt
-Salinity13579score
Increasing-6<(-4)-(-6)(-2)-(-4)(-1)-(-2)0-(-1)meter
Bathymetry97531score
Declining90000<60000-9000030000-6000015000-300000-15000meter
Place of use
Access
13579score
Increasing4000<3000-40002000-30001000-20000-1000meterCity and village
area 97531score
Declining12000<8000-120006000-80004000-60000-4000meter
Road network13579score
Declining60000<30000-6000020000-300005000-200000-5000meter
Electrical network13579score
Declining2000<1500-20001000-1500500-10000-500meterAccess to the
beach 13579score
Increasing2000<1500-20001000-1500500-10000-500meter
InfrastructureEconomic
97531score
Increasing4000<3000-40002000-30001000-20000-1000meter
Aquaculture areas97531score
Increasing2000<1500-20001000-1500500-10000-500meter
Cultural heritageSocial
significance 97531score
Increasing5000<3000-50002000-30001000-20000-1000meterWaste water
dischargeManagement
97531score
Fig. 9: Final map of site selection for desalination plantsFig. 9: Final map of site selection for desalination plants
99
Global J. Environ. Sci. Manage., 3(1): 89-102, Winter 2017
Fig. 10: Areas with a high important spatial value
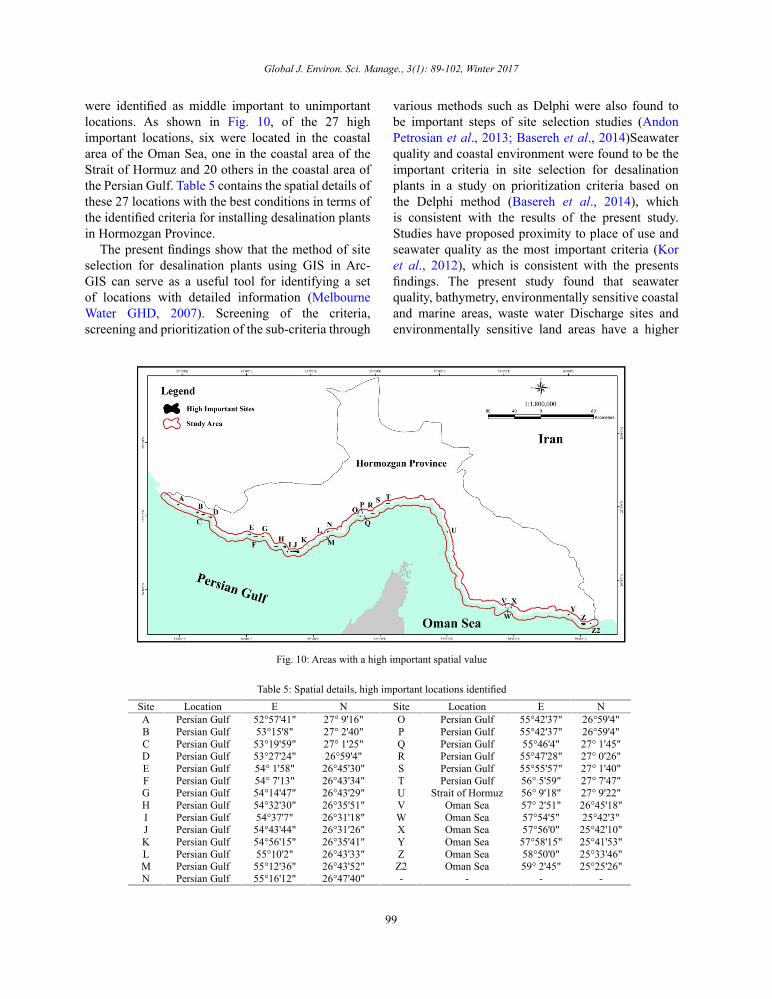
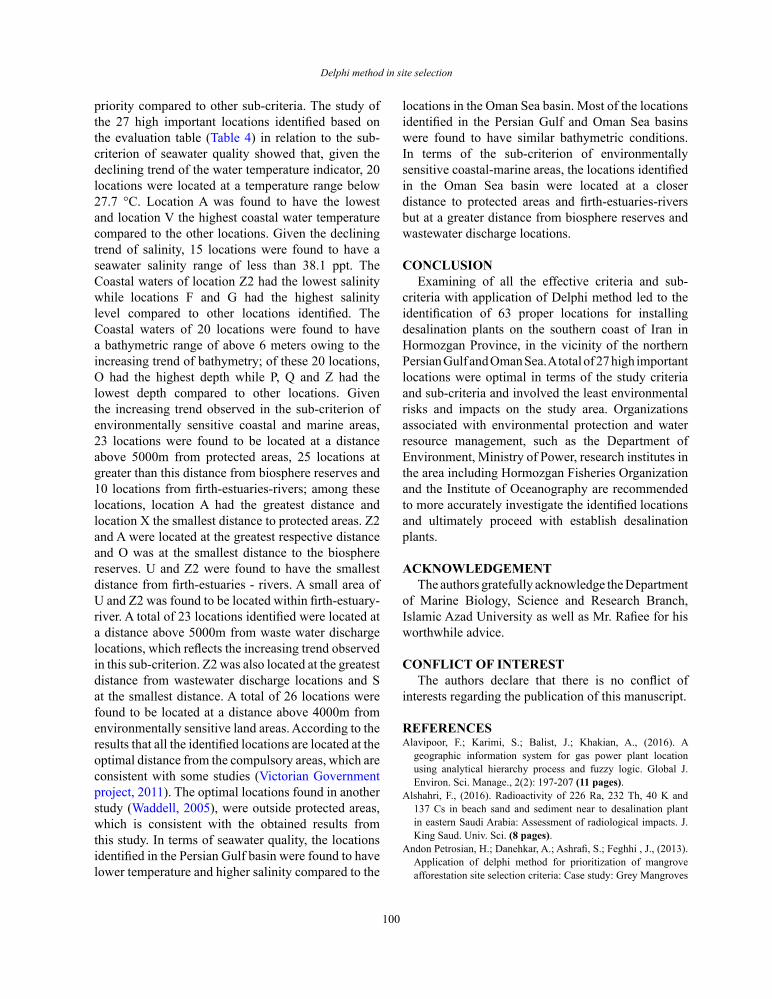
were identified as middle important to unimportant locations. As shown in Fig. 10, of the 27 high important locations, six were located in the coastal area of the Oman Sea, one in the coastal area of the Strait of Hormuz and 20 others in the coastal area of the Persian Gulf. Table 5 contains the spatial details of these 27 locations with the best conditions in terms of the identified criteria for installing desalination plants in Hormozgan Province.
The present findings show that the method of site selection for desalination plants using GIS in Arc-GIS can serve as a useful tool for identifying a set of locations with detailed information (Melbourne Water GHD, 2007). Screening of the criteria, screening and prioritization of the sub-criteria through
various methods such as Delphi were also found to be important steps of site selection studies (Andon Petrosian et al., 2013; Basereh et al., 2014)Seawater quality and coastal environment were found to be the important criteria in site selection for desalination plants in a study on prioritization criteria based on the Delphi method (Basereh et al., 2014), which is consistent with the results of the present study. Studies have proposed proximity to place of use and seawater quality as the most important criteria (Kor et al., 2012), which is consistent with the presents findings. The present study found that seawater quality, bathymetry, environmentally sensitive coastal and marine areas, waste water Discharge sites and environmentally sensitive land areas have a higher
Table 5: Spatial details, high important locations identified
Fig. 10: Areas with a high important spatial value
Table 5: Spatial details, high important locations identified
NELocationSiteNELocationSite
26°59'4"55°42'37"Persian GulfO27° 9'16"52°57'41"Persian GulfA
26°59'4"55°42'37"Persian GulfP27° 2'40"53°15'8"Persian GulfB
27° 1'45"55°46'4"Persian GulfQ27° 1'25"53°19'59"Persian GulfC27° 0'26"55°47'28"Persian GulfR26°59'4"53°27'24"Persian GulfD
27° 1'40"55°55'57"Persian GulfS26°45'30"54° 1'58"Persian GulfE
27° 7'47"56° 5'59"Persian GulfT26°43'34"54° 7'13"Persian GulfF27° 9'22"56° 9'18"Strait of HormuzU26°43'29"54°14'47"Persian GulfG
26°45'18"57° 2'51"Oman SeaV26°35'51"54°32'30"Persian GulfH
25°42'3"57°54'5"Oman SeaW26°31'18"54°37'7"Persian GulfI25°42'10"57°56'0"Oman SeaX26°31'26"54°43'44"Persian GulfJ
25°41'53"57°58'15"Oman SeaY26°35'41"54°56'15"Persian GulfK
25°33'46"58°50'0"Oman SeaZ26°43'33"55°10'2"Persian GulfL25°25'26"59° 2'45"Oman SeaZ226°43'52"55°12'36"Persian GulfM
----26°47'40"55°16'12"Persian GulfN
100
Delphi method in site selection
priority compared to other sub-criteria. The study of the 27 high important locations identified based on the evaluation table (Table 4) in relation to the sub-criterion of seawater quality showed that, given the declining trend of the water temperature indicator, 20 locations were located at a temperature range below 27.7 °C. Location A was found to have the lowest and location V the highest coastal water temperature compared to the other locations. Given the declining trend of salinity, 15 locations were found to have a seawater salinity range of less than 38.1 ppt. The Coastal waters of location Z2 had the lowest salinity while locations F and G had the highest salinity level compared to other locations identified. The Coastal waters of 20 locations were found to have a bathymetric range of above 6 meters owing to the increasing trend of bathymetry; of these 20 locations, O had the highest depth while P, Q and Z had the lowest depth compared to other locations. Given the increasing trend observed in the sub-criterion of environmentally sensitive coastal and marine areas, 23 locations were found to be located at a distance above 5000m from protected areas, 25 locations at greater than this distance from biosphere reserves and 10 locations from firth-estuaries-rivers; among these locations, location A had the greatest distance and location X the smallest distance to protected areas. Z2 and A were located at the greatest respective distance and O was at the smallest distance to the biosphere reserves. U and Z2 were found to have the smallest distance from firth-estuaries - rivers. A small area of U and Z2 was found to be located within firth-estuary-river. A total of 23 locations identified were located at a distance above 5000m from waste water discharge locations, which reflects the increasing trend observed in this sub-criterion. Z2 was also located at the greatest distance from wastewater discharge locations and S at the smallest distance. A total of 26 locations were found to be located at a distance above 4000m from environmentally sensitive land areas. According to the results that all the identified locations are located at the optimal distance from the compulsory areas, which are consistent with some studies (Victorian Government project, 2011). The optimal locations found in another study (Waddell, 2005), were outside protected areas, which is consistent with the obtained results from this study. In terms of seawater quality, the locations identified in the Persian Gulf basin were found to have lower temperature and higher salinity compared to the
locations in the Oman Sea basin. Most of the locations identified in the Persian Gulf and Oman Sea basins were found to have similar bathymetric conditions. In terms of the sub-criterion of environmentally sensitive coastal-marine areas, the locations identified in the Oman Sea basin were located at a closer distance to protected areas and firth-estuaries-rivers but at a greater distance from biosphere reserves and wastewater discharge locations.
CONCLUSIONExamining of all the effective criteria and sub-
criteria with application of Delphi method led to the identification of 63 proper locations for installing desalination plants on the southern coast of Iran in Hormozgan Province, in the vicinity of the northern Persian Gulf and Oman Sea. A total of 27 high important locations were optimal in terms of the study criteria and sub-criteria and involved the least environmental risks and impacts on the study area. Organizations associated with environmental protection and water resource management, such as the Department of Environment, Ministry of Power, research institutes in the area including Hormozgan Fisheries Organization and the Institute of Oceanography are recommended to more accurately investigate the identified locations and ultimately proceed with establish desalination plants.
ACKNOWLEDGEMENTThe authors gratefully acknowledge the Department
of Marine Biology, Science and Research Branch, Islamic Azad University as well as Mr. Rafiee for his worthwhile advice.
CONFLICT OF INTERESTThe authors declare that there is no conflict of
interests regarding the publication of this manuscript.
REFERENCESAlavipoor, F.; Karimi, S.; Balist, J.; Khakian, A., (2016). A
geographic information system for gas power plant location using analytical hierarchy process and fuzzy logic. Global J. Environ. Sci. Manage., 2(2): 197-207 (11 pages).
Alshahri, F., (2016). Radioactivity of 226 Ra, 232 Th, 40 K and 137 Cs in beach sand and sediment near to desalination plant in eastern Saudi Arabia: Assessment of radiological impacts. J. King Saud. Univ. Sci. (8 pages).
Andon Petrosian, H.; Danehkar, A.; Ashrafi, S.; Feghhi , J., (2013). Application of delphi method for prioritization of mangrove afforestation site selection criteria: Case study: Grey Mangroves
101
Global J. Environ. Sci. Manage., 3(1): 89-102, Winter 2017
on North part of Persian Gulf, Iran). Environ. Dev. J., 4(7): 37-48 (12 pages), (In Persian).
Asadpour, G., (2015). Evaluating the geochemistry of Bam salt dome in Hormozgan Province, Iran. Pollution, 1(1): 95-101 (7 pages).
Basereh, N.; Mohammadizadeh, M.; Sekhavati, E. ., (2014). Prioritizing to Choose Proper Regions for Desalination plant construction in Coastal Regions Located in West of Hormozgan Province using TOPSIS method. 3rd National Conference on Health, Environment and Sustainable Development. Bandar Abbas, Iran 19–20 February (14 pages) (In Persian).
Borrowman, C., (2013).Site selection for seawater desalination treatment plant. Water Department Plant Site Selection Process Draft Technical Memorandum. Santa Cruz County, California, USA. (29 pages).
Braulik, G.T.; Ranjbar, S.; Owfi, F.; Aminrad, T.; Dakhteh, S.M.H., (2010). Marine mammal records from Iran. J. Cetac. Res. Manage., 11(1): 49-64 (15 pages).
Chaudhary, P.; Chhetri, S.K.; Joshi, K.M.; Shrestha, B.M.; Kayastha, P., (2016). Application of an Analytic Hierarchy Process (AHP) in the GIS interface for suitable fire site selection: A case study from Kathmandu Metropolitan City, Nepal. Socioecon. Plann. Sci., 53: 60-71 (12 pages).
Cho, J.; Lee, J., (2013). Development of a new technology product evaluation model for assessing commercialization opportunities using Delphi method and fuzzy AHP approach. Expert Syst. Appl., 40(13): 5314-5330 (16 pages).
Cooley, H.; Ajami, N.; Heberger, M., (2013). Key issues in seawater desalination in California: marine impacts. Pacific Institute Oakland, CA: (32 pages).
Daliri, M.; Eighani, M.; Paighambari, S.Y.; Alizadeh, E., (2012). Some morphological characteristics of five marine fish species of Hormozgan coastal waters (Northern Persian Gulf). Caspian J. Appl. Sci. Res., 1(6): 20-26 (7 pages).
Davidson, P., (2013). The Delphi technique in doctoral research: considerations and rationale. Rev. Higher Educ. Self-Learning, 6(22): 53-65 (13 pages).
Erftemeijer, P.L.; Shuail, D.A., (2012). Seagrass habitats in the Arabian Gulf: distribution, tolerance thresholds and threats. Aquat. Ecosyst. Health Manage., 15(sup1): 73-83 (11 pages).
Goh, P.; Ismail, A.; Hilal, N., (2016). Nano-enabled membranes technology: Sustainable and revolutionary solutions for membrane desalination? Desalination, 380: 100-104 (5 pages).
Hasanzadeh, M.; Danehkar, A.; Pak, A., (2012). Application of Delphi method for criteria selection in site survey of oil jetties in Iran. Environ. Nat. Res., 2(1): 119-128 (10 pages).
Hasanzadeh, M.; Danehkar, A.; Azizi, M., (2013). The application of analytical network process to environmental prioritizing criteria for coastal oil jetties site selection in Persian Gulf coasts of Iran. Ocean Coast Manag., 73: 136-144 (9 pages).
Kallali, H.; Anane, M.; Jellali, S.; Tarhouni, J., (2007). GIS-based multi-criteria analysis for potential wastewater aquifer recharge sites. Desalination, 215(1): 111-119 (9 pages).
Kharat, M.G.; Kamble, S.J.; Raut, R.D.; Kamble, S.S.; Dhume, S.M., (2016). Modeling landfill site selection using an integrated fuzzy MCDM approach. Model Earth Syst. Environ., 2(2): 1-16 (16 pages).
Karbassi, A.R.; Pazoki, M., (2015). Environmental qualitative assessment of rivers sediments. Global J. Environ. Sci. Manage.,
1(2): 109-116 (8 pages).Kim, H.S.; No, H.C.; Jo, Y.; Wibisono, A.F.; Park, B.H.; Choi, J.;
Lee, J.I.; Jeong, Y.H.; Cho, N.Z., (2015). Feasibility study of a dedicated nuclear desalination system: Low-pressure Inherent heat sink nuclear desalination plant (LIND). Nucl. Eng. Tech., 47(3): 293-305 (13 pages).
Kor, Y.; Kashfi, H.; Takdastan, A; Mehdinejad, M.H.; Amirkhanlo, B., (2012). Construction positioning and prioritization of the desalination complexes in Village of Qeshm Island. National Conference on sea water utilization. Kerman, Iran 3–4 January. (9 pages), (In Persian).
Koupaei, A.N.; Mostafavi, P.G.; Mehrabadi, J.F.; Fatemi, S.M.R.; Dehghani, H., (2015). Diversity of shallow water zoantharians in Hengam and Larak Islands, in the Persian Gulf. J. Mar. Biol. Assoc. 1-11 (11 pages).
Lang, T., (1995). An overview of four futures methodologies. Manoa J. Fried Half-Fried Ideas.
Lattemann, S.; Höpner, T., (2008). Environmental impact and impact assessment of seawater desalination. Desalination, 220(1): 1-15 (15 pages).
Life Red Sea Project, (2008). Environmental practices for desalination plants in the South Red Sea Region of Egypt. United States Agency for International Developmen.
Mafi-Gholami, D.; Feghhi, J.; Danehkar, A.; Yarali, N., (2015). Prioritizing stresses and disturbances affecting mangrove forests using fuzzy analytic hierarchy process. Case study: mangrove forests of Hormozgan Province, Iran. Adv. Environ. Sci., 7(3): 442-459 (18 pages).
Mafi-Gholami, D.; Feghhi, J.; Danehkar, A.; Yarali, N., (2015). Classification and prioritization of negative factors affecting on mangrove forests using Delphi method (Case study: Mangrove Forests of Hormozgan Province of Iran). Adv. Biores., 6(3): 78-92 (15 pages).
Melbourne Water and GHD (2007). Melbourne augmentation program seawater desalination. feasibility study. Melbourne Water and clients people performance.
Mezher, T.; Fath, H.; Abbas, Z.; Khaled, A., (2011). Techno-economic assessment and environmental impacts of desalination technologies. Desalination, 266(1): 263-273 (11 pages).
Mohammadi, M.; Tajik, H.; Hajeb, P., (2013). Nutritional composition of seaweeds from the northern Persian Gulf. Iran J. Fish Sci., 12(1): 232-240 (9 pages).
Molavi‐Arabshahi, M.; Arpe, K.; Leroy, S., (2016). Precipitation and temperature of the southwest Caspian Sea region during the last 55 years: Their trends and teleconnections with large‐scale atmospheric phenomena. Int. J. Climatol., 36(5): 2156-2172 (17 pages).
Mousavi, S.H.; Danehkar, A.; Shokri, M.R.; Poorbagher, H.; Azhdari, D., (2015). Site selection for artificial reefs using a new combine Multi-Criteria Decision-Making (MCDM) tools for coral reefs in the Kish Island–Persian Gulf. Ocean Coast Manag., 111: 92-102 (11 pages).
Ong, C.; Goh, P.; Lau, W.; Misdan, N.; Ismail, A., (2016). Nanomaterials for biofouling and scaling mitigation of thin film composite membrane: A review. Desalination, 393: 2-15 (14 pages).
Pilcher, N.J.; Antonopoulou, M.; Perry, L.; Abdel-Moati, M.A.; Al Abdessalaam, T.Z.; Albeldawi, M.; Al Ansi, M.; Al-Mohannadi, S.F.; Al Zahlawi, N.; Baldwin, R., (2014). Identification of
102
M. Sepehr et al.
AUTHOR (S) BIOSKETCHESSepehr, M., Ph.D. Candidate, Marine Ecology, Department of Marine Biology, Science and Research Branch, Islamic Azad University, Tehran, Iran. Email: [email protected]
Fatemi, S.M.R., Ph.D., Associate Professor, Department of Marine Biology, Science and Research Branch, Islamic Azad University, Tehran, Iran. Email: [email protected]
Danehkar, A., Ph.D., Associate Professor, Department of Environmental Sciences, Faculty of Natural Resources, University of Tehran, Tehran, Iran. Email: [email protected]
Mashinchian-Moradi, A., Ph.D., Assistant Professor, Department of marine biology, Science and Research Campus, Islamic Azad University, Tehran, Iran. Email: [email protected]
COPYRIGHTSCopyright for this article is retained by the author(s), with publication rights granted to the GJESM Journal.This is an open-access article distributed under the terms and conditions of the Creative Commons AttributionLicense (http://creativecommons.org/licenses/by/4.0/).
HOW TO CITE THIS ARTICLESepehr, M., Fatemi, S.M.R., Danehkar, A., Mashinchian- Moradi, A., (2017). Application of Delphi method in site selection of desalination plants. Global J. Environ. Sci. Manage. 3(1): 89-102.
DOI: 10.22034/gjesm.2017.03.01.009
url: http://gjesm.net/article_22215.html
important sea turtle areas for hawksbill turtles in the Arabian Region. J. Exp. Mar. Biol. Ecol., 460: 89-99 (11 pages).
Roberts, D.A.; Johnston, E.L.; Knott, N.A., (2010). Impacts of desalination plant discharges on the marine environment: A critical review of published studies. Water Res., 44(18): 5117-5128 (12 pages).
Sanver, A., May, S.C. (2010). The desalination processes site selection, layout and civil works. The Desalination Site and Civil Works. Encyclopedia of desalination and water resources, (10 pages).
Tsiourtis, N.X., (2008). Criteria and procedure for selecting a site for a desalination plant. Desalination, 221(1): 114-125 (12 pages).
Uyan, M., (2013). GIS-based solar farms site selection using analytic hierarchy process (AHP) in Karapinar region, Konya/ Turkey. Renewable Sustainable Energy Rev., 28: 11-17 (7 pages).
Waddell, D., (2005). Environmental assessment of the concept plan for Sydney’s Desalination ii: Project Sydney water. Wang, Y.; Jung, K.-A.; Yeo, G.-T.; Chou, C.-C., (2014). Selecting a cruise port of call location using the fuzzy-AHP method: A case study in East Asia. Tourism Manage., 42: 262-270 (9 pages).
Yal, G.P.; Akgün, H., (2014). Landfill site selection utilizing TOPSIS methodology and clay liner geotechnical characterization: a case study for Ankara, Turkey. Bull. Eng. Geol. Environ., 73(2): 369-388 (20 pages).
Yavari, A.R.; Jafari, H.R.; Hashemi, S.M., (2015). Spatial–Temporal Monitoring of Ecotonal Belt Using Landscape Ecological Indices in the Central Elburz Region: Remote sensing and GIS analysis. Pollution., 1(2): 231-246 (16 pages).
Victorian Government project., (2011). Synthesis of environmental effects, Victorian desalination project environmental effects statement. volume 1. Department of Sustainability and Environment.