Embed Size (px)
Citation preview

Research ArticleApplication of DC-AC Hybrid Grid and Solar PhotovoltaicGeneration with Battery Storage Using Smart Grid
Shoaib Rauf and Nasrullah Khan
Department of Electrical Engineering, Comsats Institute of Information Technology, Islamabad/UOGHH, Islamabad, Pakistan
Correspondence should be addressed to Shoaib Rauf; [email protected]
Received 6 May 2017; Revised 16 July 2017; Accepted 6 August 2017; Published 5 September 2017
Academic Editor: Mahmoud M. El-Nahass
Copyright © 2017 Shoaib Rauf and Nasrullah Khan. This is an open access article distributed under the Creative CommonsAttribution License, which permits unrestricted use, distribution, and reproduction in any medium, provided the original workis properly cited.
Smart grid for the past few years has been the prime focus of research in power systems. The aim is to eliminate load shedding andproblematic blackout conditions, further offering cheap and continuous supply of electricity for both large and small consumers.Another benefit is to integrate renewable energy resources with existing dump grid in more efficient and cost-effective manner.In past few years, growing demand for sustainable energy increases the consumption of solar PV. Since generation from solarPV is in DC and most of the appliances at home could be operated on DC, AC-DC hybrid distribution system with energymanagement system is proposed in this paper. EMS helps to shift or control the auxiliary load and compel the users to operatespecific load at certain time slots. These techniques further help to manage the excessive load during peak and off peak hours. Itdemonstrates the practical implementation of DC-AC network with integration of solar PV and battery storage with existinginfrastructure. The results show a remarkable improvement using hybrid AC-DC framework in terms of reliability andefficiency. All this functioning together enhances the overall efficiency; hence, a secure, economical, reliable, and intelligentsystem leads to a smart grid.
1. Introduction
Renewable energy resources such as solar photovoltaic (PV)became more popular over the last decade due to increasingenvironmental awareness and tax exemption policies on thesolar PV systems by the government of Pakistan. Integrationof solar PV using various smart load management techniqueswill boost the efficiency of the overall system by reducing themassive cost of electricity bills. The continuing fear aboutlimited resources of fossil fuels and abrupt change in envi-ronmental conditions have pinched the consideration ofpower generation using renewable energies. World leadingcountries are also giving incentives to encourage the integra-tion of these renewable energy sources (RES) with our exist-ing systems [1]. Therefore, increasing demand for these RESfurther enhances its credibility and unlocks different ways forindividuals to utilize this cheap energy in this expensiveworld. But still, there is a need to find efficient and expertways to enjoy these RES exclusively.
Recent developments in RES such as solar PV providemagnificent opportunities for concrete implementation ofsmart grid at individual level with further advancement ofintegration of battery storage and self-switching or control-ling of smart appliances automatically. Hence, foremostachievement is the utilization and absorption of smart gridtechnologies using smart load management schemes in resi-dential region, which in result gears to lessen energy priceplus demand management more smartly.
There is a threat of running down of natural resourceslike coal, gas, and fuel; time is not so far off when a severedecline in the natural resources will be faced [1]. Therefore,efficient use of these resources is a key route to deal withthe ever increasing crisis in energy sector. Environmentalawareness from local and foreign platforms has made theclean power demand progressively significant [2]. Integra-tion of renewable energy resources in existing system is goingwild; therefore, proper results are not achieved yet due to thelack of professionals. There are many individuals working on
HindawiInternational Journal of PhotoenergyVolume 2017, Article ID 6736928, 16 pageshttps://doi.org/10.1155/2017/6736928

RES in Pakistan with zero acquaintance of the current state ofthe art; however, proper designing and installation can leadto a more reliable system using smart grid. This could bedone at local level with continuous supply of electricity forboth large and small scale consumers. Both solar and windgeneration is possible but solar PV is more preferable inPakistan as compared to wind-based energy generation. Solarenergy potential map of Pakistan in Figure 1 shows that 35%of total area lies in the range of 5.9–6.2 kWh/m2 whereas 45%lies in the range of 5.4–5.8 kWh/m2 and 20% lies in the rangeof 4.8–5.1 kWh/m2 [3].
Wind energy is not economical for local generationneither it is available throughout the year in most of the areas
of Pakistan. Also, wind mills produce noise that is not bear-able and acceptable for residential areas hence is needed tobe installed in outskirts which also increase power transmis-sion problems. Therefore, the most economical and practicalsolution for local power generation is solar PV. Integration ofsolar PV systems in the present dump grid is the biggestchallenge for implementation, planning, and operation ofthe upcoming smart grid [3]. PV devices along with parallelbattery storage need an intelligent system which ensures onlysolar-based charging during day hours and minimizes thedischarging of batteries resulting in a decrease in cost by util-ity. Utility is only preferred when enough solar energy is notavailable during day hours to save the battery storage for
0 125 250 500 km
W ES
N
Solar energy potential map of Pakistan
60º0′0″E 65º0′0″E 70º0′0″E 75º0′0″E 80º0′0″E
60º0′0″E 65º0′0″E 70º0′0″E 7º0′0″E 80º0′0″E
BoundaryWater bodyProtected areas
Solar energy potentialHigh 5.9−6.2 kWh/m2
5.4−5.8 kWh/m2Medium4.8−5.1 kWh/m2Low
35º 0′0″
N30
º 0′0″
N25
º 0′0″
N
35º 0′0″
N30
º 0′0″
N25
º 0′0″
N
Figure 1: Solar energy potential map of Pakistan.
PWM
MPPT
8
7
6
5
4
Am
ps
3
2
1
0
800
700
600
500
400
Wat
ts
300
200
100
00 10 20 30 40 50 60
Voltages70 80 90 100 110
Figure 2: Maximum power point tracking curve.
2 International Journal of Photoenergy

night. During night hours, battery storage is used only whenutility is not available to avoid complete blackout situation.
Some researches indicate various issues for properintegration of solar PV with existing grid and battery stor-age system [4]. They also explain multiple ways of setupfor battery storage system in smart grid. Authors in [5]present a small model of DC-DC buck-boost converterwhich offers desired DC voltage level for specific DCappliances. However, authors in [6, 7] focused on the per-fection of energy productivity in solar PV systems. Theyintroduced many ways to increase the efficiency of solarPV systems. They analyzed and surveyed the proposedapproaches for increasing the efficiency of the said system.It was found that maximum power point tracking (MPPT)along with battery charging and discharging techniquesplays a vital role for maximum efficiency in solar PV sys-tems. Authors in [8–10] also described the same approachfor the maximum power tracking as shown in Figure 2.They presented an analysis of different load models in[11, 12]. They considered different static load models in
[11] for energy efficiency, and these models are furtherimplemented in [13] for more realistic problem at majordelivery load point. Load demand and power generationby solar PV keep on changing with respect to time andweather conditions.
In the field of smart grid in last few years, numerousdiscoveries have been made. Their goal is to make theexisting system more reliable, cheaper, economical, andsmarter to cater the current power supply demand usingsmart grid in addition to utilizing maximum solar PV-distributed generation. Proper use of rooftop solar arraysystems has turned out to be truly useful for local home-based practices. There is about 22% loss of power due tovarious conversions from DC-AC and then AC-DC. Most
Table 1: Different load categories.
Load type Max power Nature Example Priority Time slots
Basic load 150watts AC and DC both
AC fans
1st 24 hours
AC lights
Mobile charger
LED lights
DC fans
Laptop charger
Televisions
Regular load 1200watts DC inverter DC inverter compressors 2nd On demand
Burst load 1000watts Pure AC
Water pumps
3rd Scheduled time slots
Washing machines
Dryers
Electric irons
Electric hybrid gas heaters
Over cooling ine�cient use of energy
Set point
Tem
pera
ture
Minimum temperature �uctuation
DC inverter technologyTime
Noninverter technology
e�cient use of energy
Figure 3: Comparison of DC inverter versus noninvertertechnology.
Utility
Solar powerEMS
Batterystorage
WirelessCB
24/7
Basic load Regular load Burst load
On demand Scheduledtime slots
WirelessCB
WirelessCB
Remoteswitching
Figure 4: Architecture of the system.
3International Journal of Photoenergy

of the appliances accept DC power; therefore, they aredirectly coupled with solar PV and battery storage. Forother devices which do not accept DC, conversion prob-lem still prevails. If power is converted from low-levelDC voltage to higher-level AC voltage, then it is neededto step-up a low-level voltage from a solar PV to conven-tional voltage level (220V) then further conversion to AC.These solar PV arrays are fed to local grid using differentinverters with conversion losses because solar PV producesDC supply and existing utility accepts AC only. Seriescombination of solar panels thus adds up the voltage tothe desired level instead of using step-up transformers toavoid the transformer as well as conversion losses.
1.1. Objectives of Work. The following are a few objectives forthis work:
(i) Continuous supply of power during hours ofunplanned load shedding at domestic level
(ii) Utilizing maximum solar energy to reduce expen-sive utility tariff
(iii) Reducing the dependency of consumer on utility byinteracting with both utility and the end user
(iv) Compelling the system to bring the interest of bothconsumer and utility at a single platform in order toreduce the demand charges
(v) Rescheduling maximum power-consuming tasksduring hours of maximum PV generation
(vi) Managing regular load more efficiently using feed-back from weather forecast
(vii) DC microgrid implementation to reduce powerconversion losses for basic load
(viii) Different series andparallel combination of solar PVarray to reduce line losses for high-rise buildings
Table 2: Average power consumption without efficient load.
Load type Items WattsSummer months Winter months
Hrs/day Days/wk WH/day Hrs/day Days/wk WH/day
Basic load
Lights 200 6 7 1200 8 7 1600
Fans 400 10 7 4000 0 0 0
Router 15 24 7 360 24 7 360
TV 75 4 7 300 5 7 375
PCs 80 4 5 228 5 5 285
Regular loadFridge 480 7 7 3360 3.5 7 1680
ACs 1800 5 4 5142 0 0 0
Burst load
Pump 1600 1.5 7 2400 1 7 1600
Iron 1000 0.25 5 178 0.25 5 178
Washer 320 1.5 2 137 1.5 1 68
Cleaner 2000 0.5 2 285 0.5 1 142
Total 17592Wh/day 6290Wh/day
Table 3: Average power consumption with efficient load.
Load type Items WattsSummer months Winter months
Hrs/day Days/wk WH/day Hrs/day Days/wk WH/day
Basic load
LED lights 100 6 7 1200 8 7 800
Fans 400 10 7 4000 0 0 0
Router 15 24 7 360 24 7 360
TV 75 4 7 300 5 7 375
PCs 80 4 5 228 5 5 285
Regular loadFridge (DC inverter) 160 7 7 1120 3.5 7 560
ACs (DC inverter) 800 5 4 2285 0 0 0
Burst load
Pump 1600 1.5 7 2400 1 7 1600
Iron 1000 0.25 5 178 0.25 5 178
Washer 320 1.5 2 137 1.5 1 68
Cleaner 2000 0.5 2 285 0.5 1 142
Total 12493Wh/day 4368Wh/day
4 International Journal of Photoenergy

Battery
B
Utility
U
Solar PV
S
Sources
Priority
Load types
Time slots
Remoteswitching
S S S S UU BB
I/P
Basic load
24/7
No
On demand
Yes
Scheduled
Yes N/A
Regular load Burst load Battery
I/P I/P I/P I/P
1st 2nd 1st 2nd 1st 1st 2nd3rd
Figure 5: Control layout of the system.
1
250 W, 30.7 Vdc 25 W, 30.7 Vdc 250 W, 30.7 Vdc 150 W, 18 Vdc 150 W, 18 Vdc
2 3 1 2
92.1 Vdc 36 Vdc
28 Vdc
12 battery cells (2 Vdc)
Basic load
Regular load
Burst load
Timer/scheduled-based switching
0−24 Vdc
MPPT chargecontroller DC loads
Solar PV I/P
48 Vdc
12 Vdc− + − + − + − +
200 Ah 200 Ah 200 Ah 200 Ah
Cloudy/rainy/night hours
12 Vdc 12 Vdc 12 Vdc
5 kVA inverterand
60 A MPPTcharge controller
220 VacUtility I/P
230 Vacoutput
Smartwireless CB
Figure 6: A smart system model.
5International Journal of Photoenergy

(ix) Smartly managing battery storage by shifting loadback to utility in order tominimize battery discharge
(x) Remotely control specific machine using wirelesscircuit breaker and rescheduling a healthy time slotbecause up to 40% of load could be decreased ifconsidering washing and drying only.
1.2. Load Classification. The system design includes the abil-ity to interact with both utility and end users, which can bemodified according to the consumer desire. Depending uponthe availability of supply, from both utility and solar powergeneration, demand side load management can be done.Load forecasting could be done depending upon the avail-ability of power from solar PV. Different incentives in favorof end users and supply side help to bring both allies on acommon platform. This platform encourages and involvesthe concern from both parties so that it is more practicaland regulates the system more smoothly. We define load inthree different categories as shown in Table 1.
Basic load is defined as the load with 1st priority, andmaximum power rating for each appliance is 150watts. Thisload is needed 24 hours a day without any interruption. 35–42% of total load is basic load due to varying weather condi-tions [14]. It is maximum during summers and minimumduring winter season. Nature of this load is both AC andDC such as conventional AC lights and fans. In addition tothis, it also involves DC load such as mobile, laptop chargers,televisions, PCs, and LED lights. It can prevent conversionrestrains by utilizing solar DC power directly for DC devices.
Regular load involves air-conditioning and refrigera-tion loads with DC inverter technology. It involves DCcompressors instead of AC. DC motors coupled with thesecompressors make system more efficient. It saves up to50% of power as compared to existing compressors forboth air-conditioning and refrigeration systems. Secondpriority is defined for these systems. This load also varieswith seasonal changes. During summers, it is at its peakcomprising almost 48% of total load, and during winter,
27% of the total load. Figure 3 shows comparison of boththe technologies [15].
Burst load is used during specific time slots; they mayvary with respect to different activities. 31–35% of the overallload is burst load. As it may vary with daily routines, it couldbe rescheduled on specific time slots, at the time of maximumsolar power generation. Depending upon the weather condi-tions, this load can be varied. The common examples of theseactivities are ironing, washing, drying, and heating.
Figure 4 shows the basic architecture of the combinedsystem. In order to apply the EMS smartly to residential
1
250 W, 30.7 Vdc 250 W, 30.7 Vdc
92.1 Vdc, 32.6 A
250 W, 30.7 Vdc 250 W, 30.7 Vdc 250 W, 30.7 Vdc 250 W, 30.7 Vdc
2 3 10 11 12
Figure 7: Series and parallel combination of solar PV panels.
Table 4: Specification of 250W solar PV.
Rating power 250W
Rating power voltage 30.7V
Rating power current 8.15A
Open-circuit voltage 38.10V
Short-circuit current 8.80A
Table 5: Specification of EMS.
Voltage 230Vac
Frequency 50Hz
Voltages 230Vac
Efficiency 93%
Transfer time 10ms
Waveform Pure sine wave
Battery voltages 48Vdc
Floating charge voltage 54Vdc
Overcharge protection 60Vdc
Maximum PV array 3000W
MPPT voltage range 60Vdc–115Vdc
Maximum PV array open-circuit voltage 145Vdc
Maximum solar charger current 60A
6 International Journal of Photoenergy

houses, load such as regular load and burst load appliancesmust be put into a special range. This special range of loadsis needed to add with a wireless transmitter and data process.These communication devices give birth to a more intelligentand efficient system. They could be operated automaticallyduring an appropriate time interval on the availability of
energy resources. However, it would be better if user couldcentralize the load management of all smart appliance usingEMS. In this paper, we introduce the most generalized archi-tecture of EMS in a residential load with an additional featureof using DC appliances. This feature further enhances theoverall functionality, stability, and efficiency by reducing
Weather forecast for the next day
Load > PV > loadGen
Battery chargingSolar PVUtiliy
Wireless circuit breakerswitch off excessive load
Check battery level
Check load demand
Start
Solar PV
Load > PV > LoadGen
Load > PV > loadGen
B < 50% < B
Charging by PVCharging by utility
Sunny dayNo Yes
Figure 8: Flow diagram for EMS during summer.
7International Journal of Photoenergy

the DC-AC-DC conversion losses. It also presents anapproach to schedule the electricity consumption to reduceelectricity cost.
For this approach, the final results of experimental workprove its feasibility and effectiveness for local user. Table 2shows the average power consumption for existing load[14]. Replacing the existing lighting load by LED lights forbasic load reduces the overall load by 50% as shown inTable 3. Since this reduction in load enhances the overall effi-ciency of the system, introducing DC inverter technology forregular load further decreases 60% of the load. It also reducesload consumption and achieves reduction in peak loaddemand and operational cost for the users.
2. Energy Management System
Besides providing the connection between different loads,this system has the ability to collect information and executecontrol commands for the households. It provides continu-ous observations and acquires information about both loadand supply profile, convincing the end user to take preventivemeasures by switching the auxiliary load to save power forextreme conditions. These extreme conditions are definedby users using their routine power consumption to avoidcomplete blackout conditions. Users can control the opera-tion of the whole system from a set of predefined statesaccording to their requirements as shown in Figure 5. Theseoperations can further be upgraded using different factorslike weather and load forecasting. This guarantees theenhanced function of the local grid and permits theconsumers to regulate their power accordingly.
A smart storage is proposed for the off-grid DC loads. Aseries connection of 2Vdc battery cells is used. These batterycells have the capability to store maximum charge in the formof ampere hours with potential difference of 2Vdc. A total of12 cells are connected in series, so it could produce 24Vdc.This proposal is further explained later.
According to the proposed design, the rooftop is coveredwith solar PV which connects directly to the energy manage-ment system. Series combination of solar PV panels reducesthe voltage drop in solar output voltage and also the powertransmission losses. Both AC and DC supply lines are
directly connected with AC and DC load lines within thebuilt-in wiring of the house. A 92.1Vdc from solar is fed tothe EMS. This system accepts power from both solar PVand utility and supplies power to three types of loads as men-tioned before. Smart wireless circuit breakers are installed atspecific load, such as burst and regular loads. Dependingupon the generation, EMS will distribute power among allconnected loads at different time slots. It will acquire datafrom current and potential transformers, installed at supplyside of PV generation and with the load. Graphical user inter-face is installed with EMS, which allows the monitoring ofdifferent variables such as solar PV generation, connectedload, and battery voltage. Using power generation profilefrom solar PV, EMS will decide the priorities for every singleload type and electrify the specific load. During the hours ofmaximum generation, EMS will send notifications via SMS tothe users to regulate their specific tasks. These notificationsare alarm based and via SMS through GSM module con-nected with EMS. Smart wireless circuit breakers installedat specific loads further enable both consumers and utilityto control the excessive load remotely. Combined systemarchitecture is shown in Figure 6.
This system helps to manage both AC and DC loadsimultaneously, on the basis of exact calculation of loaddemand. Figure 6 shows 3 kW of solar input power for regu-lar and burst load and 0.6 kW for basic load. Figure 7 showstwelve monocrystalline solar panels, each of 250watts, con-nected in series and parallel combination to sum up voltagelevel of 92.1Vdc.
Series connections add up voltages which decrease thetransmission losses, and further, parallel connections addup current. Current and voltage specification for each solarPV panels is shown in Table 4.
Table 6: Backup time for different load.
Load (VA) Backup time @ 48Vdc 200Ah batteries (min)
500 1152
1000 576
1500 384
2000 288
2500 230
3000 192
3500 164
4000 144
4500 128
5000 115
1400
1200
1000
800
600
Back
up ti
me (
min
)
400
200
00 1000 2000 3000
Load (VA)4000 5000 6000
Figure 9: Backup time versus power consumed by load.
Table 7: Voltage level for DC appliances.
DC voltage levels DC appliances
5Vdc Mobile, iPad
12Vdc Led light, DC fan
18Vdc Laptop charger
24Vdc Television, DC motor
8 International Journal of Photoenergy

18 Vdc 18 Vdc
− +
+
+−
− +− +− +− +− +− +− +− +− +− +− +−
36 Vdc
MPPTcharge controller
28 Vdc
2 Vdc
1 2 3 4 5 6 7 8 9 10 11 12
GND
2 Vdc 2 Vdc
6 Vdc
MobileiPad
charger
LED lightsDC fans
Laptopcharger
LED TVDC motor pump
12 Vdc 18 Vdc 24 Vdc
2 Vdc 2 Vdc 2 Vdc 2 Vdc 2 Vdc 2 Vdc 2 Vdc 2 Vdc 2 Vdc
Figure 10: Schematic diagram for DC Loads.
6:00
6:30
7:30
10:00
11:00
12:00
13:00
15:00
19:00
20:00
Figure 11: Status of battery and connected load.
9International Journal of Photoenergy

A 5kVA hybrid inverter is designed for AC loads; it pro-duces pure sine wave with built-in MPPT charge controller.Table 5 shows specification of EMS.
3. Flow Chart for EMS
Different priorities for output of inverter are set to configureload. “Solar first” priority will allow utilization of solar energyat first priority from solar PV array. If sunshine is not at peakand is unable to produce maximum power for all connectedload, then smart wireless circuit breaker will turn off the lesspriority load, which could be defined by the user. Total loadat home could be varied with respect to different activitiesat home, such as washing, drying, and ironing. This smartsystem will check with weather forecast regularly and suggestdifferent future time slots for these activities; it will also checkfor battery storage. Even though, utility charging is available,but in order to minimize utility cost, solar charging willbe preferred.
Battery storage would be the last priority at night hoursonly when utility and solar are both not available. Duringworst condition, only basic load could be switched on, andthe auxiliary load will be shut down until next optimum
condition. The optimum conditions occur only when anyof the sources, either solar or utility, is available. If utility isavailable and battery storage is facing critical situation, thenload demand for regular load and battery charging could beaccomplished from this source. This scheme of workinghelps to minimum discharging of batteries, thereby increas-ing their life as batteries have limited number of cycles forboth charging and discharging.
The case study in this paper is based on the powergeneration and its usage in summer only because, asobserved in Table 3, there is 65% more power consump-tion in summers as compared to that in winters. Thisincrease in power demand is due to excessive use of cool-ing appliances in summers. The flow diagram of EMS asshown in Figure 8 is further implemented in Section 5,using graphical and numerical values. The same schemecan easily be implemented for winters as power consump-tion is very low.
During day hours, solar PV provides power to both theload and battery charging simultaneously. If the solar is notable to supply power, then the load will be shifted to utility,and the batteries will still be charged by solar. Load forecast-ing could be done by using the following equation. Table 6
7:00
8:00
9:00
10:00
11:00
12:00
14:00
16:30
17:00
18:00
Figure 12: Status of PV generation and output of inverter.
10 International Journal of Photoenergy

shows values for backup time for different loads, and Figure 9shows graph for backup time and power consumed by load.
Load amperes = PowerVoltage
Backup time = Battery ampere hoursLoad amperes
1
4. DC Microgrid
DC microgrid does not need the scheduling because the DCload it runs is the basic load which is less than 150watts. Thisload category defines the load that can be run on DC power,such as LED lights, televisions, mobile, and laptop chargers.Table 7 shows different input voltage ranges for DCappliances included in basic load.
DC microgrid used for DC loads involves series com-bination of both solar PV and 2Vdc battery cells. Theuse of 2Vdc battery cells eases the accessibility of thedesired volts as per load requirement for varied DC volt-age levels as shown in Figure 10. It is further specifiedusing DC-DC converters. It allows both DC load andpower supply from solar PV to link directly thus reducingthe conversion losses.
The DC system is used to lessen the conversion lossesand uplift the efficiency of the entire system. Additionally,it offers a backbone grid within the whole system toempower DC loads and increase its overall reliability. Itdirectly electrifies the DC load with the batteries which arealso DC based thus eliminating the need of power
conversion for AC transmission. DC systems have zero fre-quency; thus, it is much easier to monitor and control loadprofile [16]. DC transmission is much efficient than ACpower transmission [17]. DC systems are applied in varioussystems such as in submarine and ship. DC systems arealso used in many off-grid homes and stand-alone systems[18]. Nowadays, most of the IT data centers are movingtowards DC power source which is almost 20% moreenergy efficient than existing AC supplies [19]. A two-way power transfer is also possible as these grids couldbe connected easily with existing AC grids using inverterswhich make the overall network more reliable. Increasedefficiency is a trade-off for additional cost of this DC sys-tem. There are few major hurdles such as large scaleemployment, regularization, and safety for DC systemswhich still need to be worked on in order to be accepted
Table 8: Battery bank system.
Specifications Values
2Vdc, 100Ah battery cell 12 cells
Volts × amperes × number of cells =max battery bank capacity (Wh)
2Vdc× 100Ah× 12cells = 2400Wh
Charging efficiency (%) 90
Minimum and maximum storage 50%–100%
Life cycles for charging and discharging 2000
Cost per cycle usage 0.10 Rs/kWh
700600500400300
Pow
er (W
)
200100
0
3000
2500
2000
1500
Wat
t hou
rs (W
h)
1000
500
00 5 10 15
Time (hours)20
Battery
25
0 5 10 15Time (hours)
20
LoadSolar
25−100
Figure 13: Graphical profile for basic load.
11International Journal of Photoenergy
in market [20]. Future PV systems connected to low-voltageDC grids are expected to be more effective in performanceand support the entire grid [21].
Solar energy captured by PV arrays generates DC power[22]. Operating the DC appliances directly on DC gridenhances the system reliability and minimizes the conversionlosses. Thus, solar PV produces DC power and directly
electrifies these devices. Load of individual appliance withmaximum power rating of 150watts falls in this category.These devices are run by directly connecting solar PV panelsand battery storage using different series and parallel combi-nations to get the desired voltage level for individual devices.Further DC-DC converters are used to supply exact powersupply to each of these appliances.
Battery
Load
3500
3000
2500
2000
1500
Pow
er (W
)
1000
500
−500
12000
10000
8000
6000
Wat
t hou
rs (W
h)
4000
2000
00 5 10 15
Time (hours)20 25
00 5 10 15
Time (hours)
20 25
Solar
Figure 15: Graphical profile for burst and regular load.
0 5 10 15Time (hours)
20 25
Pow
er (W
)0
500
1000
1500
2000
2500
3000
Electric ovenAir conditionerRefrigeratorWater pump
Utility battery chargingClothes washerDish washer
Figure 14: Power consumption by different type of AC loads.
12 International Journal of Photoenergy

5. Implementation and Results
The above-stated system could be very useful for continuoussupply of power with additional feature of cost reductionfrom utility. To evaluate the system, two houses are observedin rural areas of Punjab, Pakistan during summer season. Asthe load shedding and power shortage are more observed insummer due to excessive use of refrigerators and air condi-tioners, one of the houses is equipped with EMS. Both houseshave the same load power consumption with the same num-ber of appliances installed. Real-time data is examined for thehouse with EMS and compared with that for the other with-out EMS. Figures 11 and 12 show snapshots of graphical userinterface for the house with EMS at different time slotsduring a sunny day in summer. These results show status ofconnected battery voltage, solar PV generation, and con-nected load in watts, with additional graphical status of inputand output power supplies. At 6:00 in the morning, utilitysupplies power to both load and battery charging as solar isnot available. The battery will remain full and further boostbattery storage. Similarly, at 6:30, solar input is not sufficientto fulfil all connected load but will charge the battery storagein order to save charging cost from utility. After 7:30,sunshine is adequately running connected load as well ascharging the batteries.
As peak solar PV generation is from 11:00 to 13:00 hours,maximum power-consuming tasks such as washing, ironing,heating, cleaning, and water pumping could be scheduled atthis time slot. Acquiring data from local weather forecastingwill further help to predict different days for such activities.DC inverter compressors are equipped with DC-basedmotors for both refrigeration and air-conditioning loadsand are scheduled to run at maximum speed to achieve max-imum cooling during these hours. This cooling effect lastslong and helps to restore temperature during night hours.Further insulation for refrigerators and air-conditioningrooms enhances the temperature coefficient. After sunset,
utility will have to supply power to all the connected load,and battery storage is used only in the case of load sheddingwhen all supplementary load will also be shutdown. Duringnight hours, DC inverter loads are operated at slow speed;it consumes minimum power and helps to stimulate thecooling effect stored during daytime. Figure 13 shows thegraphical representation of the DC load. As mentionedearlier, this type of load is the 1st priority and its time ofusage is almost throughout the day.
A 600-watt rooftop PV system is connected with2400Wh battery bank with the following specification asshown in Table 8. The graph shows the data during an aver-age summer day for both solar power generation and loaddemand with battery storage status with respect to time.
Battery sizing is done in such a way that it could not bedischarged fully. The load is managed so that it would notdischarge the battery below 50% thereby saving the battery
Load watts (consumption)
PV watts (production)
2000
1500
1000500
4000
3000
2000
10000
014:25 14:30 14:35 14:40 14:45 14:50
Time (Hr)14:55 15:00 15:05 15:10 15:15 15:20
14:25 14:30 14:35 14:40 14:45 14:50Time (Hr)
14:55 15:00 15:05 15:10 15:15 15:20
Figure 16: Load consumption and PV production.
50004000300020001000
−1000−2000−3000−4000
Time (Hr)
15:0
0
17:0
0
19:0
0
21:0
0
23:0
0
01:0
0
03:0
0
05:0
0
07:0
0
09:0
0
11:0
0
13:0
0
0
PV wattsBattery watts
Grid wattsLoad watts
Figure 17: Overview of all the parameters.
13International Journal of Photoenergy
cycles and increasing the life of storage. If due to any reason,the battery is not fully charged from solar PV, the utilitycharging could also be used. A little cost paid to utility forcharging the batteries is better to increase the life of batterybank than replacing the battery banks every year henceincreasing the cost annually. Studies show that the ideal con-trol strategy for battery storage can increase the efficiency ofbattery bank [23–25] and ultimately reduce the induced inef-ficiency [26]. In line with the elevating demand for solar PV,DC microgrid is an encouraging technique to blend distrib-uted generation, storage devices, and various types of loadmanagement and distribution techniques [27].
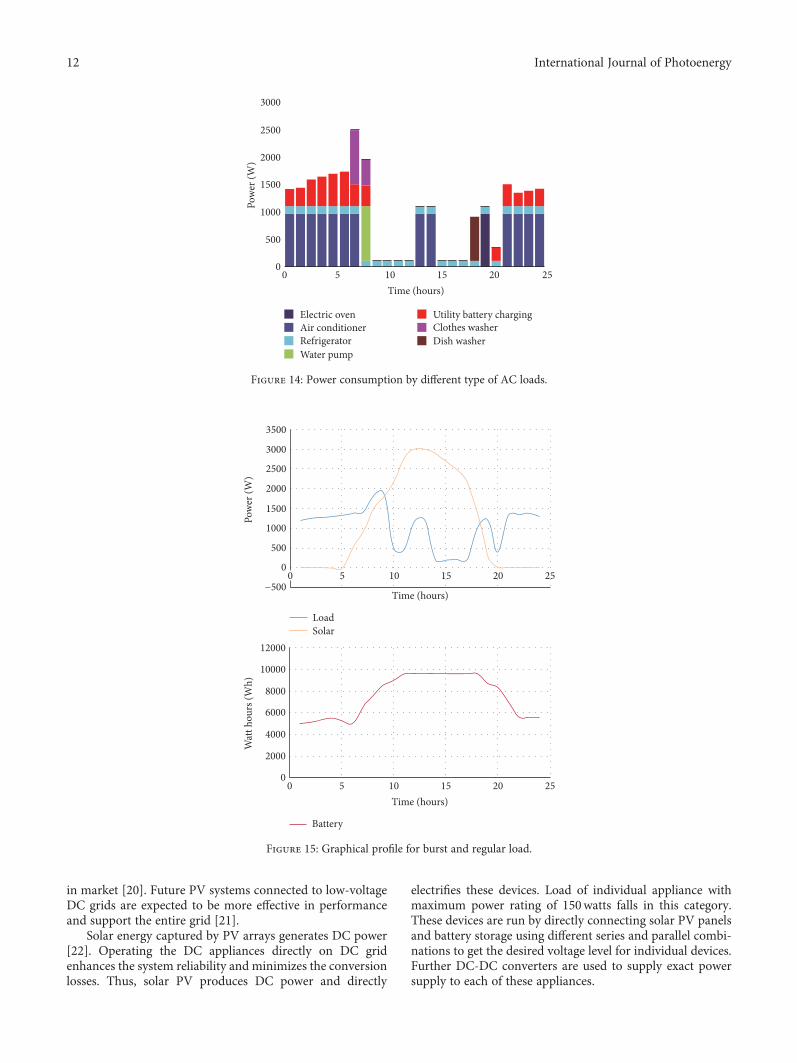
The second scenario is for the regular load and burstload. This system is grid operated as well as from solarPV based. As described above, regular load involves DCinverter technology whereas burst load involves schedulebased appliances. These appliances could be run duringopted time slots as shown in Figure 14. Power consump-tion by regular and burst load during different time slotsis shown in Figure 15.
To evaluate the results, software Viewpower 2.14 is usedto analyze the real-time data from EMS. Communication linkRS242 is used to get input data for different parameters asshown in Figures 16 and 17. As shown in Figure 16, the solarpower-based power generation during peak hours is com-pared with the load demand during the same time. It isobserved that due to maximum sunlight during this timeperiod, the PV-based generation exceeds the load demandhence various scheduled loads, for example, iron, washingmachines, and other power-consuming appliances whichmostly rely on utility, could be run at this time hence decreas-ing the utility cost along with extra charging of batterystorage at this hour.
The intelligent timing calculated for maximum usage ofPV-based power can be a big achievement in a smart house.The graph in Figure 17 explains various power generations
and loads in terms of watts. As observed, during daylight,maximum PV-based power generation occurs; hence, thedemand for utility-based power is almost negligible and thewhole system could be running entirely on the PV-based sys-tem. But, after sunset, it can be observed that the system relieseither on utility or the charged batteries during daytime byPV system. As it is observed in Figure 17 as well, the runningof high load during daytime results in a lessened demand forpower supply during the nighttime hence decreasing thedependence of the system on utility and also preventing thefull discharging of the batteries, leading to the stability andsecurity of the entire electricity system.
6. Cost Estimation
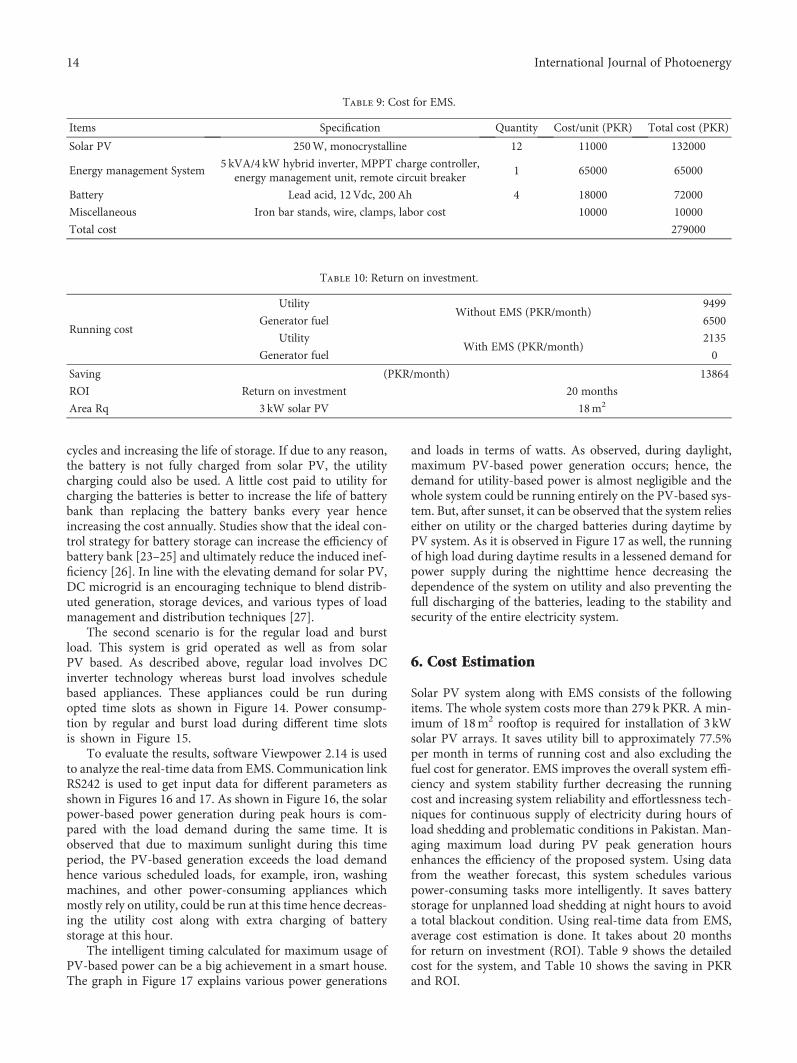
Solar PV system along with EMS consists of the followingitems. The whole system costs more than 279 k PKR. A min-imum of 18m2 rooftop is required for installation of 3 kWsolar PV arrays. It saves utility bill to approximately 77.5%per month in terms of running cost and also excluding thefuel cost for generator. EMS improves the overall system effi-ciency and system stability further decreasing the runningcost and increasing system reliability and effortlessness tech-niques for continuous supply of electricity during hours ofload shedding and problematic conditions in Pakistan. Man-aging maximum load during PV peak generation hoursenhances the efficiency of the proposed system. Using datafrom the weather forecast, this system schedules variouspower-consuming tasks more intelligently. It saves batterystorage for unplanned load shedding at night hours to avoida total blackout condition. Using real-time data from EMS,average cost estimation is done. It takes about 20 monthsfor return on investment (ROI). Table 9 shows the detailedcost for the system, and Table 10 shows the saving in PKRand ROI.
Table 9: Cost for EMS.
Items Specification Quantity Cost/unit (PKR) Total cost (PKR)
Solar PV 250W, monocrystalline 12 11000 132000
Energy management System5 kVA/4 kW hybrid inverter, MPPT charge controller,
energy management unit, remote circuit breaker1 65000 65000
Battery Lead acid, 12Vdc, 200Ah 4 18000 72000
Miscellaneous Iron bar stands, wire, clamps, labor cost 10000 10000
Total cost 279000
Table 10: Return on investment.
Running cost
UtilityWithout EMS (PKR/month)
9499
Generator fuel 6500
UtilityWith EMS (PKR/month)
2135
Generator fuel 0
Saving (PKR/month) 13864
ROI Return on investment 20 months
Area Rq 3 kW solar PV 18m2
14 International Journal of Photoenergy

The impact of EMS on the monthly electricity cost couldeasily be evaluated with the graph presented in Figure 18. Themonthly cost mentioned was obtained from system usingEMS techniques. As it can be seen that there is a radical dif-ference in the monthly cost due to the proposed system, it notonly makes the PV system more stable but also makes ithighly cost-effective. Even during the peak power usagemonths in summer, it is observed that the EMS helps in keep-ing the monthly cost to a lower and almost constant level,thereby presenting it as an ideal system for residential loads.
7. Conclusion
EMS along with solar PV distributed generation is imple-mented successfully at domestic level for a specific home sit-uated in an irregular load shedding area of Punjab, Pakistan.The mentioned techniques decrease the abrupt power shut-down during load shedding hours. Load-shifting techniquesduring peak load demand help the user to reschedule maxi-mum power-consuming tasks during hours of maximumPV generation, with a positive intention of reducing utilitytariff and generator fuel consumption. Intelligent appliancecommunicates with EMS further presenting an approachfor power scheduling at a local level. The implemented workconfirms massive reduction in terms of running cost andpeak load for both utility and users. It demonstrates the realapplication of DC-AC network with existing infrastructure.The resulted outcomes are satisfactory and implementedalong with the concept of smart grid. Also, the same strategycan be proposed and implemented to other consumers.
Conflicts of Interest
The authors declare that there is no conflict of interestregarding the publication of this paper.
References
[1] R. Batchu and M. P. Naran, “Multi-stage scheduling for asmart home with solar PV and battery energy storage,” inInnovative Smart Grid Technologies - Asia (ISGT ASIA), IEEE,pp. 1–6, Bangkok, Thailand, November 2015.
[2] Y. K. Wu, C. R. Chen, and H. A. Rahman, “A novel hybridmodel for short-term forecasting in PV power generation,”International Journal of Photoenergy, vol. 2014, Article ID569249, 9 pages, 2014.
[3] “Solar energy potential map of Pakistan,” January 2017, http://defence.pk/threads.
[4] B. Akos, “A smart home demand-side management systemconsidering solar photovoltaic generation,” in 5th Interna-tional Youth Conference on Energy (IYCE), pp. 1–5, Pisa, Italy,May 2015.
[5] C. A. Hill, M. C. Such, D. Chan, J. Gonzalez, andW. M. Grady,“Battery energy storage for enabling integration of distributedsolar power generation,” Smart Grid IEEE Transaction, vol. 3,pp. 850–857, 2012, December 2016, http://ieeexplore.ieee.org/document/6198748.
[6] D. Qinghui and C. Iun, “Improving the efficiency of solarphotovoltaic power generation in several important ways,” inInternational Technology and Innovation Conference, pp. 1–3,Xian, China, October 2009.
[7] R. Martinez, Y. Bolea, A. Grau, and H. Martinez, “FractionalDC-DC converter in solar power electrical generation system,”in In the Proceeding of IEEE Conference on Emerging Technol-ogies & Factory Automation, pp. 1–6, Palma de Mallorca,Spain, September 2009.
[8] T. Harakawa and T. Tujimoto, “A proposal of efficiencyimprovement with solar power generation system,” in In theProceeding of 21 Annual Conference of IEEE IndustrialElectronics Society, pp. 523–528, Denver, CO, USA, November2001.
[9] F. Liu, Y. Zhang, and S. Duan, “Comparison of P&O and hillclimbing MPPT methods for grid-connected PV converter,”in International conference Industrial Electronics and Applica-tions ICIEA, pp. 804–807, Singapore, June 2008.
15000
9000
6000
3000
Jan Feb Mar Apr May Jun Jul Aug Sep Oct Nov DecMonths
Elec
tric
ity b
ill (R
s)
W/o energy management systemWith energy management system
Figure 18: The impact of EMS on the monthly electricity cost.
15International Journal of Photoenergy

[10] R. G. Lee, H. Bae, and B. H. Cho, “Advanced incrementalconductance MPPT algorithm with a variable step size,” in12th International Power Electronics and Motion Control Con-ference, pp. 603–607, Ljubljana, Slovenia, August-September2006.
[11] R. G. Yadav, R. Anjan, S. A. Kharparde, and P. Pentayya,“India’s fast-growing power sector-from regional developmentto the growth of a national grid,” IEEE Power and EnergyMagazine, vol. 3, pp. 39–48, 2005, December 2016, http://ieeexplore.ieee.org/document/1458229.
[12] P. Kumar and S. Singh, “Reconfiguration of radial distributionsystem with static load models for loss minimization,” in In theProceeding of IEEE International Conference on PowerElectronics Drives and Energy Systems (PEDES), pp. 1–5,Bombay, India, December 2014.
[13] I. Ali, M. S. Thomas, and P. Kumar, “Energy efficient reconfig-uration for practical load combinations in distributionsystems,” lET Generation, Transmission and Distribution,vol. 9, pp. 1051–1060, 2015, http://ieeexplore.ieee.org/document/7173384.
[14] I. Ali, M. S. Thomas, and P. Kumar, “Effect of loading patternon the performance of reconfigured medium size distributionsystem,” in Proceeding of fifth IEEE Power India Conference,pp. 1–6, India, December 2012.
[15] S. Rauf, S. Rasool, M. Rizwan, M. Yousaf, and N. Khan,“Domestic electrical load management using smart grid,” in3rd International Conference on Power and Energy SystemsEngineering CPESE, pp. 1–8, Kitakyushu, Japan, September2016.
[16] “Comparison of DC inverter vs non-inverter technology,”January 2017, http://www.morenews.pk/dc-inverter.
[17] M. J. Sarker, B. Asare-Bediako, J. G. Slootweg, W. L. Kling, andB. Alipuria, “DC micro-grid with distributed generation forrural electrification,” in 47th International Universities PowerEngineering Conference (UPEC), pp. 1–6, Brunel, UnitedKingdom, September 2012.
[18] T. Kaipia, “Impact of low voltage DC system on reliability ofelectricity distribution,” in 20th International Conference andExhibition on Electricity Distribution, pp. 1–4, Prague, June2009.
[19] T. Shibata,K. Sakai, andY.Okabe, “Design and implementationof an on-demandDC grid in home,” in IEEE/IPSJ InternationalSymposium on Applications and the Internet, pp. 152–159,Munich, July 2011.
[20] M. Ton, B. Fortenbery, and W. Tschudi, “DC power forimproved data center efficiency,” Lawrence Berkeley NationalLaboratory Report U.S. Department of Energy, WA, USA,2007.
[21] M. Saeedifard, M. Graovac, R. F. Dias, and R. Iravani, “DCpower systems: challenges and opportunities,” in IEEE PowerEngineering Society General Meeting, pp. 1–7, Providence, RI,USA, 2010.
[22] Y. Yang and F. Blaabjerg, “Low-voltage ride-through capabilityof a single-stage single-phase photovoltaic system connectedto the low-voltage grid,” International Journal of Photoenergy,vol. 2013, Article ID 257487, 9 pages, 2013.
[23] J. Marcos, O. Storkël, L. Marroyo, M. Garcia, and E. Lorenzo,“Storage requirements for PV power ramp-rate control,” SolarEnergy, vol. 99, pp. 28–35, 2014.
[24] I. De la Parra, J. Marcos, M. García, and L. Marroyo, “Controlstrategies to use the minimum energy storage requirement forPV power ramp-rate control,” Solar Energy, vol. 111, pp. 332–343, 2015.
[25] J. Marcos, I. de la Parra, M. García, and L. Marroyo, “Controlstrategies to smooth short-term power fluctuations in largephotovoltaic plants using battery storage systems,” Energies,vol. 7, no. 10, pp. 6593–6619, 2014.
[26] C. Rus-Casas, J. D. Aguilar, P. Rodrigo, F. Almonacid, andP. J. Pérez-Higueras, “Classification of methods for annualenergy harvesting calculations of photovoltaic generators,”Energy Conversionand Management, vol. 78, pp. 527–536,2014.
[27] M. Sechilariu, F. Locment, and B. Wang, “Photovoltaicelectricity for sustainable building. Efficiency and energy costreduction for isolated DC microgrid,” Energies, vol. 8,pp. 7945–7967, 2015.
16 International Journal of Photoenergy

Submit your manuscripts athttps://www.hindawi.com
Hindawi Publishing Corporationhttp://www.hindawi.com Volume 2014
Inorganic ChemistryInternational Journal of
Hindawi Publishing Corporation http://www.hindawi.com Volume 201
International Journal ofInternational Journal ofPhotoenergy
Hindawi Publishing Corporationhttp://www.hindawi.com Volume 2014
Carbohydrate Chemistry
International Journal ofInternational Journal of
Hindawi Publishing Corporationhttp://www.hindawi.com Volume 2014
Journal of
Chemistry
Hindawi Publishing Corporationhttp://www.hindawi.com Volume 2014
Advances in
Physical Chemistry
Hindawi Publishing Corporationhttp://www.hindawi.com
Analytical Methods in Chemistry
Journal of
Volume 2014
Bioinorganic Chemistry and ApplicationsHindawi Publishing Corporationhttp://www.hindawi.com Volume 2014
SpectroscopyInternational Journal of
Hindawi Publishing Corporationhttp://www.hindawi.com Volume 2014
The Scientific World JournalHindawi Publishing Corporation http://www.hindawi.com Volume 2014
Medicinal ChemistryInternational Journal of
Hindawi Publishing Corporationhttp://www.hindawi.com Volume 2014
Chromatography Research International
Hindawi Publishing Corporationhttp://www.hindawi.com Volume 2014
Applied ChemistryJournal of
Hindawi Publishing Corporationhttp://www.hindawi.com Volume 2014
Hindawi Publishing Corporationhttp://www.hindawi.com Volume 2014
Theoretical ChemistryJournal of
Hindawi Publishing Corporationhttp://www.hindawi.com Volume 2014
Journal of
Spectroscopy
Analytical ChemistryInternational Journal of
Hindawi Publishing Corporationhttp://www.hindawi.com Volume 2014
Journal of
Hindawi Publishing Corporationhttp://www.hindawi.com Volume 2014
Quantum Chemistry
Hindawi Publishing Corporationhttp://www.hindawi.com Volume 2014
Organic Chemistry International
ElectrochemistryInternational Journal of
Hindawi Publishing Corporation http://www.hindawi.com Volume 2014
Hindawi Publishing Corporationhttp://www.hindawi.com Volume 2014
CatalystsJournal of


![Design of Grid-Connected Photovoltaic System · weight of photovoltaic system [7]. The grid[6] -connected photovoltaic systems also need the inverters for power conversion, grid interconnection](https://img.pdfslide.us/doc/110x75/5fba0adb999fbb3bbe303c6e/design-of-grid-connected-photovoltaic-system-weight-of-photovoltaic-system-7.jpg)