Embed Size (px)
Citation preview
Application of Conjoint Analysis to the Fuzzy Front End of a Product Design: A Case Study of the Indian Auto Industry
THESIS
Submitted in partial fulfilment
of the requirements for the degree of
DOCTOR OF PHILOSOPHY
by
THOMAS JOSEPH
Under the supervision of
Dr. Kesavan Chandrasekaran
BIRLA INSTITUTE OF TECHNOLOGY AND SCIENCE PILANI (RAJASTHAN) INDIA
2013

ii
BIRLA INSTITUTE OF TECHNOLOGY AND SCIENCE
PILANI (RAJASTHAN)
CERTIFICATE
This is to certify that the thesis entitled “Application of Conjoint Analysis
to the Fuzzy Front End of a Product Design: A Case Study of the Indian
Auto Industry” and submitted by THOMAS JOSEPH ID No
2005PHXF404P for award of Ph.D. of the Institute embodies original work
done by him under my supervision.
Signature of the Supervisor
Dr. KESAVAN CHANDRASEKARAN
DEAN, R.M.K. Engineering College
Kavaraipettai, Chennai: 601206
Date: 27-October-2013

iii
ABSTRACT
New products that deliver added consumer value contribute significantly
to the success of companies. In the numerous studies of new product performance
over the years, consensus has been developed that the understanding of consumer
needs is of paramount strategic value, especially in the early stages of the product
development process. During these early stages, the product has not yet been
specified and the aim is to search for novel product ideas from a marketing and
technological perspective. Despite their importance, several studies indicate that
consumer research methodologies are underutilised in the early stages of new
product development. The aim of this thesis is to analyse key issues and
develop and illustrate appropriate use of consumer research methodology at early
stages of the new product development process, as the most distinguishing
characteristic of a successful product development project.
Consumer research can be confirmative in its focus of testing new product
concepts before launch and in this way prevents unjustified investments. Consumer
research can also be proactive in that it aims to identify new product ideas that
deliver against consumer needs that are not yet fulfilled by products currently
in the market. Successful new product development requires a balance between
both types of consumer research. The research in this thesis focuses on evaluating
the most desirable consumer research tool so that the VoC (Voice of the customer)
is appropriately and completely captured and translated into the VoD (Voice of the
Designer), early in the product design stage. Conjoint Analysis is hitherto used in
iv
social science studies for assessing behaviours. Conjoint analysis, as the name
indicates, ‘CON’siders all the attributes ‘JOINT’ly in a statistical manner. Quality
Function Deployment (QFD) is a planning tool developed by engineers. It is used to
assure that the voice of the customer is heard all the way throughout a company in
order to manufacture products with high customer satisfaction. The research aims to
combine a marketing based tool like Conjoint Analysis and an engineering based
tool like QFD, for a successful product development, by applying it to the ‘fuzzy
front end’ of the product design. The dissertation is written from an engineering
perspective and the focus has thus been on the application of Conjoint Analysis for
engineering a new product. It includes a live case study of an Indian engineering
company, which experiences a new product failure. There is an immediate need for
a re-design. This re-design was initiated with the capturing of the VoC and finally
translating it into the product design by using Conjoint Analysis followed by QFD.
The thesis suggests the use of Minitab software for the application of Conjoint
Analysis. The Optimiser feature of the Minitab software ensures that, the Designer
is able to assess all the customer desired variables of the design simultaneously and
choose a design that is optimal. The re-engineered product is launched successfully,
validating the hypothesis that, application of Conjoint Analysis to the fuzzy front
end of the product design, would lead to a commercially successful product
development.
In the Chapter 1, the importance of new product development is presented
and key factors of success and failure are discussed. Specially, the need for
consumer research in the early stages is considered and criteria for effective
strategic consumer research are outlined.
v
In Chapter 2, ten frequently used methods and techniques to uncover
unmet consumer needs and wants are critically reviewed.
Chapter 3 presents the detailed background of Conjoint Analysis and the
methodology of launching Conjoint analysis using a flow chart for decision making,
at every stage of its deployment.
In Chapter 4 the research methodology adopted for the case study has
been described. It details the target population, selection of the sample size and the
method of capturing the VoC. The chapter lists the activities that would culminate in
translating the VoC into VoD.
Chapter 5 details the case-study and the step by step use of the Minitab
software for the application of Conjoint Analysis for the redesign of the subject
product Viz: a hydraulic sub-system, which had failed in the market, during its
initial launch. The Conjoint part-worth equation is arrived at, for an optimal design.
In this chapter, the surface plots, contour plot, cube plot, main effect diagram and
interaction effect diagrams are generated and evaluated, for an educated engineering
design decision. The graphical and visual nature of the report helps the engineer
exercise better design judgement.
The optimiser feature of Minitab demonstrates an intuitive and interactive,
simultaneous simulation of the five factors, each at two levels to arrive at the
targeted design. The detailed interpretation of each stage output of Minitab is
explained. The statistical feature of Minitab is brought to the fore and its use for an
objective design judgement is established. In addition to the statistical criteria, this
study explicitly takes the end-user perspective for the product design.

vi
Chapter 6 discusses the results from the initiation of the VoC gathering to
its funnelling through the Focus group to arrive at the key Attributes and Levels.
The processing of the Attributes and Levels through the House of Quality is
summarised and the output has been depicted pictorially. The Minitab utilised
application of Conjoint Analysis result, is summarised and discussed.
Chapter 7 summarizes the thesis and explains the scope and the limitation
of this study. It lists the contributions made by this work and recommends future
research possibilities, using the statistical tool of Conjoint analysis.
Overall, the results of this thesis contributes to the better recognition of
the importance of consumer research in the early stages of new product
development, presents a methodology that helps to answer the ‘How?’ to listen to
VoC and translate to VoD, bridges the great divide between R&D and Marketing
functions in an organisation by providing a common language of statistics, which is
well understood, appreciated and diffusible to the stakeholders. The study suggests
the application of Conjoint Analysis for NPD, using Minitab which is widely
available in medium and large manufacturing companies for a repeatable,
predictable and consistent market place success of a new product, thus re-instating
the kingship to the customer!

vii
ACKNOWLEDGEMENTS
“Every day I remind myself that my inner and outer life is based on the labours of
other men, living and dead, and that I must exert myself in order to give in the
same measure as I have received and am still receiving.”-Albert Einstein
I am grateful to my Lord Jesus Christ, Vailankanni Matha and the Holy
Spirit, for giving me the desire to pursue, this dream, then nourishing and guiding
me, till it became a reality.
Dr. Kesavan Chandrasekaran, my guide, is a scholar of few but profound
words; he was patient with me, as I balanced a high profile job, a growing family
and this scholarly pursuit. He stood by me and never gave up on me. It is his faith in
me, which has brought me, to this juncture, with stamina for more.
I cannot forget my batch mate, Dr Pronobesh Chattopadhyay, who started
off with me, in this academic pursuit, but sped off, very fast, so that he could be an
inspiration for me.
My heart-felt thanks to Dr. N. Anbuchezhian, who re-energised me, and
prodded me to go on, when I was having some serious self-doubts.
Many players come at various junctures, in this difficult journey which one
has to transcend alone, but all with a purpose. Dr. V. Kumar is one such soul. He
was instrumental in advising me on the art of writing the thesis.
I wish to thank Dr. S. Balasubramanian, for his scholarly advice.
I was inspired to pursue my Ph.D. due to my association with my former
boss Dr. David Jacobs and my colleague Dr. Graham Gest. Thank you so much,
for igniting the spark, more than a decade ago.

viii
There are many, other friends, relatives, teachers, colleagues, and co-workers
who have contributed directly or indirectly, in this magnum opus, of my life. I pray
to god for them and thank them, with honesty and humility.
I acknowledge the consistent support from Anand John Edward,
Kijaynath Kimis, Subash. P and Dr. Annie Jacob. I could not have accomplished
this arduous task, without them.
I wish to thank BITS Pilani especially Dr. S.K. Verma, Dean, ARD,
Dr. M.S. Dasgupta, Chief, Placement Unit, and DAC Convener Dr. Kuldip Singh
Sangwan, Head of Mechanical Engineering Department and DAC member,
Dr. Hemant Jadhav, Professor In-charge, Academic Research (Ph.D. Program)
Division, BITS, Pilani, Dr. Navin Singh, Nucleus Member, ARD, Dr. Sharad
Shrivastava, Nucleus member, RCD, Dr. Bijay K. Rout, Coordinator, Centre for
Robotics and Intelligent Systems and Dr Manoj Soni, Coordinator, WILPD. I
thank Dr. Monica Sharma, Asst. Prof. MNIT, Jaipur, for her help and support
during the initial stages of the Ph.D. program.
My father always wanted me to graduate from the legendary BITS, Pilani.
With this thesis, I have made him proud. He stood by me, like a rock in these trying
times. My mother’s prayers have been unceasing for this success. I am indeed
grateful for having been born to them. I thank my brother John, for his special and
divine support.
My wife Bindi has perhaps faced the maximum brunt of my Ph.D. There
have been missed walks, movies, marriages, restaurants and functions. She has
endured all these patiently. Her powerful prayers, propelled me into action, when
there have been weak moments, bearing the burden of the Ph.D. journey. I thank her
profusely and promise her, that this will be my first and last Thesis!
My children, Evita Joseph, who would soon be Dr. Evita Joseph and my
son, Reuben Joseph, both challenged me, to complete my doctorate, before their

ix
doctoral degrees. I thank them for putting up with me, when I did not behave like a
father, in my obsession with CONJOINT ANALYSIS.
Lastly, I thank the management of my workplace, for permitting me to carry
out the research and having provided managerial and moral support, in this journey.
All is well that ends well and so it is, when this journey is coming to its
logical conclusion. I thank BITS, Pilani and its management for all the support and
guidance, which has made this exercise worthwhile and enriching.
THOMAS JOSEPH

x
DEDICATION
This thesis is dedicated to my dear uncle late Dr. Irudaya Rajan, a surgeon
par-excellence and a noble soul, who left us 4 years ago. He was an inspiration for
me during his life time and continues to be one, in his after life.

xi
TABLE OF CONTENTS
CHAPTER NO. TITLE PAGE NO.
ABSTRACT iii
LIST OF TABLES xvi
LIST OF FIGURES xvii
LIST OF ABBREVIATIONS xx
1 INTRODUCTION 1
1.1 MOTIVATION FOR THE RESEARCH 1
1.2 BRIEF OUTLINE OF THE NPD PROCESS 4
1.3 IMPORTANCE OF NPD 6
1.4 NPD AND INNOVATION 8
1.5 NPD SUCCESS AT THE PRODUCT,
STRATEGY AND PROCESS LEVEL 10
1.5.1 Product Characteristics 11
1.5.2 Strategy Characteristics 11
1.5.3 Process Characteristics 12
1.6 ROLE AND IMPORTANCE OF CONSUMER
RESEARCH FOR OPPORTUNITY
IDENTIFICATION IN NPD 15
1.7 CAUSES FOR NON-USE OF CONSUMER
RESEARCH IN OPPORTUNITY
IDENTIFICATION 17
1.7.1 Consumer Research Lacks Credibility 17
1.7.2 Consumer Research does not Help in
Coming up with Innovative Product Ideas 18
1.7.3 Consumer Research delays Product
Development Process 19

xii
CHAPTER NO. TITLE PAGE NO.
1.7.4 Consumer Research Lacks Comprehensibility 19
1.7.5 Consumer Research Lacks
Actionability for R&D 19
1.8 REQUIREMENTS FOR EFFECTIVE
CONSUMER RESEARCH FOR OPPRTUNITY
IDENTIFICATION OF NPD 20
1.9 AIM AND SCOPE OF THIS THESIS 23
1.91 Summary- Structure of the Thesis 24
2 LITERATURE REVIEW 26
2.1 INTRODUCTION 26
2.2 SUCCESSFUL NPD AND
CONSUMER RESEARCH 26
2.3 VoC- VOICE OF THE CUSTOMER 27
2.4 CONSUMER RESEARCH METHODS 28
2.5 CATEGORISATION OF CONSUMER
RESEARCH METHODS 30
2.5.1 Information Source for Need Elicitation 31
2.5.2 Product versus Need-driven methods 31
2.5.3 Familiarity 33
2.5.4 Task Format of Method/ Technique 33
2.5.5 Evaluating Multiple Products
Versus Single products 34
2.5.6 Response Types 34
2.5.7 Self -Articulated or Individually
Derived Consumer Needs 35
2.5.8 Structure of Data Collection 37
2.5.9 Actionability of Output 38
2.5.10 Actionability for Technical
Product Development 39

xiii
CHAPTER NO. TITLE PAGE NO.
2.5.11 Actionability for Market Oriented Tasks 39
2.6 REVIEW OF METHODS AND TECHNIQUES 40
2.7 IMPLICATION OF RESEARCH
METHODS ON NPD 50
2.8 SUMMARY 50
2.9 RESEARCH GAP 53
3 CONJOINT ANALYSIS 54
3.1 INTRODUCTION 54
3.2 CONCEPT OF CONJOINT 55
3.3 THE VALUE OF CONJOINT ANALYSIS
IN CONSUMER RESEARCH 56
3.4 KEY STEPS WHEN DESIGNING
A CONJOINT VALUE SYSTEM 57
3.5 SUMMARY 60
4 RESEARCH METHODOLOGY 61
4.1 INTRODUCTION 61
4.2 COMPANY OVERVIEW 61
4.3 PRODUCT AND CASE DETAILS 64
4.4 CAPTURING THE VoC- VOICE
OF THE CUSTOMER 65
4.4.1 Study Area 66
4.4.2 Research Design 66
4.4.3 Instrument Development 66
4.4.4 Type of Population 66
4.4.5 Sampling Unit 66
4.4.6 Population Parameter 67
4.4.7 Sample Size Determination 67
4.4.8 Questionnaire & Scale Development 67

xiv
CHAPTER NO. TITLE PAGE NO.
4.4.9 Analytical Tools Adopted for Study 68
4.5 FOCUS GROUP 68
4.5.1 Purpose 69
4.5.2 Sampling 69
4.5.3 Facilitation 69
4.5.4 Analysis 70
4.5.5 Reporting 70
4.6 APPLICATION OF CONJOINT ANALYSIS 70
4.6.1 Which Conjoint Method to be used? 71
4.6.2 Choosing the Attributes and Levels 71
4.6.3 Conducting the Conjoint Experiment 72
4.7 VoC TRANSLATION USING QUALITY
FUNCTION DEPLOYMENT (QFD) 73
4.8 SUMMARY 74
5 CASE STUDY: APPLICATION OF CONJOINT
ANALYSIS TO THE FUZZY FRONT END OF
THE PRODUCT DESIGN 75
5.1 INTRODUCTION 75
5.2 CAPTURING THE VoC & APPLICATION OF
CONJOINT ANALYSIS DURING THE FFE STAGE 76
5.3 CASE STUDY 77
5.3.1 Capturing the VoC-Voice of the Customer 78
5.3.2 Drill down the VoC as per the Rank Order
using the Focus Group 78
5.3.3 Define the Levels for the Five
Top ranked Attributes 81
5.3.4 Create the full factorial Conjoint
experiment using Minitab 81
5.3.5 Statistical Terms and their Interpretations 91

xv
CHAPTER NO. TITLE PAGE NO.
5.3.6 Conjoint Part-worth Equation 93 5.3.7 Creating the Contour and Surface Plots 99 5.3.8 Main Effect Plot for Ranking 105 5.3.9 Interactions Effect Plot for Ranking 108 5.3.10 Cube Plots 111 5.3.11 Optimisation Plot 118 5.4 APPLICATION OF QFD (Quality Function Deployment) 121 5.5 CASE STUDY SUMMARY 123
6 RESULTS AND DISCUSSIONS 125 6.1 INTRODUCTION 125 6.2 CASE STUDY BACKGROUND 125 6.2.1 Importance of Capturing the VoC Directly 127 6.2.2 Conjoint Analysis an Objective Statistical Tool for NPD 128 6.3 RESULTS FROM THE RESEARCH & THE CASE 135 6.4 DISCUSSIONS 137 6.5 SUMMARY 138
7 CONCLUSIONS AND RECOMMENDATIONS FOR FUTURE WORK 140 7.1 INTRODUCTION 140 7.2 CONCLUSIONS 140 7.3 CONTRIBUTIONS OF THIS RESEARCH 142 7.4 LIMITATIONS 143 7.5 RECOMMENDATIONS FOR FUTURE WORK 144 7.6 SUMMARY 144
REFERENCE LIST 147
LIST OF PUBLICATIONS 163
BIOGRAPHY OF SCHOLAR 164
BIOGRAPHY OF SUPERVISOR 165

xvi
LIST OF TABLES
TABLE NO. TITLE PAGE NO.
2.1 Classification criteria for consumer research methods 31
2.2 Emphatic design – Summary 40
2.3 Focus group – Summary 41
2.4 Free elicitation – Summary 41
2.5 Information acceleration – Summary 42
2.6 Kelly reportory grid – Summary 42
2.7 Laddering – Summary 43
2.8 Lead user technique – Summary 44
2.9 Zaltman metaphor elicitation technique – Summary 45
2.10 Category appraisal – Summary 46
2.11 Conjoint analysis – Summary 47
2.12 Utility summary – Consumer research methods 48
2.13 Assessment summary of the ten consumer research
methods 52
5.1 Multi-voting summary table to arrive at the Conjoint
attributes 80
5.2 Customer attributes and their levels 81
5.3 The 32 combinations experimental run order 86
5.4 Ranked design along with estimated cost 87
5.5 QFD-translation of customer’s voice into design
characteristics
122
6.1 Ranked design combinations in descending order 129
xvii
LIST OF FIGURES
FIGURE NO. TITLE PAGE NO.
1.1 Factors for a Successful NPD 2
1.2 Design Time and Product Cost Freeze 3
1.3 Ease of Design Change and cost of Design
Change with Respect to Time 4
1.4 Current and Needed Focus on NPD based on
Current Problems and Products Solutions 8
1.5 Product and Innovation Type based on Changes in
Consumer Behaviour 9
1.6 Stage-gate Process for NPD 13
1.7 Fuzzy Front End of the NPD Process 14
3.1 Decision Tree for Conjoint Analysis 58
3.2 Stages of Conjoint Analysis 59
4.1 Truck with Hydraulic System in Action 62
4.2 Schematic Showing the 3 Levels of Customers 63
4.3 Hydraulic Schematic of a Truck with Tipping System 63
4.4 QFD “The House of Quality” 74
5.1 Traditional Stage of VoC Capturing 76
5.2 Application of Conjoint analysis at the
Pre-design Stage 77
5.3 Factorial Design 82
5.4 Creation of Factorial Design 83
5.5 Specifying Factors and Levels 83
5.6 Plackett-Burman Factorial Designs 84
5.7 Attributes and Levels Data 85
5.8 Experimental Run Order Creation 85
5.9 Initiating Conjoint Analysis 88
xviii
FIGURE NO. TITLE PAGE NO.
5.10 Attributes Selection 88
5.11 Values of Levels Confirmation 89
5.12 Initiating the Response Surface Analysis 89
5.13 Enabling Response Function Selection 90
5.14 Enabling the Four-in-one Graph 90
5.15 Conjoint Part Worth Equation with Rank as a Criteria 93
5.16 ANOVA Table 95
5.17 Residual and the Fitted Values with Ranking as a
Response 98
5.18 Initiating Contour and Surface Plots Generation 100
5.19 Contour and Surface Plots Selection 100
5.20 Initiating Set up of Contour and Surface Plots 101
5.21 Surface Plot for Ranking 102
5.22 Contour Plot for the Ranking 103
5.23 Selection for Factorial Plots 104
5.24 Selection for Main Effect, Interaction Effect
and Cube Plots 104
5.25 Selection of Factors and Response for Studying the
Interaction Effects 105
5.26 Main Effect Plot for the Ranking 107
5.27 Interaction Plot for the Ranking 109
5.28 Cube Plot for Ranking 112
5.29 Initiating Design Optimisation 115
5.30 Response for Optimisation Selection 115
5.31 Goal seek for Optimisation using Two Responses 116
5.32 Goal Setting for Optimisation 116
5.33 Optimal Design Parameter for the Targeted Goal 117
5.34 Mathematical Model for the Simulation of the Design 119
5.35 QFD house of Quality – A Frame Work 121

xix
FIGURE NO. TITLE PAGE NO.
5.36
Schematic Depiction of the Hydraulic Telescopic
Ram’s (cylinders) Multiple Stages 122
6.1 Conjoint Part-worth Equation Coefficients 130
6.2 Surface, Contour, Main Effect and Cube Plots 132
6.3 Interaction Effect Plot for Ranking 133
6.4 Optimal Design Output using the Optimiser 134
6.5 Frame Work- Application of Conjoint Analysis to
Product Development 138
7.1 Market Share Movement of Companies, before and
after Conjoint Analysis Driven NPD 145

xx
LIST OF SYMBOLS, ABBREVIATIONS OR NOMENCLATURE
Adj SS - Adjusted sum of squares
ANOVA - Analysis of variance
CA - Conjoint Analysis
CBC - Choice based conjoint
CD - Compact Disc
Coeff - Coefficients
CVA - Conjoint value analysis
D - Desirability index- Ideal is 1.
DF - Degree of freedom
DOE - Design of experiment
FET - Front end tipping
FMCG - Fast moving consumer goods
FY12 - Financial year 12 (1-Apr-11 to 31-Mar-12)
HVM - Hierarchical Value Maps
IA - Information acceleration
Import - Importance
INR - Indian National Rupee
NGT - Nominal group technique
NPD - New Product development
OEM - Original equipment manufacturer
p - Probability that the null hypothesis is true
PTO - Power transfer output
QFD - Quality function deployment
R&D - Research and Development
R2 - Amount of variation in the observed response values
R2-(adjusted) - Amount of variation adjusted for the number of terms in
the model
S - Standard deviation

xxi
SE Coeff - Sum of error coefficients
Seq SS - Sequential sum of squares
SPSS - Statistical package for social studies
STAT - Statistics
T - Test statistic
UBT - Underbody tipping
VoC - Voice of the customer
VoD - Voice of the Designer
ZMET - Zaltman metaphor elicitation technique
- Level of Significant
1
CHAPTER 1
INTRODUCTION
“Seeking customer input and feedback is a vital and on-going activity throughout
development, both to ensure that the product is right and also to speed
development towards a correctly defined target”- Robert G. Cooper
1.1 MOTIVATION FOR THE RESEARCH
Incorporating the ‘voice of the consumer’ (VoC) in the early stages of a
New Product Development (NPD) process has been identified as a critical success
factor for a new product launch (Bjork & Magnusson, 2009). Yet, this step is often
either ignored or, poorly executed. There are enough literature on ‘why’ new
products fail (Henard & Szymanski, 2001) and also ‘How’ NPD could be made
successful (Dubiel & Ernst, 2012), but the NPD performance continues to be poor,
which perhaps points to an ineffective execution of the entire product development
process. As a result, a lot of money is lost and companies lose their competitive
edge. This leaves them behind in the race for growth and prosperity.
Therefore, there was a strong motivation to develop an effective but
simple methodology to capture the VoC and translate it into the early design stage
also called as the Fuzzy Front End (FFE), due to the abstractness of this stage, to
ensure a repeatable new product success. The thesis attempts to demonstrate this
using a live case study in the Indian auto industry, by using Conjoint Analysis to
transform the captured VoC, into the Voice of the designer (VoD), right at the FFE,
for a successful product development. Using this methodology, every product could
be built with customer determined features and launched to record sales and market
share. This would help the companies to generate profit and help the customers’
achieve total satisfaction. In short, it would be a win-win situation for all.

2
The NPD failure may be due to lack of familiarity with the various VoC
methods available or the lack of understanding of a structured approach to product
development. The thesis attempts to illustrate the benefits of capturing the VoC
early during the product development life-cycle and funnelling it into the drawing
board, using a case study, which demonstrates the application of a statistical
technique named CONJOINT ANALYSIS to the FFE of a product design,
incorporating the VoC inputs. Figure: 1.1 depicts that for the success of a new
product there must be perfect co-ordination between Research and Development
(R&D), Marketing and Manufacturing.
Figure 1.1 Factors for a Successful NPD (Anthony Di Benedetto, 1999)
Many studies on the cost of production have shown that maximum
costs are largely determined during the design phase of the products. Perrin, (2001)
proposes an average trend of the costs incurred throughout the different phases of
the life cycle of a product before mass production (refer Figure: 1.2). The design
activity accounts for 15% of the time spent, but by this time freezes 75% of the total
product cost. This clearly shows that the ‘committed cost’ in a product is very high,
in the early stage of NPD.

3
Figure 1.2 Design Time and Product Cost Freeze (Perrin, 2001)
There are two more important points for stressing the criticality of an
appropriate design freeze, at the FFE stage of NPD, as shown below in Figure: 1.3:
A) In the early stages, there is more possibility of revising a design.
B) In the early stages, the costs of such design revisions are cheaper.
Design Cost
Design time

4
Figure 1.3 Ease of Design Change and Cost of Design Change with Respect
to Time (Perrin, 2001)
It is this cost and time which must be secured, by making every product
truly successful at FFE stage. This research aims at resolving this in an objective
manner by linking Marketing research and Product design, through a consumer
research methodology which has been largely used for social studies.
1.2 BRIEF OUTLINE OF THE NEW PRODUCT DEVELOPMENT
(NPD) PROCESS
Companies must develop new products to grow and stay competitive, but
innovation is risky and costly. A great majority of the new products never makes it
to the market and those new products that enter the market place face very high
failure rates. Exact figures are hard to find and vary depending on the type of market
(industrial versus consumer) and product (high tech versus fast moving consumer
goods). Moreover, different criteria for the definition of success and failure make it
complicated to compare. However, failure rates have remained high over the
previous decades, averaging 40% (Barczak, Griffin & Kahn, 2009; Adams, 2010;
5
Burkitt & Bruno, 2010). The NPD performance in the past, was also as bad.
According to Crawford (1987), the average failure rate was around 35%. Later,
Cooper (1994), a leading researcher in the field of NPD, estimated a failure rate in
the order of 25-45%. He devised the Stage-Gate process to bring out a structured
and disciplined NPD process (Cooper, 2008). A more recent study of Nielsen (2010)
showed that out of 24,000 new products only half survived their first year in the
market. It is evident that the governance of NPD, its associated processes and the
methods are also key to ensure a successful development (Steven, 2013).
Since the 1990s it became apparent that the high failure rates of new
products justified research to examine the reasons for success and failure. Prior to
the 1990s the development of new products was considered a technologically linear
process. New technologies and a proactive R&D effort were believed to drive
the success of products that were created (Poolton & Barclay, 1998). Later on it
became clear that other factors like accurate forecasting of a new product need
(Kahn, 2011) also played a role. The first studies on NPD performance showed that
the market place played a major role in stimulating the need for new and
improved products. Ever since the pioneering studies of Booz and Hamilton
(1968), the success and failure of new products has been studied intensively.
Much has been written about the most appropriate NPD practices, which can lead to
the product’s market place success. Success depends, among other factors, on the
degree to which the new product effectively addresses identified consumer
needs and, at the same time, exceeds competitive products. Unfortunately, although
past research on NPD performance has shown that even the slightest improvements
in an organisation’s NPD process could yield significant savings (Montoya-Weiss
& O’Driscoll, 2000), bringing successful new products to the market is still a
major problem for many companies. Despite increasing attention to NPD, the new
product success rate has improved only marginally (Wheelwright, 2010). As per
Cooper and Edgett (2008) “Studies reveal that the art of product development has
not improved all that much. That, the voice of the customer (VoC) is still missing,
that, solid up-front homework is not done, that, many products enter the
development phase lacking clear definition”.

6
The key learning emerging from NPD performance analysis is that
success is primarily determined by a unique and superior product and that the
achievement of which is primarily driven by the effective marketing-R&D
interfacing at the very early stages of the NPD process (opportunity identification).
Hence, the paradox here is that despite a good understanding of failure reasons
(at strategy, process and product level), a high proportion of new products continues
to fail. One reason for this may be that factors of success and failure have not been
translated into meaningful guidelines for action. Consequently, companies still have
problems with effectively and efficiently implementing the factors of success into
NPD practice. Consumer research at the earliest stages of NPD that helps
bridge marketing and R&D functions is crucial in this process. Miller and
Swaddling (2002) argue that the shortcomings in the current state of NPD practice
can be directly or indirectly tied with consumer research (or the lack of it) done in
conjunction with NPD. As this appears a major bottle neck, this thesis aims at
developing and illustrating consumer research methods at the Marketing and R&D
interface, which is repeatable and hence would guarantee the success of every NPD.
In what follows, the importance of NPD for the continued growth and
health of companies is discussed. Next, data concerning success and failure in NPD
is reviewed. After that, the role and importance of consumer research in the NPD
process, both at the early stages (consumer research for inspiration and focus) and at
the later stages (consumer research for verification), is discussed. Specifically, the
need for consumer research in the early stages is considered and then the detailed
criteria for effective strategic consumer research, is discussed. Finally, this chapter
ends with the definition of the aim, focus and outline of this thesis.
1.3 IMPORTANCE OF NPD
New products that deliver added consumer value contribute significantly
to the success of companies. The NPD is generally recognised as the basis for
profitability and growth of most companies. Additionally, innovation practiced by
companies has a positive impact on economic growth (Porter, 1990). Kuester,
Homburg and Hess (2012) report a survey among 154 senior marketing officers of

7
US corporations. 61% of the respondents expect that 30% or more of their sales will
come from new products within the next 3-5 years. This finding is consistent with
the survey of 700 firms (60% industrial, 20% consumer durables, and 20%
consumer non-durables) of Hamilton (1982) who found that over a five-year period,
new products accounted for 28% of these companies’ growth. Huang and Tsai
(2013) reported that new products introduced in the last five years generated 41% of
company’s sales and 39% of company’s profits. Besides these benefits, NPD
offers other benefits like a positive impact on company image, the opening up of
new markets and the provision of a platform for a portfolio of newer products
(Markham, 2013).
The need to develop new products is increasingly felt in the light
of turbulence in the market environment. The causes of such turbulence are
numerous and interdependent and include:
• Aggressively expanding competition (more companies competing
for the same market)
• Increasing number of informed, knowledgeable and highly
demanding customers whose needs, expectations and taste rapidly
change over time (Dougherty, 1992)
• Rapid and path-breaking developments in science and technology,
e.g., biotechnology, information and communication technology
(Capon & Glazer, 1987), and
• Globalisation of businesses, including increased international
competition in a free-market economy (Wind & Mahajan, 1997).
All these discontinuities result in shorter and less predictable product life
cycles and create new markets to deal with, which in turn lead to an increasing
pressure to develop and launch new products.

8
1.4 NPD AND INNOVATION
A NPD can be achieved using incremental means or by breakthrough means. Incremental NPD mostly focus on solutions (products) to customers’ current problem (Figure: 1.4)
Figure 1.4 The Current and Needed Focus of NPD based on Current Problems and Products Solutions (Wind & Mahajan, 1997)
Examining new product introductions typically suggests that only a small percentage of all new products are “new to the world products”. Data shows that this is about 10% (Von Hippel, 2009).
Considering the relatively small number of true breakthrough products and the disproportionate contribution they can make to profitability, the challenge is how to increase an organisation’s ability to develop breakthrough products. Because the risk associated with and the required investment for the development of breakthrough or discontinuous innovations is often high, companies are often reluctant to undertake them. It is not surprising, therefore that most innovations are
“me-too” products focusing on product line extensions, improvements to products or cost reductions.
To improve the balance between incremental and breakthrough innovation, organisations should include breakthrough innovation as one of the objectives of NPD, expand the time horizon to include a balance between short and long-term considerations, augment the portfolio of NPD projects to include
9
breakthrough products and ensure that the organisational architecture (the process, culture, structure, people, resources, technology and incentives) is capable of developing breakthrough innovations. Furthermore the ability to engage in
successful breakthrough innovations depends on, the resolution of many of the issues identified using Figure 1.4.
As to the marketing research and modelling required for breakthrough innovations, it is believed that there is a major need for developing ways of informing and educating respondents (the potential consumers) on the capabilities of the discontinuous innovation and its likely impact on their lives. The Information
Acceleration (IA) methodology (Urban, Weinberg & Hauser, 1996) is an important step in this direction.
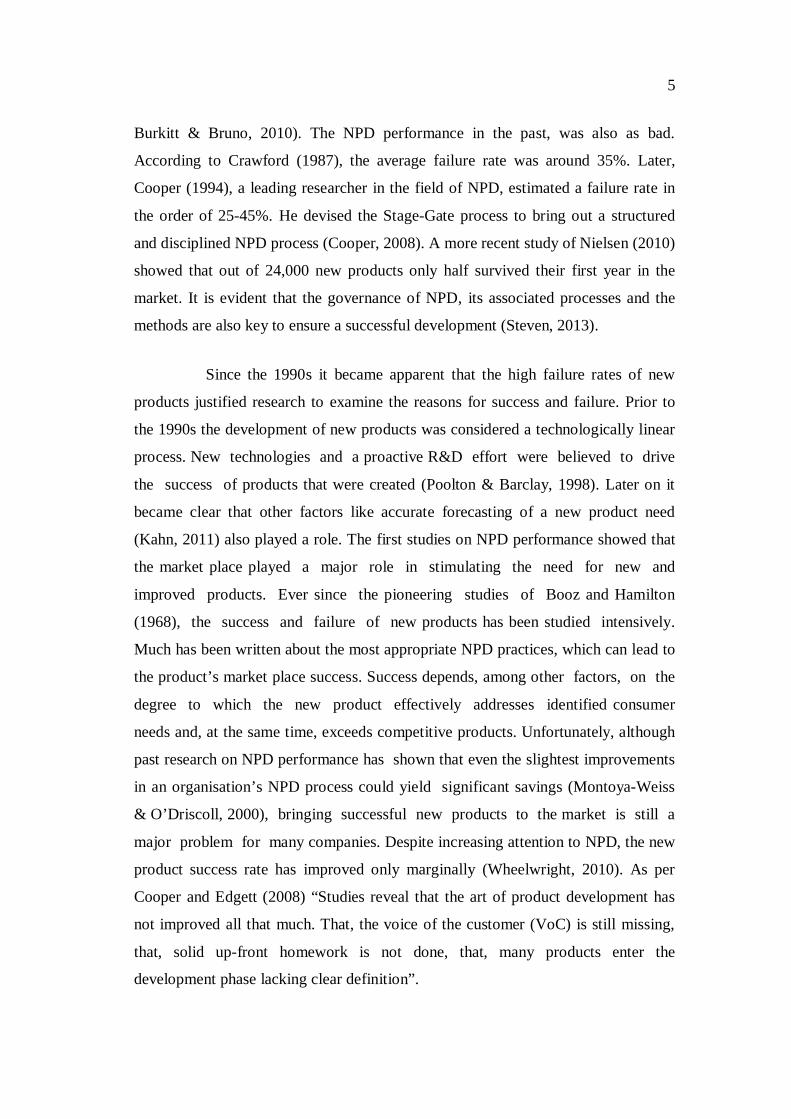
Figure 1.5 depicts the consumer behaviour under continuous innovation and breakthrough innovation, when compared with predictable market knowledge and unpredictable market knowledge. The quadrant where NPD focus is needed is brought out clearly.
Figure 1.5 Product and Innovation Type based on Changes in Consumer
behaviour (Wind & Mahajan, 1997)

10
To summarise, there exists a great need for breakthrough innovation led
NPD. Apple leads the pack and has established itself as the most valuable company
in terms of market capitalisation. This can be achieved, by focusing in the quadrant
of opportunity, as depicted in the above two figures. Capturing VoC and funnelling
it into FFE stage, would help achieve this goal.
1.5. NPD SUCCESS AND FAILURE AT PRODUCT, STRATEGY
AND PROCESS LEVEL
The importance of NPD for continued survival and competitive success,
coupled with the high- risk activity that it is, makes it not surprising that the NPD
process has received considerable attention in literature. New product performance
has been shown to be complex as many and diverse measures of success are used in
NPD performance studies (Griffin & Page, 1996). The reasons for success and
failure of NPD are heavily researched from several points of view. In the early years
of new product performance analysis, innovations were examined from the point of
view of either the factors associated with success, or those associated with failure. It
was not until the 1990s that studies compared successful with unsuccessful
innovations (Poolton & Barclay, 1998). Generally, a distinction can be made
between ‘generalist’ and ‘specialist’ studies. Generalist studies are typically
explorative in that they include a broad range of possible determinants of new
product success and aim at identifying the most important ones (Gruner &
Homburg, 2000). Well-known generalist studies include the work of Robert
Cooper and his colleagues (Cooper & Kleinschmidt, 1996), which is considered to
be pioneering in its extensive analysis of new product performance. Specialist
studies focus on an in-depth analysis of a limited range of determinants.
Despite methodological differences there is now general agreement of
the common characteristics of successful innovation. The determinants of success
and failure of new product are typically situated at two different organisational
levels: (1) the project (product) level, i.e. the way in which individual products are
developed, and (2) the strategic level, relating to the way in which companies
approach the development of new products in general. The strategic issues operate

11
at the organisational level. They are not particular to one project, but instead exert
an influence over every project (Hart, 1995; Johne & Snelson, 1988).
Szymanski and Henard (2001) conducted a meta-analysis of the new
product performance literature. Based on existing frameworks found in
literature (Montoya-Weiss & Calantone, 1994), they developed a similar
taxonomy of antecedents of new product performance. Three of the four
categories they mention (product, strategy, process and market place) are
particularly of importance in relation to this thesis: product, strategy and process
characteristics. Each of these would be explored, one by one.
1.5.1 Product Characteristics
Many studies have found that the factor that best distinguishes new
product success from failure is a superior product in the eyes of the consumer
(Ottum & Moore, 1997). This product advantage refers to consumers’ perception
of product superiority with respect to quality, cost-benefit ratio, or function
relative to competitors (Montoya-Weiss & Calantone,1994). Research of Cooper
and colleagues (Cooper & Kleinschmidt, 1986) in the 1980s, uncovered that a
unique and superior product was the single most important factor of NPD success.
Superiority in science and technology generally enhances uniqueness of these
winning products in that they offer unique features that are not available on
competitive products. Products that deliver real and unique advantages to users tend
to be far more successful than ‘me too’ products. Consumer understanding ensures
that these products meet consumers’ needs better than competitive products
(Cooper, 1994; Henard & Szymanski, 2001). Apple’s iPhone and iPad, are the well-
known examples.
1.5.2 Strategy Characteristics
The strategy of a company dictates how it will operate internally, and
how it will approach the outside world. To be successful, NPD must be guided by
the corporate goals of the company, and therefore there is a need to set clearly

12
defined objectives for NPD projects (Baker & Hart, 2008). Strategic characteristics
of successful companies include dedicating resources to the NPD initiative,
timing market entry, and capitalising on marketing and technological synergies
(Henard & Szymanski, 2001). A common view of (product development)
strategy is that success depends on whether the structure of the company matches
its environment (Nyström, 1985).
A major element of the new product strategy stressed in literature
is the importance of ‘proactive action’ rather than ‘reactive action’, especially
in turbulent environments (Hart, 1993). Product development strategies can be
described in terms of reactive or proactive strategies. A reactive strategy is
based on dealing with turbulence in the environment (e.g. changing consumer
needs) as they occur, whereas a proactive strategy would specifically allocate
resources in order to be first on the market with a product that a competitor would
find difficult to achieve (Urban & Hauser, 1993). Another important factor is that
the top management should accept the risk involved in developing new products and
support an entrepreneurial culture.
1.5.3 Process Characteristics
Process characteristics refer to elements associated with the NPD process
and its execution. A NPD covers a broad range of activities. Many studies found that
using a disciplined approach to developing new products increases information
utilisation and decision-making effectiveness and in this way improves the
likelihood of success (Cooper, 1999). Most companies follow a formalised NPD
process in which a series of activities move the project along from idea to launch
(Griffin, 1997). Cooper (1990), for example, introduced the phase review or stage-
gate system, a formal management approach to guide decision-making in
subsequent phases of the NPD process (Figure 1.6). Other stage-wise new product
process models are described by Urban and Hauser (1993).
13
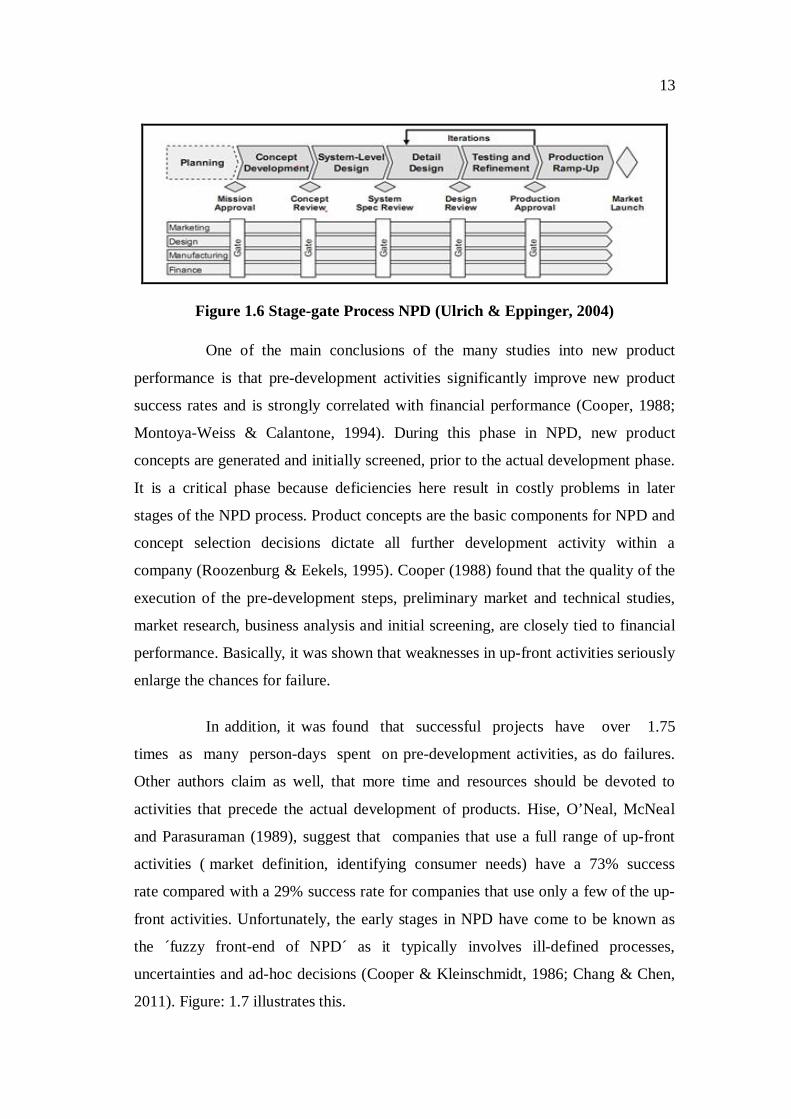
Figure 1.6 Stage-gate Process NPD (Ulrich & Eppinger, 2004)
One of the main conclusions of the many studies into new product
performance is that pre-development activities significantly improve new product
success rates and is strongly correlated with financial performance (Cooper, 1988;
Montoya-Weiss & Calantone, 1994). During this phase in NPD, new product
concepts are generated and initially screened, prior to the actual development phase.
It is a critical phase because deficiencies here result in costly problems in later
stages of the NPD process. Product concepts are the basic components for NPD and
concept selection decisions dictate all further development activity within a
company (Roozenburg & Eekels, 1995). Cooper (1988) found that the quality of the
execution of the pre-development steps, preliminary market and technical studies,
market research, business analysis and initial screening, are closely tied to financial
performance. Basically, it was shown that weaknesses in up-front activities seriously
enlarge the chances for failure.
In addition, it was found that successful projects have over 1.75
times as many person-days spent on pre-development activities, as do failures.
Other authors claim as well, that more time and resources should be devoted to
activities that precede the actual development of products. Hise, O’Neal, McNeal
and Parasuraman (1989), suggest that companies that use a full range of up-front
activities ( market definition, identifying consumer needs) have a 73% success
rate compared with a 29% success rate for companies that use only a few of the up-
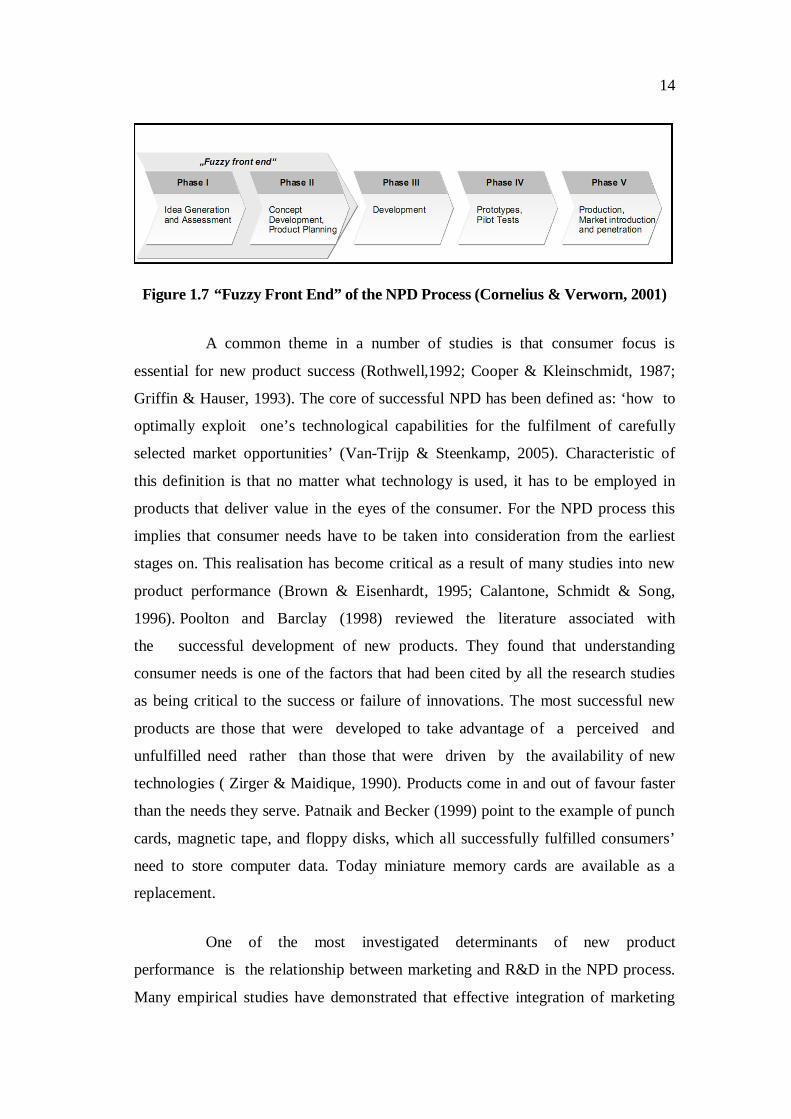
front activities. Unfortunately, the early stages in NPD have come to be known as
the ´fuzzy front-end of NPD´ as it typically involves ill-defined processes,
uncertainties and ad-hoc decisions (Cooper & Kleinschmidt, 1986; Chang & Chen,
2011). Figure: 1.7 illustrates this.
14
Figure 1.7 “Fuzzy Front End” of the NPD Process (Cornelius & Verworn, 2001)
A common theme in a number of studies is that consumer focus is
essential for new product success (Rothwell,1992; Cooper & Kleinschmidt, 1987;
Griffin & Hauser, 1993). The core of successful NPD has been defined as: ‘how to
optimally exploit one’s technological capabilities for the fulfilment of carefully
selected market opportunities’ (Van-Trijp & Steenkamp, 2005). Characteristic of
this definition is that no matter what technology is used, it has to be employed in
products that deliver value in the eyes of the consumer. For the NPD process this
implies that consumer needs have to be taken into consideration from the earliest
stages on. This realisation has become critical as a result of many studies into new
product performance (Brown & Eisenhardt, 1995; Calantone, Schmidt & Song,
1996). Poolton and Barclay (1998) reviewed the literature associated with
the successful development of new products. They found that understanding
consumer needs is one of the factors that had been cited by all the research studies
as being critical to the success or failure of innovations. The most successful new
products are those that were developed to take advantage of a perceived and
unfulfilled need rather than those that were driven by the availability of new
technologies ( Zirger & Maidique, 1990). Products come in and out of favour faster
than the needs they serve. Patnaik and Becker (1999) point to the example of punch
cards, magnetic tape, and floppy disks, which all successfully fulfilled consumers’
need to store computer data. Today miniature memory cards are available as a
replacement.
One of the most investigated determinants of new product
performance is the relationship between marketing and R&D in the NPD process.
Many empirical studies have demonstrated that effective integration of marketing

15
and R&D increases the likelihood of new product success (Griffin & Hauser, 1997;
Hise, O’Neal, Parasuraman, McNeal, 1990). Gupta and Wilemon (1988) ; Biemans,
Griffin and Moenaert (2010) found that for a high degree of integration, R&D and
marketing both need to be involved very early in the NPD process. Song,
Thieme and Xie (1998) examined the relationship between new product
performance and cross-functional joint involvement between marketing, R&D
and manufacturing in 5 major stages of the NPD process. They found that,
especially during the market opportunity stage where ideas are generated and
screened, a joint involvement of marketing and R&D is associated with NPD
success. Unfortunately, each discipline has a somewhat different view of the
product development activity, which often turns into barriers to co-operation.
Much has been written about such integration problems and in particular
about the importance of effective inter departmental communication and co-
ordinations (Griffin & Hauser, 1992; Moenaert & Souder, 1996). Research about the
effects of cross-functional integration in the development of new
products has demonstrated that good communication between functional
disciplines is critical to innovative success (Moenaert & Souder, 1990; Kahn, 1996;
Song, Thieme & Xie, 1998). High inter-departmental communication increases the
amount and variety of internal information flow and, so, improves development
process performance (Brown & Eisenhardt, 1995). Unfortunately, product
developers often encounter difficulties in this translation process due to
communication problems at the marketing-R&D interface and lack of an objective
statistical methodology. This thesis attempts to fill that gap.
1.6 ROLE AND IMPORTANCE OF CONSUMER RESEARCH
FOR OPPORTUNITY IDENTIFICATION IN NPD
In the numerous studies of new product performance over the
years, an agreement has emerged that understanding consumer needs is of greatest
strategic value in the early stages of the NPD process. During these early stages, the
product has not yet been specified and the aim is to search for novel product ideas.
Successful NPD strongly depends on the quality and quantity of new product ideas.
Presumably, consumer research should improve the quality of new product ideas.
16
Yet, many companies do not carry out consumer research or do not use the resulting
information. Many reasons exist why consumer research is not fully used for
opportunity identification. This section discusses the key requirements for effective
consumer research in the opportunity identification phase of NPD.
The importance of understanding the consumer has increased over time.
In the past, many companies succeeded without relying on the knowledge about
consumers’ preferences and behaviour. Burton and Patterson (1999) state that
until the middle of the 20th century, innovation was based on what
manufacturers could and wanted to supply. The majority of new products resulted
from technology-push innovation, which means that the development of these new
products was driven by a technological advance or invention. Later on, the post-war
consumer and manufacturer boom led to growing competition between products.
Simply supplying products became insufficient to maintain competitive advantage.
Thus began the systematic investigation on consumers to discover what they wanted
and what was most important to them. In this market pull model of innovation, it is
suggested that companies should focus on the markets they serve (Kohli &
Jaworski, 1990; Narver & Slater, 2000). Since that time, many methods and
techniques have been developed to help product developers improve the
quality of their decisions. The availability of these methods and techniques,
however, does not mean that they are generally accepted and used in the NPD
process. Wind and Mahajan (1997) argue that despite the widely accessible
research and modelling approaches for NPD, many are not widely employed.
Nijssen and Lieshout (1995) investigated the use of methods and models for NPD
within a sample of small Dutch industrial companies. They found that for a large set
of NPD methods, the awareness by name was only 30% and the awareness by
content was 57%. About half of the companies which are aware of these methods by
content also don’t apply them, resulting in an overall penetration level of 30%.
Mahajan and Wind (1992) assessed the role of NPD tools and techniques in
supporting and improving the NPD process in the USA. They investigated a sample
of Fortune 500 firms in the USA. In general, the use of NPD methods is not
17
widespread. Besides their low use, many methods are not used in a focused way.
Instead of their intended use for specific stages (e.g. idea generation, product
optimisation), practitioners apply them to other stages and problems.
1.7 CAUSES FOR NON-USE OF CONSUMER RESEARCH IN
OPPORTUNITY IDENTIFICATION
Different studies have found various reasons why information about
consumers is not gathered, shared or used in the NPD process. For example, a
stream of research initiated by Deshpande and Zaltman (1984) investigated the use
(or non-use) of marketing research information by managers. In this section, the
most frequent reasons why consumer research is poorly applied are discussed.
1.7.1 Consumer Research Lacks Credibility
A widespread belief among practitioners is that consumers cannot be
trusted in their opinion. Several studies have shown that it is difficult to predict final
consumer behavior based on consumers’ expressed attitudes towards products or
certain issues. Nijssen and Lieshout (1995) found that users of NPD methods
mention this shortcoming of forecast inaccuracies. Moreover, users mention as well
that, methods are not able to capture the complexity of the market place. Another
problem that plays in NPD is that consumer research is often part of marketers’
responsibility in a company.
It is well known that both marketing and R&D professionals do not
always consider each other’s information to be credible (Song, Neeley & Zhao,
1996). Marketers are often viewed as ‘easy talkers’ by R&D personnel, as relying
too much on intuition rather than on hard facts (Gupta, Raj, & Wilemon, 1985;
Moenaert & Souder, 1990). If people perceive information as less credible, it means
that they perceive the quality to be lower, and this will result in lower information
utilisation.

18
1.7.2 Consumer Research does not Help to Come up with Innovative New
Product Ideas
Various studies have found that the key determinant of new product
failure is an absence of innovativeness - the extent to which a new product provides
meaningful unique benefits. Not much confidence, however, exists among product
developers that consumer research can provide a valuable contribution in the
search for new and improved ways of satisfying consumers’ needs. Although
it is generally believed that listening to VoC is important, the precise way of
‘listening’ is not always clear. Effective use of consumer research for this purpose
has been identified as a problematic area, because it is unsure what to ask consumers
(Ortt & Schoormans, 1993; Ottum & Moore, 1997). An often-heard argument is that
asking consumers what they want is useless, because they might not know what they
want (Ulwick, 2002). Moreover, the majority of available methods focus on
evaluation of products (Wind & Lilien, 1993). In these methods, products (ideas)
are presented to a sample of consumers and evaluations are collected. These
evaluations are used to optimise the product or to screen and select from different
product ideas, ultimately ending up with the product idea with the highest
likelihood of market success (Ozer, 1999). However, these methods can be
considered as reactive in nature for their use in the early stages. They constrain the
researcher in the elicitation of unstated consumer needs, because consumer input is
restricted to responses to an already existing concept or product. A risk of relying on
them solely is that they are likely to give product developers only ‘me-too’-ideas,
which hardly excite the consumer. Burton and Patterson (1999) point to this
problem by stating that most consumer research only attempts to build on existing
and often already fulfilled needs of consumers. Consequently, the results of this kind
of consumer research do not exceed common-sense knowledge and hence is
consistent with what practitioners already take to be true. Smith (2003) claims that
this typically results in a “So what, I already suspected that” reaction on the part of
the receivers of the results. In case consumer research does not exceed the intuition
of end-users and solely reaffirms existing beliefs, it tends to be less used. Moreover,
many studies are carried out to increase the saleability of a decision. Such studies
19
are designed after a decision has been made to gain support rather than to provide a
basis for the foundation of new product ideas (Day, 1994).
1.7.3 Consumer Research Delays Product Development Process
Product life cycles are becoming shorter, which leads companies to
reduce the time it takes to introduce new products at the market. Being early is
generally believed to provide a significant competitive advantage. Companies that
take too long in bringing new products to the market run the risk that others
will get there first, or that consumer needs and wants will change. Consumer
research is time-consuming and extends rather than shortens the NPD process.
Moreover, consumer research requires additional resource investments (Miller and
Swaddling, 2002).
1.7.4 Consumer Research Lacks Comprehensibility
Consumer research must often be used by both marketing and R&D.
Both marketing and R&D employees often complain that they have difficulty
understanding each other. One of the reasons for this misunderstanding is that
marketing has its own set of technical terms, and so has R&D (Moenaert & Souder,
1990). As a result, consumer research can be difficult to comprehend.
Comprehensibility of information is the ease with which the receiver can decode and
fully and unambiguously understand the information (Moenaert & Souder, 1996).
For instance, Dougherty (1992) found that individuals from different functional
departments understood different aspects of product development, and they
understood these aspects in different ways. The difference led to varying
interpretations, even of the same information.
1.7.5 Consumer Research Lacks Actionability for R&D
Information will be used if it is perceived to be relevant for the task for
which the receiver is responsible (Moenaert & Souder, 1996; Madhavan & Grover,
1998). Both marketing and R&D professionals need consumer information that is
closely linked to their own task in the development process. Marketers generally

20
need information about key drivers of consumer choice for the development of
effective communication, product positioning and segmentation strategies. R&D
professionals, in contrast, need very concrete information about how consumer-
desired product benefits translate into target values for technical development
(Shocker & Srinivasan, 1979). R&D employees often complain that consumer
research provides insufficient actionable and detailed information about consumer
requirements and does not understand key issues about product development
(Gupta & Wilemon, 1988). As a result, they may reject the information, lose
interest or produce their own information on desired product features with the risk
that the new product will not be entirely compatible with the actual requirements
consumers have (Bailetti & Litva, 1995). This need for actionable information is
becoming more important than it was in the past, because individuals often feel
overwhelmed by the huge amounts of information available.
1.8 REQUIREMENTS FOR EFFECTIVE CONSUMER RESEARCH FOR
OPPORTUNITY IDENTIFICATION IN NPD
By definition, innovation consists of doing something new. Hence,
consumer research for opportunity identification reflects a more creative, pro-
active side of product development as a complement to confirmative research.
Unfortunately, most NPD methods focus on solutions to consumers’ current
problems and limit themselves to continuous innovation (Wind & Mahajan, 1997)
rather than forward looking, disruptive innovation. The question is: how can
consumer research help to identify opportunities and develop really new products?
The difficulties that consumers have with expressing their needs and evaluating the
potential of new products do not imply that consumer research should be left out. It
does, however, pose special challenges to consumer research. Effective consumer
research for opportunity identification in NPD distinguishes itself on the following
characteristics.

21
First, effective consumer research for opportunity identification must be
comprehensive in that it provides a detailed insight into the relation between
product characteristics and consumers’ need fulfilment and behaviour. Consumer
research for NPD is often thought of as existing of historical purchase information
or product evaluations. However, understanding consumer behaviour encompasses
much more than just getting insight into how consumers evaluate and purchase
products and services (Jacoby et al., 1978). Sheth, Mittal and Newman (1999)
define consumer behaviour as all mental and physical activities undertaken by
consumers that result in decisions and actions to pay for, buy, and use products and
services. For consumers to decide to buy a product they must be convinced that the
product will satisfy some benefit, goal, or value that is important to them (Gutman,
1982; Walker & Olson,1991). To develop a superior new product, consumer
research needs to identify consumers’ product attribute perceptions, including the
personal benefits and values that provide the underlying basis for interpreting
and choosing products . As such, it makes a number of key considerations
explicit. This provides a common basis for the different functional disciplines
involved in the NPD process. In addition, it makes clear which crucial factors
affect consumer perceptions, preferences and choices, and what trade-offs need to be
made.
Secondly, effective consumer research for opportunity identification
helps to identify really new product ideas anticipating consumers’ future needs and
desires. Most consumer research methods work well in understanding consumer
preferences among existing products, but are less appropriate in identifying future
needs that consumers cannot yet articulate. Several authors argue in favour of
specific techniques that may be applied to overcome these problems (Ortt &
Schoormans, 1993; Wind & Mahajan, 1997). For example, they recommend
deriving consumers’ future needs by observing consumers in their own
environment. The basic premise of the ‘empathic design’ method is that the richest
information on consumer needs can be acquired by observing consumers in
their own surroundings (Leonard & Rayport, 1997). Another example comes from
Von Hippel (1988), who involved ‘lead users’ in the early stages of the NPD
22
process. Lead users are consumers who have been dissatisfied with currently
available products, and need a product to solve their problem. Lead users then
develop their own solutions. As such, their present strong needs are assumed to
become general in the market place months or years in the future.
In contrast, the information acceleration approach (Urban, Weinberg and
Hauser, 1996) tries to solve consumers’ difficulty evaluating really new products by
educating (potential) consumers on the capabilities of the innovation and its likely
impact on their lives. Finally, Goldenberg, Mazursky and Solomon (1999) used a set
of templates – regularities in the emergence of successful innovations- to come up
with new product ideas. Based on two studies, Goldenberg, Lehmann and Mazursky
(2001) conclude that templates significantly distinguish successful from failed new
products in the marketplace, and hence are better able to identify product ideas
that capture consumers’ future needs. This is because over the time, market
changes, leave traces in product configurations that can be identified as
product-based trends. Those trends, converted as templates, provide the skeleton
from which new successful future product ideas are generated.
All these examples have in common is that they try to avoid
complications like consumers’ memory problems, lack of descriptive ability and
lack of awareness of needs. In addition, they are not prescriptive but enhance
product developers’ creativity necessary for finding unique solutions.
Third, effective consumer research for opportunity identification is
presented in an actionable form to make product development decisions based
on consumer research. A characteristic of actionable knowledge is that findings
and implications can directly be linked to the user’s activities and practices (Menon
& Varadarajan, 1992).
Fourthly, effective consumer research for opportunity identification
is executed on a continuous basis. It is not just enough to be able to describe the
current state of the market in detail. The consumer’s own circumstances may have
changed or what used to be a valuable benefit isn’t so important anymore.
23
Competitors’ offerings change as well, so it is not safe for a company to assume that
they understand consumers’ value perceptions for very long (Miller & Swaddling,
2002). An early understanding of changes in consumer behaviour makes it possible
to anticipate market opportunities and respond before competitors do. In this way,
consumer research helps to expand the time horizon of innovation. Rather than
being adopted in an ad-hoc basis with a short-term focus, it should strongly and
coherently be embedded in the total business process. This allows for systematic
learning and anticipating on developments rather than just reacting to them
(Hughes & Chafin, 1996).
1.9 AIM AND SCOPE OF THE THESIS
The introduction of new products offers the opportunity for companies to
increase its sales and so enhance both competitive position and potential for
surviving. Although the development of new products can be rewarding, it is risky
as well as has been already mentioned. The central task in NPD is to develop those
products (characteristics) that deliver desired benefits for consumers as perceived
by them. Unfortunately, this is more easily said than done. Many new products fail
when launched in the market place. This is unacceptable from a financial point of
view. The reasons for success are well researched and documented. In essence,
development of a new product that is both unique and superior requires effective
marketing-R&D interfacing throughout the NPD process. Breakthroughs in R&D
generally enhance uniqueness whereas marketing/consumer focus will help ensuring
superiority in consumer value perception. Moreover, several authors claim that the
opportunity identification stage, where product ideas are generated and screened, is
one of the greatest opportunities for improvement of new product success rates
(Rosenau, 1988; Khurana & Rosenthal, 1998). Wind and Mahajan (1997) argue that
most of the improvements of the NPD process would be most beneficial for
activities dealing with the earlier stages of the NPD process. In a successful NPD, a
balance should be found between consumer research to minimise NPD risks (verify
or test) and consumer research to identify opportunities by acquiring inspiration and
focus (allowing creativity in the process). Numerous consumer research methods
are available to understand consumer needs and wants for product development

24
purposes. But despite the widespread recognition of the important role that a focus
on the consumer plays in NPD, most companies fail to use these methods in an
appropriate manner. Product developers are still relying on gut-feel with
respect to ‘best practice’ in NPD.
The aim of this thesis is hence,
To identify the gaps in achieving a successful NPD.
To identify an appropriate consumer research methodology to
understand the gaps.
To zero-in on a tool or combination of tools to capture and translate
the VoC to Fuzzy-Front-End (FFE) of the product development life
cycle.
To validate the identified tool for a successful NPD.
To demonstrate a detailed guideline so that the recommended
method could be easily used for a repeatable and successful NPD.
To incorporate the VoC as a design input using a real life case
study of a failed product, that was redesigned using the principles
of Conjoint Analysis and assess its validity as a useful tool.
To showcase the scope of the applicability of the Conjoint Analysis
tool for engineering products.
Applicability for NEW SERVICES (as in Products and Services) is
beyond the scope of this dissertation.
1.91 Summary- Structure of the Thesis
This first Chapter starts off by tabling the motivation for this study. So
much time, money and reputation are lost in failed new products that, any solution
to secure it would be a worthwhile effort. The chapter illustrates the importance of
25
NPD. It is the life line of any business. The relationship between consumer research
and the NPD is also brought out, so that the importance is clearly understood.
Further, the reason for not adapting the consumer research inputs is indicated.
Finally the aim and scope of the thesis is explained. The chapter closes with the
explanation of the structure of thesis.
Chapter 2 reviews the literature on new product development, the various
possible tools that could be used in the early stages of the NPD for a successful
launch and the gap that exists in each of those researched tools. The advantage of
Conjoint Analysis, which was hitherto a social science research tool, for NPD, is
established, in the process.
Chapter 3 gives a brief about the Conjoint Analysis and the steps
involved in administering it. This market research tool is traditionally applied by
using the software like SPSS (Statistical Package for Social Studies). This tool has
been widely used for Social studies and population studies behaviour. SPSS’s
name itself indicates its history and background. The current work has used Minitab
software tool, to apply Conjoint Analysis, uniquely and innovatively. Minitab is
available in most of the engineering manufacturing companies, as compared to the
availability of SPSS, due to its use for six-sigma initiatives.
Chapter 4 illustrates the research methodology that is used for the case
study and the rationale.
Chapter 5 details the case study where the Conjoint Analysis is applied to
a re-design a failed New Product and its successful re-launch. It also gives a step by
step drill down of the VoC using a combination of available techniques, finally
culminating into the application of Conjoint Analysis, innovatively, using Minitab.
Chapter 6 illustrates the results obtained and discusses the learning’s
from this study.
Chapter 7 lists the limitation of the study and summarises the
conclusions arrived at. This section also recommends a few leads for further
scholarly work on the topic.
26
CHAPTER 2
LITERATURE SURVEY
“Learn from yesterday, live for today, hope for tomorrow. The most important
thing is not to stop questioning”- Albert Einstein
2.1 INTRODUCTION
The literature on NPD is enormous. In the introductory chapter, the need
and the importance of the ‘Design phase’ of the product life cycle, has been
established. In this chapter, the need and importance of the consumer research input,
into the ‘Design phase’, is illustrated, first by bringing out the importance of the
VoC early into the design stage and then by evaluating ten existing consumer
research methods, empirically, to understand the applicability of one or more of
these to the early stages of design. While evaluating the different methodologies, the
gaps of the existing methodologies is understood and it is shown how Conjoint
Analysis emerges, to fill this gap.
2.2 SUCCESSFUL NPD AND CONSUMER RESEARCH
A NPD can originate from new technology or new market
opportunities (Eliashberg, Lilien & Rao, 1997). But irrespective of where
opportunities originate, when it comes to successful new products it is the consumer
who is the ultimate judge (Cooper & Kleinschmidt, 1987; Brown & Eisenhardt,
1995). So, in order to develop successful new products, companies should gain a
deep understanding of 'VoC'. Consumer research can be carried out during each of
the basic stages of the NPD process:

27
(1) opportunity identification,
(2) development,
(3) testing, and
(4) launch (Urban & Hauser, 1977)
It is traditionally most widely applied during the development, testing
and launch stages. Even the most technologically oriented companies use consumer
research to verify whether consumers will accept a new product when it will be
launched at the market. Despite the importance of the later stages, it is increasingly
recognised that successful NPD strongly depends on the quality of the
opportunity identification stage (Cooper, 1988; 1999; McGuinness & Conway,
1989). The goal of this stage is to search for new areas of opportunities,
which typically involve the unmet needs and wants of consumers.
2.3 VoC (VOICE OF THE CUSTOMER)
Companies create superior customer value by providing on-going
solutions to customers articulated needs as well as their latent and future needs.
Beyond the task of actualising a customer value-based strategy, sustaining it can be
quite difficult (Woodruff, 1997). To do so, strategists encourage firms to be
market/customer oriented.
Market oriented firms generate and share intelligence about customer
needs and take co-ordinated action to satisfy those needs (Day, 2000; Kohli &
Jaworski, 1990; Narver & Slater, 1990). However research has predominantly
focused on the topic of responding effectively to customers’ current, expressed
needs (Narver, Slater & MacLachlan, 2004) barring a few exceptions ( Atuahene-
Gima et al., 2005; Tsai, Chou & Kuo, 2008) where there is little empirical insight
into the nature or effects of pro-actively understanding customers latent and future
needs.
28
2.4 CONSUMER RESEARCH METHODS
Consumer research is often considered difficult during the ‘fuzzy front
end” stage because of the lack of surety, what to ask consumers at this point. An
often-heard argument is that asking consumers what they want is useless, because
“they do not know what they want” (Ulwick, 2002). Consumer research, however,
helps to raise the odds of success in the market. Even though consumers may not
always be able to express their wants, it is important to understand how the products
are perceived, how the needs are shaped and influenced and how product choices are
made based on them. In this way, it helps to avoid working on a new product
that has a low probability of success in the first instance (Rochford, 1991).
Additionally, it guards against potential winning product concepts being
overlooked. As a result, carrying out consumer research in this stage is
inexpensive compared to the risk of product failure. Moreover, gathering
consumer understanding with the help of formal consumer research methods has the
advantage that the results can more easily be disseminated across departments in an
organisation (Kohli & Jaworski, 1990). Knowledge obtained through formal
methods is generally used to a greater extent, most likely through its verifiability
and credibility (Maltz & Kohli, 1996). Unfortunately, despite the large number of
available methods and techniques to be used in the NPD process, the majority of
them are not used by companies (Mahajan & Wind, 1992; Nijssen & Lieshout,
1995; Nijssen & Frambach, 2000). Large parts of the conducted research in
NPD consist of surveys and the study of demographic data. This is considered
to be one of the reasons for the relatively low new product success rates
(Wind & Mahajan, 1997).
The failure of methods to reach their full potential in NPD is perhaps the
result of the limited and confused way in which they have been evaluated and made
clear to potential users. In contrast to the significant attention paid to methods like
Quality Function Deployment (QFD) and product testing methods, analysis of
strengths and weaknesses of consumer research methods for opportunity
identification has received only little attention. For example, there have already
been several excellent review articles in the area of creativity enhancement
29
(Goldenberg & Mazursky, 2002), concept screening (Cooper & De Brentani, 1984;
Poh, Ang & Bai, 2001), development planning tools like QFD (Costa, Dekker
& Jongen, 2004; Benner & Tushman, 2003), and product testing methodology
(Ozer, 1999). In contrast, most research in the area of opportunity identification has
presented the procedures and theoretical foundation of a single method and little has
been done to assess methods in terms of their appropriateness.
To summarise the research gaps identified thus far:-
Market success is guaranteed by a ‘unique and superior’ offering.
Uniqueness can be established by using new technology, but for
superiority, there needs a synchronised R&D and Marketing
interface, which is absent.
The R&D and Marketing interface gap is predominantly due to a
‘communication barrier’. There is a need for a ‘bridge’ to be
established to overcome this.
Consumer research methods ensure capture of latent and future
customer needs. But bulk of the studies is survey based and
collection of demographic data.
Formal consumer research methods’ inputs are considered useful
and have a greater probability of use at the FFE.
The following ten methods and techniques have been evaluated: (1)
Empathic design (2) Focus group (3) Free elicitation (4) Information acceleration
(5) Kelly repertory grid (6) Laddering (7) Lead user technique (8) Zaltman metaphor
elicitation technique (ZMET) (9) Category appraisal (including preference
analysis) (10) Conjoint Analysis. Their objective is to provide diagnostic consumer
information relevant to the perception, preference and value satisfaction resulting
from the consumption of products. Although they have the same overall objective,
they differ in many respects, not only in the procedure they follow, but also in the
resulting consumer needs. Fundamental differences in these methods may lead to
30
different 'optimal' solutions to consumers' unmet needs. The choice for using a
particular method or technique in the pre-development stages is therefore not
arbitrary. In particular, the appropriateness depends on the purpose for which
they are implemented (support marketing versus support R&D) and the
innovation strategy, which is pursued (winning in existing well-defined markets
versus building a new market through radically new products). In line with this,
three major issues are observed in literature (Eliashberg, Lilien & Rao, 1997) which
determines the choice for a particular method or technique:
(1) Information source for need elicitation,
(2) Task format, and
(3) Need actionability.
In the next section, further classification criteria for the available
methods would be discussed.
2.5 CATEGORISATION OF CONSUMER RESEARCH METHODS
Based on consumer psychology and marketing literature, the
categorisation scheme is developed (Table: 2.1) in which methods are grouped
according to the most significant determinants of results. The output of a particular
method depends on the considered information source for need elicitation (i.e. the
input) and the task format ( Simonson et.al, 1993). The basic type (product versus
need-driven) and familiarity of the stimuli determines how participants are going to
react and process information in order to respond to questions asked. The
identification of consumer needs can proceed in various ways. It is generally
assumed that when consumers respond to questions, their answers represent the true
meaning. However, depending on the task to be performed in a method, consumers
pay attention to different kinds of aspects. The impact of task format is discussed.
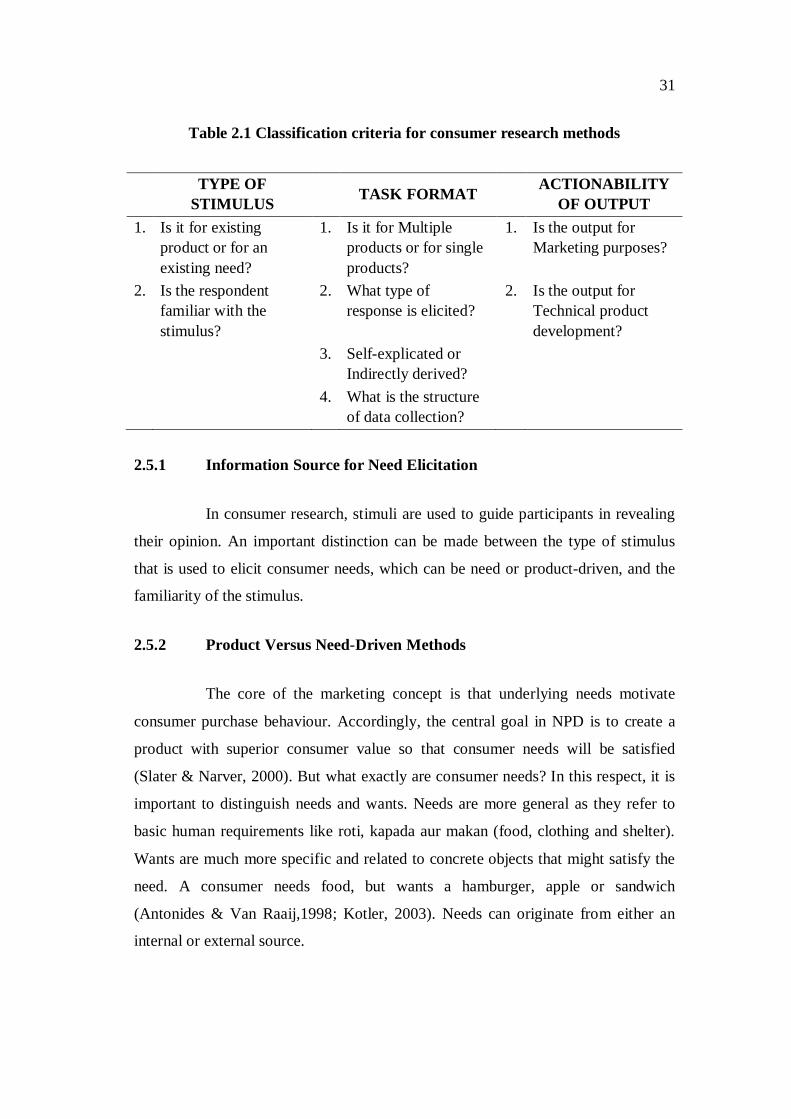
31
Table 2.1 Classification criteria for consumer research methods
TYPE OF STIMULUS TASK FORMAT ACTIONABILITY
OF OUTPUT 1. Is it for existing
product or for an existing need?
1. Is it for Multiple products or for single products?
1. Is the output for Marketing purposes?
2. Is the respondent familiar with the stimulus?
2. What type of response is elicited?
2. Is the output for Technical product development?
3. Self-explicated or Indirectly derived?
4. What is the structure of data collection?
2.5.1 Information Source for Need Elicitation
In consumer research, stimuli are used to guide participants in revealing
their opinion. An important distinction can be made between the type of stimulus
that is used to elicit consumer needs, which can be need or product-driven, and the
familiarity of the stimulus.
2.5.2 Product Versus Need-Driven Methods
The core of the marketing concept is that underlying needs motivate
consumer purchase behaviour. Accordingly, the central goal in NPD is to create a
product with superior consumer value so that consumer needs will be satisfied
(Slater & Narver, 2000). But what exactly are consumer needs? In this respect, it is
important to distinguish needs and wants. Needs are more general as they refer to
basic human requirements like roti, kapada aur makan (food, clothing and shelter).
Wants are much more specific and related to concrete objects that might satisfy the
need. A consumer needs food, but wants a hamburger, apple or sandwich
(Antonides & Van Raaij,1998; Kotler, 2003). Needs can originate from either an
internal or external source.
32
First, an internal perceived state of discomfort of the consumer, for
example feeling hungry or bored, may arouse needs. Also external information may
lead consumers to realise that they have a need. For example, an advertisement of
multivitamins or the sight of the bakery with the smell of fresh-baked bread can all
serve as external stimuli that arouse the recognition of a need (Bruner & Pomazal,
1988; Sheth, Mittal & Newman, 1999). Similarly, it is attempted to characterise
methods that unlock consumers’ needs as either ‘need-driven’ or ‘product-driven’.
In need-driven methods, participants are asked to reveal their internal needs,
without being exposed to (pictures of) the products. Consumers’ problems and
needs are the source of information in these kinds of methods. In contrast,
product-driven methods confront consumers with products as cues to start the
identification of needs and wants. Looking at or tasting from these products arouses
the recognition of the need or problem. In other words, exposure to products is the
driving force in product-driven methods and (unfulfilled) needs are derived from
them.
Product-driven methods provide a restricted view on consumer needs.
They provide insights that are limited by the particular product(s) included in the
study, that is, they elicit consumer needs within an existing framework of what is
already available on the market. On the other hand, reactions to existing products
are relatively predictable, and results can easily be translated in corresponding
product requirements. A disadvantage, however, of starting too early in the NPD
process with concrete products is that it may kill creativity and ‘out-of-the-box’
thinking. In particular, it will easily lead to fixation on existing products. In
contrast, understanding consumer problems or motivations rather than the
product itself keeps all possible solutions open for consideration and avoids
prematurely limiting possibilities (Patnaik & Becker, 1999). It is assumed that the
more unstructured and ambiguous a stimulus, which often is the case in need-driven
methods, the more consumers will reveal their true emotions, motives and values
about a topic. Nevertheless, building mostly upon abstract consumer needs, is the
way for product developers to move to a concrete concept that incorporates these
consumers' needs.
33
2.5.3 Familiarity
The result of a particular method depends to a large extent on the
familiarity of provided stimuli. It is generally known that evaluation tasks become
more difficult when stimuli are more complex or unfamiliar. Familiarity in
evaluating products is defined as the number of product related experiences that
have been accumulated by the consumer (Alba & Hutchinson, 1987).The more
familiar the product, the more specific consumer needs can be inquired after.
Because concrete attributes often can be assessed in the choice situation,
information about abstract attributes is usually retrieved from memory (Hastie &
Park, 1987). Hence, when participants are more familiar with a product, the quantity
of accessible information in memory is higher. Moreover, since especially abstract
attributes are stored in memory, the amount of information that is retrieved from
memory on these abstract attributes is predicted to be higher. In contrast, consumers
have often difficulties in evaluating major innovations. In particular, it can be
unclear for consumers to understand, what the new products needs could satisfy.
The difficulty of evaluation of such products depends on the type of information and
knowledge that consumers have about the particular attributes of a product. In case a
consumer has minimal experience with the product, it is difficult to retrieve the
relevant attributes to evaluate the product. Due to limited cognitive capacities of the
human mind, people often make heuristic decisions when encountered with complex
stimuli. As a consequence, decisions are made by a rule of thumb, and not all
information is taken into account. As a result, consumers’ opinion about new
products may not have a high predictive validity. Although this can partly be
prevented by including consumers with moderate to high levels of product
expertise (Schoormans, Ortt & Bont, 1995), consumers may change their opinion by
the time the product will be introduced.
2.5.4 Task Format of Method/Technique
Task differences in methods can be responsible for differences in elicited
consumer needs. Research suggests that preferences are partly constructed for a
specific choice task (Simonson, et.al., 1993; Van Trijp & Steenkamp, 2005). The

34
impact of task format threatens the validity of the conclusions drawn from the
application of the method.
2.5.5 Evaluating Multiple Products Versus a Single Product
The identification of consumer needs is systematically affected by
whether participants make direct comparisons between multiple products or
whether they evaluate products one at a time. Most theories of consumer
behaviour assume that the consumer's choice among alternative products is
based on a comparison of products in a choice set. So, methods that include a set of
competing alternatives available in the market have the advantage that they
represent the task that consumers typically perform in the market. However, when
consumers compare very different kind of products, they compare them at higher
levels of comparison (Johnson & Fornell, 1991). For example, in this way a
consumer is able to compare two dissimilar alternatives (such as a video cassette
recorder and tickets to the movies) on abstract values (such as potential for fun and
enjoyment) (Corfman, 1991). In tasks where products that have to be compared are
more similar, concrete and 'comparable', attributes like price tend to be more
important (Malhotra, Peterson & Kleiser, 1999). In contrast, when individual
products are evaluated, the importance of attributes is influenced by the ease of
evaluating each attribute by itself (Nowlis & Simonson, 1997). The reason for this is
that consumers do not have well-articulated preferences for the specific level each
attribute can have.
2.5.6 Response Type
Methods for consumer input can be categorised in terms of the response
type required of the participant. The first category is association. In an association
task, participants are presented with a stimulus and asked to indicate the first word,
image or thought elicited by that stimulus. Associative theory claims that these
words, images or thoughts are joined to each other in such a way that one tends to
evoke the other (Malaga, 2001). A further distinction can be made between
inquiring after preference or perceptual judgements. Market researchers often
35
assume that preference and perceptual judgements are closely linked. The rationale
for this is that, if two products are perceived as very similar, they are similarly
preferred. However, previous research found that this is not the case (Creusen &
Schoormans, 2005). Two products can be totally different in terms of, for example
appearance and taste and still equally liked. Similarity questions will identify
perceptual differences between products resulting from participants' comparison
process. These comparison processes typically evoke visual salient and distinctive
attributes (Lefkoff-Hagius & Mason, 1993). This is useful information for
technical product development as in the development stage, information is required
about how the product should look. In contrast, asking a consumer after the
experienced preferences, evokes a different thinking process, resulting in other
aspects of the product considered important. Before giving a preference
judgement, consumers will imagine the benefits the product will deliver for them.
This information is very important for NPD, as consumer needs, arising from
preference judgements have a higher predictive validity for purchase than consumer
needs arising from perceptual judgements.
2.5.7 Self-Articulated or Indirectly Derived Consumer Needs
The output of methods will also be influenced by the task used to derive
consumer needs. Hence a fundamental distinction can be made between methods
involving consumers' self-articulated needs (directly derived) and those that derive
needs indirectly (e.g. statistically or by means of observation). In direct approaches,
the participant is asked and often guided to give reasons for liking, preference or
choice. A number of relevant issues arise in this respect.
First, letting consumers articulate their needs themselves implies that you
assume that consumers are able to fully understand their own needs and are
able to express them. Research on decision-making, however, has revealed that
consumers are frequently unaware of their underlying choice criteria and
aspirations in purchasing a product or choosing one product instead of another
(Simonson, et al., 1993; Steenkamp & Van Trijp, 1991). People do not have clear
and stable preferences, even when they have complete information about the
36
characteristics of alternatives. To a large extent, consumers construct their
preferences when faced with a specific purchase decision, rather than retrieve pre-
formed evaluations. Moreover, consumers may have needs that they are not aware
of, often referred to as ‘latent needs’. Consumers do not ask for the fulfilment of
these needs and may not have the ability to articulate them. This is because
products, which could fulfil them probably, do not yet exist. Identifying and
understanding such 'latent needs' is of crucial importance, since these needs, if they
were fulfilled, would delight and surprise the consumer (Griffin & Hauser,
1993). Moreover, novel solutions to people's latent needs can differentiate a
product from its competitors and make consumers more loyal (Oliver, Rust &
Varki, 1997).
Second, by directly deriving consumer needs, it is implicitly assumed
that consumers are able to express their needs and wants correctly during personal
and group interviews. However, research has shown that thinking and elaborating
about products or issues leads to more extreme beliefs, preferences or predictions
(Alba & Hutchison, 2000). One prominent stream of research has examined the
effects of instructions to engage in imagination and explanation of a hypothetical
outcome prior to judgement. In his review about experiments that require people to
generate explanations or imagine scenarios, Koehler (1991) found that explanation
tasks affect people's subsequent judgement about an issue. In particular, when
consumers must make forecasts regarding future purchase and usage conditions
it requires substantial thinking and considering of options. As a result, people
become convinced of the reasons they produce and this leads to more extreme
beliefs, preferences, and hence less valid predictions about future market behaviour.
Third, another assumption made when deriving consumer needs directly
is that participants are prepared to tell them to the researcher. However, in a typical
interview, consumers do not share their innermost feelings with a researcher, who is
after all a stranger.

37
Moreover, they may fear being considered irrational and may therefore
be reluctant to admit certain types of (purchasing) motives (Donoghue, 2000).
Instead of questioning consumers directly, they may be asked to respond indirectly.
In indirect approaches, participants are not asked directly why they prefer a product
or which attributes determine their choice.
Consumer needs are inferred from subjects' response to other variables
(like liking, preference) or by interpretation of behaviour by the researcher
(observation).
2.5.8 Structure of Data Collection
The way data is collected in consumer studies varies substantially in its
level of structuredness. Structure is the degree of standardisation imposed on the
data collection instrument (Churchill & Peter, 1995). In highly structured data
collection, the questions to be asked and the responses permitted are completely pre-
determined. An advantage of the structured task is that the obtained responses are
directly in quantitative terms and require no further subjective interpretation on the
part of the researcher. This in turn offers advantages like more speed in data
analysis, lower costs and more convenience for respondents. However, the
researcher must have a good feel for the range and types of responses so that
meaningful and valid response categories can be constructed (Parasuraman,1991).
In a highly unstructured questionnaire or interview, the questions to be asked are
not necessarily presented in exactly the same wording to every participant and
participants are free to respond in their own words. The advantages are that in-depth
and detailed responses can be queried for, which may provide the researcher with
new insights and ideas for the NPD process. A shortcoming of this kind of research
is that the in-depth and idiosyncratic information obtained does not lend itself for
direct use in subsequent analysis. A categorization and quantification step is
required on the basis of subjective interpretation on the part of the researcher. As
such, the personal view of the researcher may affect the way the data are interpreted
and a researcher’s bias can occur as a result from selective observation and
recording of information.

38
2.5.9 Actionability of Output
Applying methods does not necessarily lead to the actual use of their
results. Information will be used if it is perceived to be relevant for the
task for which the receiver is responsible (Moenaert & Souder, 1996; Madhavan &
Grover, 1998).
Consumer research during the opportunity identification phase should
provide understanding what drives consumers’ decision processes and which
factors influence these processes as foundation for the generation and
screening of new product ideas, and concrete input for subsequent technical
development stage (Rochford, 1991; Mascitelli, 2000).
For that reason, it is relevant to evaluate methods on their actionability
in providing critical input to both technical and marketing-related tasks in NPD.
Actionability refers to the ability of information to indicate specific actions to be
taken in order to achieve the desired objective (Shocker & Srinivasan, 1979).
In assessing the actionability of elicited consumer needs, a hierarchy of
concrete product characteristics that form the basis of the technical product
specification to abstract consumer values is distinguished. Product characteristics
are measurable, manipulable and physical properties of products are under the
control of technical product developers (Myers & Shocker, 1981; Shocker &
Srinivasan, 1979). These characteristics are also referred to as 'tangible'. Product
attributes are those characteristics (either intrinsic or extrinsic) that the consumer
infers from the product. Furthermore, consumers desire products not for their
attributes per-se, but rather for the benefits they deliver. The key characteristic
of these benefits is that they reflect what the product does for the consumer. Benefits
are pleasant consequences of consuming a product. Different products can deliver
the same benefit, which implies that benefits are not product specific. Benefits
differ from attributes in that people receive benefits whereas products have
attributes (Myers & Shocker, 1981; Gutman, 1982).

39
2.5.10 Actionability for Technical Product Development
Technical product developers have the task of merging knowledge of
what consumers want with knowledge of what is (technologically) possible. The
more abstract consumer needs are elicited, the less actionable a method is for
technical product development. Product developers need to know how abstract
benefits translate into specific, concrete characteristics sought from desirable
alternatives. Methods that indicate which product attributes and characteristics
consumers use to infer the presence of desired consequences permits clearer
specifications for product development. Important to note is that the relationship
between consumer benefits and product characteristics is not unique. The
number of product characteristics is far greater than the number of attributes
and benefits. Multiple product characteristics can satisfy a product attribute and
multiple attribute combinations can provide the consumer one particular benefit
(Kaul & Rao, 1995).
2.5.11 Actionability for Marketing Oriented Tasks
Marketing-oriented tasks involve the creative phase of finding new
product ideas. When consumer needs are linked too early to product characteristics,
it may kill the creativity in finding really new product ideas. The more abstract
consumer needs are, the more freedom in creativity is felt. Information about
which benefits consumers are seeking in a particular product enlarges the
solution space and prevents thinking within the box of current product delivery. In
this way, it can serve as a source of inspiration. Inspiration, refers to becoming
motivated because of new insights and possibilities being revealed that individuals
would not have recognised on their own (Thrash & Elliot, 2003). Additionally,
it may create a shared understanding and team spirit in the development group
(Slater & Narver, 2000).
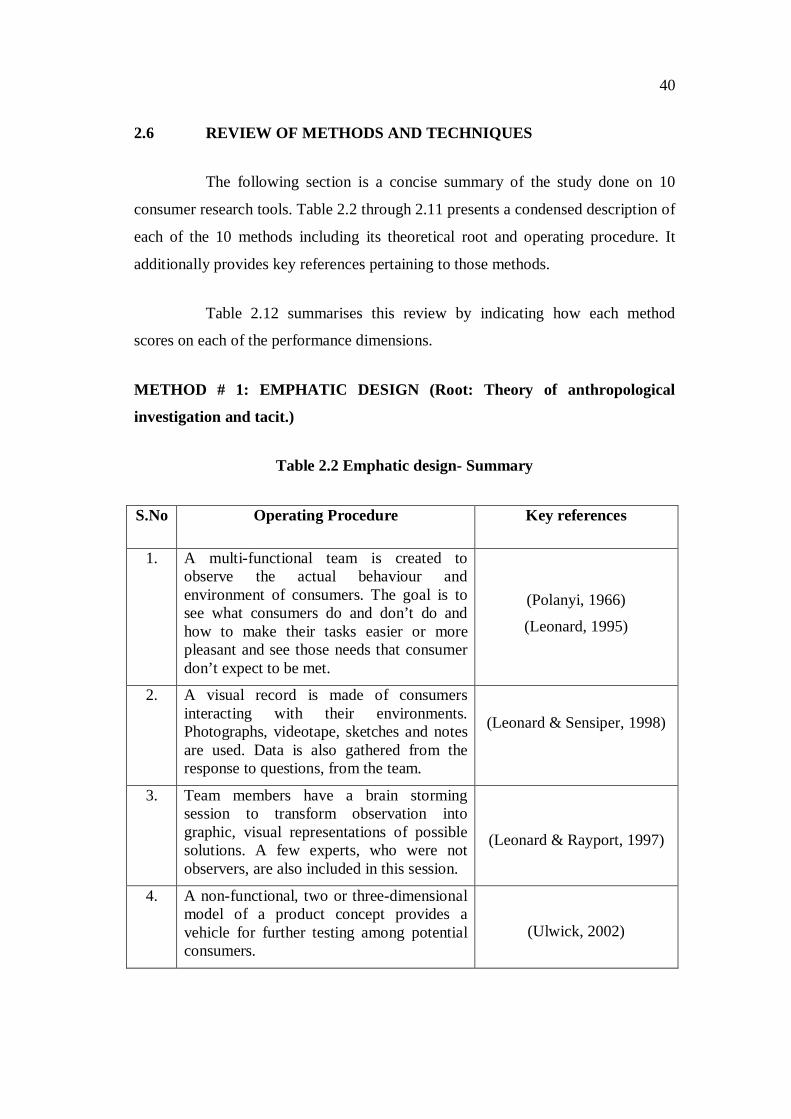
40
2.6 REVIEW OF METHODS AND TECHNIQUES
The following section is a concise summary of the study done on 10
consumer research tools. Table 2.2 through 2.11 presents a condensed description of
each of the 10 methods including its theoretical root and operating procedure. It
additionally provides key references pertaining to those methods.
Table 2.12 summarises this review by indicating how each method
scores on each of the performance dimensions.
METHOD # 1: EMPHATIC DESIGN (Root: Theory of anthropological
investigation and tacit.)
Table 2.2 Emphatic design- Summary
S.No Operating Procedure Key references
1. A multi-functional team is created to observe the actual behaviour and environment of consumers. The goal is to see what consumers do and don’t do and how to make their tasks easier or more pleasant and see those needs that consumer don’t expect to be met.
(Polanyi, 1966)
(Leonard, 1995)
2. A visual record is made of consumers interacting with their environments. Photographs, videotape, sketches and notes are used. Data is also gathered from the response to questions, from the team.
(Leonard & Sensiper, 1998)
3. Team members have a brain storming session to transform observation into graphic, visual representations of possible solutions. A few experts, who were not observers, are also included in this session.
(Leonard & Rayport, 1997)
4. A non-functional, two or three-dimensional model of a product concept provides a vehicle for further testing among potential consumers.
(Ulwick, 2002)

41
METHOD # 2: FOCUS GROUP (Root: None in specific.)
Table 2.3 Focus group- Summary
S.No Operating Procedure Key references 1. A group of participants, usually 8 to 19, sit
together for a more or less open ended discussion about a product or a specific topic.
(Calder, 1977) (McQuarrie & McIntyre, 1986)
2. The discussion moderator lets the participants introduce themselves and feel comfortable and makes sure that the topics of significance are brought up. To help the participants verbalise their needs, interaction between group members is encouraged.
(Bruseberg & McDonagh-Philip, 2002) (McNeill, Sanders & Civille, 2000
METHOD # 3: FREE ELICITATION (Root: Theory of spreading activation.)
Table 2.4 Free elicitation - Summary
S.No Operating Procedure Key references 1. The researcher presents stimulus probes or cues
(usually words) to the participants. (Collins & Loftus, 1975)
2. The participant is asked to rapidly verbalise the concepts that come to mind and that is considered relevant in the perception of the stimulus. For example, when the stimulus is a product name, the objective is to activate all nodes associated with this product name in respondent’s memory. It is assumed that the first mentioned statements are the most important.
(Anderson, 1983)
3. The interview is generally recorded and transcribed before the analysis.
4. Results can be analysed in a variety of ways, depending on the goal of the research, for example by displaying associative networks or classifying statements in meaningful categories.

42
METHOD # 4: INFORMATION ACCELERATION (Root: Diffusion of
innovation and Decision flow models.)
Table 2.5 Information acceleration - Summary
S.No Operating Procedure Key references 1. The researcher constructs a virtual buying
environment that stimulates the information that is available to consumers at the time that they make a purchase decision.
(Urban, Weinberg & Hauser, 1996)
2. Respondents are ‘accelerated’ into the future by providing them alternative future environments that are favourable, neutral or unfavourable, towards the new product. In this virtual buying environment, they are allowed to search for information or shop.
(Urban, Hauser, Qualls, Weinberg, Bohlmann &
Chicos, 1997)
3. Measures are taken to access the respondent’s likelihood of purchase, perceptions and preferences.
4. Based on these measures, a model is developed to forecast sales and simulate strategic alternatives.
METHOD # 5: KELLY REPORTORY GRID (Root: Personal construct theory.)
Table 2.6 Kelly reportory grid - Summary
S.No Operating Procedure Key references 1. The participant is provided with a set of products,
presented in groups of three products. (Kelly, 1955)
(Sampson, 1972) 2. For each triple combination, the participant is asked
to think carefully about the products and decide in what way two of them are similar and at the same time different from the third one.
(Thomson & McEwan, 1988)
3. Having identified the reasons to discriminate between the products, the participant is then asked what they would consider the opposite to be. This procedure is repeated until all the products are evaluated in combinations of there.
(Bech-Larsen & Nielsen, 1999)
4. The attributes (called constructs) are all written down on a grid sheet. A repertory grid is a matrix representation of products and constructs. In addition, all products can be scored against each construct to find out its importance.
5. Grids can be clustered by content analysis, frequency counts, or principal component analysis to analyse what is relevant, similar and different in the eyes of the consumer.
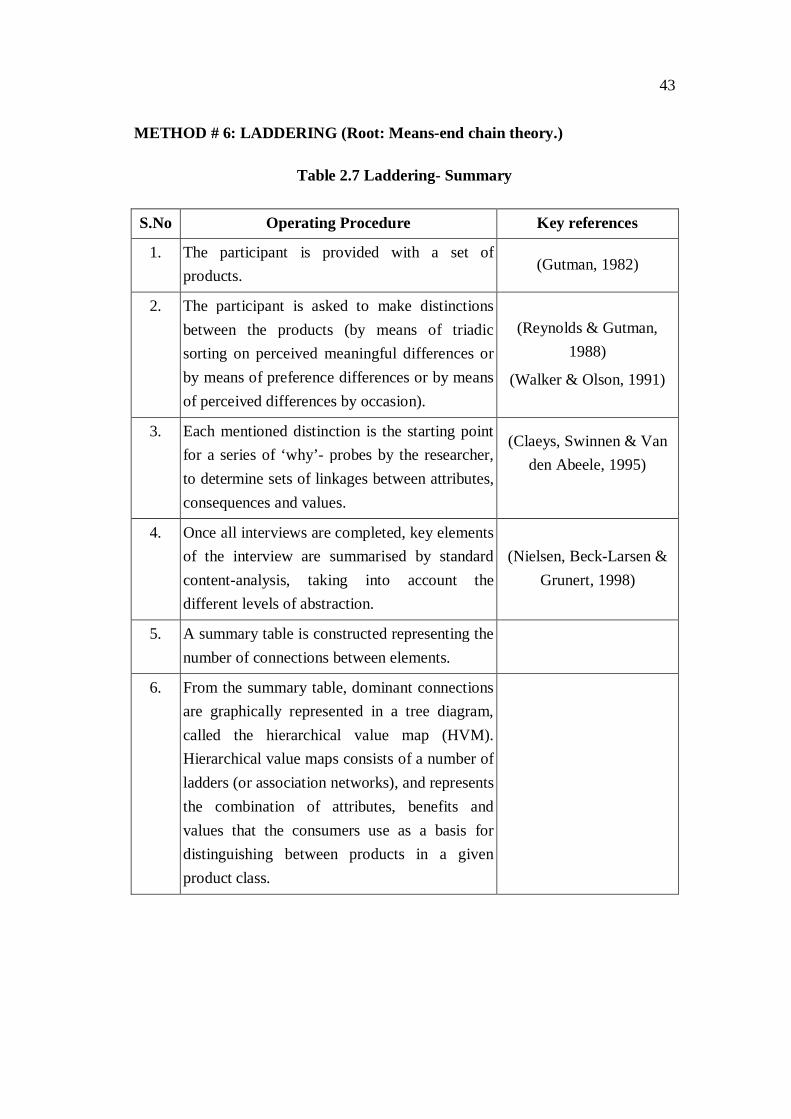
43
METHOD # 6: LADDERING (Root: Means-end chain theory.)
Table 2.7 Laddering- Summary
S.No Operating Procedure Key references
1. The participant is provided with a set of products.
(Gutman, 1982)
2. The participant is asked to make distinctions between the products (by means of triadic sorting on perceived meaningful differences or by means of preference differences or by means of perceived differences by occasion).
(Reynolds & Gutman, 1988)
(Walker & Olson, 1991)
3. Each mentioned distinction is the starting point for a series of ‘why’- probes by the researcher, to determine sets of linkages between attributes, consequences and values.
(Claeys, Swinnen & Van den Abeele, 1995)
4. Once all interviews are completed, key elements of the interview are summarised by standard content-analysis, taking into account the different levels of abstraction.
(Nielsen, Beck-Larsen & Grunert, 1998)
5. A summary table is constructed representing the number of connections between elements.
6. From the summary table, dominant connections are graphically represented in a tree diagram, called the hierarchical value map (HVM). Hierarchical value maps consists of a number of ladders (or association networks), and represents the combination of attributes, benefits and values that the consumers use as a basis for distinguishing between products in a given product class.

44
METHOD # 7: LEAD USER TECHNIQUE (Root: Diffusion of innovation.)
Table 2.8 Lead user technique - Summary
S.No Operating Procedure Key references
1. To identify lead users in a product category of interest, the researcher first identifies underlying trends on which these lead users will have a leading position (eg. By means of expert method ‘Delphi’, trend extrapolation techniques or econometric models)
(Von Hippel, 1986, 1988)
(Urban & Von Hippel, 1988)
2. Lead user indicators are specified by (1) Finding a market or technological trend and related measures. (2) Defining measures of potential benefit (User dis-satisfaction with current products, evidence of active modification of product by the user themselves).
(Herstatt & Von Hippel, 1992)
(Von Hippel, Thomke & Sonnack, 1999)
3. The potential market is screened based on measures specified in the previous steps (eg. By means of a questionnaire) to identify a lead user group.
(Olson & Bakke, 2001) (Lilien, Morrison, Searls,
Sonnack & Von Hippel, 2002)
4. Data from lead users is derived concerning their experience with novel product attributes and product concepts. Creative group sessions are often used to pool user solution content and develop new product concepts. In some cases, a fully implemented product is developed in co- operation with the lead users.
(Von Hippel & Katz, 2002)
5. The products developed by the lead users are evaluated by more typical users in target market.
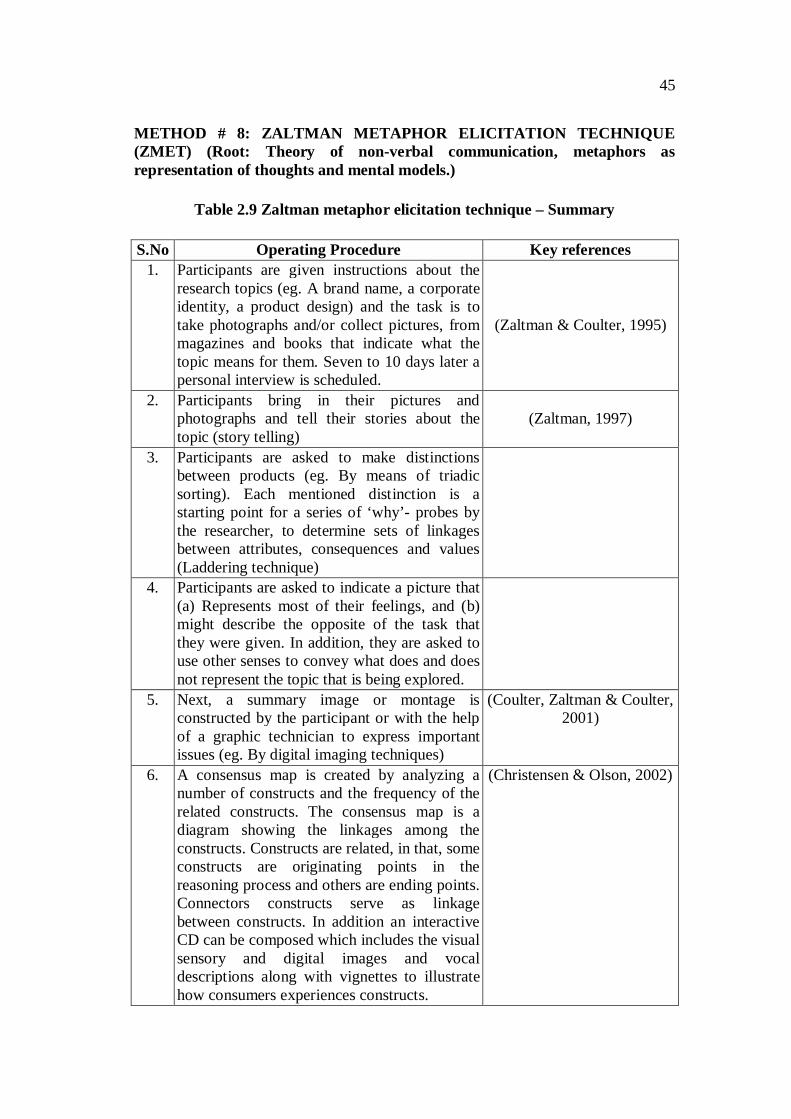
45
METHOD # 8: ZALTMAN METAPHOR ELICITATION TECHNIQUE (ZMET) (Root: Theory of non-verbal communication, metaphors as representation of thoughts and mental models.)
Table 2.9 Zaltman metaphor elicitation technique – Summary
S.No Operating Procedure Key references 1. Participants are given instructions about the
research topics (eg. A brand name, a corporate identity, a product design) and the task is to take photographs and/or collect pictures, from magazines and books that indicate what the topic means for them. Seven to 10 days later a personal interview is scheduled.
(Zaltman & Coulter, 1995)
2. Participants bring in their pictures and photographs and tell their stories about the topic (story telling)
(Zaltman, 1997)
3. Participants are asked to make distinctions between products (eg. By means of triadic sorting). Each mentioned distinction is a starting point for a series of ‘why’- probes by the researcher, to determine sets of linkages between attributes, consequences and values (Laddering technique)
4. Participants are asked to indicate a picture that (a) Represents most of their feelings, and (b) might describe the opposite of the task that they were given. In addition, they are asked to use other senses to convey what does and does not represent the topic that is being explored.
5. Next, a summary image or montage is constructed by the participant or with the help of a graphic technician to express important issues (eg. By digital imaging techniques)
(Coulter, Zaltman & Coulter, 2001)
6. A consensus map is created by analyzing a number of constructs and the frequency of the related constructs. The consensus map is a diagram showing the linkages among the constructs. Constructs are related, in that, some constructs are originating points in the reasoning process and others are ending points. Connectors constructs serve as linkage between constructs. In addition an interactive CD can be composed which includes the visual sensory and digital images and vocal descriptions along with vignettes to illustrate how consumers experiences constructs.
(Christensen & Olson, 2002)
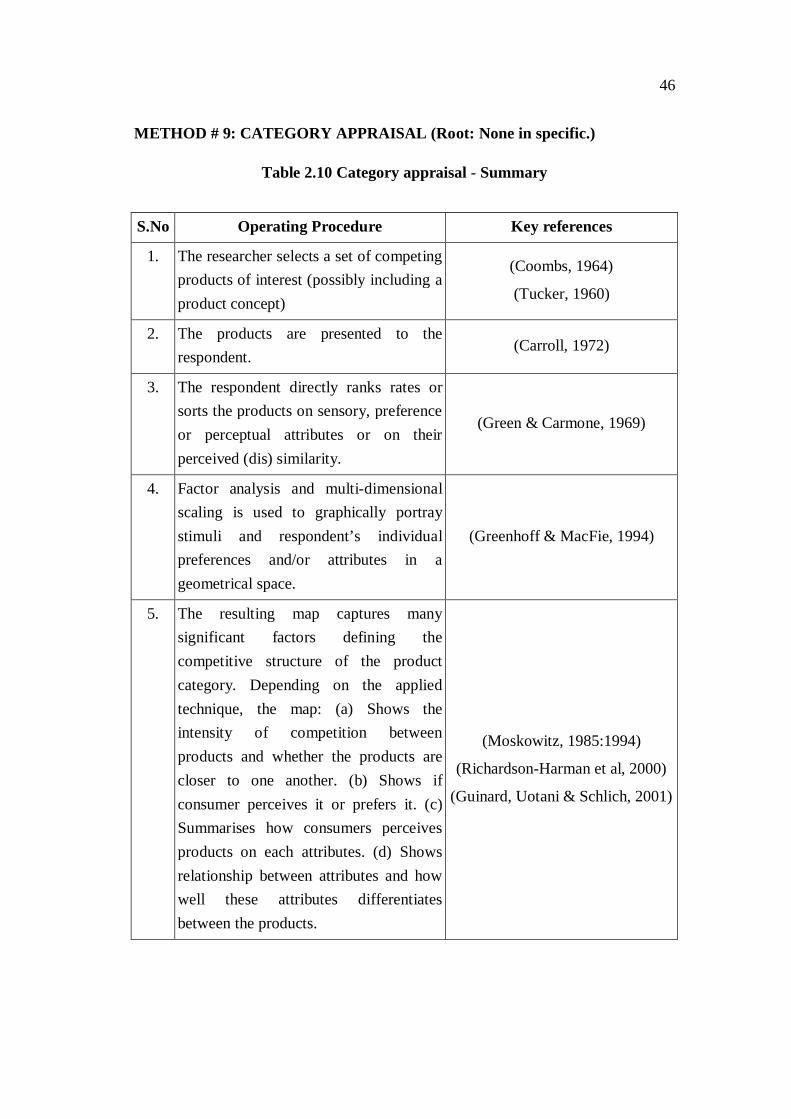
46
METHOD # 9: CATEGORY APPRAISAL (Root: None in specific.)
Table 2.10 Category appraisal - Summary
S.No Operating Procedure Key references
1. The researcher selects a set of competing products of interest (possibly including a product concept)
(Coombs, 1964)
(Tucker, 1960)
2. The products are presented to the respondent.
(Carroll, 1972)
3. The respondent directly ranks rates or sorts the products on sensory, preference or perceptual attributes or on their perceived (dis) similarity.
(Green & Carmone, 1969)
4. Factor analysis and multi-dimensional scaling is used to graphically portray stimuli and respondent’s individual preferences and/or attributes in a geometrical space.
(Greenhoff & MacFie, 1994)
5. The resulting map captures many significant factors defining the competitive structure of the product category. Depending on the applied technique, the map: (a) Shows the intensity of competition between products and whether the products are closer to one another. (b) Shows if consumer perceives it or prefers it. (c) Summarises how consumers perceives products on each attributes. (d) Shows relationship between attributes and how well these attributes differentiates between the products.
(Moskowitz, 1985:1994)
(Richardson-Harman et al, 2000)
(Guinard, Uotani & Schlich, 2001)
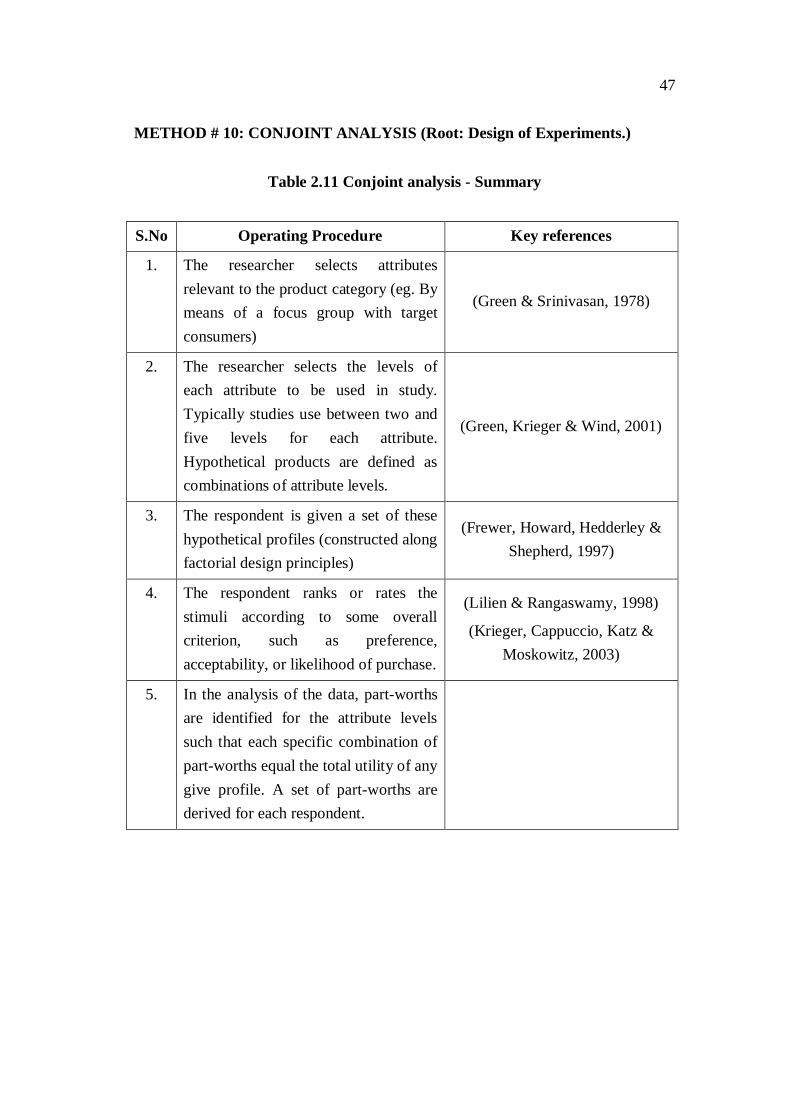
47
METHOD # 10: CONJOINT ANALYSIS (Root: Design of Experiments.)
Table 2.11 Conjoint analysis - Summary
S.No Operating Procedure Key references
1. The researcher selects attributes relevant to the product category (eg. By means of a focus group with target consumers)
(Green & Srinivasan, 1978)
2. The researcher selects the levels of each attribute to be used in study. Typically studies use between two and five levels for each attribute. Hypothetical products are defined as combinations of attribute levels.
(Green, Krieger & Wind, 2001)
3. The respondent is given a set of these hypothetical profiles (constructed along factorial design principles)
(Frewer, Howard, Hedderley & Shepherd, 1997)
4. The respondent ranks or rates the stimuli according to some overall criterion, such as preference, acceptability, or likelihood of purchase.
(Lilien & Rangaswamy, 1998)
(Krieger, Cappuccio, Katz & Moskowitz, 2003)
5. In the analysis of the data, part-worths are identified for the attribute levels such that each specific combination of part-worths equal the total utility of any give profile. A set of part-worths are derived for each respondent.

48
Table 2.12 Utility summary - Consumer research methods
SER
IAL
NU
MB
ER
METHODS
STIMULI TASK FORMAT ACTIONABILITY
PRO
DU
CT/
NEE
D
DR
IVEN
FAM
ILIA
RIT
Y
MU
LTIP
LE/
SIN
GLE
PR
OD
UC
TS
RES
PON
SE
TYPE
SELF
-A
RTI
CU
LATE
D/
IND
IREC
TLY
D
ERIV
ED
STR
UC
TUR
E O
F D
ATA
CO
LLEC
TIO
N
ABS
TRA
CTN
ESS
1. Category Appraisal
Product driven
Familiar Multiple Perceptions/ Preference
Indirectly derived
Structured Characteristics
2 Emphatic Design Need driven
No stimuli presented
No product evaluation
No judgement asked
Indirectly derived
Unstructured Benefits
3 Focus Group Product or Need driven
Familiar/ Unfamiliar
Multiple or single product
Preference Self- articulated
Unstructured Characteristics & Benefits.
4 Free Elicitation Product driven
Familiar Single product
Association Self- articulated
Unstructured Characteristics & Benefits
5 Information Acceleration
Product driven
Unfamiliar Multiple products
Perceptions/ Preference
Self- articulated
Structured Characteristics & Benefits
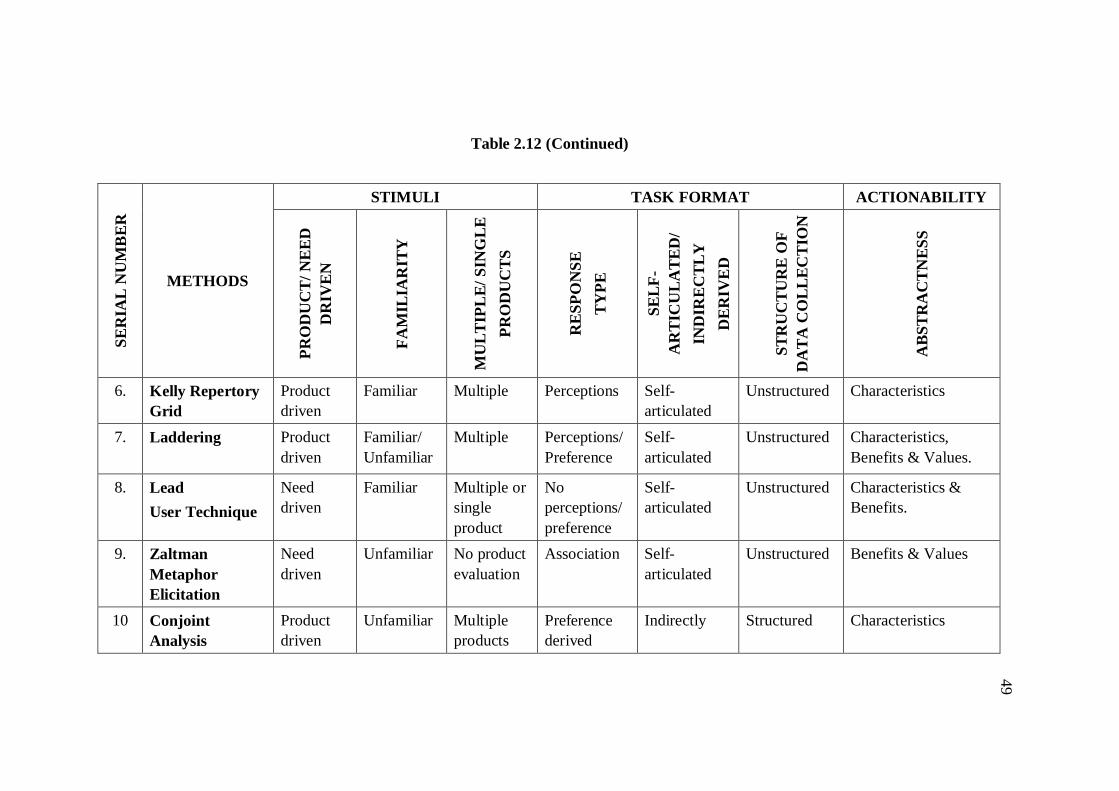
49
Table 2.12 (Continued)
SER
IAL
NU
MB
ER
METHODS
STIMULI TASK FORMAT ACTIONABILITY
PRO
DU
CT/
NEE
D
DR
IVEN
FAM
ILIA
RIT
Y
MU
LTIP
LE/
SIN
GLE
PR
OD
UC
TS
RES
PON
SE
TYPE
SELF
-A
RTI
CU
LATE
D/
IND
IREC
TLY
D
ERIV
ED
STR
UC
TUR
E O
F D
ATA
CO
LLEC
TIO
N
ABS
TRA
CTN
ESS
6. Kelly Repertory Grid
Product driven
Familiar Multiple Perceptions Self- articulated
Unstructured Characteristics
7.
Laddering Product driven
Familiar/ Unfamiliar
Multiple Perceptions/ Preference
Self- articulated
Unstructured Characteristics, Benefits & Values.
8. Lead User Technique
Need driven
Familiar Multiple or single product
No perceptions/ preference
Self- articulated
Unstructured Characteristics & Benefits.
9. Zaltman Metaphor Elicitation
Need driven
Unfamiliar No product evaluation
Association Self- articulated
Unstructured Benefits & Values
10 Conjoint Analysis
Product driven
Unfamiliar Multiple products
Preference derived
Indirectly Structured Characteristics
50
2.7 IMPLICATION OF THE RESEARCH METHODS ON NPD
The aim of consumer research methods early in the NPD process is to
make the VoC heard up-front to facilitate the design of consumer relevant new
products. Research on success and failure factors in NPD ( Cooper, 1988) have
identified that up-front homework, as a key success factor, yet often
overlooked or underdeveloped. This literature survey and the empirical analysis
have identified a comprehensive classification scheme of performance dimensions.
The review and classification reveals that the methods primarily differ in their
degree of actionability for marketing versus R&D and their ability to develop ‘out of
the box’ ideas. The important implication is that the methods are not direct
substitutes. They could be individually or jointly used to NPD, as per the need
(support-marketing versus support-R&D) and the innovation strategy, which is
pursued (winning in existing well-defined markets versus building a new
market through radically new products).
2.8 SUMMARY
This chapter establishes that NPD is important and customer focus
during the ideation stage of the product development cycle is a significant
contributing factor. It was also identified that, the VoC needs to be captured early
during the product pre-design stage. For this 10 available methods were researched
and summarised.
Focus group, Free elicitation, Kelly repertory grid, Laddering, and
Category appraisal are particularly appropriate for incremental new products;
products that are for repositioning or updated versions of existing products. This
optimisation of products is a continuously needed activity to keep up with
competitors and stay cost-efficient. All these methods are product-driven and
consumer needs are primarily elicited with familiar stimuli. Consequently, they
provide insights that are limited by the particular product(s) included in the study,
that is, they elicit consumer needs within an existing framework of what is already
available on the market. Consumers can generally give reliable judgements about
51
new products that are relatively similar to familiar products. Hence, the advantage of
these methods lies in their capacity to capture current needs and desires and
optimise existing products accordingly. However, their limitation lies in the fact that
it is difficult to elicit unfulfilled needs by analysing preferences for products
currently existing in the market. Although they can give clues of which benefits
people are seeking in the near future, these approaches primarily refer to consumer
needs that are widely understood by competitors in a market. A risk of relying on
them is that they are likely to give companies only 'me-too' ideas, which hardly
excite the consumer.
Conjoint Analysis is highly actionable for technical product
development, because it may allow product developers to understand how
consumer needs interrelate and translate to the ‘physical’ domain of product
characteristics. Laddering, Kelly repertory grid, free elicitation and focus
group are more appropriate for marketing purposes, as they reveal more abstract
consumer needs and may change their opinion by the time the product will be
introduced.
Two groups of methods can be distinguished on the basis of their
actionability. The Lead user technique and Information acceleration, both try to
access consumers' unspoken and latent needs, but with a clear link to physical
‘solutions’ against those needs. Information acceleration explicitly takes into
account that consumers might not have the level of product knowledge that is
necessary for judging new products. By creating a simulated future
environment, respondents are guided in understanding what a new product can do
for them. The Lead user technique uses a sample of consumers whose present needs
are expected to become general in the marketplace months or years in the future.
Moreover, Lead users may have developed solutions to problems encountered with
existing problems. However, relying on Lead users can also have its risks.
Their needs many be of limited appeal, perhaps applicable only to other lead
users (Ulwick, 2002). ZMET and the empathic design technique are as well
appropriate for really new products. They are both need-driven in that they focus on
understanding consumer problems or motivations. They specifically focus on the

52
more latent non-articulated needs and hence provide detailed insight into what
really drives consumer behaviour. This information is highly actionable for
marketing purposes (e.g. communication strategy). However, as a downside, this
abstract insight requires additional methods for translation into actual physical
product design.
In summary, consumer research in the early stages of the NPD process
allows product developers to go farther and deeper in understanding consumer
needs, often well beyond what one would understand without them. Table: 2.13 lists
each of the 10 evaluated methods, to establish the superiority of one over the other
on the listed criteria, ( -Yes, - No).
Table 2.13 Final assessment of the 10 consumer research methods
SER
IAL
NO
.
CONSUMER RESEARCH METHODS
APPLICABLE TO FEATURES
REA
L N
EW
PRO
DU
CTS
IN
CR
EMEN
TAL
NEW
PR
OD
UC
TS
EA
RLY
STA
GE
OF
NPD
VER
SATI
LE
EASE
OF
DEP
LOY
MEN
T
STR
UC
TUR
ED
STA
TIST
ICA
L
1. Emphatic Design
2. Focus Group
3. Free Elicitation
4. Information Acceleration
5. Kelly Reportory Grid
6. Laddering
7. Lead User Technique
8. ZMET (Zaltman)
9. Category Appraisal
10. Conjoint Analysis
53
As can be concluded, that there are many consumer research methods,
but Conjoint Analysis lends itself as an objective statistical method, for Products
(when comparing Products and Services) and its development.
2.9 RESEARCH GAP
The importance of NPD is well documented in the available literature.
The method to carry a successful NPD has been well researched. The need for VoC
at the FFE has also been well articulated. Despite all this, about 60 % of all new
products fail. This clearly brings out the lack of a simple but effective tool that can
be easily and commonly applied to NPD for a repeatable success. Conjoint analysis
is likely to fill this gap, owing to its features and versatility, as has been summarised. The
following chapter would give the details of Conjoint Analysis, and a step by step
methodology for its deployment.

54
CHAPTER 3
CONJOINT ANALYSIS
“By three methods we may learn wisdom: First, by reflection, which is noblest;
Second, by imitation, which is easiest; and Third, by experience, which is the
bitterest” – Confucious
3.1 INTRODUCTION
The previous chapter reviews the extant literature and concludes that
consumer research at the pre-design stage is absolutely essential for a successful
NPD. The section also summarised the assessment of 10 selected consumer research
methods that were appropriate for this theme and concluded that Conjoint Analysis
is a preferred tool. This chapter explains the history of Conjoint, its application and
a step by step deployment methodology. This was done to ensure more research in
this field in future, in India.
Conjoint Measurement has its origins in psychology. It was a theory to
decompose an ordinal scale of holistic judgment into interval scales, for each
component attribute. The theory details how the transformation depends on the
satisfaction of various axioms such as additivity and independence. Conjoint
measurement has been explored by several researchers like Luce and Tukey (1964) ;
Krantz and Tversky (1971). But it was Green and Rao’s (1971) article, which brought
out Conjoint Analysis, as a ‘tool’. The advantage of Conjoint Analysis lies in its
ability to identify and measure customer’s evaluation of a product or a service. It is
this feature of Conjoint Analysis that blends itself, so well with Consumer research
and offers itself as an ideal VoC translation tool (Thomas & Chandrasekaran, 2013a).

55
3.2 CONCEPT OF CONJOINT
The concept of Conjoint Analysis may be described (Hair, Anderson,
Tatham & Black, 1998) as follows: “Conjoint Analysis is a multi-variate technique
used specifically to understand how respondents develop preferences for products or
services. It is based on the simple premise that consumers evaluate the value of a
product or service by combining the separate amounts of value provided by each
attribute”. Sudman and Blair (1998) warn that it is not a data analysis procedure
like factor analysis or cluster analysis. It must be regarded as a type of “thought
experiment” on preferences. Kotler (2000) defines Conjoint Analysis as “…a
method designed to show how various elements of products or services (price,
brand, style) predict customer’s ways of deriving the utility values that they attach to
varying levels of a product’s attributes”. Churchill and Iacobucci (2002) refer to
Conjoint Analysis as “conjoint measurement, which relies on the ability of
respondents to make judgments about stimuli”. These stimuli represent some
predetermined combinations of attributes, and during a laboratory experiment,
respondents are asked to make judgments about their preferences for various
attribute combinations. The basic aim, therefore, is to determine the features they
most prefer. From the definitions given above, it is clear that conjoint studies centre
on certain attributes of products and also various levels within each attribute.
Given the increasing intensity of business competition and the strong
trend towards globalization, the attitude towards the customer is very important,
their role has changed from that of a mere consumer to the role of consumer, co-
operator, co-producer, co-creator of value and co-developer of knowledge and
competencies. Furthermore, the complex competitive environment in which
companies operate has led to the increase in customer demand for superior value. To
determine strategically important customer value dimensions, the use of Conjoint
Analysis has been proposed in a recent paper (Thomas & Chandrasekaran, 2013a).
The results of Conjoint Analysis returned a good definition about the importance of
different product attributes in creating value for customers (Thomas &
56
Chandrasekaran, 2013b). Thus it enables one to estimate the value created to
customers with remarkable accuracy. It is also useful for market segmentation
decisions and other improvements that create value for the company. Furthermore,
models based on conjoint data allow predicting the response of the market to
changes in existing product concepts or price before the actual decision is made.
While market research can help us determine the “what” of customer
needs in the marketplace, it rarely explores the “why” sufficiently to uncover
information, and gain insight into how better to stratify offerings and the attributes
of those offerings. This information can help build a strategy for maximizing the
potential of these offerings to specifically targeted segments. In real-life situation
respondents may find it difficult to indicate which attributes they considered and
also how they combined them to form their overall opinion. The value of Conjoint
Analysis lies in the fact that it estimates “how much each of these attributes is
valued, and as Churchill and Iacobucci (2002) state, “the word conjoint has to do
with the notion that the relative values of things COnsidered JOINTtly can be
measured when they might not be measurable if taken one at a time”.
3.3 THE VALUE OF CONJOINT ANALYSIS IN CONSUMER
RESEARCH
In Conjoint Analysis, respondents indicate their preference for a series of
hypothetical multi-attribute alternatives, which are typically displayed as profiles of
attributes. The responses to these profiles are analysed to yield estimates of the
relative importance of the attributes and to build predictive models of consumer
choice for new alternatives. Conjoint Analysis is a dependence technique that has
brought new sophistication to the evaluation of objects or ideas (Hair et al., 1998).
The theory and methods of Conjoint Analysis deal with complex decision-making,
or the process of assessment, comparison, and/or evaluation. Conjoint Analysis
is closely related to traditional experimentation.
57
Conjoint Analysis is actually a family of techniques and methods, all
theoretically based on the models of information integration and functional
measurement (Hair et al., 1998). Utility is a subjective judgement of preference
unique to each individual. It is the conceptual basis for measuring value in Conjoint
Analysis. It is a measure of overall preference because it encompasses all the
features, both tangible and intangible. Utility is assumed to be based on the value
placed on each of the levels of the attributes and expressed in a relationship
reflecting the manner in which the utility is formulated for any combination of
attributes (Hair et al., 1998).
3.4 KEY STEPS WHEN DESIGNING A CONJOINT VALUE
SYSTEM
There are many different Conjoint Analysis methods. The researcher
should weigh each research situation and pick the right combination of tools for the
project. Sudman and Blair (1998) distinguish between an arrangement that uses all
possible combinations of features (full factorial design) and one that uses only some
of the combinations (fractional design). A general rule of thumb, according to these
authors, is to limit the descriptions to no more than 30. Full-profile conjoint value
analysis (CVA) is useful for measuring up to about six attributes (Hair et al., 1998).
CVA calculates a set of utilities for each individual, using traditional full-profile
card-sort (either rating or ranked) or pair-wise ratings. If the full-profile approach is
used, it is important to limit the number of attributes and levels, increase the number
of profiles, or use more parsimonious models (such as the vector or ideal point
models) so as to increase the degrees of freedom for conjoint estimation (Green &
Srinivasan, 1990). Figure 3.1, summarises the selection of Conjoint Analysis
methods and Figure 3.2, details the steps that needs to be carried out, while using the
Conjoint Analysis.
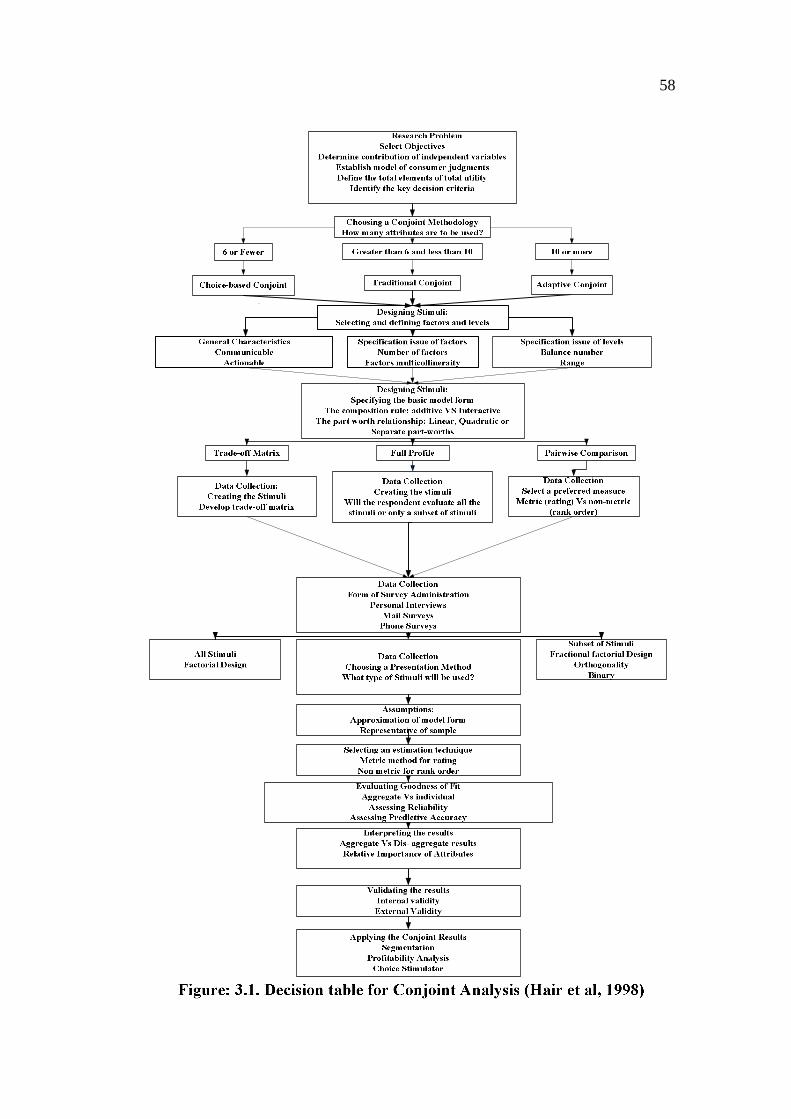
58

59
60
3.5 SUMMARY
Conjoint Analysis places more emphasis on the ability of the product
designer to theorise about the behaviour of choice than it does using other analytical
techniques. The critical interplay between the assumed conceptual model of
decision-making and the appropriate elements of the Conjoint Analysis makes this a
unique multivariate method.
Conjoint Analysis techniques using direct VoC, through the various VoC
translation tools (Thomas & Chandrasekaran, 2013a) ensure that, every VoC is
captured objectively and filtered statistically. Therefore it is credible data, that
product design teams can make use of.
The use of statistical Design of Experiment (DOE) tools ensures that, the
number of ‘experiments’ that needs to be conducted, is optimal, thus saving time
and resources. The use of Conjoint Analysis speeds up the development, rather than,
delay product development. The statistical analysis ensures that the consumer
research data is ‘simplified’ comprehensibly and the resultant, optimal design,
ensures that, it is actionable and executable. Application of Conjoint Analysis, to the
FFE of the NPD, ensures that customer is indeed a king.
The next chapter describes the research methodology, that was adopted
for studying the case, collecting the data, dissecting the data, synthesising the data,
using the statistical tool of Minitab, very innovatively, to apply Conjoint Analysis,
to the re-engineering of a product, that failed in the market place and how it was
resurrected, by this amazing psychometric technique’s application to NPD.

61
CHAPTER 4
RESEARCH METHODOLOGY
“For the things we have to learn before we can do them, we learn by doing them”
– Aristotle.
4.1 INTRODUCTION
The previous chapter introduced the concept and step by step
methodology to execute a Conjoint Analysis. This was necessary as the central
theme of this study is based on this technique.
In this chapter, the step by step process that was adopted for initiating the
case study is explained along with the rationale for selecting the options, at every
step. The chapter begins with the overview, of the circumstance of the real-life case
study followed by the sample size calculation, questionnaire administration and
discussion of the data analysis of the primary data. This thesis on Conjoint Analysis
is a live study that was conducted at a reputed Indian manufacturing company. It is a
B2B product. The customers and consumers were the central players of this case.
The author is a senior leader of that company.
4.2 COMPANY OVERVIEW
The case is about an engineering product (Hydraulic actuation unit for
tipping the truck body) that is designed, developed and supplied by a Tier 1
company (Figure: 4.1 shows the hydraulic tipping unit lifting the body of the truck)
to OEMs (Original Equipment Manufacturer like Tata, Ashok Leyland). The OEMs
supply the truck chassis and the hydraulic actuation unit to the dealers, where the
assembly is done and the vehicle is then sold through the dealers to the end
consumers.

62
Figure 4.1 Truck with the Hydraulic System, in Action
There are essentially three consumers for the Hydraulic system (Figure: 4.2):-
(1) The OEM customer who manufactures the truck chassis and buys
the hydraulic system.
(2) The DEALER, who receives the chassis and builds the truck body
on the chassis after which, the hydraulic system is integrated for
the truck tipping operation for onward sales to the end user. The
dealer also functions as a contact point for all future, service and
spare requirements of the end consumer.
(3) The USER, who buys the Hydraulically operated tipping truck.

63
Figure 4.2 Schematic Showing Three Levels of Customers
The truck tipping units are used for transporting materials like sand,
stones, cement or bulk materials like lime, coal or ore. The vehicles are of different
configurations, like 5 Tons, 10Tons, 25Tons, 40Tons, 65Tons and 100Tons. The
tipping unit is actuated using a hydraulic cylinder, which is operated by a hydraulic
system. Refer Figure 4.3.
Figure 4.3 Hydraulic Schematic of a Truck with Tipping System
64
4.3 PRODUCT AND CASE DETAILS
The hydraulic system consists of an Operating lever, Hydraulic hoses &
control wires, PTO (Power transfer output-A unit which couples the engine to the
pump, to enable driving of the hydraulic pump), Pumps, Valves, Hydraulic
cylinders- Multi stage, Hydraulic hose, Filter and a Hydraulic tank.
The hydraulic pump is coupled, with the engine, the tipper valve is
actuated. Hydraulic oil is pumped into the cylinder, the piston rods actuate, thereby
lifting the tipper, to unload the material that was being carried in the truck.
The hydraulic systems market has different segments like:-
Construction equipment ( JCB backhoe loaders)
Mining (Caterpillar trucks)
Material Handling (Cargotec)
Tipper trucks (Tata)
The Tipper truck segment has two categories:-
Under body tipping (UBT) that serves the, less than 20 Ton vehicles
Front end tipping (FET) that serves the, greater than 20 Ton vehicles
Company B (where this study was done) is a world leader in hydraulic
actuation products in all the segments, except the FET category. Company A is a
leader in the FET category. The FET category is the fastest growing category and it
would eventually replace the UBT category, as well. The 25 Ton FET is the entry
level for the FET market. Company B has to be a leader in the 25 Ton category, to
gain leadership position, in the Tipper truck segment.
65
Company A enjoys, 68 % market share in the 25 Ton FET vehicle
segment, company B has 26 % and the balance share is with many fragmented
competition. Company B, launches a new product, to compete with Company A’s
product offering. This product is rejected by the market and the product is
withdrawn. Despite the company B’s technological prowess and market credibility,
this launch was a disaster. The market share of Company B drops to 11%. Company
B, decides to do a zero based, redesign and re-launch, to try and capture, a
significant market share, in this segment. The thesis is based on this re-design and
re-launch case, where Conjoint analysis is applied to the development process.
Company B carries out a VoC analysis to elicit the direct response from the OEMs,
the various dealers, who assemble the hydraulic system to the vehicle and the end
consumers, who buy and use the product.
4.4 CAPTURING THE VoC (VOICE OF THE CUSTOMER)
This case study was done in India. The hydraulic system is supplied
to 6 different OEMs.
The OEM’s manufacture the truck chassis. They buy the hydraulic
system and supply the truck chassis and the hydraulic system to the
dealer, who builds the truck body, mounts the truck body on the
chassis and integrates the hydraulic actuation system for activating
the tipper truck body for unloading the material. The dealers are
located in various parts of the country, for stocking and carrying
out the sales for the truck tippers to the end users.
In a way, the dealers are a Level 2 customer and the buyer is the
Level 3 customer or end consumer. It is important to capture the
voice of all levels of customer.
66
4.4.1 Study Area
The study area has been restricted to the R&D engineers and
marketing engineers of the company B and the 6 major OEM companies for
capturing the Level 1 VoC and marketing and service professionals from the Dealer
network, for capturing the Level 2 VoC and owners and users of tipper trucks for
capturing the Level 3 VoC.
4.4.2 Research Design
The research design selected is cross sectional. The study is to identify
the factors (Attributes or Features) and the levels (degree of the attribute or feature)
that optimally meet the customer requirement while being technically and
economically viable. The framework so developed ought to be objective, transparent
and repeatable for Product Development.
4.4.3 Instrument Development
The instrument for this research is a questionnaire prepared with 10
sections on a 5 point Likert scale.
4.4.4 Type of Population
Finite Universe – In this study, the plan covered customers who buy and
use the Tipper Trucks, the dealers who are intermediaries in assembly the hydraulic
system and in facilitating this buy, R&D and marketing personnel of the OEM and
R&D and marketing professionals of Company B were covered.
4.4.5 Sampling Unit
Social unit – Company B professionals, R&D and Marketing engineers
of OEM, Dealers , Buyers/ users of the truck tipping units.

67
4.4.6 Population Parameter
For this study, Company B design and marketing professionals, OEM
design and marketing professionals and Dealers with five plus years of experience
in the Truck Tipping solutions were considered. Further criteria used as guidelines
in selecting respondents were – they should be actively involved in NPD programs
in development and they should have influence on new product strategy and/or
execution. Truck owners/ users who have used the Truck Tipping units for at least 5
years were included for the survey.
4.4.7 Sample Size Determination
The data is scaled continuous. Cochran, 1977; Bartlett, Kotrlik and
Higgins ( 2001) suggested a suitable sample size calculation method for a
continuous data. Based on this , with an alpha level of 0.05 having a margin of error
of 0.03 a sample size of 118 was prescribed. Nevertheless for an increased
reliability of the data, the sample size targeted was more than 200 numbers.
4.4.8 Questionnaire and Scale Development
The questionnaire was built with inputs from company B professionals,
OEM professionals, Dealers and over 35 super users (very high user having a fleet
of truck tippers) of the truck tipping units. Features from competitive benchmarking
were collated. Data from previous customer satisfaction survey feedback from the
OEM customer, were analysed and appropriately captured. Discussions with the
company B’s services and field professional were also a rich source of data from the
market. All these factors were listed and grouped within ten major factors. The
Likert scale (Likert, 1932) was used for the factors.
The questionnaire included a short instruction section that described the
research objectives, followed by the survey questions. The respondents were asked
to provide their opinions with reference to the new product related constructs.

68
The study was intended to use cross-sectional data. A cross-sectional
data refers to data collected by observing many subjects, such as individuals, firms
or countries / regions at the same point of time, or without regard to differences in
time. The five level Likert item was developed from 1 to 5.
1 – Strongly disagree
2 – Disagree
3 – Neutral
4 – Agree
5 – Strongly agree
The respondents were asked to indicate the amount of agreement or
disagreement in the above five point scale.
4.4.9 Analytical Tools Adopted for Study
Descriptive statistics were used for quantitative data analysis. The tools
used for Construct Validity were Content Validity, Reliability and Convergent
Validity.
The Content Validity was planned with subject matter experts for
confirming the relevance of the practices.
4.5 FOCUS GROUP
To ensure domain expertise for a highly technological product, like the
hydraulic actuation system depicted in the study, a Focus Group of 12 participants
consisting of 6 OEM’s Product designers and Marketing specialists, 1 designer from
the dealer where the body is built and the hydraulic system is integrated on the
chassis and 5 designers and field service engineers from company B.
69
Focus groups are a form of a group interview that capitalizes on
communication between research participants in to order to generate meaningful and
prioritized data, for action. The group dynamics takes the research to a new elevated
level (Kitzinger, 1994)
Stages of Focus Group
For a structured and a meaningful closure, the focus group actions were
deployed covering the following 5 stages:-
Purpose
Sampling
Facilitation
Analysis
Reporting
4.5.1 Purpose
The goal of the focus group was to discuss/ debate and arrive at a rational
construct prioritising the 5 Attributes.
4.5.2 Sampling
The focus group had designers and marketing specialists with domain
expertise and VoC understanding of all the levels of the customer. A focus group is
most effective with 7-12 participants (Greenbaum, 1997).
4.5.3 Facilitation
The general components of the facilitation stage are preparation, pre-
session and the session itself. The author of this thesis was the facilitator and a
research assistant was designated as a note taker.
70
4.5.4 Analysis
The analysis stage crystalises the focus group’s discussion to reach a
conclusion which is logical and has consensus. Data reduction is the key output in
the analytical stage.
This data reduction was achieved by using the Multi-voting or Nominal
Group Technique (NGT). This technique is used to reduce a long list of items to a
manageable number, by means of a structured series of votes (Delbecq, Van de Ven,
Gustafson, 1975). The NGT ultilises the mathematical aggregation of group
judgements to come to a group decision. The theory was discussed by Van de Ven
and Delbecq (1972). The advantages over conventional means for coming to a group
decision (consensus or majority) were described by Delbecq, Van de Ven and
Gustafson (1975).
4.5.5 Reporting
The final list of attributes showing the top 5, were presented to the team
and a detailed discussion was initiated, to elicit the rationale for selecting the
attribute. The consensus was once again confirmed and a formal signoff along with
a confidentiality agreement was also secured, as it pertained to a refreshed new
product launch.
4.6 APPLICATION OF CONJOINT ANALYSIS
There are many tools to study consumer behaviour and consumer choice
analysis. In Chapter 2, it has been evaluated and assessed, that Conjoint Analysis is
a unique tool that could be used for statistically assessing the weightage that a
customer apportions, for each of the attributes and perhaps apply this to design a
customer preferred product.

71
4.6.1 Which Conjoint Analysis Method to be used?
There are many different methods of Conjoint Analysis. A few of them
have been listed here.
Traditional Full-Profile Conjoint Analysis
Adaptive Conjoint Analysis
Choice-Based Conjoint Analysis
Partial-Profile Choice-Based Conjoint Analysis
Adaptive Choice-Based Conjoint Analysis
From the above list the Choice-Based Conjoint Analysis was chosen as it
met the following criteria laid out by Bryan (2010):-
The number of attributes, that has been shortlisted and prioritized is
small (5 Attributes only).
It is a highly technological product.
4.6.2 Choosing the Attributes and Levels
The focus group activity finalised the top 5 attributes. Determination of
the number of levels is a key next step. The number of levels determination has a
significant bearing on the conjoint experiment. This concern is called the number-
of-levels effect (Currim, Weinberg & Wittink, 1981). Bryan (2010) states that, if the
attribute is qualitative (eg. Brand value), then the number of levels need to be more
than 2. But if the attribute is quantitative, like it is in this study, the levels can be 2.
72
4.6.3 Conducting the Conjoint Experiment
Conjoint Analysis is usually applied using software called SPSS
(Statistical package for social sciences). SPSS is expensive and not widely
available, with the automotive manufacturing companies.
It emerged that if Conjoint using SPSS is recommended, then it may not
find a lot of takers. This is purely because SPSS would not be available and SPSS
trained members may not be readily available. Therefore Conjoint using SPSS had
constraints. The thesis aims at making this a practical study which would be adopted
by companies big and small, for their new product development. With this premise,
Minitab was experimented for conducting the Conjoint Analysis.
The scholar had prior experience with the Minitab software, which is the
Quality management software available widely with manufacturing companies.
Minitab is popular due to its general use for Six Sigma Quality Management
initiatives. Six-Sigma is well known and is getting very popular in India. After
carrying out experiments to assure the validity of Minitab for Conjoint analysis by
comparing the data with SPSS, a full scale deployment was executed. The results
were statistically analysed and Minitab was considered fit, for Conjoint analysis.
Following steps explain the Conjoint experiment:-
The DOE (Design of Experiments) utility of Minitab was used to
create a list of ‘experiments’ or ‘product configurations’. With 5
attributes, each at 2 levels, 25 combinations of products is possible.
The output was a list of 32 different design combination of the
product. In short, a designer could view 32 different product
offerings, which have the VoC incorporated.

73
The 32 combinations were ranked by a Focus group approach.
Conjoint experiment was initiated on the top 5 Product Design
using Minitab. The output was the Conjoint part-worth utility
equation. The equation showed the weightage that the customers
placed for each of the attributes.
The re-design effort did not stop here. It could have been, wherein
the designers would have, had to use various permutation
combinations manually (using computers) to simulate the Product
Designs, using the utility equation, which would have been time
consuming and would have only given finite choices.
The study, very innovatively, adopted the Surface Modelling utility
of the Minitab software, to simulate the designs to arrive at an
optimal solution, by varying infinitely (within the range) the
various attributes and level combinations. This led to the
crystallisation of the optimal design.
4.7 VOICE OF THE CUSTOMER (VoC) TRANSLATION USING
QUALITY FUNCTION DEPLOYMENT (QFD)
The optimal design based on the Conjoint experiment are in Customer
Attribute terms. This needs to be translated into Engineering Attribute terms. For
this, the QFD tool was used. (Figure: 4.4)
QFD is “an overall concept that provides a means for translating
customer requirements into the appropriate technical requirements for each stage of
product development and production”. (Sullivan, 1986)

74
Figure 4.4 QFD ‘The House of Quality’ ( Wheelwright & Clark, 1992)
The translation of the VoC into the Voice of the Design engineer (VoD)
is important, as the product has to be designed using design parameters. The QFD
output alone is summarised in this study, as the focus of the research is on Conjoint
Analysis.
The product was prototyped, tested, validated. Corrections were made
based on the prototype evaluation and then it was productionised and launched.
4.8 SUMMARY
Research offers a variety of tools. It is important to choose the right
tools, in the right combination and in the correct sequence, to get the desired result.
This chapter explained the methodology that was used, to translate the VoC, into a
meaningful product, objectively and statistically. In the process, uncovering Minitab
as a platform for conducting Conjoint analysis for product design. The following
chapter gives the detailed results and its interpretation for the designer, in this design
journey, using a new methodology.

75
CHAPTER 5
CASE STUDY-APPLICATION OF CONJOINT ANALYSIS TO
THE FUZZY FRONT END OF THE PRODUCT DESIGN
“The wise sees knowledge and action as one; they see truly”
-Bhagawad Gita
5.1 INTRODUCTION
The previous chapter illustrated the research methodology prescribed for
the case-study. This chapter details the step by step methodology. Conjoint Analysis
has thus far been a social science tool. The question of psychological choice
behaviour of a consumer is well answered by Conjoint analysis. Why do people
choose Apple’s iPhone over Samsung’s phone, despite the same price and
functionalities? While choosing, which attribute of the competing product was
evaluated and sacrificed and why? What ‘value’ was placed on the attribute of the
competing product and the chosen product’s attribute, that helped make a choice?
Conjoint analysis provides extremely useful and sensitive answers. It is this feature
of Conjoint Analysis that may be useful to the Product Designers, when used at the
‘Fuzzy front end’ of the design. This case study attempts to validate this hypothesis.
Conjoint Analysis is traditionally applied using SPSS Software, which is
expensive, rare and does not have the ability for visual simulation. This thesis
demonstrates the pioneering use of Minitab software for Conjoint Analysis. Minitab
is commonly available, as it is a Quality Management tool and with the wave of Six
Sigma initiatives, most of the medium and large scale manufacturing companies in
India, have access to it. The following section explains the step by step procedure
used for capturing the VoC, applying Conjoint Analysis using Minitab, to arrive at

76
the OPTIMISED design, translating the customer attribute into VoD using the QFD
and then manufacturing the product.
5.2 CAPTURING THE VoC & APPLICATION OF CONJOINT
ANALYSIS DURING THE FFE STAGE
The following figure (5.1) depicts the traditional stage, where VoC is
captured. The product is completely ready for the launch. Very few changes, if at all
can be done to the product, at this stage. The VoC, at this stage may be useful only
to help steer the advertisement strategy, geographic launch spots and perhaps
cosmetic suggestions for product packaging etc. There are numerous automotive
examples where such changes have been initiated, after a product launch. Toyota
Etios, Tata Nano have spent 100 of crores of rupees, to ‘refresh’ their product, post a
launch.
Figure 5.1 Traditional Stage of VoC Capturing
Capturing the VoC and INCORPORATING it into PRODUCT DESIGN,
is the ideal way to create a product with the market and customer in mind. Using
Conjoint Analysis, at this early stage, ensures that an OBJECTIVE and
STATISTICAL tool is used, which yields saved COST, TIME, EFFORT and
guaranteed LAUNCH SUCCESS.
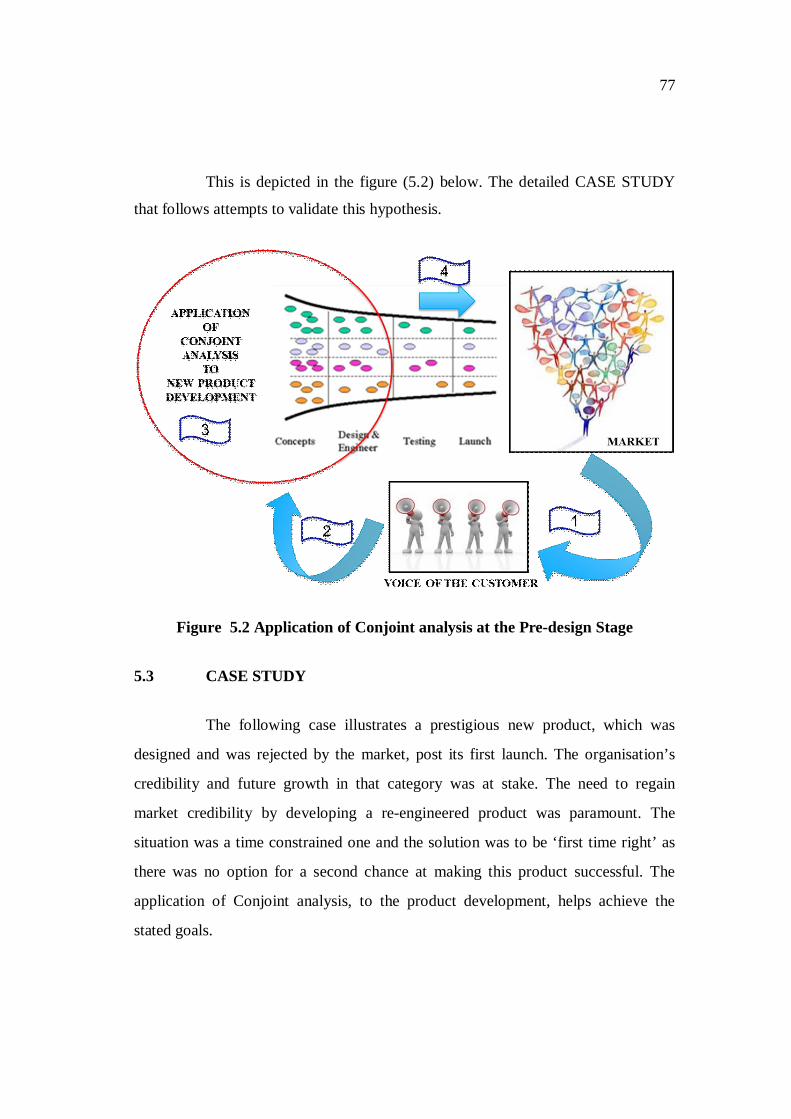
77
This is depicted in the figure (5.2) below. The detailed CASE STUDY
that follows attempts to validate this hypothesis.
Figure 5.2 Application of Conjoint analysis at the Pre-design Stage
5.3 CASE STUDY
The following case illustrates a prestigious new product, which was
designed and was rejected by the market, post its first launch. The organisation’s
credibility and future growth in that category was at stake. The need to regain
market credibility by developing a re-engineered product was paramount. The
situation was a time constrained one and the solution was to be ‘first time right’ as
there was no option for a second chance at making this product successful. The
application of Conjoint analysis, to the product development, helps achieve the
stated goals.

78
5.3.1 Capturing the Voice of the Customer (VoC)
The product is an engineering product and the consumers are at three
different levels. This increased the complexity of accurately capturing the VoC in a
simple straight forward way. A questionnaire was prepared and administered to over
200 consumers. The sample size of 200 plus was chosen, to ensure a good coverage
of all the regions in India and be enable capturing a statistically significant
representative data for the entire population. The dealers in the extreme far east of
India and dealers of Nepal, Bangladesh and Sri-lanka have been excluded from the
study, for reasons of cost and time. However, it has been assessed, that this
exclusion would have no bias on the study. The questionnaire was deployed by the
company’s own sales engineers, who represent the various marketing regions,
within India, after extensive training conducted by survey specialists, at a two day
session, covering all the engineers, so that there is uniformity in asking the questions
and recording the responses without ‘bias’ while ‘capturing the VoC’.
5.3.2 Drill down the VoC as per Rank order using the Focus Group
A focus group, or focus group interview, is a qualitative research tool
used in social research, business and marketing. Focus groups are "small group
discussions, addressing a specific topic, which usually involve 7-12 participants,
either matched or varied on specific characteristics of interest to the researcher".
(Fern, 1982; Morgan & Spanish, 1984). Focus groups require skilled facilitators or
moderators to guide the discussion and maintain the focus.
The MULTIVOTING methodology was used by the Focus Group to
discuss the inputs from the questionnaire, rank them and choose the top 5 attributes.
The Nominal Group Technique (NGT), or multi-voting technique, is a methodology
for achieving team consensus quickly when the team is ranking several options or
alternatives or selecting the best choice among them. The method basically consists
of having each team member come up with their personal ranking of the options or
79
choices, and collation of everyone's rankings into the team consensus. The nominal
group technique is good for:
Ensuring equal participation of each member of the team when the
team is making a choice among or ranking several options or
alternatives;
Building everyone's commitment to whatever choice or ranking the
team makes because everyone was given a fair chance to
participate;
Eliminating peer pressure in the team's selection/ranking process;
Preventing dominant members from controlling the quiet ones; and
Making the team's consensus (or lack of it) visible, allowing the
major points of disagreements to be discussed and settled
objectively.
As the name suggests, the voting is done multiple number of times with
detailed discussion before the voting and in between the voting rounds. There were
21 attributes representing the top 80% customer spoken attributes. A focus group,
consisting of 12 members, one each from the 6 leading OEM’s, 5 from company B
(Designer and producer of the hydraulic system) and 1 design engineer from the
dealer cum body-builder, was created. This ranking and drill down activity, is a
technically intensive one and it needs domain expertise (Technical and Marketing
members involved with Hydraulic systems). After 2 rounds of multi-voting, the
focus group, arrived at a consensus on 5 of the Attributes, that they considered, as
the most important, customer preferred attributes. Table 5.1 depicts the ranking and
the scores after each of the voting rounds.
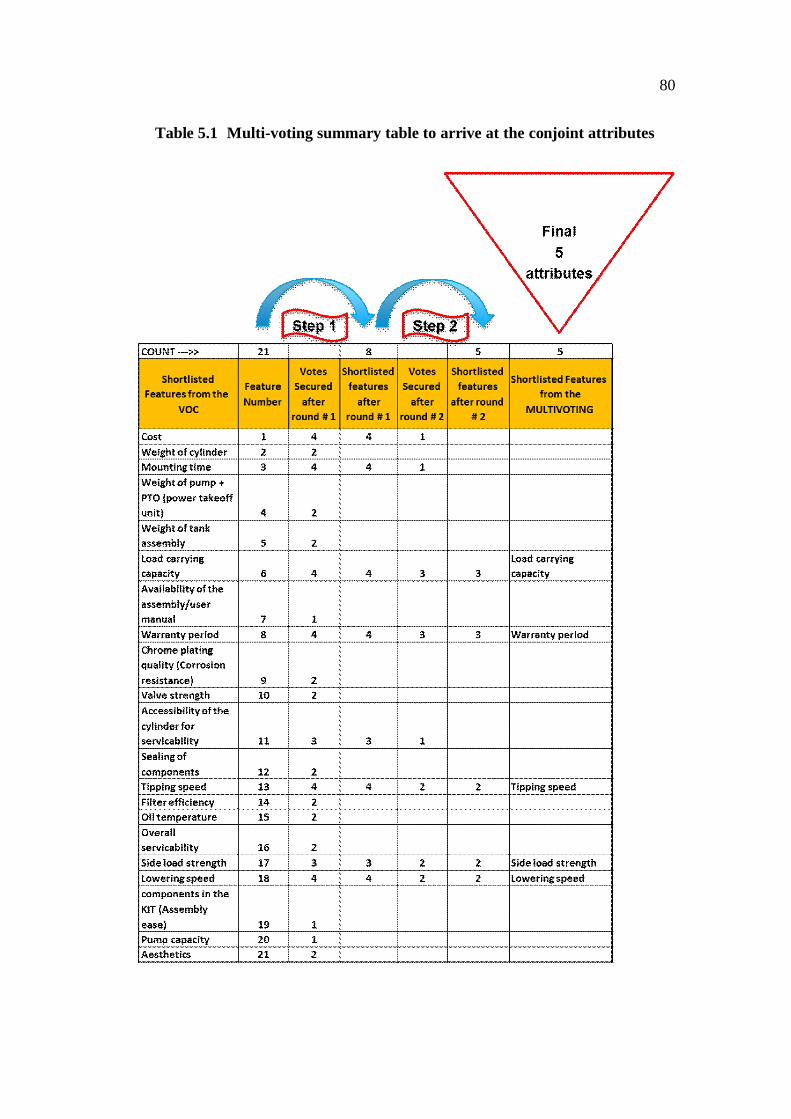
80
Table 5.1 Multi-voting summary table to arrive at the conjoint attributes
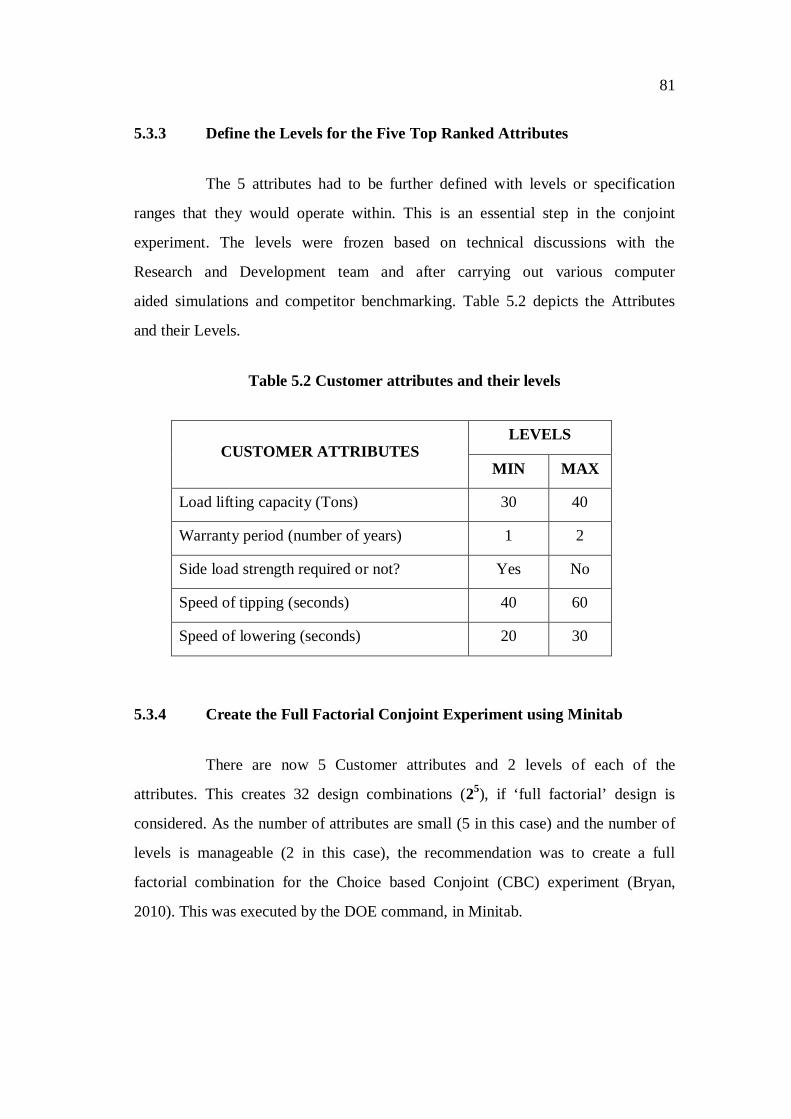
81
5.3.3 Define the Levels for the Five Top Ranked Attributes
The 5 attributes had to be further defined with levels or specification
ranges that they would operate within. This is an essential step in the conjoint
experiment. The levels were frozen based on technical discussions with the
Research and Development team and after carrying out various computer
aided simulations and competitor benchmarking. Table 5.2 depicts the Attributes
and their Levels.
Table 5.2 Customer attributes and their levels
CUSTOMER ATTRIBUTES LEVELS
MIN MAX
Load lifting capacity (Tons) 30 40
Warranty period (number of years) 1 2
Side load strength required or not? Yes No
Speed of tipping (seconds) 40 60
Speed of lowering (seconds) 20 30
5.3.4 Create the Full Factorial Conjoint Experiment using Minitab
There are now 5 Customer attributes and 2 levels of each of the
attributes. This creates 32 design combinations (25), if ‘full factorial’ design is
considered. As the number of attributes are small (5 in this case) and the number of
levels is manageable (2 in this case), the recommendation was to create a full
factorial combination for the Choice based Conjoint (CBC) experiment (Bryan,
2010). This was executed by the DOE command, in Minitab.

82
Factorial design allows for the simultaneous study of the effects that
several factors may have on a process. When performing an experiment, varying the
levels of the factors simultaneously rather than one at a time is efficient in terms of
time and cost, and also allows for the study of interactions between the factors.
Interactions study is the key, in complex problems. Without the use of factorial
experiments, important interactions would remain undetected.
In a full factorial experiment, responses are measured at all combinations
of the experimental factor levels. Each combination of factor levels represents the
conditions at which a response measure will be taken. Each experimental condition
is called a ‘run’ and each measure an ‘observation’.
The figures below show a two and three factor design. Points on the
figure, represents the experimental runs that are performed.
Figure 5.3 Factorial Design

83
Step # 1 : Create factorial design
The following screen shots, would explain the step-by-step methodology
that was adopted, to arrive at the 32 different combinations (Figure 5.4).
Figure 5.4 Creation of Factorial Designs
Step # 2 : Select 2 level factorial, specify the number of factors (Attributes)
as 5 (Figure 5.5)
Figure 5.5 Specifying Factors and Levels
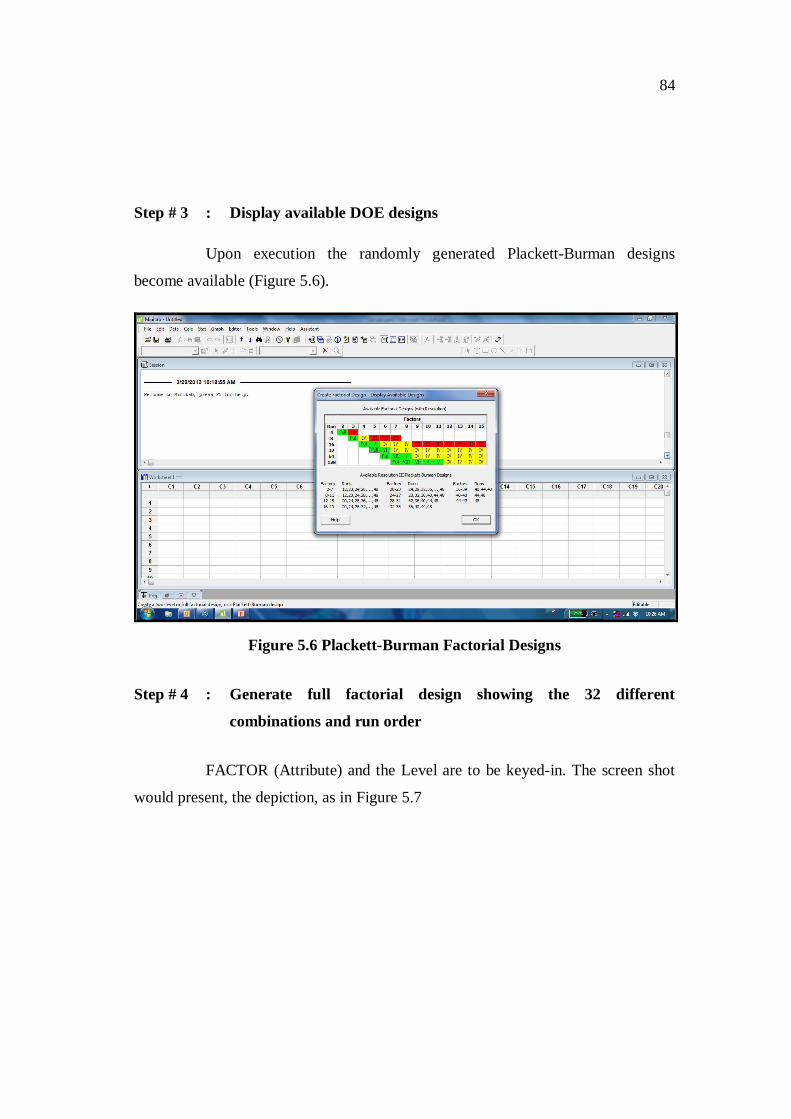
84
Step # 3 : Display available DOE designs
Upon execution the randomly generated Plackett-Burman designs
become available (Figure 5.6).
Figure 5.6 Plackett-Burman Factorial Designs
Step # 4 : Generate full factorial design showing the 32 different
combinations and run order
FACTOR (Attribute) and the Level are to be keyed-in. The screen shot
would present, the depiction, as in Figure 5.7

85
Figure 5.7 Attributes and Levels Data
Step # 5 : Creating the run order (Figure: 5.8)
Figure 5.8 Experimental Run Order Creation
The output has been translated in Table 5.3.
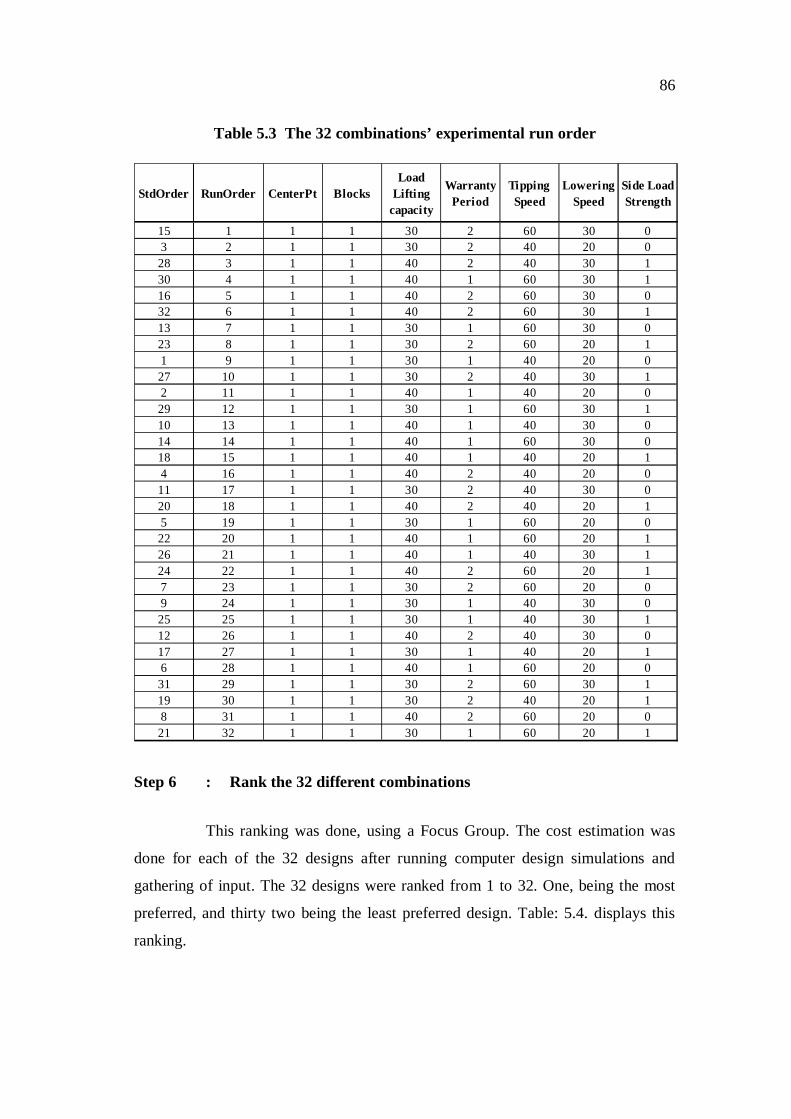
86
Table 5.3 The 32 combinations’ experimental run order
StdOrder RunOrder CenterPt BlocksLoad
Lifting capacity
Warranty Period
Tipping Speed
Lowering Speed
Side Load Strength
15 1 1 1 30 2 60 30 03 2 1 1 30 2 40 20 028 3 1 1 40 2 40 30 130 4 1 1 40 1 60 30 116 5 1 1 40 2 60 30 032 6 1 1 40 2 60 30 113 7 1 1 30 1 60 30 023 8 1 1 30 2 60 20 11 9 1 1 30 1 40 20 027 10 1 1 30 2 40 30 12 11 1 1 40 1 40 20 029 12 1 1 30 1 60 30 110 13 1 1 40 1 40 30 014 14 1 1 40 1 60 30 018 15 1 1 40 1 40 20 14 16 1 1 40 2 40 20 011 17 1 1 30 2 40 30 020 18 1 1 40 2 40 20 15 19 1 1 30 1 60 20 022 20 1 1 40 1 60 20 126 21 1 1 40 1 40 30 124 22 1 1 40 2 60 20 17 23 1 1 30 2 60 20 09 24 1 1 30 1 40 30 025 25 1 1 30 1 40 30 112 26 1 1 40 2 40 30 017 27 1 1 30 1 40 20 16 28 1 1 40 1 60 20 031 29 1 1 30 2 60 30 119 30 1 1 30 2 40 20 18 31 1 1 40 2 60 20 021 32 1 1 30 1 60 20 1
Step 6 : Rank the 32 different combinations
This ranking was done, using a Focus Group. The cost estimation was
done for each of the 32 designs after running computer design simulations and
gathering of input. The 32 designs were ranked from 1 to 32. One, being the most
preferred, and thirty two being the least preferred design. Table: 5.4. displays this
ranking.

87
Table 5.4 Ranked designs along with estimated cost
StdOrder RunOrder CenterPt Blocks
Load Lifting
capacity (Tons)
Warranty Period (Years)
Tipping Speed
(Seconds)
Lowering Speed
(Seconds)
Side Load Strength
(Required= 1 /Not
required= 0 ) Coded values
Ranking Cost (INR)
15 1 1 1 30 2 60 30 0 18 687503 2 1 1 30 2 40 20 0 19 6250028 3 1 1 40 2 40 30 1 11 7125030 4 1 1 40 1 60 30 1 7 6250016 5 1 1 40 2 60 30 0 10 7125032 6 1 1 40 2 60 30 1 12 6500013 7 1 1 30 1 60 30 0 29 6250023 8 1 1 30 2 60 20 1 21 712501 9 1 1 30 1 40 20 0 27 6250027 10 1 1 30 2 40 30 1 20 687502 11 1 1 40 1 40 20 0 8 6500029 12 1 1 30 1 60 30 1 25 6500010 13 1 1 40 1 40 30 0 5 7125014 14 1 1 40 1 60 30 0 15 6875018 15 1 1 40 1 40 20 1 14 712504 16 1 1 40 2 40 20 0 2 6250011 17 1 1 30 2 40 30 0 24 6875020 18 1 1 40 2 40 20 1 1 625005 19 1 1 30 1 60 20 0 26 6500022 20 1 1 40 1 60 20 1 13 6875026 21 1 1 40 1 40 30 1 6 6875024 22 1 1 40 2 60 20 1 4 625007 23 1 1 30 2 60 20 0 23 687509 24 1 1 30 1 40 30 0 28 6250025 25 1 1 30 1 40 30 1 30 6500012 26 1 1 40 2 40 30 0 9 7125017 27 1 1 30 1 40 20 1 32 650006 28 1 1 40 1 60 20 0 16 6875031 29 1 1 30 2 60 30 1 22 6500019 30 1 1 30 2 40 20 1 17 712508 31 1 1 40 2 60 20 0 3 7125021 32 1 1 30 1 60 20 1 31 65000
Step # 7 : Initiate conjoint analysis using Minitab
In the Minitab file, the ranking and the cost data are keyed in along- side
the respective experiments (for each of the 32 design options). Next, the Conjoint
Analysis is performed. (Figures 5.9 to 5.14)

88
Figure 5.9 Initiating Conjoint Analysis
Step # 8 : Select the factors (Figure: 5.10)
Figure 5.10 Attributes Selection

89
Step # 9 : Confirming the values of levels
This would automatically be picked up by the software, however, it is a
cross-check step to see, if the values of those attributes, are indeed, what was
intended. This is shown in Figure: 5.11.
Figure 5.11 Values of Levels Confirmation
Step # 10 : Analyse the response surface design. (Table: 5.12)
Figure 5.12 Initiating the Response Surface Analysis
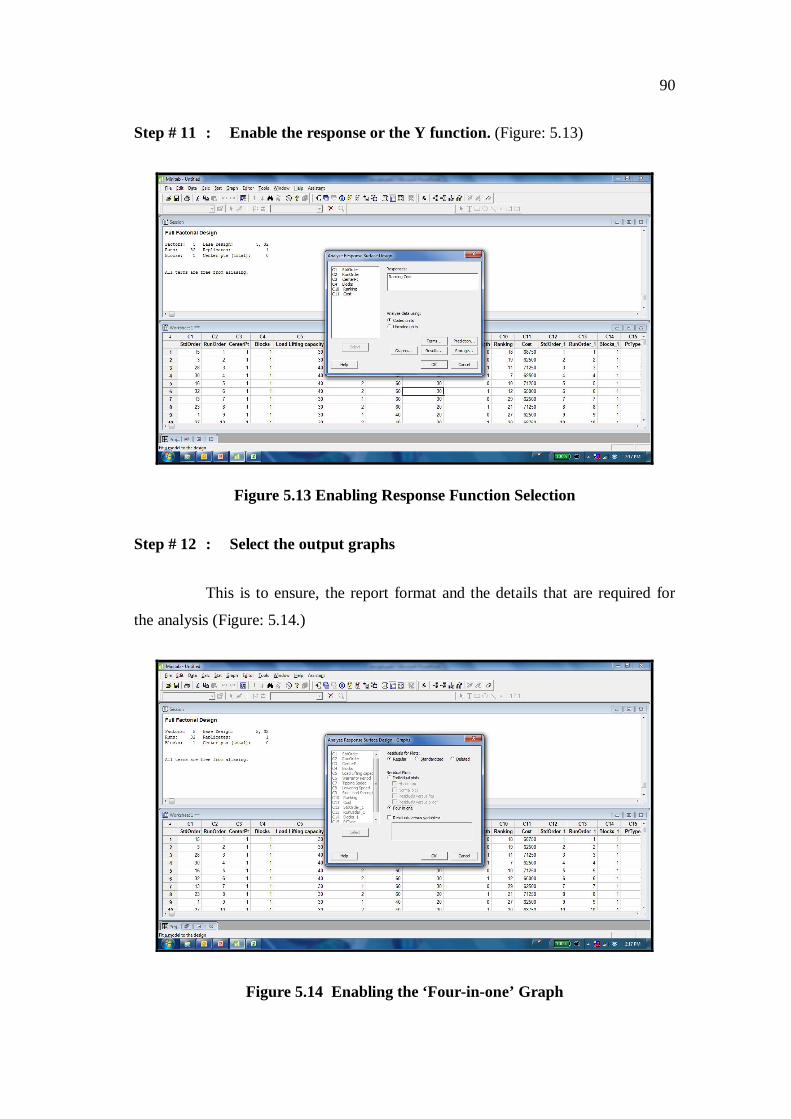
90
Step # 11 : Enable the response or the Y function. (Figure: 5.13)
Figure 5.13 Enabling Response Function Selection
Step # 12 : Select the output graphs
This is to ensure, the report format and the details that are required for
the analysis (Figure: 5.14.)
Figure 5.14 Enabling the ‘Four-in-one’ Graph

91
Step # 13 : Run conjoint analysis
The Conjoint Analysis is executed, providing the output, shown from
the Figure: 5.15 to Figure: 5.17.
5.3.5 Statistical Terms and their Interpretation
The following statistical terms would be used to explain the statistical
output. The interpretation of the output would be explained along with the
respective graphical outputs.
(alpha) Value
The -level is the probability of rejecting the null hypothesis when the
null hypothesis is really true, that is, finding a significant difference when one does
not really exist. This probability ( ) is also called the level of significance.
The level for the test is determined considering the seriousness of
detecting association, when in reality, the association does not exist. The more
serious, the impact of the error, the less often, it would be allowed to occur.
Therefore it is recommended that a smaller probability value be assigned. The Level
of significance is defined as 1- (Level of confidence). Usually a 95% level of
confidence is chosen. This means the Alpha value for this would be 1-0.95= 0.05.
For the case study = 0.05 has been selected.
p Value
The p value signifies the probability that the null hypothesis is true. The
p value is compared with Alpha or the Level of significance. If the p value is less
than 0.05, the null hypothesis is rejected. This indicates that the factor is statistically
significant.

92
Statistical Significance
Statistical significance means that the observed association between the
predictor and the response is not likely to be a result of chance.
The coefficient table lists the estimated coefficients for the predictors.
Linear regression examines the relationship between a response and predictor. In
order to determine whether or not the observed relationship between the response
and predictors is statistically significant, the following criteria have to be applied:-
Identify the coefficient p-values: The coefficient value for P
(p-value) tells whether or not the association between the response
and predictor is of statistical significance.
Compare the coefficient p-value to the -level: If the p-value is
smaller than the -level then the association is statistically
significant.
S, R2 and adjusted R2
These are measures of how well the model fits the data. These values
help select the model with the best fit.
S is measured in the units of the response variable and represents
the standard distance the data values fall from the regression line.
Lower the S for a given equation, the better the equation predicts
the response.
R2 describes the amount of variation in the observed response
values that is explained by the predictor (s). R2 always increases
with additional predictors. R2 is most useful when comparing
models of the same size.
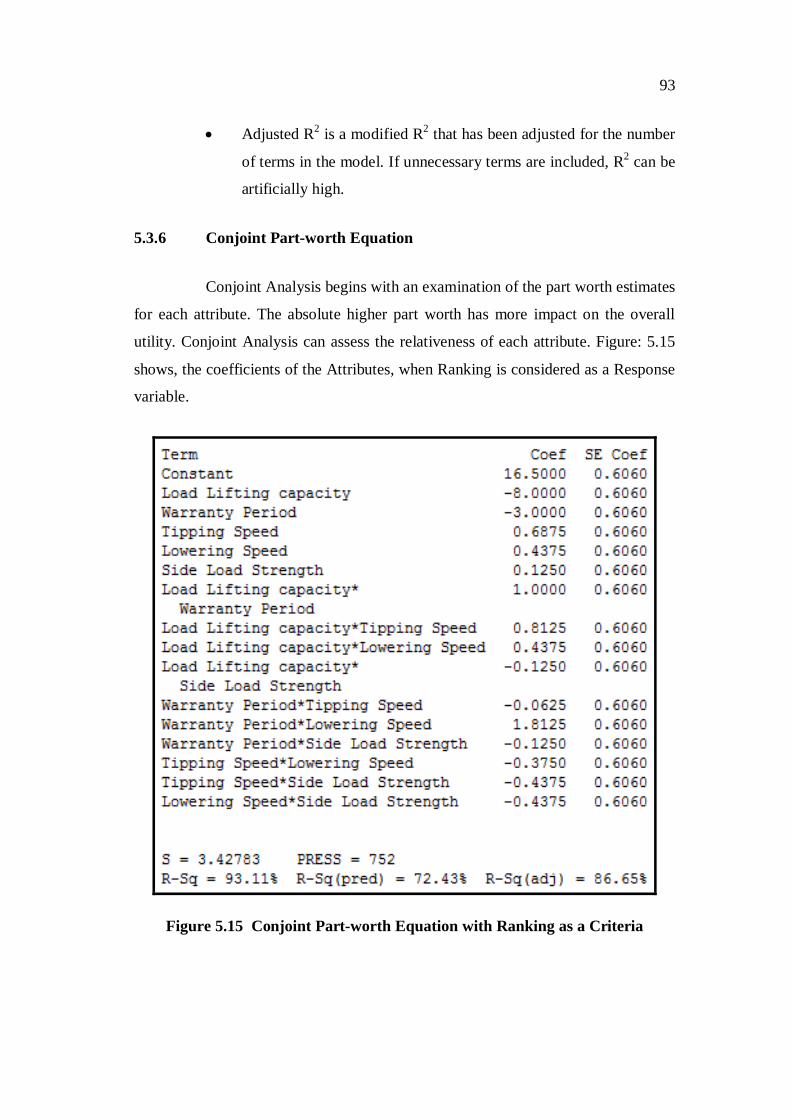
93
Adjusted R2 is a modified R2 that has been adjusted for the number
of terms in the model. If unnecessary terms are included, R2 can be
artificially high.
5.3.6 Conjoint Part-worth Equation
Conjoint Analysis begins with an examination of the part worth estimates
for each attribute. The absolute higher part worth has more impact on the overall
utility. Conjoint Analysis can assess the relativeness of each attribute. Figure: 5.15
shows, the coefficients of the Attributes, when Ranking is considered as a Response
variable.
Figure 5.15 Conjoint Part-worth Equation with Ranking as a Criteria

94
Part worth equation for Ranking
Ranking = 16.5 – 8 (Load lifting capacity) – 3(Warranty Period) + 0.6875
(Tipping speed) + 0.4375 (Lowering speed) + 0.1250 (Side load
strength) + (Load lifting capacity X warranty period) + 0.8125 (Load
lifting capacity X Tipping speed) + 0.4375 (Load lifting capacity X
Lowering speed) – 0.1250 (Load lifting capacity X Side load
strength) – 0.0625 (Warranty period X Tipping speed) + 1.8125
(Warranty period X Lowering speed) – 0.1250 (Warranty period X
Side load strength) - 0.3750 (Tipping speed X Lowering speed) –
0.4375 (Tipping speed X Side load strength) – 0.4375 ( Lowering
speed X Side load strength)
Interpretation
The S indicates that the standard deviation of the error terms is 3.42
which is small, indicating that the equation predicts the response better.
The R2 is the coefficient of determination and decides ‘how well the
equation is able to explain the variation’. The ideal R2 is 1. Higher the R2, the better
it is. If it is less than 0.75 or 75%, then the experiment needs to be relooked at.
The R2 value at 93.11 % is a high value indicating that the derived
mathematical model is excellent.
The R2 (Predicted) is 72.43%, which is a high value and it indicates that
the confidence interval and the prediction interval are considered accurately.
The R2 (Adjusted) is 86.65%. The R2 is 93.11% and the R2 adjusted is
86.65%, when compared, they are close by. This indicates a stable equation.

95
ANOVA
The Figure 5.16 shows the ANOVA plot (Analysis of variance). The
Anova table gives the following information:
Degrees of freedom
The sum of squares
The adjusted sum of squares
The mean sum of squares
The reason the ANOVA table is split into rows for MODEL, ERROR
and TOTAL is to examine, how much error is there when the part worth equation is
used and to determine how much error has disappeared because the part worth
equation was used.
The SS (Factor) is the sum of squares that determines whether the values
in one sample are larger or smaller on the average than the values in another sample.
The analysis of variance table shows the amount of variation in the
response data explained by the predictors and the amount of variation left
unexplained.
Figure 5.16 ANOVA Table
96
Inference of the ANOVA output
The ANOVA is an exact test of the null hypothesis of no difference in
level means. These assumptions can be checked using the residuals, in the following
section.
Residual Plots
The final and a necessary step, is to check the error term. It is assumed
that the errors:
Exhibit constant variance
Are normally distributed
Have a mean of zero
Are independent from each other
An important way of checking whether a regression has achieved its goal
to explain as much variation as possible in a dependent variable, is to check the
residual plot. Residual plots are ‘what is left over’ after explaining the variation in
the dependent variable using the independent variable. That is the unexplained
variation.
Ideally all residuals must be small and unstructured. If the residuals
exhibit a structure or present any special aspect that does not seem random, then the
regression is suspect, for one of the following reasons:
Outliers that have been overlooked
Relationships are non-linear
Non-constant variation of residuals remain (Heteroscedasticity)
Groups of observations have been overlooked.

97
Minitab calculates three types of residuals:
Regular residual: Observed – predicted value.
Standardised residual: Regular residual/ standard deviation of
regular residual. Standardisation eliminates the effect of location of
the data point in the predictor space.
Studentised deleted residual: The i’th data point follows the same
expression as the standardised residual. However, the i’th fitted
value and the standard deviation calculated for the studentised
deleted residual, becomes larger in the presence of an unusual data
point.
The four-in-one residual plot (Figure 5.17) displays four different
residual plots together in one graph. This layout can be useful for comparing the
plots to determine whether the model meets the assumptions of the analysis. The
residual plots in the graph include:
Histogram- Indicates whether the data are skewed or outliers exist
in the data
Normal probability plot- indicates whether the data are normally
distributed, other variables are influencing the response, or outliers
exist in the data.
Residuals versus fitted values - indicates whether the variance is
constant, a nonlinear relationship exists, or outliers exist in the
data.
Residuals versus order of the data – indicates whether there are
systematic effects in the data due to time or data collection order.
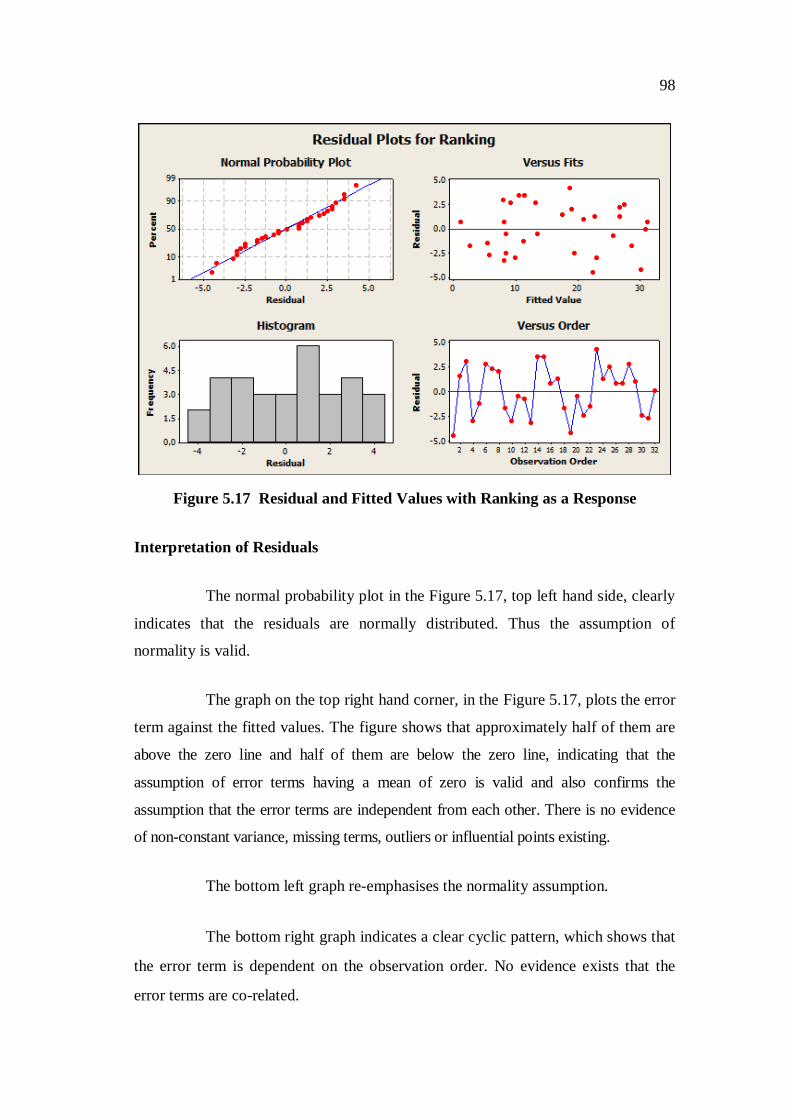
98
Figure 5.17 Residual and Fitted Values with Ranking as a Response
Interpretation of Residuals
The normal probability plot in the Figure 5.17, top left hand side, clearly
indicates that the residuals are normally distributed. Thus the assumption of
normality is valid.
The graph on the top right hand corner, in the Figure 5.17, plots the error
term against the fitted values. The figure shows that approximately half of them are
above the zero line and half of them are below the zero line, indicating that the
assumption of error terms having a mean of zero is valid and also confirms the
assumption that the error terms are independent from each other. There is no evidence
of non-constant variance, missing terms, outliers or influential points existing.
The bottom left graph re-emphasises the normality assumption.
The bottom right graph indicates a clear cyclic pattern, which shows that
the error term is dependent on the observation order. No evidence exists that the
error terms are co-related.
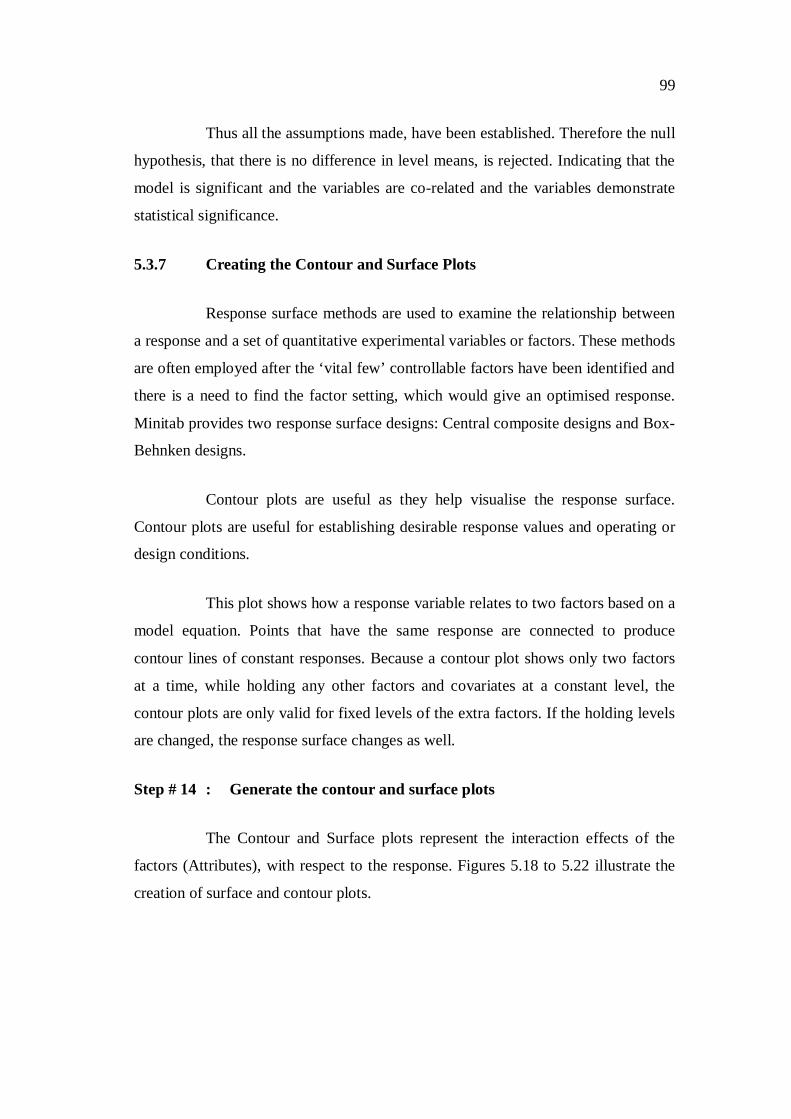
99
Thus all the assumptions made, have been established. Therefore the null
hypothesis, that there is no difference in level means, is rejected. Indicating that the
model is significant and the variables are co-related and the variables demonstrate
statistical significance.
5.3.7 Creating the Contour and Surface Plots
Response surface methods are used to examine the relationship between
a response and a set of quantitative experimental variables or factors. These methods
are often employed after the ‘vital few’ controllable factors have been identified and
there is a need to find the factor setting, which would give an optimised response.
Minitab provides two response surface designs: Central composite designs and Box-
Behnken designs.
Contour plots are useful as they help visualise the response surface.
Contour plots are useful for establishing desirable response values and operating or
design conditions.
This plot shows how a response variable relates to two factors based on a
model equation. Points that have the same response are connected to produce
contour lines of constant responses. Because a contour plot shows only two factors
at a time, while holding any other factors and covariates at a constant level, the
contour plots are only valid for fixed levels of the extra factors. If the holding levels
are changed, the response surface changes as well.
Step # 14 : Generate the contour and surface plots
The Contour and Surface plots represent the interaction effects of the
factors (Attributes), with respect to the response. Figures 5.18 to 5.22 illustrate the
creation of surface and contour plots.
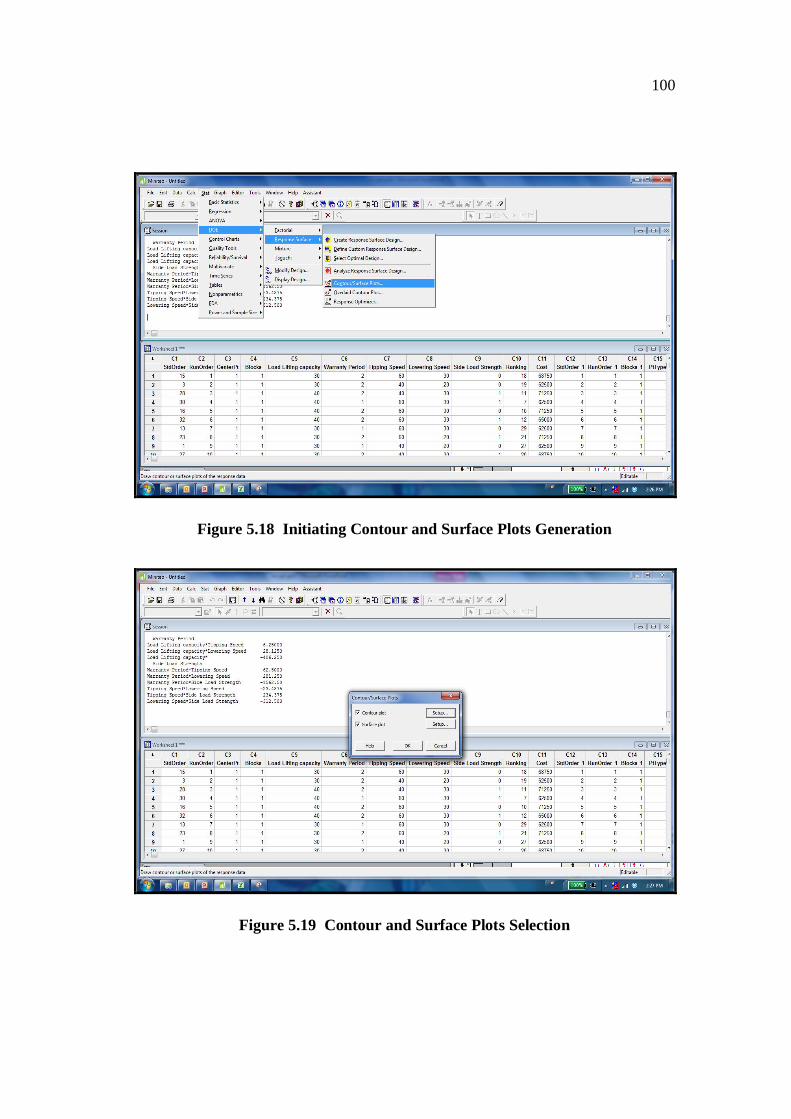
100
Figure 5.18 Initiating Contour and Surface Plots Generation
Figure 5.19 Contour and Surface Plots Selection
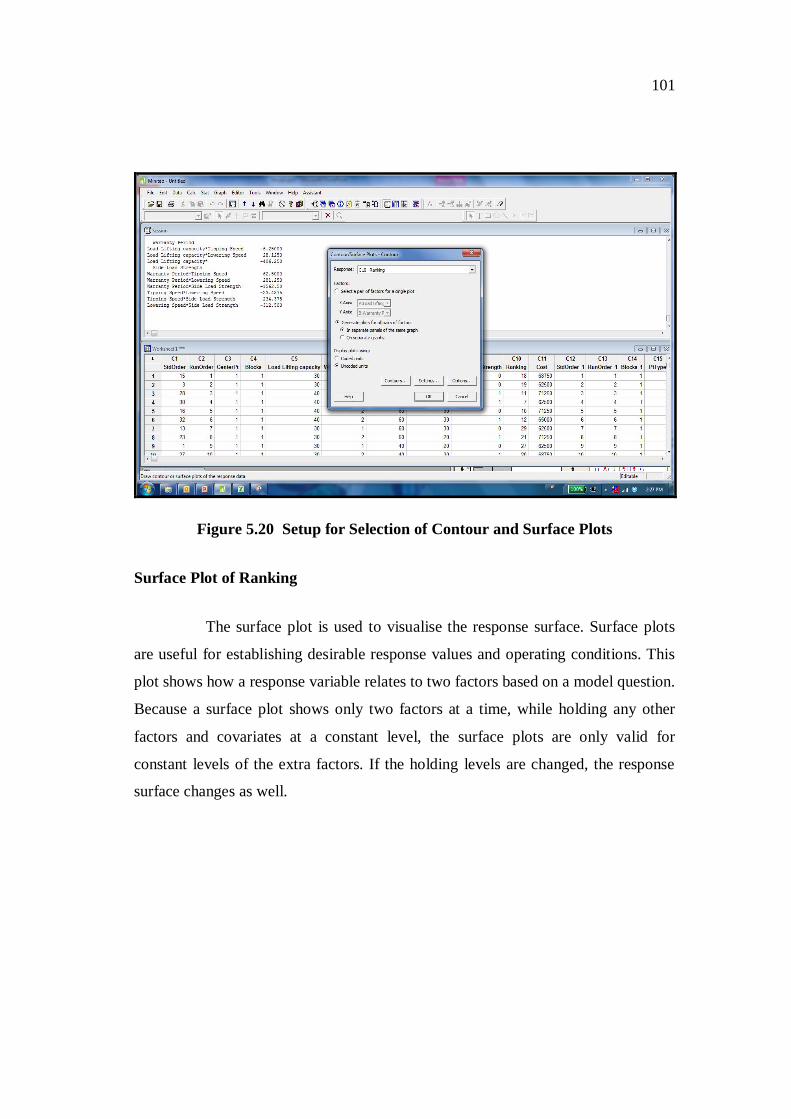
101
Figure 5.20 Setup for Selection of Contour and Surface Plots
Surface Plot of Ranking
The surface plot is used to visualise the response surface. Surface plots
are useful for establishing desirable response values and operating conditions. This
plot shows how a response variable relates to two factors based on a model question.
Because a surface plot shows only two factors at a time, while holding any other
factors and covariates at a constant level, the surface plots are only valid for
constant levels of the extra factors. If the holding levels are changed, the response
surface changes as well.
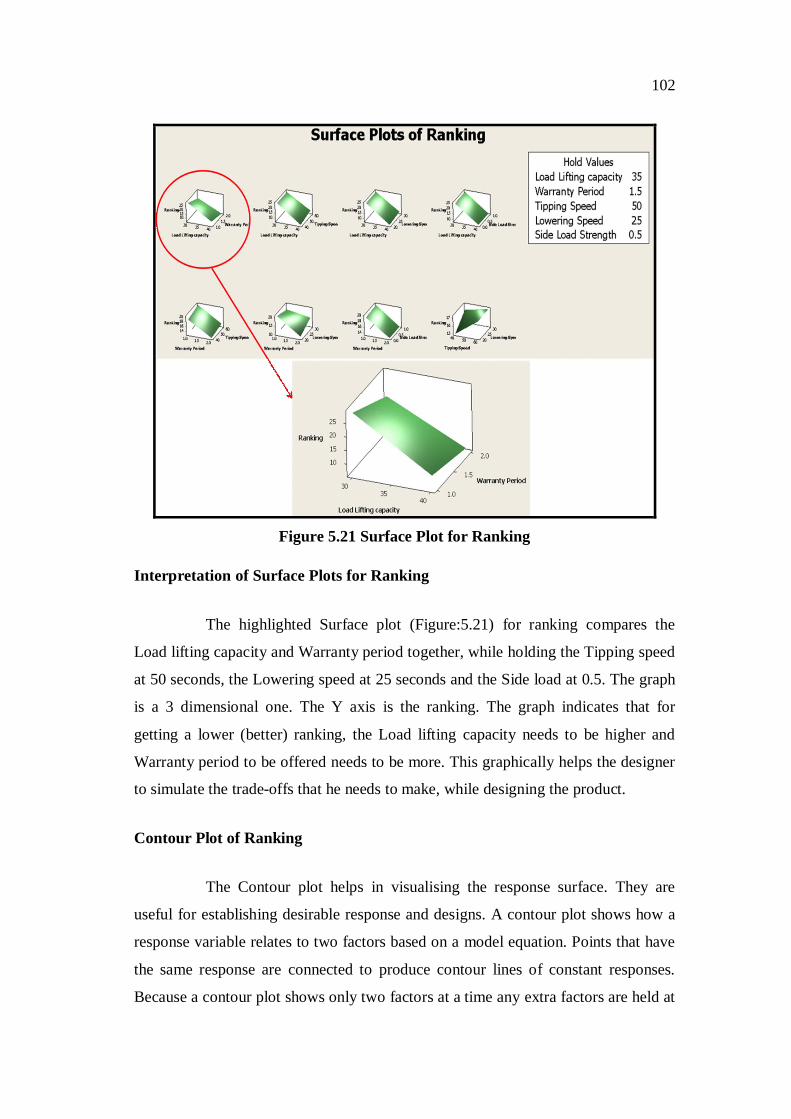
102
Figure 5.21 Surface Plot for Ranking
Interpretation of Surface Plots for Ranking
The highlighted Surface plot (Figure:5.21) for ranking compares the
Load lifting capacity and Warranty period together, while holding the Tipping speed
at 50 seconds, the Lowering speed at 25 seconds and the Side load at 0.5. The graph
is a 3 dimensional one. The Y axis is the ranking. The graph indicates that for
getting a lower (better) ranking, the Load lifting capacity needs to be higher and
Warranty period to be offered needs to be more. This graphically helps the designer
to simulate the trade-offs that he needs to make, while designing the product.
Contour Plot of Ranking
The Contour plot helps in visualising the response surface. They are
useful for establishing desirable response and designs. A contour plot shows how a
response variable relates to two factors based on a model equation. Points that have
the same response are connected to produce contour lines of constant responses.
Because a contour plot shows only two factors at a time any extra factors are held at
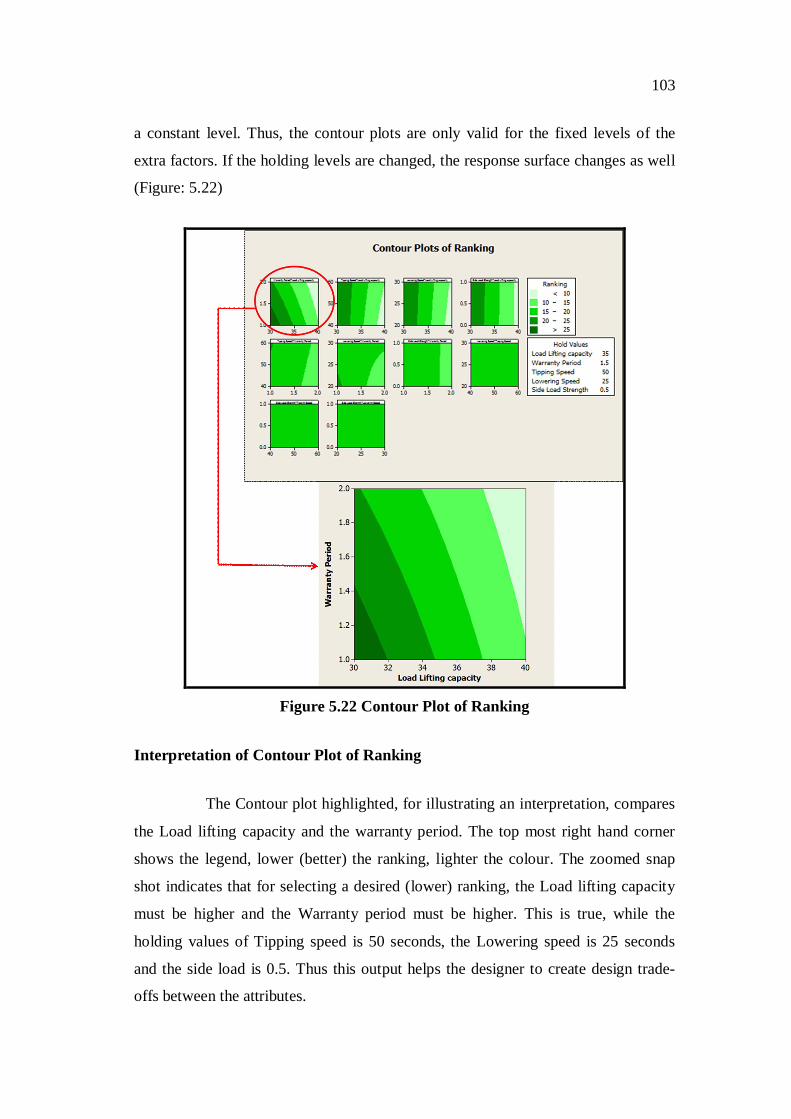
103
a constant level. Thus, the contour plots are only valid for the fixed levels of the
extra factors. If the holding levels are changed, the response surface changes as well
(Figure: 5.22)
Figure 5.22 Contour Plot of Ranking
Interpretation of Contour Plot of Ranking
The Contour plot highlighted, for illustrating an interpretation, compares
the Load lifting capacity and the warranty period. The top most right hand corner
shows the legend, lower (better) the ranking, lighter the colour. The zoomed snap
shot indicates that for selecting a desired (lower) ranking, the Load lifting capacity
must be higher and the Warranty period must be higher. This is true, while the
holding values of Tipping speed is 50 seconds, the Lowering speed is 25 seconds
and the side load is 0.5. Thus this output helps the designer to create design trade-
offs between the attributes.

104
Creating the Interaction and Cube plots
Step 15 : To carry out the interaction effects, the following steps (Figure
5.23 to 5.25) are performed.
Figure 5.23 Selection for Factorial Plots
Figure 5.24 Selection of Main, Interaction and Cube Plots

105
Figure 5.25 Selection of Factors & Responses, for Studying the Interaction Effects
5.3.8 Main Effect Plot of Ranking
The main effect plot is useful to visualise the effect of the factors on the
response and to compare the relative strength of the effects. We can draw a single
main effects plot for one factor, or a series of plot for two or more factors. The main
effect plot can be drawn for either the:
Data means – the means of the response variable for each level of
the factor.
Fitted means – after the design has been analysed, the fitted means
for each level of a factor can be plotted.
The response means for each factor level are plotted and then connected
for each factor. A reference line is drawn at the overall (grand) mean. The main
effects can be visualised from this line. The main effect plot of the factors that are
significant alone must be reviewed and analysed, according to the effects and

106
coefficient table from Analyse Factorial Design. A main effect is present when the
change in the mean response across the levels of a factor is significant.
The main effects plot is most useful when there are several factors. The
level change is to see the influence of the factor and compare, which one has the
most influence. A main effect is present when different levels of the factor affect the
response differently. For a factor with two levels, one would find that one level
increases the mean compared to the other level. This difference is the main effect.
The main effects plot is created by plotting the response mean for each
factor level. A line connects the points for each factor. The reference line at the
overall mean is also presented.
When the line is horizontal (parallel to the X- axis) then there is no
main effect present. Each level of the factor affects the response in
the same way, and the response mean is the same across all the
factor levels.
When the line is not horizontal (not parallel to the X- axis), then
there is a main effect present. Different levels of the factor affect
the response differently. The greater the difference in the vertical
position of the plotted points (the greater the slope), the greater is
the magnitude of the main effect.
Thus by comparing the slopes of the lines, the relative magnitude of the
factor effects can be compared.
The pictorial representation (Figure: 5.26) helps in deducing the data,
better than a table.
The interaction plots are used to assess the two-factor interactions in a
design. The following are the evaluation criteria:
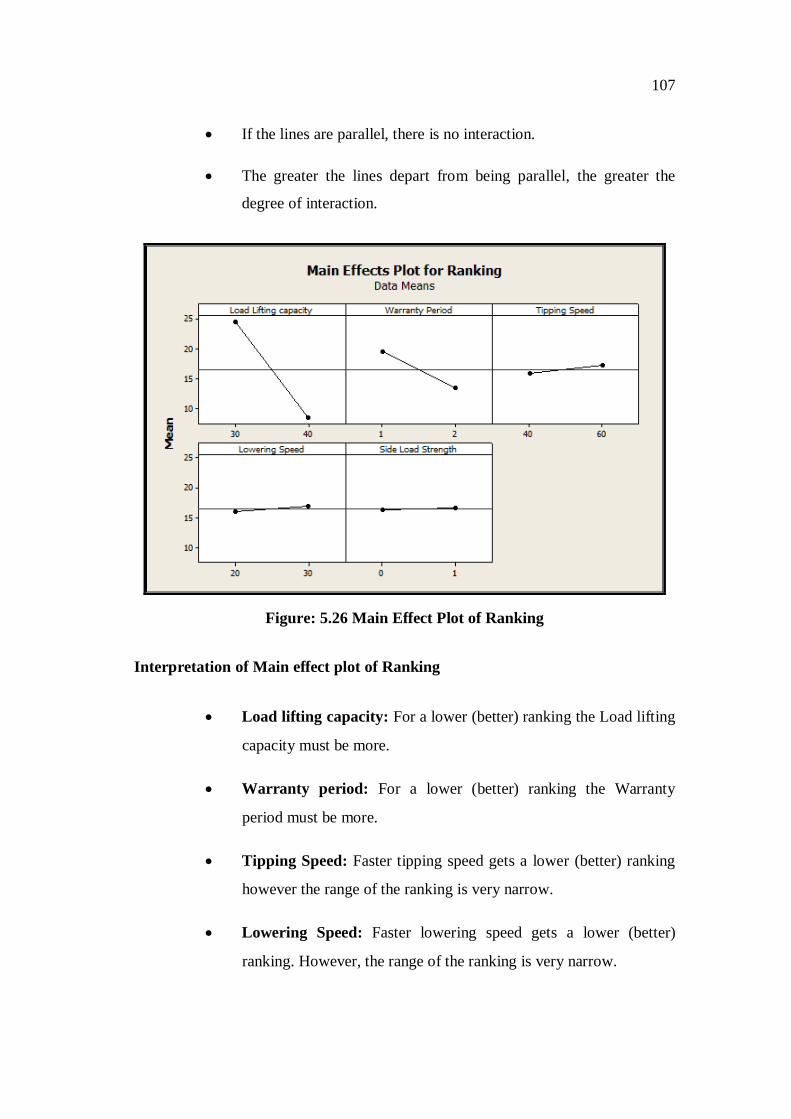
107
If the lines are parallel, there is no interaction.
The greater the lines depart from being parallel, the greater the
degree of interaction.
Figure: 5.26 Main Effect Plot of Ranking
Interpretation of Main effect plot of Ranking
Load lifting capacity: For a lower (better) ranking the Load lifting
capacity must be more.
Warranty period: For a lower (better) ranking the Warranty
period must be more.
Tipping Speed: Faster tipping speed gets a lower (better) ranking
however the range of the ranking is very narrow.
Lowering Speed: Faster lowering speed gets a lower (better)
ranking. However, the range of the ranking is very narrow.

108
Side load strength: The line is almost parallel. This indicates that,
the ranking is ignorant of the side load strength feature.
5.3.9 Interactions Effect Plot of Ranking
The interactions plot is to visualise the interaction effect of two factors
on the response and to compare the relative strength of the effects. An interaction
plot for two factors, or a matrix of plots for three or more factors can be selected.
The interaction plots can be drawn for either the:-
Data means- the means of the response variable for each
combination of factor levels
Fitted means- After the design is analysed the fitted means can be
plotted.
For each combination of factors, the response is plotted and connected
with the points for the low and high level of the factors plotted on the X-axis. The
lines connecting the factor levels are to be reviewed to determine whether or not an
interaction is present between the factors. Only the interaction effects have to be
reviewed for interactions that are significant according to the effects and coefficient
table. An interaction is present when the change in the response mean from the low
to the high level of a factor depends on the level of the second factor (Figure: 5.27.).
If the lines are parallel to each other, there is no interaction present.
The change in the response mean from the low to the high level of
a factor does not depend on the level of a second factor.
If the lines are not parallel to each other, there may be an
interaction present. The change in the response mean from the low
to the high level of a factor depends on the level of a second factor.
The greater the degree of departure from being parallel, the
stronger the effect. The interaction must be ensured that it is
significant for this.
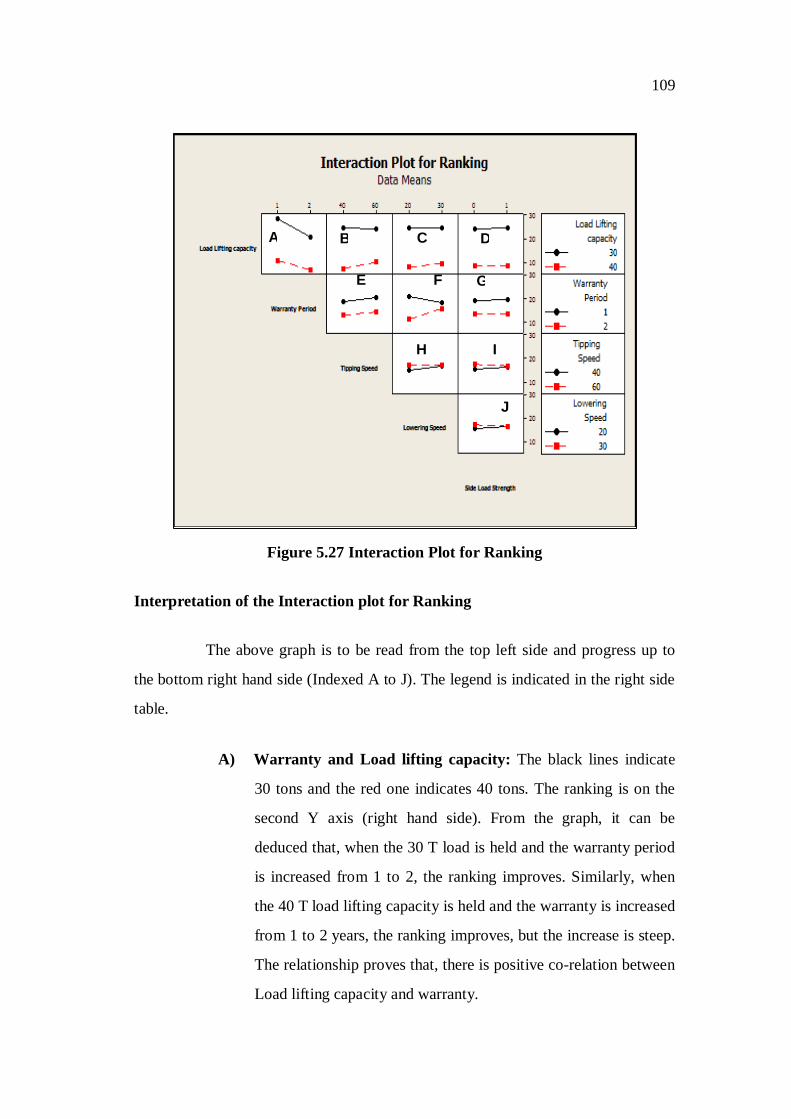
109
A B C D
E F G
H I
J
Figure 5.27 Interaction Plot for Ranking
Interpretation of the Interaction plot for Ranking
The above graph is to be read from the top left side and progress up to
the bottom right hand side (Indexed A to J). The legend is indicated in the right side
table.
A) Warranty and Load lifting capacity: The black lines indicate
30 tons and the red one indicates 40 tons. The ranking is on the
second Y axis (right hand side). From the graph, it can be
deduced that, when the 30 T load is held and the warranty period
is increased from 1 to 2, the ranking improves. Similarly, when
the 40 T load lifting capacity is held and the warranty is increased
from 1 to 2 years, the ranking improves, but the increase is steep.
The relationship proves that, there is positive co-relation between
Load lifting capacity and warranty.

110
B) Load lifting capacity and Tipping speed: This graph indicates
that when the Load lifting capacity is 30 tons, the Tipping speed
variation from 40 to 60 seconds, does not have an impact in the
ranking. However, when the Load lifting capacity is reduced
from 60 Tons to 40 Tons, the ranking improves significantly.
C) Load lifting capacity and Lowering speed: This graph indicates
that when the Load lifting capacity is 30 Tons, the Lowering
speed variation from 30 to 20 seconds, does not have any impact
on the ranking. However, when the Load lifting capacity is 40
tons, the Lowering speed variation from 30 to 20 seconds,
improves the ranking.
D) Load lifting capacity and Side load strength: This graph
indicates that the load lifting capacity and the side load strength
are almost parallel at both 30 and 40 Tons, whether the side load
strength is a Yes or a No.
E) Warranty and Tipping speed: This graph indicates that, when
the Warranty is for 1 year and the Tipping speed is reduced from
60 to 40 seconds, the ranking improves. However, the
improvement is more, when the Warranty is for 2 years.
F) Warranty and Lowering speed: This graph indicates that, when
the Warranty is for 1 year and the Lowering speed is higher, then
the ranking is lower. However, when the Warranty is for 2 years,
the ranking is higher, when the Lowering speed reduces from 30
seconds to 20 seconds. The interaction between Warranty and
Lowering speed is complex, in this case. The visual
representation brings this out very clearly.

111
G) Warranty and side load strength: This graph shows that the,
when Warranty is 1 year, the side load strength, at both the
extreme boundary conditions does not impact the ranking.
However, when the Warranty is 2 years, the side load strength
has no impact on the ranking but the ranking is lower, when the
warranty is for 2 years.
H) Tipping speed and lowering speed: This graph shows that when
the tipping speed is 40 seconds and the Lowering speed is
reduced from 30 to 20 seconds, the ranking improves. However,
when the Tipping speed is 60 seconds, the lowering speed does
not have any impact on the ranking.
I) Tipping speed and side load strength: This graph shows that
when the Tipping speed is lower and the side load strength is
applicable or it is not applicable, the ranking improves, when the
side load strength feature is not applicable. However, when the
Tipping speed is higher at 60 seconds and the side load strength
is applicable or not, the ranking is the same.
J) Lowering speed and side load strength: This graph shows that
when the Lowering speed is lower at 20 seconds and the side load
strength is not applicable, the ranking is lower. However, when
the Lowering speed is 30 seconds, the ranking is higher, when the
option of no side load strength is selected. The lines cross each
other, thus indicating that, the relationship is close and complex.
5.3.10 Cube Plots
Cube plots can be used to show the relationship between factors and a
response. Each cube can show three factors (Figure 5.28). If there only two factors a
square plot is displayed. As many cubes as necessary are drawn to show up to seven
factors. The cube plot can be drawn for either the:
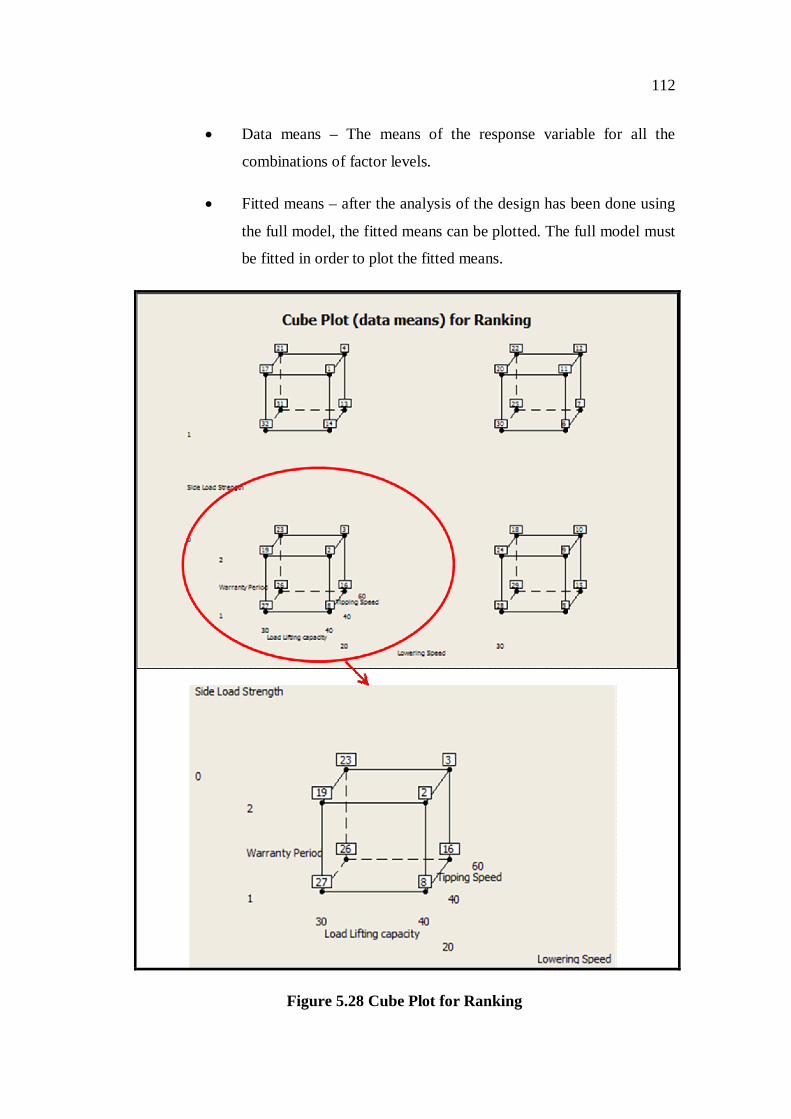
112
Data means – The means of the response variable for all the
combinations of factor levels.
Fitted means – after the analysis of the design has been done using
the full model, the fitted means can be plotted. The full model must
be fitted in order to plot the fitted means.
Figure 5.28 Cube Plot for Ranking
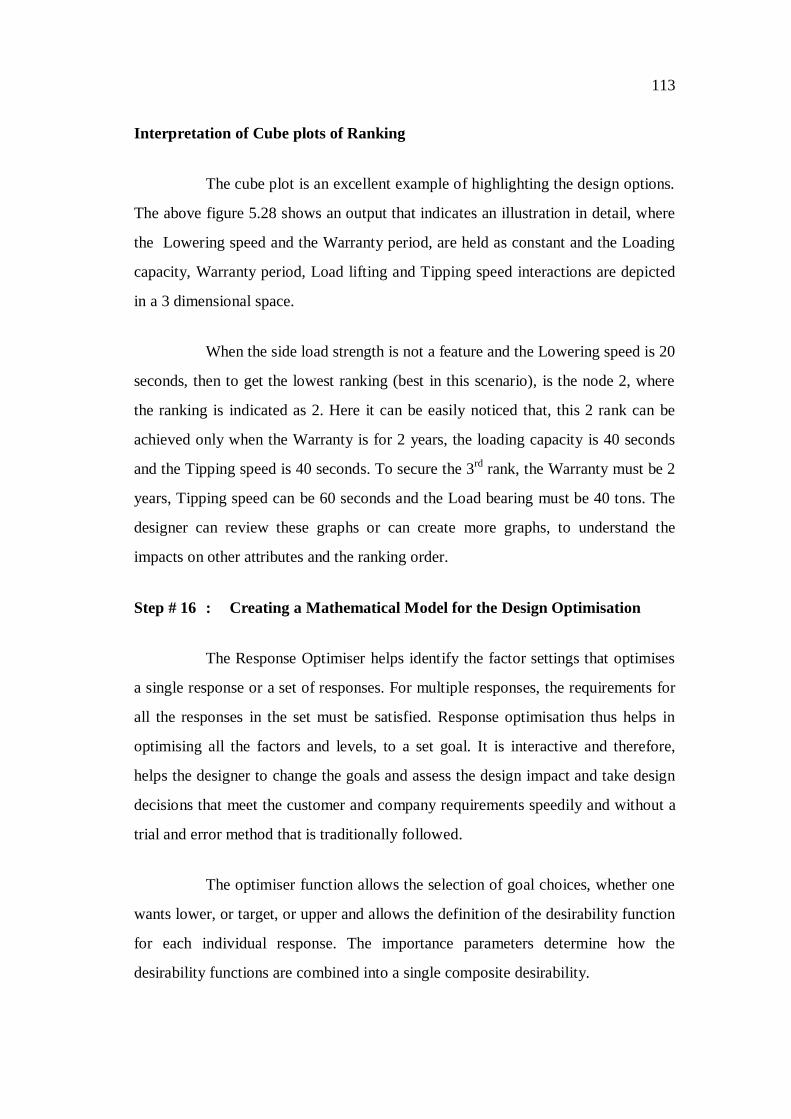
113
Interpretation of Cube plots of Ranking
The cube plot is an excellent example of highlighting the design options.
The above figure 5.28 shows an output that indicates an illustration in detail, where
the Lowering speed and the Warranty period, are held as constant and the Loading
capacity, Warranty period, Load lifting and Tipping speed interactions are depicted
in a 3 dimensional space.
When the side load strength is not a feature and the Lowering speed is 20
seconds, then to get the lowest ranking (best in this scenario), is the node 2, where
the ranking is indicated as 2. Here it can be easily noticed that, this 2 rank can be
achieved only when the Warranty is for 2 years, the loading capacity is 40 seconds
and the Tipping speed is 40 seconds. To secure the 3rd rank, the Warranty must be 2
years, Tipping speed can be 60 seconds and the Load bearing must be 40 tons. The
designer can review these graphs or can create more graphs, to understand the
impacts on other attributes and the ranking order.
Step # 16 : Creating a Mathematical Model for the Design Optimisation
The Response Optimiser helps identify the factor settings that optimises
a single response or a set of responses. For multiple responses, the requirements for
all the responses in the set must be satisfied. Response optimisation thus helps in
optimising all the factors and levels, to a set goal. It is interactive and therefore,
helps the designer to change the goals and assess the design impact and take design
decisions that meet the customer and company requirements speedily and without a
trial and error method that is traditionally followed.
The optimiser function allows the selection of goal choices, whether one
wants lower, or target, or upper and allows the definition of the desirability function
for each individual response. The importance parameters determine how the
desirability functions are combined into a single composite desirability.

114
The optimisation procedure picks several starting points from which to
begin searching for the optimal factor settings. There are two types of solutions for
the search:
Local solution: For each starting point, there is a local solution.
These solutions are the ‘best’ combination of factor settings found
beginning from a particular starting point.
Global solution: There is only one global solution, which is the best
of all the local solutions. The global solution is the “best”
combination of factor settings for achieving the desired responses.
In this case study, only the global solution choice has been selected. The
individual desirability is calculated for each predicted response. The individual
desirability values are then combined into the composite desirability. The
desirability values guide the understanding of the closeness of the predicted
response to the targeted response. Desirability is measured on a 0 to 1 scale.
Individual desirability: The closer the predicted response is to the
target requirement, the closer the desirability will be to 1.
Composite desirability: The composite desirability combines the
individual desirability into an overall value, and reflects the relative
importance of the responses. The higher the desirability the closer it
will be to 1.
In figures 5.29 to 5.33, the step by step execution of optimisation is depicted.

115
Figure 5.29 Initiating Design Optimisation
Figure 5.30 Response for Optimisation Selection
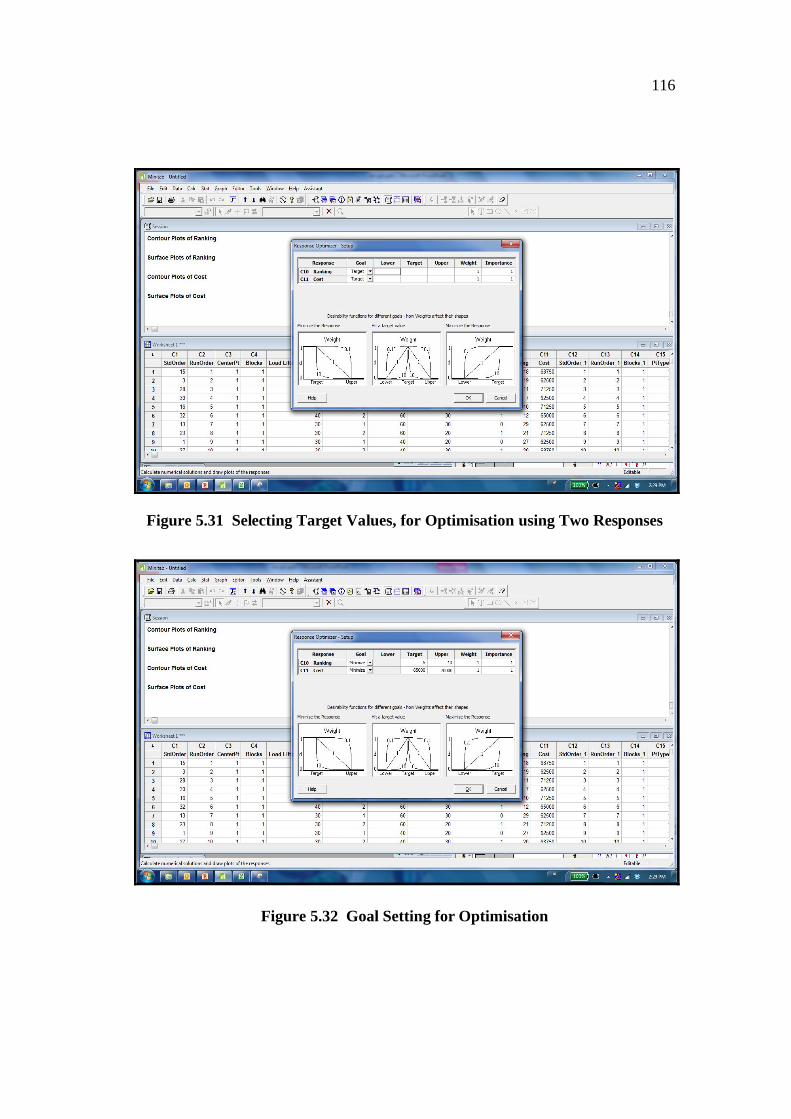
116
Figure 5.31 Selecting Target Values, for Optimisation using Two Responses
Figure 5.32 Goal Setting for Optimisation
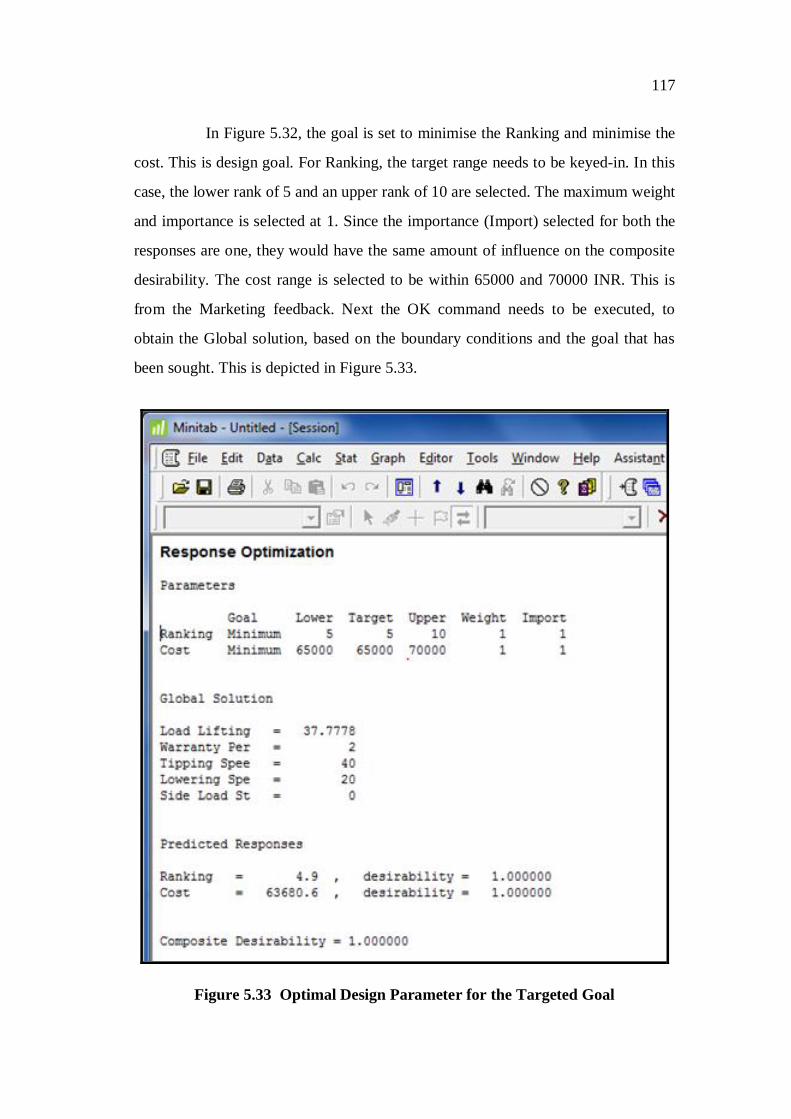
117
In Figure 5.32, the goal is set to minimise the Ranking and minimise the
cost. This is design goal. For Ranking, the target range needs to be keyed-in. In this
case, the lower rank of 5 and an upper rank of 10 are selected. The maximum weight
and importance is selected at 1. Since the importance (Import) selected for both the
responses are one, they would have the same amount of influence on the composite
desirability. The cost range is selected to be within 65000 and 70000 INR. This is
from the Marketing feedback. Next the OK command needs to be executed, to
obtain the Global solution, based on the boundary conditions and the goal that has
been sought. This is depicted in Figure 5.33.
Figure 5.33 Optimal Design Parameter for the Targeted Goal
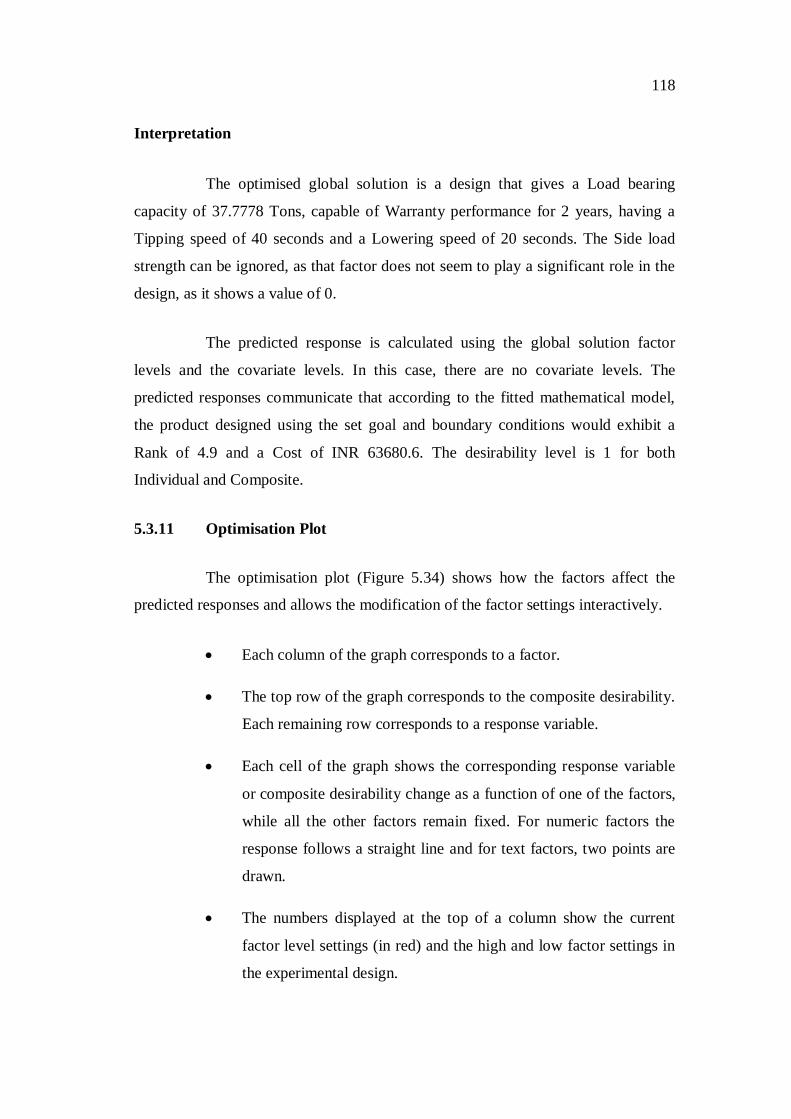
118
Interpretation
The optimised global solution is a design that gives a Load bearing
capacity of 37.7778 Tons, capable of Warranty performance for 2 years, having a
Tipping speed of 40 seconds and a Lowering speed of 20 seconds. The Side load
strength can be ignored, as that factor does not seem to play a significant role in the
design, as it shows a value of 0.
The predicted response is calculated using the global solution factor
levels and the covariate levels. In this case, there are no covariate levels. The
predicted responses communicate that according to the fitted mathematical model,
the product designed using the set goal and boundary conditions would exhibit a
Rank of 4.9 and a Cost of INR 63680.6. The desirability level is 1 for both
Individual and Composite.
5.3.11 Optimisation Plot
The optimisation plot (Figure 5.34) shows how the factors affect the
predicted responses and allows the modification of the factor settings interactively.
Each column of the graph corresponds to a factor.
The top row of the graph corresponds to the composite desirability.
Each remaining row corresponds to a response variable.
Each cell of the graph shows the corresponding response variable
or composite desirability change as a function of one of the factors,
while all the other factors remain fixed. For numeric factors the
response follows a straight line and for text factors, two points are
drawn.
The numbers displayed at the top of a column show the current
factor level settings (in red) and the high and low factor settings in
the experimental design.
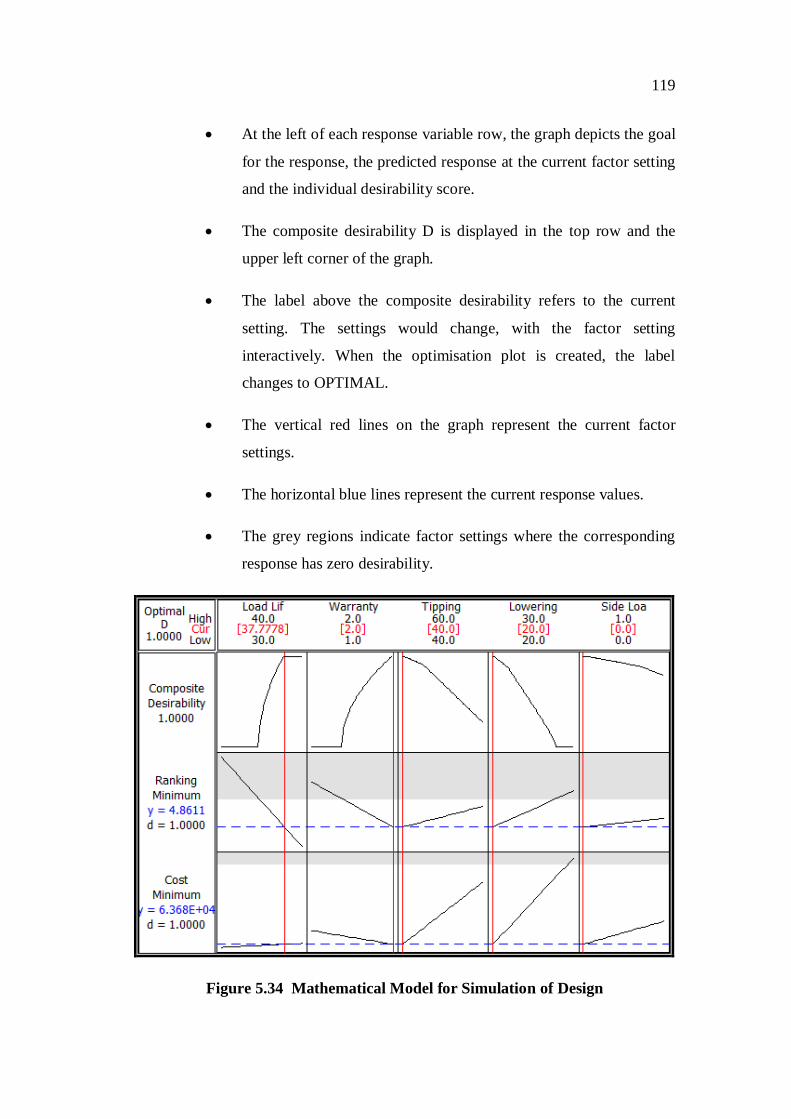
119
At the left of each response variable row, the graph depicts the goal
for the response, the predicted response at the current factor setting
and the individual desirability score.
The composite desirability D is displayed in the top row and the
upper left corner of the graph.
The label above the composite desirability refers to the current
setting. The settings would change, with the factor setting
interactively. When the optimisation plot is created, the label
changes to OPTIMAL.
The vertical red lines on the graph represent the current factor
settings.
The horizontal blue lines represent the current response values.
The grey regions indicate factor settings where the corresponding
response has zero desirability.
Figure 5.34 Mathematical Model for Simulation of Design

120
Interpretation
The Figure 5.34 is the final optimal design output. The top row displays
the optimal design with a desirability level of 1. The design parameters are:
Load lifting capacity = 37.7778 Tons
Warranty = 2 years
Tipping speed = 40 seconds
Lowering speed = 20 seconds
Side load strength = 0 (meaning side load strength is not a
differentiator in the product)
Load lifting capacity: If the load lifting capacity is increased from the
optimal position, the ranking would improve but the cost would go up.
Warranty period: If the warranty period is reduced, the ranking would
become undesirable and the cost would also go up.
Tipping speed: If the tipping speed is increased, the ranking becomes
undesirable and the cost also increases. However, the cost increase would be steep,
as can be observed by the slope of the cost curve.
Lowering speed: If the lowering speed is increased, the ranking becomes
undesirable and the cost also increases. However, the cost increase would be very
steep, as compared to the ranking degradation, as can be established by the slope of
the cost curve.

121
5.4 APPLICATION OF QFD (QUALITY FUNCTION DEPLOYMENT)
The output from the conjoint experiment was processed through the QFD
House of Quality methodology (Figure: 5.35) to convert the optimal design which is
in Customer stated attributes to Engineering/technical design characteristics. This is
to enable completion of the entire product design and make it manufacturable.
Figure 5.35 QFD House of Quality- A Frame Work (Hauser & Clausing, 1988)
The output of the QFD process is the Technical Characteristics
(Attributes) and their specification limits (Levels). Table 5.5 summarise the
relationship.
122
Table 5.5 QFD- translation of customer’s voice into design characteristics
Figure 5.36 Schematic Depiction of the Hydraulic Telescopic Ram’s
(Cylinders) Multiple Stages

123
From Table 5.5, it can be observed, that the customer expressed
Attributes and Levels, have undergone a transformation, into designer’s language.
Figure 5.36 explains this, co-relation. The Load lifting capacity can be achieved by
managing the working pressure of the cylinder. Similarly, the side load strength, the
speed of tipping and the speed of lowering can be achieved by the first, the second
or the third stage of the hydraulic multi-stage telescopic cylinder, respectively. The
Conjoint analysis was carried out on the customer attributes and the resultant
optimised design in customer attribute terms, were transformed into designer
attributes and levels, for the final design and production.
5.5 CASE STUDY SUMMARY
In this case study, the product was rejected by the market, post its first
launch. It was a question of survival and a matter of credibility for the design team
and the organisation. It was decided to use the well-known, STAGE-GATE process,
for the product development coupled with Conjoint Analysis, to be used as an
INPUT for design, right at the beginning of the re-design exercise. In order, that the
data for Conjoint Analysis be exact, a fresh survey was instituted to capture the
VoC, which was further prioritised using a FOCUS GROUP using the MULTI-
VOTING method. The output from the conjoint experiment was thereafter
processed through the ‘House of Quality’, by applying the QFD, to convert the
Customer’s voice to Designer’s voice. Conjoint Analysis, using the Minitab
statistical software package, was an innovative aspect, which is perhaps a FIRST.
The Conjoint experimentation, provides a transfer function, capturing the
part worth of the various Attributes, thus providing the designers, to simulate and
arrive at an optimal design, by various permutations and combinations of the
transfer function. The designers efficiently used the interactive Surface Optimiser
function of the Minitab, to arrive at the OPTIMAL design.
124
The OPTIMAL design parameters in engineering terms from the QFD
process, was used for prototype manufacturing. The prototypes were deployed in
‘test markets’ and constant feedback was collected. Minor changes were made based
on the field test validation and a full-fledged launch was undertaken, at an all India
level. The success was astounding. Within 6 months of launch, the market share of
the company B (where this project was carried out), rose by 11 % points (15% was
lost when the product was introduced first).
The entire development exercise established that, capturing the VoC and
taking the input to the product design stage, using the statistical tool of Conjoint
Analysis, guarantees a perfect launch.
The next chapter would summarise the discussions emanating from the
research and presents the results of the Conjoint Analysis.
125
CHAPTER 6
RESULTS AND DISCUSSIONS
“Design is the fundamental soul of a man-made creation that ends up expressing
itself in successive outer layers of products or services”
– Steve Jobs.
6.1 INTRODUCTION
The previous chapter clearly establishes the usefulness of capturing the
VoC early in the design phase of an NPD by applying Conjoint Analysis which has
traditionally been a social science research tool.
Most importantly it is established that Minitab can be adopted to carry
out the Conjoint Analysis, easily. The OPTIMISER feature of the Minitab ensures
that, the designers can simulate and optimise the design, within the boundary
conditions, interactively. It lends itself as an intuitive and self- guiding tool. The use
of Minitab innovatively for Conjoint Analysis is a pioneering effort of this
dissertation. The market share gain by the re-launched product, designed using the
VoC and processed vide Conjoint analysis was credible. The simple but effective
method is adoptable, as it does not require a huge capital expenditure outlay, nor
does it need long training hours or a software domain expertise. It is usable by the
existing teams to produce remarkable results, which are discussed and summarised
in this chapter.
6.2 CASE STUDY BACKGROUND
Company B (subject company where this study was conducted) is a
world leader, in supplying the similar technological product (Hydraulic actuation
systems), to all the different segments of the market (Construction equipment,
126
Material handling, Mining and Truck Tipping). The truck tipping segment has two
categories, Under body tipping (UBT) and Front end tipping (FET). Within these
categories, there are vehicles for 10 Tonnes, 15 Tonnes, 20 Tonnes, 25 Tonnes, 50
Tonnes and above 50 Tonnes. The 25 Tonnes FET category is the fastest growing in
the Truck Tipping segment. Market research indicates that the 25 Tonnes FET
would even replace a part of the UBT category and therefore, to gain leadership in
the Truck Tipping segment, it is essential to achieve leadership in the 25 Tonnes
FET category. Company B is a leader in the UBT category. Company A
(competitor) is a market leader in the 25 Tons FET category. Company A enjoys, 68
% market share in the 25 Tonnes FET vehicle segment, leaving 26 % to the
company B and balance to many fragmented competition. Company B, launches a
new product, to compete with Company A’s offerings in the 25 Tonnes FET
category and gain a market share lead. This product is rejected by the market and is
withdrawn. Despite, company B’s technological prowess and market credibility, this
launch was a disaster. The market share of Company B in the 25 Ton front end
tipping segment, drops to 11%. Company B, decides to do a zero based, redesign
and re-launch, to try and capture, a significant market share, in this segment. The
study is based on the re-design and re-launch of the hydraulic actuation unit, using
Conjoint Analysis and QFD, originally designed only the Stage-Gate process.
Company B carries out a VoC analysis to elicit the direct response from the OEM,
the various dealers, who assemble the hydraulic system to the vehicle and the end
consumers, who buy and use the product. The thesis illustrates the advantage of
design using Conjoint analysis.
The VoC was captured by eliciting direct response from the end
consumers, dealers and the OEMs and this VoC was translated using Conjoint
Analysis followed by QFD (Thomas & Chandrasekaran, 2013a). The summary of
the results achieved from the Application of Conjoint analysis to the fuzzy front end
of a product design, are detailed.
127
6.2.1 Importance of Capturing the VoC Directly
The product was originally developed using the NPD Stage-Gate process
only. The stage-gate process is a sequential step by step process. In chapter 1, it was
clearly established that, 75% of the product cost is frozen in 15% of the product
development time. This means that, any feature that is designed remains that way,
with absolutely no option for change, till it is launched and the market forces the
design change, as a matter of survival for the product and the company.
The product development team had a wealth of knowledge about design
requirements (as the company is in the field of Hydraulic cylinder manufacturing
from1974). The marketing team had exposure to various markets and had access to
competitive benchmarking, owing to the sheer size and reach of the company
(Turnover INR 1200 crores in FY12). Still the product was a failure in the market.
The successful re-launch was a matter of prestige and profit for the
Company B. The board had tasked the product development team and the marketing
team, to recreate the product and regain the market share and brand image.
The VoC was captured directly using a face to face interview with the
consumers, dealers spread out throughout India and the OEM Truck manufacturing
companies. The data that was received was tabulated and ranked using a focus
group. The short listed 21 customer expectations were further prioritised using the
NGT (Nominal Group Technique) also called the Multi-voting, resulting in the final
5 most desired customer expected Attributes.
Capturing of VoC directly, ensured:-
Complete and transparent expectations from users and potential
users of the product.
The changing expectation of the customer (changes due to the new
needs or expectations set by a competing product)

128
Translating the VoC through the Focus group specialists, ensured:-
The technical understanding of the VoC (whether feasible or not,
within the limited time and within the limited design boundary, as
the re-launch was planned on the existing product platform)
The technical experts brought the rich knowledge of competing
products and vehicle design expertise, to the Hydraulic kit design
and integration, with the vehicle.
That the customer and dealer became a part of the larger product
development team ensured that, they become a part of the solution,
thus guaranteeing the embedding of the VoC (all the 3 levels) into
the product.
6.2.2 Conjoint Analysis an Objective Statistical Tool for NPD
The VoC is a list of expressed expectations. The translation of VoC into
optimal designable with customer apportioned values for the attributes, using
conjoint analysis, was fully achieved. The optimised design attributes, which was in
customer characteristics (non-technical), were processed through the QFD
methodology, to arrive at the VoD, which is in technical characteristics. There have
been past research where VoC inputs have been directly processed through the
QFD. The designs made thus, have experienced product design/development
shortfalls as assessed by Gilb (2008).
“The ‘technical evaluation’ is vague, subjective and unhelpful and the
importance rating of the designs seems a useless subjective stipulation. The
‘interactions’ roof of the house of quality that is subjectively defined and not
informative”.
This subjectivity was completely eliminated by the use of Conjoint
Analysis on the customer attributes (VoC derived) and then translating the Conjoint
output optimised parameters, into the QFD, to derive the design parameters for
manufacturing, as illustrated in this study. The expectation of the QFD was fully
met, in the case study.
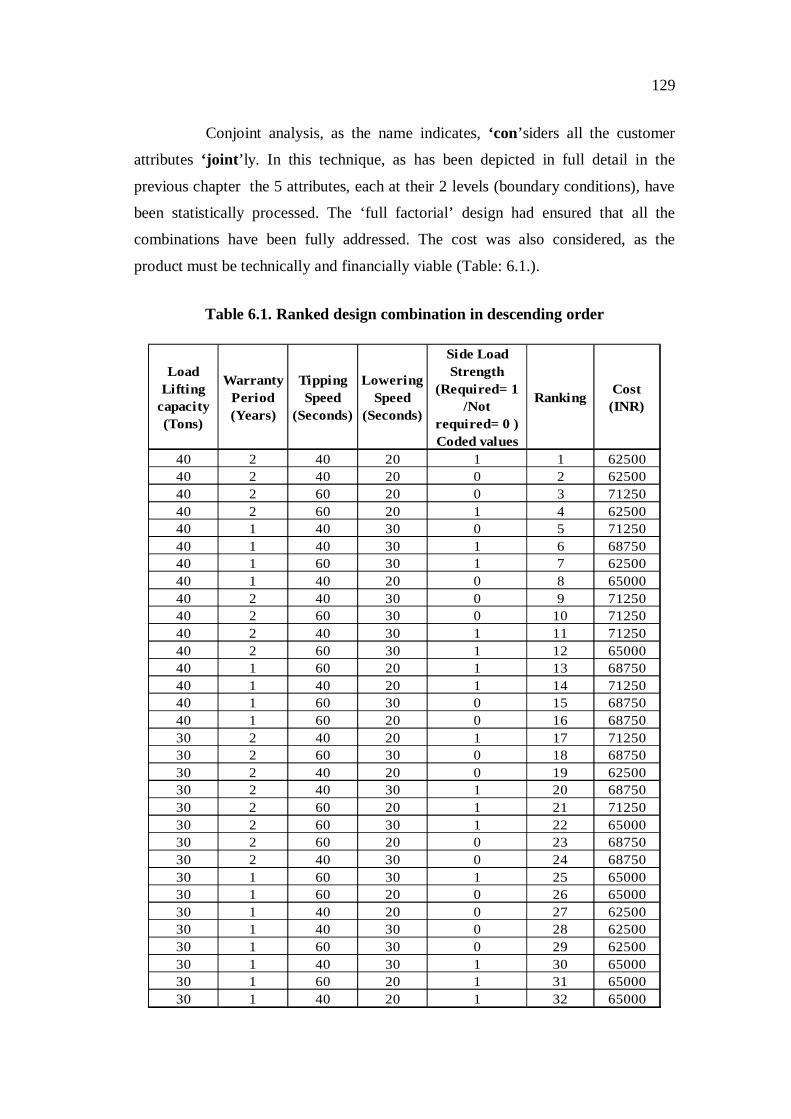
129
Conjoint analysis, as the name indicates, ‘con’siders all the customer
attributes ‘joint’ly. In this technique, as has been depicted in full detail in the
previous chapter the 5 attributes, each at their 2 levels (boundary conditions), have
been statistically processed. The ‘full factorial’ design had ensured that all the
combinations have been fully addressed. The cost was also considered, as the
product must be technically and financially viable (Table: 6.1.).
Table 6.1. Ranked design combination in descending order
Load Lifting
capacity (Tons)
Warranty Period (Years)
Tipping Speed
(Seconds)
Lowering Speed
(Seconds)
Side Load Strength
(Required= 1 /Not
required= 0 ) Coded values
Ranking Cost (INR)
40 2 40 20 1 1 6250040 2 40 20 0 2 6250040 2 60 20 0 3 7125040 2 60 20 1 4 6250040 1 40 30 0 5 7125040 1 40 30 1 6 6875040 1 60 30 1 7 6250040 1 40 20 0 8 6500040 2 40 30 0 9 7125040 2 60 30 0 10 7125040 2 40 30 1 11 7125040 2 60 30 1 12 6500040 1 60 20 1 13 6875040 1 40 20 1 14 7125040 1 60 30 0 15 6875040 1 60 20 0 16 6875030 2 40 20 1 17 7125030 2 60 30 0 18 6875030 2 40 20 0 19 6250030 2 40 30 1 20 6875030 2 60 20 1 21 7125030 2 60 30 1 22 6500030 2 60 20 0 23 6875030 2 40 30 0 24 6875030 1 60 30 1 25 6500030 1 60 20 0 26 6500030 1 40 20 0 27 6250030 1 40 30 0 28 6250030 1 60 30 0 29 6250030 1 40 30 1 30 6500030 1 60 20 1 31 6500030 1 40 20 1 32 65000

130
The conjoint experiment returned the following (Figure:6.1.) summarised
output:-
Figure 6.1 Conjoint Part-Worth Equation Coefficients
The S indicates that the standard deviation of the error terms is 3.42. The
R2 is the coefficient of determination and decides ‘how well the equation is able to
explain the variation’. The ideal R2 is 1. Higher the R2, the better it is. If it is less
than 0.75 or 75%, then the experiment needs to be relooked at. The R2 value at
93.11 % is a high value indicating that the derived mathematical model is excellent.

131
The R2 (Predicted) is 72.43% which is a high value and it indicates that
the confidence interval and the prediction interval are considered accurately. The R2
(Adjusted) is 86.65%. The R2 is 93.11% and the R2 adjusted is 86.65%, when
compared, they are close by. This indicates a stable equation.
Conjoint Part-worth equation
Ranking = 16.5 – 8 (Load lifting capacity) – 3(Warranty Period) + 0.6875
(Tipping speed) + 0.4375 (Lowering speed) + 0.1250 (Side load
strength) + (Load lifting capacity X warranty period) + 0.8125 (Load
lifting capacity X Tipping speed) + 0.4375 (Load lifting capacity X
Lowering speed) – 0.1250 (Load lifting capacity X Side load
strength) – 0.0625 (Warranty period X Tipping speed) + 1.8125
(Warranty period X Lowering speed) – 0.1250 (Warranty period X
Side load strength) - 0.3750 (Tipping speed X Lowering speed) –
0.4375 (Tipping speed X Side load strength) – 0.4375 (Lowering
speed X Side load strength)
The above part-worth defines the coefficient for each of the variable and
interactions of the variable. It is the mathematical output for design. The product
engineers would have had to use such mathematical equations to design a product
for the different boundary condition of the variables. This would have been a ‘one at
a time’ activity, error prone and time consuming.
For the design, the Surface plot, Contour plot, Main effect plot and the
Cube plot were selected. Between these reports, there was a wealth of data for the
designer to evaluate and assess the various combinations objectively. Figure: 6.2
shows a sample output of each of the above mentioned plot, for illustration.

132
Figure 6.2 Surface, Contour, Main-Effect and Cube Plots

133
A B C D
E F G
H I
J
The Interaction effect plot output is an interesting result, for the designer.
It pictorially depicts the combinations effect and helps in design analytics
(Figure: 6.3.).
Figure 6.3 Interaction Effect Plot for Ranking
The above pictorial representation guides the designer in choosing the
required attribute and level for finalizing the product designing. The detail
interpretations of these graphs are shown in chapter 5.
Optimiser Output
The Response Optimiser in Minitab helped to identify the combination of
input variable settings that CONJOINTly optimise a set of responses. It gave an
optimal solution for the input variable combinations, along with an optimisation
plot. The optimisation plot is interactive; the designer can adjust the input variable
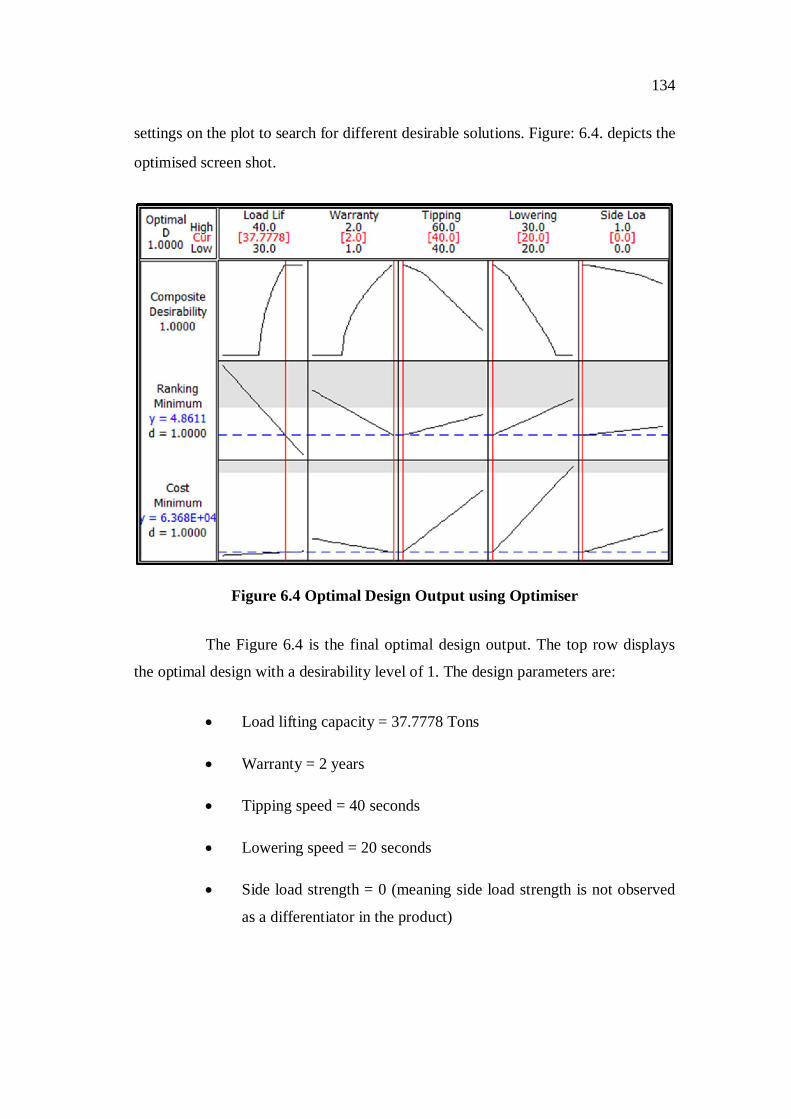
134
settings on the plot to search for different desirable solutions. Figure: 6.4. depicts the
optimised screen shot.
Figure 6.4 Optimal Design Output using Optimiser
The Figure 6.4 is the final optimal design output. The top row displays
the optimal design with a desirability level of 1. The design parameters are:
Load lifting capacity = 37.7778 Tons
Warranty = 2 years
Tipping speed = 40 seconds
Lowering speed = 20 seconds
Side load strength = 0 (meaning side load strength is not observed
as a differentiator in the product)
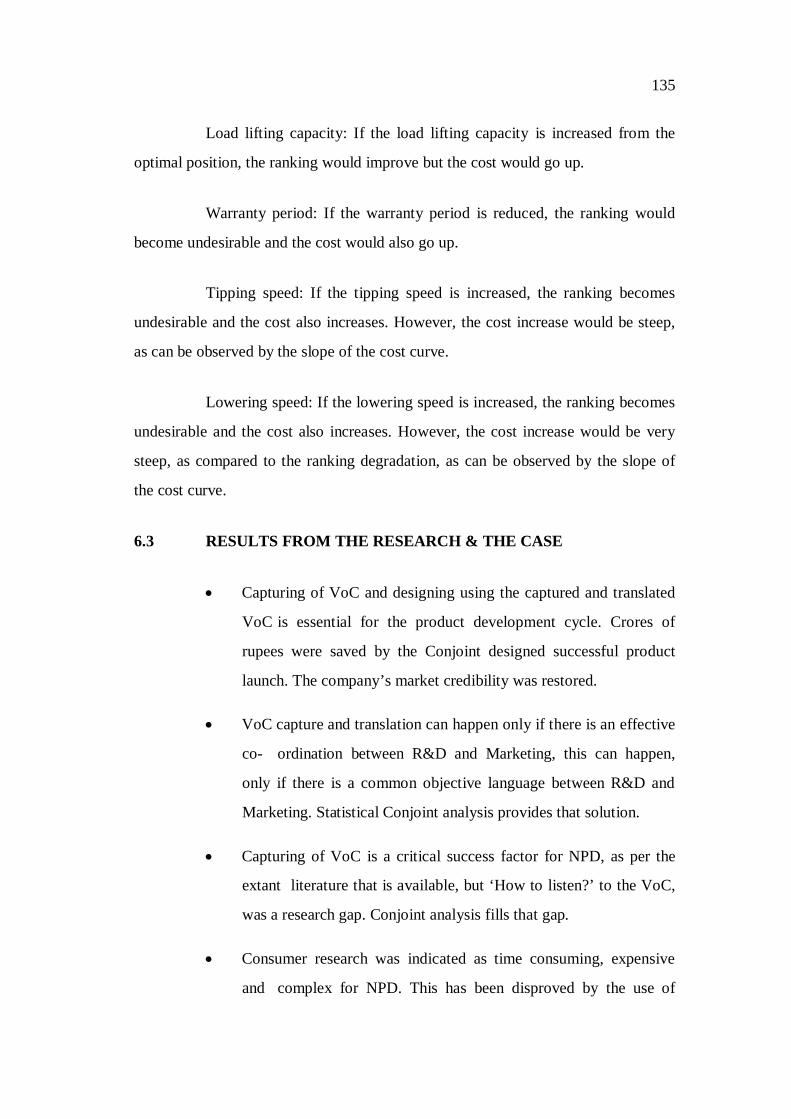
135
Load lifting capacity: If the load lifting capacity is increased from the
optimal position, the ranking would improve but the cost would go up.
Warranty period: If the warranty period is reduced, the ranking would
become undesirable and the cost would also go up.
Tipping speed: If the tipping speed is increased, the ranking becomes
undesirable and the cost also increases. However, the cost increase would be steep,
as can be observed by the slope of the cost curve.
Lowering speed: If the lowering speed is increased, the ranking becomes
undesirable and the cost also increases. However, the cost increase would be very
steep, as compared to the ranking degradation, as can be observed by the slope of
the cost curve.
6.3 RESULTS FROM THE RESEARCH & THE CASE
Capturing of VoC and designing using the captured and translated
VoC is essential for the product development cycle. Crores of
rupees were saved by the Conjoint designed successful product
launch. The company’s market credibility was restored.
VoC capture and translation can happen only if there is an effective
co- ordination between R&D and Marketing, this can happen,
only if there is a common objective language between R&D and
Marketing. Statistical Conjoint analysis provides that solution.
Capturing of VoC is a critical success factor for NPD, as per the
extant literature that is available, but ‘How to listen?’ to the VoC,
was a research gap. Conjoint analysis fills that gap.
Consumer research was indicated as time consuming, expensive
and complex for NPD. This has been disproved by the use of
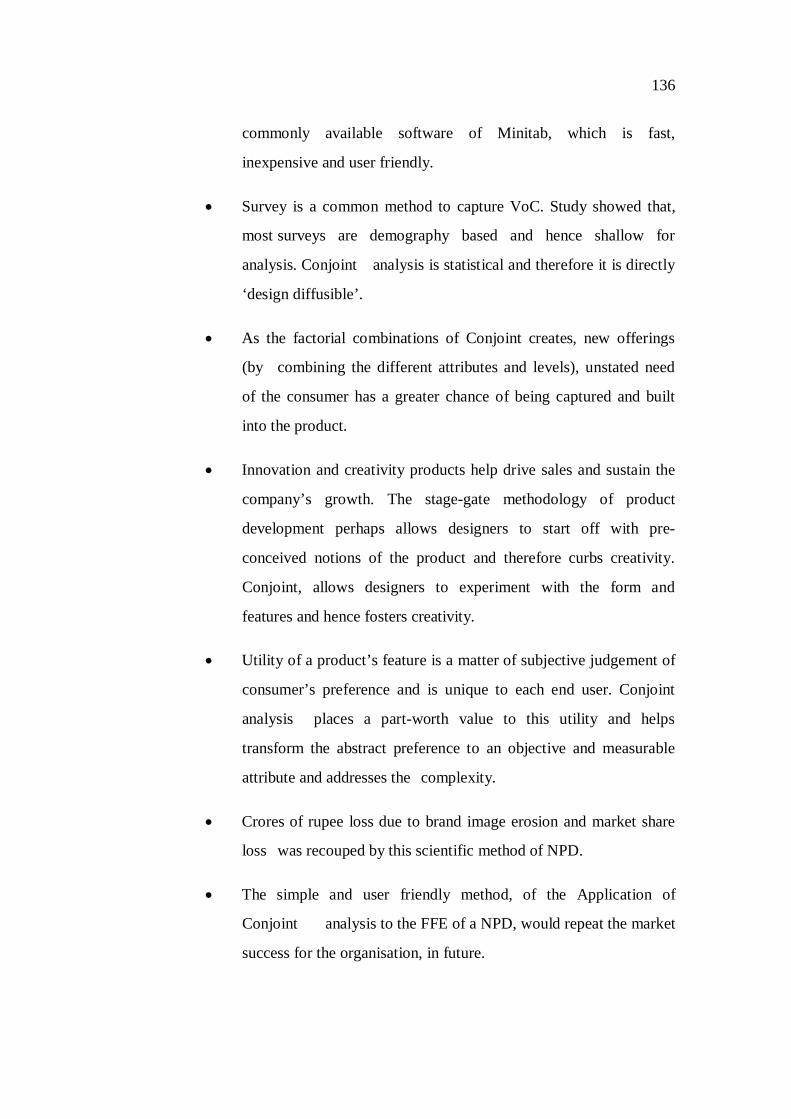
136
commonly available software of Minitab, which is fast,
inexpensive and user friendly.
Survey is a common method to capture VoC. Study showed that,
most surveys are demography based and hence shallow for
analysis. Conjoint analysis is statistical and therefore it is directly
‘design diffusible’.
As the factorial combinations of Conjoint creates, new offerings
(by combining the different attributes and levels), unstated need
of the consumer has a greater chance of being captured and built
into the product.
Innovation and creativity products help drive sales and sustain the
company’s growth. The stage-gate methodology of product
development perhaps allows designers to start off with pre-
conceived notions of the product and therefore curbs creativity.
Conjoint, allows designers to experiment with the form and
features and hence fosters creativity.
Utility of a product’s feature is a matter of subjective judgement of
consumer’s preference and is unique to each end user. Conjoint
analysis places a part-worth value to this utility and helps
transform the abstract preference to an objective and measurable
attribute and addresses the complexity.
Crores of rupee loss due to brand image erosion and market share
loss was recouped by this scientific method of NPD.
The simple and user friendly method, of the Application of
Conjoint analysis to the FFE of a NPD, would repeat the market
success for the organisation, in future.
137
6.4 DISCUSSIONS
All products have a product life cycle. New products must replace old
ones and must reach new markets and new customers. Therefore NPD is the lifeline
for a company’s growth. Because of the importance of this topic for engineering and
economic development, there has been and is a lot of focus on studying and finding
ways and means to be successful at NPD. This study shows that Consumer research
towards understanding the needs of the customer and the latent and unfulfilled needs
of the market is a critical aspect for a product development team. The study also
elicits the probable reason for the gap between the marketing team and the product
development team and therefore the lack of funnelling the consumer and market
information into the product designs.
There are many versatile market research tools to capture the VoC. This
study has looked at 10 of them and concluded through empirical analysis that
Conjoint Analysis is perhaps the best tool for translating the VoC into specific
design elements for a product development.
Conjoint Analysis evolved in the field of psychological study in the
1960s. Because it dealt with the measurement of ‘how a choice is made by a
person?’ It therefore flourished in the field of consumer research. This study
evaluated the Conjoint Analysis tool by applying it, on a failed product design and
recreated a design that was validated tested and launched successfully in the market.
Conjoint Analysis is traditionally applied using a package called SPSS
(Statistical Package for Social Sciences). Use of SPSS is rare in the engineering
industry and is expensive. This research pioneers the use of Minitab software for
applying Conjoint Analysis. Minitab is more commonly available, as it is a
statistical package that has been made popular by the Six Sigma Quality
Management Initiatives which has swept the engineering industries. The
OPTIMISER feature in the Minitab software, is an easy to learn and an easy to use,

138
simulation tool, where a designer can visualise the effect of the changes of the
variables on other design parameters and on the design response. In short, this utility
assures the designer of ‘what a customer experience would be, under various design
scenarios’. This is therefore instant and error free and assures a predictive product
development at a fraction of the cost. Figure: 6.5. shows a framework summarising
the discussion.
Figure 6.5 Framework Showing the ‘Application of Conjoint Analysis to Fuzzy Front End of a NPD’
6.5 SUMMARY
This chapter has summarised the results. The capture of the VoC
directly, followed by the VoC translation using Conjoint analysis and processing of
the optimised attributes through the QFD methodology, created a customer designed
new product. The phenomenal success, that of capturing a 11% market share, in just
6 months, strongly establishes the value of Conjoint analysis application at the fuzzy
front end of the product design.

139
By capturing the VoC directly the ‘true’ customer expectations are
obtained. QFD tool is a vital for converting the VoC to VoD. Lastly, the
OPTIMISER tool provides a platform for the designer, for interactive simulation,
based product design. The optimal combination that meets the customer requirement
can be selected for product development. The results prove that Conjoint Analysis,
using Minitab, could be applied at the ideation stage of the product development
cycle, for creating a truly customer focused product; one can perhaps call it iDesign!
140
CHAPTER 7
CONCLUSIONS AND RECOMMENDATIONS
FOR FUTURE WORK
“Education is a kindling of a flame, not the filling of a vessel” – Socrates.
7.1 INTRODUCTION
The previous chapter discusses the results of the research and the case
study and establishes that Conjoint Analysis is a useful tool for product
development. This chapter summarises the conclusions and lists the contributions.
The limitations of the study are also briefly explained. Finally, the chapter ends with
suggestions for further study, using Conjoint analysis.
7.2 CONCLUSIONS
Every research study uncovers a lot of relationships that was perhaps not
obvious and presents the gaps. Post that the thesis proposes a method to close the
gap with a hypothesis. The successful validation of the hypothesis is the culmination
of the research. The salient findings of this research and the results obtained by
applying Conjoint analysis to product development are as follows:-
That consumer research inputs need to be gathered, and considered
in a structured manner, for product development. The root causes
for the non-use of the consumer research has been understood and
the corrective actions to address the root causes, have been
developed and deployed, successfully.
141
There exists a gap between marketing and product development in
engineering industries which denies the competitive edge to the
company. Filling this gap boosts up the company success. It has
been uncovered that the product development team do not consider
the marketing information as credible and hence do not use it. This
gap has been filled by using a Conjoint analysis, a statistical tool,
which is well understood and bridges the gap.
That there is a need for ‘incorporating the VoC at the fuzzy front
end of the NPD life cycle’. Conjoint and QFD are tools that help
achieve this, in a simple but effective manner.
That Minitab software is a more efficient alternative to run the
Conjoint Analysis, as compared to SPSS.
That the OPTIMISER feature helps the designer to simulate various
designs, within the boundary conditions, thus allowing multiple
choices which can be chosen, visually and intuitively.
The effective use of the above tools in translating customer
preferences through use of Conjoint Analysis to successfully
develop a sub-system engineering component has been successfully
demonstrated in this study.
Crores of rupees have been saved by the successful launch of the
product designed vide Conjoint analysis. The raid acceptance of the
product, was evident by the market share gain. The demonstration
of Conjoint application, establishes that NPD success probability
increases greatly.
The case-study of a new product launch, its failure, its re-design using
the application of Conjoint Analysis, presented a blow by blow account of a product
life-cycle. The thesis firmly establishes that Application of Conjoint Analysis to the
FFE of the Product Development, guarantees, success in the market place.
142
7.3 CONTRIBUTIONS OF THIS RESEARCH
Company B’s chance of establishing a leadership position in the
Truck tipping category, was at stake. The company had already
sunk in, crores of rupees in the launch, that failed. The brand image
of a segment leader had taken a beating. The organisations
credibility was at stake. The Conjoint analysis applied product
design transformed the fortunes of the company.
Literature review establishes that capturing of VoC is a critical
success factor for the NPD. But, NPD success is only around 60%,
even today. This establishes that, the ‘How to listen to the VoC’ is
missing. Conjoint analysis categorically fills this gap by the use of
attributes and levels combinations, as has been demonstrated.
There are many reasons, as illustrated in chapters 1 & 2, as to why
consumer research, which is prescribed for the well-being of NPD,
is not used. Conjoint analysis, being a statistical, simple, easily
available and user friendly tool, bridges the R&D and Marketing
divide.
Consumer research was indicated as time consuming, expensive
and complex for NPD. This has been disproved by the use of
commonly available software of Minitab, which is fast,
inexpensive and user friendly.
Survey is a common method to capture VoC. Study showed that,
most surveys are demography based and hence shallow for
analysis. Conjoint analysis is statistical and therefore it is directly
‘design diffusible’.
As the factorial combinations of Conjoint creates, new offerings
(by combining the different attributes and levels), unstated need
of the consumer has a greater chance of being captured and built
into the product.
143
QFD has been used as a tool to aid successful NPD. This study uses
Conjoint Analysis first, to distil the captured VoC and then
translates it through QFD for a successful product development.
This sequencing ensures that the optimised VoC is transformed into
VoD.
Innovation and creative products help drive sales and sustain the
company’s growth. The stage-gate methodology of product
development perhaps allows designers to start off with pre-
conceived notions of the product and therefore curbs creativity.
Conjoint, allows designers to experiment with the form and
features and hence fosters creativity.
Utility of a product’s feature is a matter of subjective judgement of
consumer’s preference and is unique to each end user. Conjoint
analysis places a part-worth value to this utility and helps transform
the abstract preference to an objective and measurable attribute
and addresses the complexity.
The simple and user friendly method, of the Application of
Conjoint analysis to the FFE of a NPD, would repeat the market
success for the organisation, in future.
The demonstrated use of Minitab for Conjoint Analysis provides
the use of one more effective tool. The introduction of Optimiser
utility for Product Design would be useful for re-design as well as
new design.
7.4 LIMITATIONS
The following section explains the scope and limitations of the study:
The study was limited to a subsystem component viz: the truck
tipping segment of the commercial vehicle industry in India.

144
The study was done with 5 attribute each at 2 levels, as the case-
study was a re-design and a re-development exercise.
The study was initiated at the time, when the product failed in the
market within 3 months of launch and was closed six months after
the re-launch. Data beyond this period is not captured and assessed,
in this dissertation.
The study focussed on the product quality. The service quality,
spares availability by the hydraulic kit supplier, were not evaluated
for this case.
7.5 RECOMMENDATIONS FOR FUTURE WORK
Conjoint analysis could be applied to B2C products. The case was for
a B2B product.
Conjoint analysis could be coupled with design softwares like
ANSYS, CATIA and ProE so that, the strength of material,
computational fluid dynamics and other simulations could also be
visualised by the product developer, during the design phase for
objective decision process.
Conjoint analysis could be applied using more than 2 levels and more
than 5 attributes, and the challenges and results could be studied.
Conjoint analysis could be applied for services to create customer
focused packages.
7.6 SUMMARY
This chapter lists the conclusions, limitation and recommendations for
future research work using this amazing statistical technique of Conjoint Analysis.

145
The entire research has brought out the gaps that exist in B2B products,
which more often is invisible to the populace, when compared with B2C products
like cars, FMCG or mobile phones. It established, through the ‘levels of customer’
mechanism that, B2B is also B2C in the end. Then the thesis proposed a mechanism
to ‘listen to the VoC’ and unfolded a methodology to translate the VoC to VoD,
using a unique combination of Conjoint Analysis and QFD, to solve the NPD
predicament. The market share increase of Company B validates the theory and the
methodology for a successful NPD (Figure: 7.1)
Figure 7.1 Market Share Movement of Companies, before and after
Conjoint Analysis Driven NPD
From the above it can be seen that the company B had a market share of
26%, while the market leader Company A had 68%. Company B had projected an
increase to 31%, with the new product launch. But, the product’s non acceptance,
shrunk the market share to 11%, while the Company A’s share leaped to 81%.
Company B’s use of Conjoint analysis and QFD with the captured VoC, ensured a

146
resounding success in the market place. This is seen, with the market share increase
of Company B to 22%. The entire 11% gain has come from Company A’s share.
This establishes the comparative preference of the end consumer and validates the
theory that translation of VoC through Conjoint analysis, delivers a successful new
product.
To conclude, this study combines the Marketing science of Consumer
Preferences and the Engineering techniques of design and produces a package that is
simple, inexpensive, effective, easy to learn and user-friendly for the development
of new products, to serve the customer, who is the purpose for the existence of any
business or enterprise.
“Effort only fully releases its reward after a person refuses to quit”
- Napoleon Hill.

147
REFERENCE LIST
Adams, R. (2010). If you build it, will they come? Three steps to test and validate any market. NJ: J. Wiley.
Alba, J. W., & Hutchinson, J. W. (1987). Dimensions of consumer expertise. Journal of consumer research, 411-454.
Alba, J. W., & Hutchinson, J. W. (2000). Knowledge calibration: What consumers know and what they think they know. Journal of Consumer Research, 27(2), 123-156.
Anderson, J. R. (1983). A spreading activation theory of memory. Journal of Verbal Learning and Verbal Behaviour, 22(June), 261–295.
Antonides, G., & Van Raaij, W. F. (1998). Consumer behaviour: a European perspective. USA: J. Wiley.
Atuahene-Gima, Kwaku, Slater, Stanley F. and Olson, Eric M. (2005). The Contingent Value of Responsive and Proactive Market Orientations for New Product Program Performance. Journal of Product Innovation Management 22(6), 464–482.
Bailetti, A. J., & Litva, P. F. (1995). Integrating customer requirements into product designs. Journal of Product Innovation Management, 12(1), 3-15.
Baker, M. J., & Hart, S. (2008). The marketing book. Routledge: J. Wiley.
Barczak, G., Griffin, A., & Kahn, K. B. (2009). Perspective: trends and drivers of success in NPD practices: results of the 2003 PDMA best practices study*. Journal of product innovation management, 26(1), 3-23.
Bartlett, J.E., Kotrlik, J. W., Higgins, C. C., & Williams, H. A. (2001). Factors associated with research productivity of agricultural education faculty. Journal of Agricultural Education, 43(3), 1-10.
Bech-Larsen, T., & Nielsen, N. A. (1999). A comparison of ve elicitation techniques for elicitation of attributes of low involve-ment products. Journal of Economic Psychology, 20, 315–341.
Benedetto, C. A. (1999). Identifying the key success factors in new product launch. Journal of product innovation management, 16(6), 530-544.

148
Benner, M. J., & Tushman, M. L. (2003). Exploitation, exploration, and process management: The productivity dilemma revisited. The Academy of Management Review, 238-256.
Biemans, W. Griffin, A. & Moenaert, R. (2010). In search of classics: A study of the impact of JPIM papers from 1984 to 2003. Journal of Product Innovation Management, 27, 461-484.
Bjork. J & Magnusson. M. (2009). Where do good innovation ideas come from? Exploring the influence of Network connectivity on innovation idea quality. The Journal of Product Innovation Management, 26/6, 662-670.
Booz, A. & Hamilton (1968), Management of New Products, New York: Booz, Allen & Hamilton.
Brown, S. L., & Eisenhardt, K. M. (1995). Product development: past research, present findings, and future directions. Academy of management review, 343-378.
Bruner II, G. C., & Pomazal, R. J. (1988). Problem recognition: the crucial first stage of the consumer decision process. Journal of Consumer Marketing, 5(1), 53-63.
Bruseberg, A., & McDonagh-Philp, D. (2002). Focus groups to support the industrial/product designer: a review based on current literature and designers’ feedback. Applied Ergonomics, 33(1), 27–38.
Bryan K. Orme (2010), Getting Started with Conjoint Analysis. Madison, USA: Research Publishers.
Burkitt, L., & Bruno, K. (2010). New, improved and failed. Forbes, March, 24.
Burton, A., & Patterson, S. (1999). Integration of consumer and management in NPD. Journal-Market Research Society, 41, 61-74.
Calantone, R. J., Schmidt, J. B., & Song, X. M. (1996). Controllable factors of new product success: a cross-national comparison. Marketing Science, 15(4), 341-358.
Calder, B. J. (1977). Focus groups and the nature of qualitative marketing research. Journal of Marketing Research, XIV(August), 353–364.
Capon, N., & Glazer, R. (1987). Marketing and technology: a strategic co-alignment. The Journal of Marketing, 23 1-14.

149
Carroll, J. D. (1972). Individual differences and multi-dimensional scaling. In R. N. Shepard, A. K. Romney, & S. B. Nerlove (Eds.), Multidimensional scaling: theory and applications in the behavioral sciences (pp. 105–155). New York: Seminar Press.
Chang, S.L. & Chen, C.Y., (2011), Conceptualising, assessing and managing front end fuzziness in innovation/NPD projects, R&D Management, 37(5), 211-230.
Christensen, G. L., & Olson, J. C. (2002). Mapping consumers’ mental models with ZMET. Psychology & Marketing, 19(6), 477–502.
Churchill, G. & Iacobucci, D. ( 2002). Marketing Research, Methodoligal Foundations. 8th Ed. London: Harcourt Publishing.
Churchill, G. A., & Peter, J. P. (1995). Marketing: Creating value for customers. Burr Ridge, Ill: Irwin.
Claeys, C., Swinnen, A., & Vanden Abeele, P. (1995). Consumers’ means-end chains for ‘think’ and ‘feel’ products. International Journal of Research in Marketing, 12, 193–208.
Cochran, W. G. (1977). Sampling techniques (3rd ed.). New York: John Wiley & Sons.
Collins, A. M., & Loftus, E. F. (1975). A spreading-activation theory of semantic processing. Psychological Review, 82(6), 407–428.
Coombs, C. H. (1964). A theory of data. New York: Wiley.
Cooper, R. G. (1988). Predevelopment activities determine new product success. Industrial Marketing Management, 17(3), 237-247.
Cooper, R. G. (1990). Stage-gate systems: a new tool for managing new products. Business Horizons, 33(3), 44-54.
Cooper, R. G. (1994). New products: the factors that drive success. International Marketing Review, 11(1), 60-76.
Cooper, R. G. (1999). The invisible success factors in product innovation. Journal of product innovation management, 16(2), 115-133.
Cooper, R. G. (2008). Perspective: The Stage-Gate Idea to Launch process update, What’s new and Nexgen systems. Journal of Product innovation Management, 25/3, 213-232.
Cooper, R. G., & De Brentani, U. (1984). Criteria for screening new industrial products. Industrial Marketing Management, 13(3), 149-156.

150
Cooper, R. G., & Edgett, S. J. (2008). Maximizing productivity in product innovation. Research-Technology Management, 51(2), 47-58.
Cooper, R. G., & Kleinschmidt, E. J. (1986). An investigation into the new product process: steps, deficiencies, and impact. Journal of product Innovation management, 3(2), 71-85.
Cooper, R. G., & Kleinschmidt, E. J. (1987). New products: what separates winners from losers?. Journal of product innovation management, 4(3), 169-184.
Cooper, R.G., & Kleinschmidt, E.J. (1996). Winning businesses in product development: the critical success factors. Research Technology Management, 39(4), 18-29.
Corfman, K. P. (1991). Comparability and comparison levels used in choices among consumer products. Journal of Marketing Research, 368-374.
Cornelius, H. & Verworn, B. (2001). The" fuzzy front end" of innovation (No. 4). Working Papers/ Technologie-und Innovations management, Technische Universität Hamburg-Harburg.
Costa, A. D. A., Dekker, M., & Jongen, W. M. F. (2004). An overview of means-end theory: potential application in consumer-oriented food product design. Trends in Food Science & Technology, 15(7), 403- 415.
Coulter, R. A., Zaltman, G., & Coulter, K. S. (2001). Interpreting consumer perceptions of advertising: an application of the Zaltman Metaphor Elicitation Technique. Journal of Advertising, 30(4), 1–21.
Crawford, C. M. (1987). New product failure rates: a reprise. Research Management, 30(4), 20-24.
Creusen, M. E., & Schoormans, J. P. (2005). The different roles of product appearance in consumer choice. Journal of product innovation management, 22(1), 63-81.
Currim, I. S., Weinberg, C. B., & Wittink, D. R. (1981). Design of subscription programs for a performing arts series. Journal of Consumer Research, 67-75.
Day, G. S. (1994). The capabilities of market-driven organizations. the Journal of Marketing, 37-52.
Day, G. S. (2000). Capabilities for forging customer relationships (No. 118). New York: Marketing Science Institute.

151
Delbecq A.L., Van de Ven A.H. & Gustafson D.H. (1975) Group Techniques for Program Planning: A Guide to Nominal and Delphi Processes. Scott, Foresman and Co., Glenview, IL.
Deshpande, R., & Zaltman, G. (1984). A comparison of factors affecting researcher and manager perceptions of market research use. Journal of Marketing Research, 32-38.
Donoghue, S. (2000). Projective techniques in consumer research. Journal of Family Ecology and Consumer Sciences/Tydskrif vir Gesinsekologie en Verbruikerswetenskappe, 28(1).
Dougherty, D. (1992). Interpretive barriers to successful product innovation in large firms. Organization Science, 3(2), 179-202.
Dubiel, A., & Ernst, H. (2012). Success Factors of New Product Development for Emerging Markets. The PDMA Handbook of New Product Development, 100-114.
Eliashberg, J., Lilien, G. L., & Rao, V. R. (1997). 12 Minimizing technological oversights: A marketing research perspective Technological innovation: oversights and foresights, 214.
Fern, E. F. (1982). The use of focus groups for idea generation: the effects of group size, acquaintanceship, and moderator on response quantity and quality. Journal of Marketing Research, X1X (February), 1-13.
Frewer, L. J., Howard, C., Hedderley, D., & Shepherd, R. (1997). Consumer attitudes towards di erent food-processing technologies used in cheese production––the mediating in uence of consumer bene t. Food Quality and Preference, 8, 271–280.
Gilb, T., (2008). What’s wrong with quality function deployment (QFD)? And how to do better with impact estimation tables?Software Quality Professional, 10,4.
Goldenberg, J., & Mazursky, D. (2002). Creativity in product innovation.London: Cambridge University Press.
Goldenberg, J., Lehmann, D. R., & Mazursky, D. (2001). The idea itself and the circumstances of its emergence as predictors of new product success. Management Science, 47(1), 69-84.
Goldenberg, J., Mazursky, D., & Solomon, S. (1999). Creative sparks. Science, 285(5433), 1495-1496.
152
Green, P. E., & Carmone, F. J. (1969).Multidimensional scaling. An introduction and comparison of nonmetric unfolding techniques. Journal of Marketing Research, 6(August), 330–341.
Green, P. E., & Rao, V. R. (1971). Conjoint measurement for quantifying judgmental data. Journal of Marketing Research, 355-363.
Green, P. E., & Srinivasan, V. (1978). Conjoint analysis in consumer research: issues and outlook. Journal of Consumer Research, 5,103–152.
Green, P. E., & Srinivasan, V. (1990). Conjoint analysis in marketing: new developments with implications for research and practice. The Journal of Marketing, 3-19.
Green, P. E., Krieger, A. M., & Wind, Y. (2001). Thirty years of conjoint analysis: re ections and prospects. Interfaces, 31(3, part 2), S56–S73.
Greenbaum, T. L. (1997).The handbook for focus group research. Utah: SAGE Publications, Incorporated.
Greenhoff, K., & MacFie, H. J. H. (1994). Preference mapping in practice. In H. J. H. MacFie & D. M. H. Thomson (Eds.), Measurement of food preferences (pp. 137–166). Glasgow: Blackie Academic & Professional.
Griffin, A. (1997). The effect of project and process characteristics on product development cycle time. Journal of Marketing Research, 24-35.
Griffin, A., & Hauser, J. R. (1992). Patterns of communication among marketing, engineering and manufacturing-A comparison between two new product teams. Management Science, 38(3), 360-373.
Griffin, A., & Hauser, J. R. (1993). The voice of the customer. Marketing science, 12 (1), 1-27.
Griffin, A., & Hauser, J. R. (1997). Integrating R&D and marketing: a review and analysis of the literature. Journal of product innovation management, 13(3), 191-215.
Griffin, A., & Page, A. L. (1996). PDMA success measurement project: recommended measures for product development success and failure. Journal of product innovation management, 13(6), 478-496.
Gruner, K. E., & Homburg, C. (2000). Does customer interaction enhance new product success?. Journal of business research, 49(1), 1-14.
153
Guinard, J., Uotani, B., & Schlich, P. (2001). Internal and external mapping of preferences for commercial lager beers: comparison of hedonic ratings by consumers blind versus with knowledge of brand and price. Food Quality and Preference, 12(4), 243–255.
Gupta, A. K., & Wilemon, D. (1988). The credibility-cooperation connection at the R&D-marketing interface. Journal of Product Innovation Management, 5(1), 20-31.
Gupta, A. K., Raj, S. P., & Wilemon, D. (1985). The R&D-marketing interface in high-technology firms. Journal of Product Innovation Management, 2(1), 12-24.
Gutman, J. (1982). A means-end chain model based on consumer categorization processes. The Journal of Marketing, 60-72.
Hair, J.F, Anderson, R.E, Tatham, R.L & Black,W.C. (1998). Multivariate Data Analysis. 5th Ed. Upper Saddle River, New Jersey: Prentice-Hall International.
Hamilton, B. A. (1982). New products management for the 1980s. New York: Booz-Allen Hamilton Inc.
Hart, O. (1995). Corporate governance: some theory and implications. The Economic Journal, 105(430), 678-689.
Hart, SJ. (1993) Dimensions of Success in New Product Development: An Exploratory Investigation. Journal of Marketing Management 9:23-41.
Hastie, R. & Park, B. (1987). Perception of variability in category development: Instance-versus abstraction-based stereotypes. Journal of Personality and Social Psychology, 53(4), 621.
Hauser, J. R. & Clausing, D. (1988). The house of quality. Journal of Product Innovation Management, 19(5), 332-353.
Henard, D. H., & Szymanski, D. M. (2001). Why some new products are more successful than others. Journal of marketing Research, 362-375.
Herstatt, C., & Von Hippel, E. (1992). From experience: developing new product concepts via the lead user method: a case study in a ‘low-tech’ eld. Journal of Product Innovation Management, 9, 213–221.
Hise, R. T., O'Neal, L., McNeal, J. U., & Parasuraman, A. (1989). The effect of product design activities on commercial success levels of new industrial products. Journal of product innovation management, 6(1), 43-50.
154
Hise, R. T., O'Neal, L., Parasuraman, A., & McNeal, J. U. (1990). Marketing/R&D interaction in new product development: implications for new product success rates. Journal of Product Innovation Management, 7(2), 142-155.
Huang, S. C. T., & Tsai, K. H. (2013). Exploring the drivers of new product success for businesses in Asia: a meta-analysis. Asia Pacific Business Review, 19(3), 303-319.
Hughes, G. D., & Chafin, D. C. (1996). Turning new product development into a continuous learning process. Journal of Product Innovation Management, 13(2), 89-104.
Jacoby, J., R.W. Chestnut, W.D. Hoyer, D. W. Sheluga, & M.J. Donahue (1978). Psychometric Characteristics of Behavioural Process .In Advances in Consumer Research, Vol. 5, H. Keith Hunt, ed. Data: Preliminary Findings on Validity and Generalizability (pp.546-547).Ann Arbor, MT: Association for Consumer Research, 546-547
Johne, A. & Snelson, P. (1988) Successful New Product Development. Oxford: Blackwell
Johnson, M. D., & Fornell, C. (1991). A framework for comparing customer satisfaction across individuals and product categories. Journal of Economic Psychology, 12(2), 267-286.
Kahn, K.B. (1996). Interdepartmental integration:a definition with implications for product development performance. Journal of product innovation management, 13(2), 137-151.
Kahn, K.B. (2011). Product planning essential, 2nd ed. Armonk, NY: M.E. Sharp.
Kaul, A., & Rao, V. R. (1995). Research for product positioning and design decisions: An integrative review. International Journal of research in Marketing, 12(4), 293-320.
Kelly, G. A. (1955). The psychology of personal constructs. New York: Norton.
Khurana, A., & Rosenthal, S. R. (1998). Towards holistic “front ends” in new product development. Journal of Product Innovation Management, 15(1), 57-74.
Kitzinger, J. (1994). The methodology of focus groups: the importance of interaction between research participants. Sociology of health & illness, 16(1), 103-121.
Koehler, D. J. (1991). Explanation, imagination, and confidence in judgment. Psychological bulletin, 110(3), 499.

155
Kohli, A. K. & Jaworski, B. J. (1990), "Market Orientation: The Construct, Research Propositions, and Managerial Implications," Journal of Marketing, 54 (April), 1- 18.
Kotler, P. (2000). Marketing Management. The Millennium Edition. London: Prentice-Hall.
Kotler, P. (2003). Marketing insights from A to Z: 80 concepts every manager needs to know. New York: Wiley.
Krantz, D. H., & Tversky, A. (1971). Conjoint-measurement analysis of composition rules in psychology. Psychological Review, 78(2), 151.
Krieger, B., Cappuccio, R., Katz, R., & Moskowitz, H. (2003). Next generation healthy soup: an exploration using conjoint analysis. Journal of Sensory Studies, 18(3), 249–268.
Kuester, S., Homburg, C., & Hess, S. C. (2012). Externally directed and internally directed market launch management: the role of organizational factors in influencing new product success. Journal of Product Innovation Management, 29(S1), 38-52.
Lefkoff-Hagius, R., & Mason, C. H. (1993). Characteristic, beneficial, and image attributes in consumer judgments of similarity and preference. Journal of Consumer Research, 100-110.
Leonard, D. (1995). Wellsprings of knowledge. Building and sustaining the sources of innovation. Boston, Massachusetts: Harvard Business School Press.
Leonard, D., & Rayport, J. F. (1997). Spark innovation through empathic design. Harvard business review, 75, 102-115.
Leonard, D., & Sensiper, S. (1998). The role of tacit knowledge in group innovation. California Management Review, 40(3), 112–132.
Likert, R. (1932). A technique for the measurement of attitudes. Archives of psychology.
Lilien, G. L., & Rangaswamy, A. (1998). Marketing engineering:Computer-assisted marketing analysis and planning. Boston, MA: Addison- Wesley-Longman.
Lilien, G. L., Morrison, P. D., Searls, K., Sonnack, M., & Von Hippel, E. (2002). Performance assessment of the lead user idea generation process. Management Science, 48(8), 1042–1059.
156
Luce, R. D., & Tukey, J. W. (1964). Simultaneous conjoint measurement: A new type of fundamental measurement. Journal of mathematical psychology, 1(1), 1-27.
Madhavan, R., & Grover, R. (1998). From embedded knowledge to embodied knowledge: new product development as knowledge management. The Journal of marketing, 1-12.
Mahajan, V., & Wind, J. (1992). New product models: practice, shortcomings and desired improvements. Journal of Product Innovation Management, 9(2), 128-139.
Malaga, R. A. (2001). Web-based reputation management systems: Problems and suggested solutions. Electronic Commerce Research, 1(4), 403-417.
Malhotra, N. K., Peterson, M., & Kleiser, S. B. (1999). Marketing research: a state-of-the-art review and directions for the twenty-first century. Journal of the Academy of Marketing Science, 27(2), 160-183.
Maltz, E., & Kohli, A. K. (1996). Market intelligence dissemination across functional boundaries. Journal of Marketing Research, 47-61.
Markham, S. K. (2013). The Impact of Front-End Innovation Activities on Product Performance. Journal of Product Innovation Management.
Mascitelli, R. (2000). From experience: harnessing tacit knowledge to achieve breakthrough innovation. Journal of product innovation management, 17(3), 179-193.
McGuinness, N. W., & Conway, H. A. (1989). Managing the search for new product concepts: a strategic approach. R&D Management, 19(4), 297-308.
McNeill, K. L., Sanders, T. H., & Civille, G. V. (2000). Using focus groups to develop a quantitative consumer questionnaire for peanut butter. Journal of Sensory Studies, 15, 163–178.
McQuarrie, E. F., & McIntyre, S. H. (1986). Focus groups and the development of new products by technologically driven companies: some guidelines. Journal of Product Innovation Management, 1, 40–47.
Menon, A., & Varadarajan, P. R. (1992). A model of marketing knowledge use within firms. The Journal of Marketing, 53-71.
Miller, C & Swaddling, D. C. (2002). Don't measure customer satisfaction. Quality Progress, 35(5), 62-67.

157
Moenaert, R. K., & Souder, W. E. (1990). An information transfer model for integrating marketing and R&D personnel in new product development projects. Journal of product innovation management, 7(2), 91-107.
Moenaert, R. K., & Souder, W. E. (1996). Context and antecedents of information utility at the R&D/marketing interface. Management science, 42(11), 1592-1610.
Montoya-Weiss, M. M., & Calantone, R. (1994). Determinants of new product performance: a review and meta-analysis. Journal of product innovation management, 11(5), 397-417.
Montoya-Weiss, M. M., & O'Driscoll, T. M. (2000). From experience: applying performance support technology in the fuzzy front end. Journal of Product Innovation Management, 17(2), 143-161.
Morgan, D. L., & Spanish, M. T. (1984). Focus groups: A new tool for qualitative research. Qualitative sociology, 7(3), 253-270.
Moskowitz, H. R. (1985). New directions for product testing and sensory analysis of foods. Food and Nutrition Press.
Moskowitz, H. R. (1994). Food concepts and products .Just-in- time development. Trumbell, Connecticut: Food and Nutrition Press.
Myers, J. H., & Shocker, A. D. (1981). The nature of product-related attributes. Research in marketing, 5(5), 211-236.
Narver, J. C., & Slater, S. F. (1990). The effect of a market orientation on business profitability. The Journal of Marketing, 20-35.
Narver, J.C. & Slater, S. F. (2000). The positive effect of a market orientation on business profitability: a balanced replication. Journal of business research, 48(1), 69-73.
Narver, J. C., Slater, S. F., & MacLachlan, D. L. (2004). Responsive and Proactive Market Orientation and New-Product Success. Journal of Product Innovation Management, 21(5), 334-347.
Nielsen, A.C (2010). New product introduction and success: A fragile boundary. New York: Ernest & Young.
Nielsen, N. A., Bech-Larsen, T., & Grunert, K. G. (1998). Consumer purchase motives and product perceptions: a laddering study on vegetable oil in three countries. Food Quality and Preference, 9(6), 455–466.
158
Nijssen, E. J., & Frambach, R. T. (2000). Determinants of the adoption of new product development tools by industrial firms. Industrial Marketing Management, 29(2), 121-131.
Nijssen, E. J., & Lieshout, K. F. (1995). Awareness, use and effectiveness of models and methods for new product development. European Journal of Marketing, 29(10), 27-44.
Nowlis, S. M., & Simonson, I. (1997). Attribute-task compatibility as a determinant of consumer preference reversals. Journal of Marketing Research, 205-218.
Nyström, H. (1985). Product development strategy: An integration of technology and marketing. Journal of Product innovation management, 2(1), 25-33.
Oliver, R. L., Rust, R. T., & Varki, S. (1997). Customer delight: foundations, findings, and managerial insight. Journal of Retailing, 73(3), 311-336.
Olson, E. L., & Bakke, G. (2001). Implementing the lead user method in a high technology rm: a longitudinal study of intentions versus actions. Journal of Product Innovation Management, 18, 388–395.
Ortt, R. J., & Schoormans, J. P. (1993). Consumer research in the development process of a major innovation. Journal of the Market Research Society, 6(3), 63-71.
Ottum, B. D., & Moore, W. L. (1997). The role of market information in new product success/failure. Journal of Product Innovation Management, 14(4), 258-273.
Ozer, M. (1999). A survey of new product evaluation models. Journal of Product Innovation Management, 16(1), 77-94.
Parasuraman, A. (1991). Marketing research (2nd ed.). Amsterdam: Addison-Wesley.
Patnaik, D., & Becker, R. (1999). Needfinding: the why and how of uncovering people's needs. Design Management Journal (Former Series), 10(2), 37-43.
Perrin, J. (2001). Concevoir l’innovation industrielle-Méthodologie de conception de l’innovation. CNRS Editions. ISBN 2-271-05822-8, Paris: Charles Publication.
Poh, K. L., Ang, B. W., & Bai, F. (2001). A comparative analysis of R&D project evaluation methods. R&D Management, 31(1), 63-75.
Polanyi, M. (1966). The tacit dimension. New York: Doubleday
159
Poolton, J., & Barclay, I. (1998). New product development from past research to future applications. Industrial Marketing Management, 27(3), 197-212.
Porter, Michael E., (1990).The Competitive Advantage of Nations, New York: Free Press.
Reynolds, T. J., & Gutman, J. (1988). Laddering theory, method, analysis, and interpretation. Journal of Advertising Research, 28(1), 11–31.
Richardson-Harman, N. J., Stevens, R., Walker, S., Gamble, J. Miller, M., Wong, M., & McPherson, A. (2000). Mapping consumer perceptions of creaminess and liking for liquid dairy products. Food Quality and Preference, 11, 239–246
Rochford, L. (1991). Generating and screening new products ideas. Industrial Marketing Management, 20(4), 287-296.
Roozenburg, N. F. M., & Eekels. (1995). J. Product design: fundamentals and methods. New York: Richards Group.
Rosenau, M. D. (1988). From experience: Faster new product development. Journal of Product Innovation Management, 5(2), 150-153.
Rothwell, R. (1992). Successful industrial innovation: critical factors for the 1990s. R&D Management, 22(3), 221-240.
Sampson, P. (1972). Using the Repertory Grid test. Journal of Marketing Research, IX (February), 78–81.
Schoormans, J. P., Ortt, R. J., & Bont, C. J. (1995). Enhancing concept test validity by using expert consumers. Journal of Product Innovation Management, 12(2), 153-162.
Sheth, J. N., Mittal, B., & Newman, B. (1999). Consumer behavior and beyond. NY: Harcourt Brace.
Shocker, A. D., & Srinivasan, V. (1979). Multiattribute approaches for product concept evaluation and generation: A critical review. Journal of Marketing Research, 159-180.
Simonson, I., Carmon, Z., & O'Curry, S. Stephen M. Nowlis, and Yael Simonson (1993). The Effect of Irrelevant Preference Arguments on Consumer Choice. Journal of Consumer Psychology, 2(3), 287-306.
Slater, S. F., & Narver, J. C. (2000). Intelligence generation and superior customer value. Journal of the Academy of Marketing Science, 28(1), 120-127.
160
Smith, N. C. (2003). Corporate Social Responsibility: not whether, but how. Center for Marketing Working Paper, (03-701).
Song, X. M., Neeley, S. M., & Zhao, Y. (1996). Managing R&D-marketing integration in the new product development process. Industrial Marketing Management, 25(6), 545-553.
Song, X. M., Thieme, R. J., & Xie, J. (1998). The Impact of Cross-Functional Joint Involvement Across Product Development Stages: An Exploratory Study. Journal of Product innovation management, 15(4), 289-303.
Steenkamp, J.B.E.M.& Van Trijp, H.C.M., (1991). The use of LISREL in validating marketing constructs. International Journal of Research in Marketing 8(4), 283–299
Steven, H., (2013). Strategies to improve NPD governance. The PDMA hand book of NPD, 17(Jan-13),310-324. Doi:10.1002/9781118466421.Ch19/pdf.
Sudman, S & Blair, E. (1998). Marketing Research. Boston: McGraw Hill.
Sullivan, L.P. (1986) Quality function deployment. Quality Progress (American Society for Quality Control), 6 (3), 133-140.
Szymanski, D. M., & Henard, D. H. (2001). Customer satisfaction: a meta-analysis of the empirical evidence. Journal of the academy of marketing science, 29(1), 16-35.
Thomas, J. & Chandrasekaran, K. (2013a). Application of VoC Translation Tools: A Case Study. International Journal of Management (IJM). Journal Impact Factor, 4(1), 24-37.
Thomas, J. & Chandrasekaran, K. (2013b). Conjoint analysis: A perfect link between Marketing and Product Design-A review. International Journal of Management Research And Development, Volume 3,Number 1, January- March 2013, 10-21
Thomson, D. M. H., & McEwan, J. A. (1988). An application of the repertory grid to investigate consumer perceptions of foods. Appetite, 10, 181– 193.
Thrash, T. M., & Elliot, A. J. (2003). Inspiration as a psychological construct. Journal of Personality and Social Psychology, 84(4), 871-889.
Tsai, K. H., Chou, C., & Kuo, J. H. (2008). The curvilinear relationships between responsive and proactive market orientations and new product performance: a contingent link. Industrial Marketing Management, 37(8), 884-894.
161
Tucker, L. R. (1960). Psychological scaling: Theory and Applications. New York: John Wiley & Sons.
Ulrich, K. T & Eppinger, S, D (2004). Product design and development. New York: McGraw Hill Publishing.
Ulwick, A. W. (2002). Turn customer input into innovation. Harvard Business Review (January), 92–97.
Urban, G. L., Hauser, J. R., Qualls, W. J., Weinberg, B. D., Bohlmann, J. D., & Chicos, R. A. (1997). Information acceleration: validation and lessons from the eld. Journal of Marketing Research, XXXIV (February), 143–153.
Urban, G. L., & Von Hippel, E. (1988). Lead user analyses for the development of new industrial products. Management Science, 34(5), 569–582.
Urban, G. L., Weinberg, B. D., & Hauser, J. R. (1996). Premarket forecasting of really-new products. The Journal of Marketing, 47-60.
Urban, G.L, & Hauser, J. R. (1977). A normative methodology for modelling consumer response to innovation. Operations Research, 25(4), 579-619.
Urban, G.L & Hauser, J. R. (1993). Design and Marketing of New Products, 2d ed. Englewood Cliffs, NJ: Prentice-Hall, Inc.
V-Van-Trijp, J. C. M., & Steenkamp, J. E. B. M. (2005). Consumer-oriented new product development: principles and practice. Innovation in agri-food systems. Product quality and consumer acceptance, 37-66.
Van de Ven, A. H., & Delbecq, A. L. (1972). The nominal group as a research instrument for exploratory health studies. American Journal of Public Health, 62(3), 337-342.
Von Hippel, E. (1986). Lead users: a source of novel product concepts. Management Science, 32(7), 791–805.
Von Hippel, E. (1988). The sources of innovation. New York: Oxford University Press.
Von Hippel, E. (2009). Democratizing innovation: the evolving phenomenon of user innovation. International Journal of Innovation Science, 1(1), 29-40.
Von, H.E. & Katz, R. (2002). Shifting innovation to users via toolkits. Management Science, 48(7), 821–833.
Von, H.E., Thomke, S., & Sonnack, M. (1999). Creating breakthroughs at 3M. Harvard Business Review, 77(5), 47–57.
162
Walker, B. A., & Olson, J. C. (1991). Means-end chains: connecting products with self. Journal of Business Research, 22(2), 111-118.
Wheelwright, S. C. & Clark. K. B., (1992), Revolutionizing Product Development, New York: The Free Press.
Wheelwright, S. C. (2010). Managing New Product and Process Development: Text Cases. SimonandSchuster. com.
Wind, J., & Mahajan, V. (1997). Editorial: issues and opportunities in new product development: an introduction to the special issue. Journal of Marketing Research, 34(1), 1-12.
Wind, Y. J., & Lilien, G. L. (1993). Marketing strategy models. Handbooks in Operations Research and Management Science, 5, 773-826.
Woodruff, R. B. (1997). Customer value: the next source for competitive advantage. Journal of the academy of marketing science, 25(2), 139-153.
Zaltman, G. (1997). Rethinking market research: putting people back in. Journal of Marketing Research, XXXIV(November), 424–437.
Zaltman, G., & Coulter, R. H. (1995). Seeing the voice of the customer: metaphor-based advertising research. Journal of Advertising Research (July/August), 35–51.
Zirger, B. J., & Maidique, M. A. (1990). A model of new product development: an empirical test. Management Science, 36(7), 867-883.

163
LIST OF PUBLICATIONS
1. Thomas, J. and Chandrasekaran, K. “Application of VoC (Voice of the customer) translation tool- A case study”, published in the International Journal Of Management Volume 4, Issue 1, January-February 2013, ISSN0976-6502 (Print), ISSN 0976-6510 (ONLINE)
2. Thomas, J. and Chandrasekaran, K. “Conjoint Analysis: A perfect link between marketing and product design functions- A Review”, published in the International Journal Of Management Research And Development, Volume 3, Number 1, January- March 2013, ISSN 2248-938X (PRINT), ISSN 2248-9398 (ONLINE)

164
BIOGRAPHY
THOMAS JOSEPH (Scholar)
Thomas Joseph was born in 1966, in the Southern town of Madurai, in
Tamilnadu. He did his schooling at Jabalpur and Nagpur. He graduated from the
Faculty of Mechanical Engineering, Annamalai University, in the year 1987. Since
then, he has been employed in various automotive and non-automotive multinational
companies. He has served in various functions like Manufacturing; Process
planning, Product Development and Business Development, spanning 26 years. He
is specialised in New Product Development and the role of Market and Marketing
Research, especially in this period of volatile market conditions. Thomas Joseph
completed his PGDBA (Post graduate diploma in Business Administration) from
LIBA (Loyola Institute of Business Administration) in the year 1993 and his M.S
(Master of Science in Manufacturing Management) from BITS, Pilani in the year
2004. He is a certified six sigma black belt from ASQ (American Society of
Quality) and is proficient in the application of statistical tools, using MINITAB
software. Currently, he is Head of Manufacturing of a reputed company and is
responsible for the entire India operations. He is based out of Chennai.

165
BIOGRAPHY
Dr. KESAVAN CHANDRASEKARAN (Supervisor)
Dr. Kesavan Chandrasekaran, holds a Bachelor’s degree in Mechanical
Engineering from the University of Madras, a Master’s and Doctoral degrees from
IIT Madras. He has over 45 years of experience in teaching UG & PG students in
Mechanical Engineering, and guiding research. Prior to taking voluntary retirement,
he was the Director of the Anna University-Federal Republic of Germany Institute
for CAD/CAM, Anna University and a Professor of Mechanical Engineering, Anna
University, Chennai, Tamilnadu. Currently he is the Dean at R.M.K.Engineering
College, Chennai. He is the founder member of the Product Development &
Management Association (PDMA India), an affiliate of PDMA, USA. He is
currently a member of the Senate of Indian Institute of Information Technology-
Design & Manufacturing, Kanchipuram, Tamilnadu. He has been a member of the
Syndicate & Academic Council of Anna University, Chennai. He has guided to
completion 6 doctoral dissertations and is currently guiding 4 doctoral research
students in areas related to vibrational analysis, composite mechanics, and Product
Design & Development. He has over 35 publications in International Journals and
Conference Proceedings. He has been a consultant to many automotive industries
and has undertaken a number of funded projects.