Embed Size (px)
Citation preview
Powder Metallurgy Progress, Vol.13 (2013), No 1 3
APPLICATION OF COMPUTATIONAL SOFTWARE FOR DESIGN AND STUDY NEW TYPES OF ALLOYS
P. Shykula, E. Dudrová, R. Frykholm, S. Bengtsson
Abstract The contribution deals with the microstructure development of a heterogeneous system based on a water atomized iron powder Höganäs ASC 100.29 mixed with a Mn-containing master alloy which was designed using Thermo-Calc software. The specimens in the form of concentric cylinders (the inner cylinder – the master alloy, and the outer cylinder – ASC 100.29 iron powder) were prepared by pressing at 600 MPa. The cylindrical specimens were sintered at temperatures ranging from 700°C to 1200°C in atmosphere of 90N2/10H2 with dew-point less than -65°C. The interface microstructure ASC 100.29/master alloy was studied and the local chemical microanalysis of Mn concentration was performed using SEM+EDX technique. DICTRA software was applied for simulation of diffusion processes, in particular Mn diffusion, taking place during sintering. The calculated Mn concentration profile was compared with the experimental results. Keywords: master alloy, Thermo-Calc software, DICTRA software, simulation
INTRODUCTION Research and development of material science have given birth of a new approach
in designing various materials. A comprehensive combination of thermodynamic and kinetic models makes it possible to predict material’s structure and properties [1]. Fast development of computational performance has given a possibility to use CALPHAD method for prediction of structure and properties of complex heterogeneous systems theoretically [2-4]. Since the experimental determination of phase diagrams and thermodynamic properties is time and cost consuming process, thus the theoretical approach allowing predict material structure and properties has become relevant nowadays. Advantages of theoretical calculations have been widely used in industry for processes optimization and manufacture products with stable properties at minimal energy cost [5].
EXPERIMENTAL PROCEDURE In present work computational software Thermo-Calc and DICTRA were used for
modelling physical properties of steel and simulation of diffusion process during sintering. Thermo-Calc Classic version R with attached SSOL4 Solution Database was utilized to design a new type of complex Mn-containing master alloy with predefined physical properties. The designed master alloy with the composition of Fe-40wt.%Mn-10wt.%Si-1wt.%C was prepared though gas atomization process with nitrogen used as an atomizing gas. After atomization process the master alloy was sieved to particle size under 25 µm. In
Petro Shykula, Miba Sinter Slovakia, Dolný Kubín, Slovak Republic Eva Dudrová, Institute of Materials Research, Slovak Academy of Sciences, Košice, Slovak Republic R. Frykholm, S. Bengtsson, Höganäs AB, Höganäs, Sweden
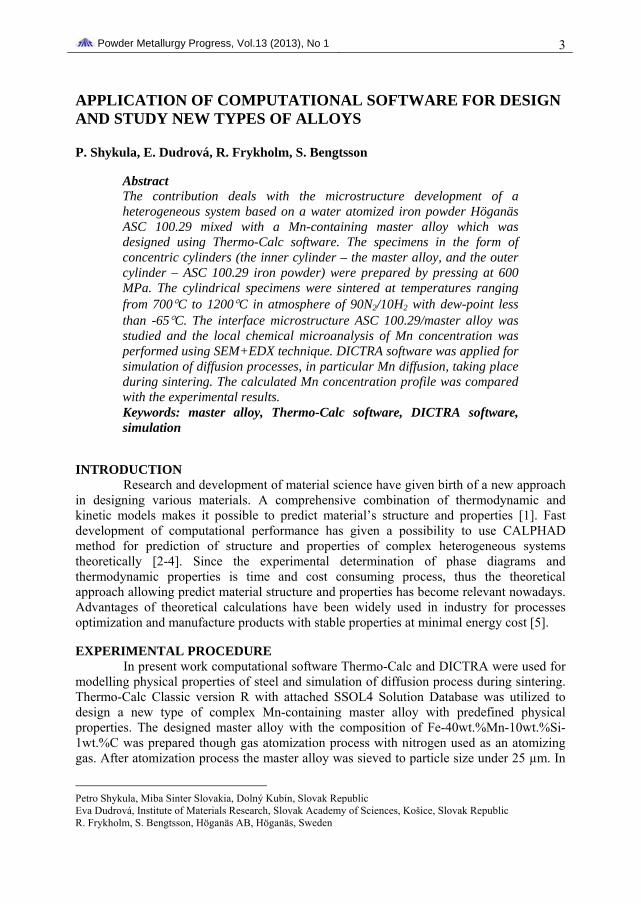
Powder Metallurgy Progress, Vol.13 (2013), No 1 4 order to study Mn diffusion from the master alloy into iron matrix, cylindrical “diffusive pair” specimens “ASC 100.29 Höganäs iron powder + the master alloy” were prepared. The specimens were made in a way that at first green compacts of ASC 100.29 Höganäs iron powder were pressed at 300 MPa in order to be able to drill a small diameter hole (Ø 1.5 mm), and not to damage the specimen during processing. Then a little amount of the master alloy was put in the hole and re-compacted at 600 MPa (see Fig.1). Such prepared specimens were sintered at the temperature of 1200°C for 30 min in a gas mixture atmosphere of 90N2/10H2 with the dew point less than -65oC at the inlet. Both microstructure and the local chemical composition of sintered specimens were analyzed in areas of the master alloy location. The instrument used was Thermal FE SEM JSM-7000F equipped with 10 mm2 EDX Silicon detector INCAx-sight from Oxford Instruments. Simulation of Mn diffusion from the Master Alloy into the iron matrix was performed using DICTRA software v. 24 with attached both SSOL4 Solution Database and MOB2 kinetic database.
Fig.1. Sketch of specimens for studying Mn diffusion from the master alloy into an iron
matrix.
Also ordinary cylindrical specimens of mixture ASC 100.29 and 3 wt.% of the master alloy, with an addition of 0.6 wt.% graphite UF-4 and 0.6 wt.% Kenolube, compacted at 600 MPa, were sintered at the temperatures of 700 - 1120°С. These specimens were used for analysis of the master alloy behaviour at various temperatures in order to study kinetic processes of Mn diffusion and its influence on microstructure formation.
RESULTS AND DISCUSSION
Designing Complex Mn-containing Master Alloy by Use of Thermo-Calc Calculations Thermo-Calc calculations were performed for searching a low melting point in
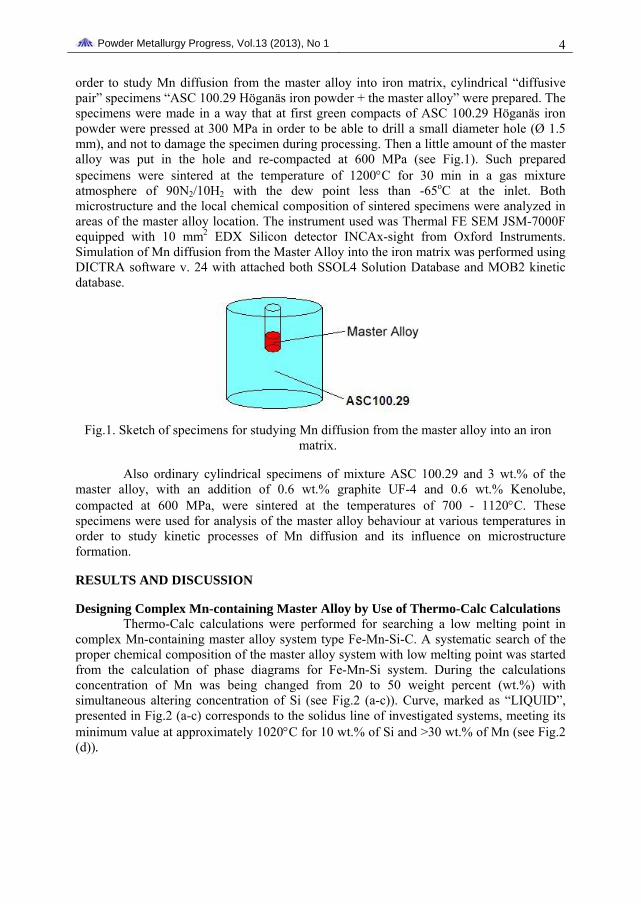
complex Mn-containing master alloy system type Fe-Mn-Si-C. A systematic search of the proper chemical composition of the master alloy system with low melting point was started from the calculation of phase diagrams for Fe-Mn-Si system. During the calculations concentration of Mn was being changed from 20 to 50 weight percent (wt.%) with simultaneous altering concentration of Si (see Fig.2 (a-c)). Curve, marked as “LIQUID”, presented in Fig.2 (a-c) corresponds to the solidus line of investigated systems, meeting its minimum value at approximately 1020°C for 10 wt.% of Si and >30 wt.% of Mn (see Fig.2 (d)).
Powder Metallurgy Progress, Vol.13 (2013), No 1 5
a) b)
c) d)
Fig.2. Phase diagrams of Fe-Mn-Si alloy system for different concentrations of Mn and Si [calculated for temperature range of 700-1600 K].
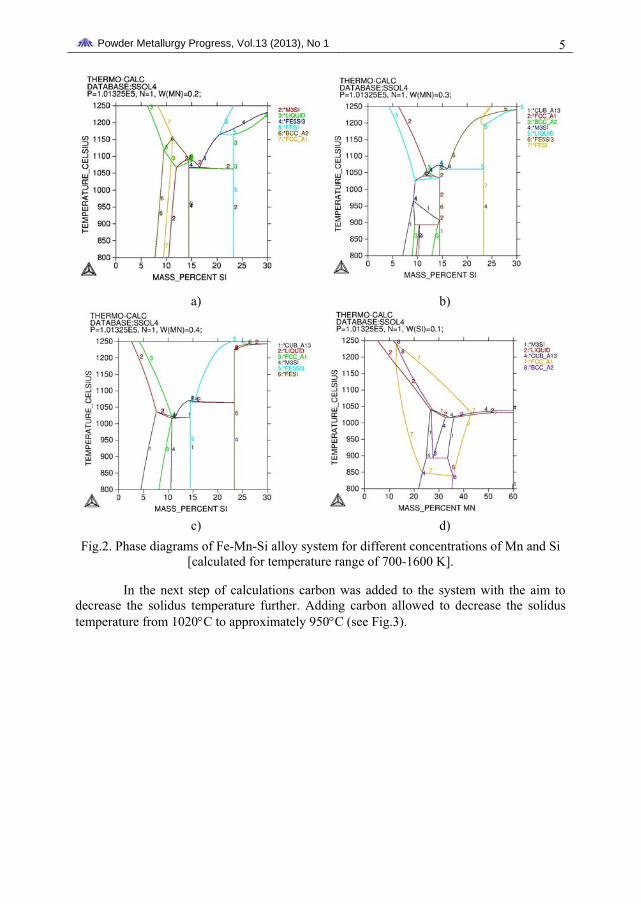
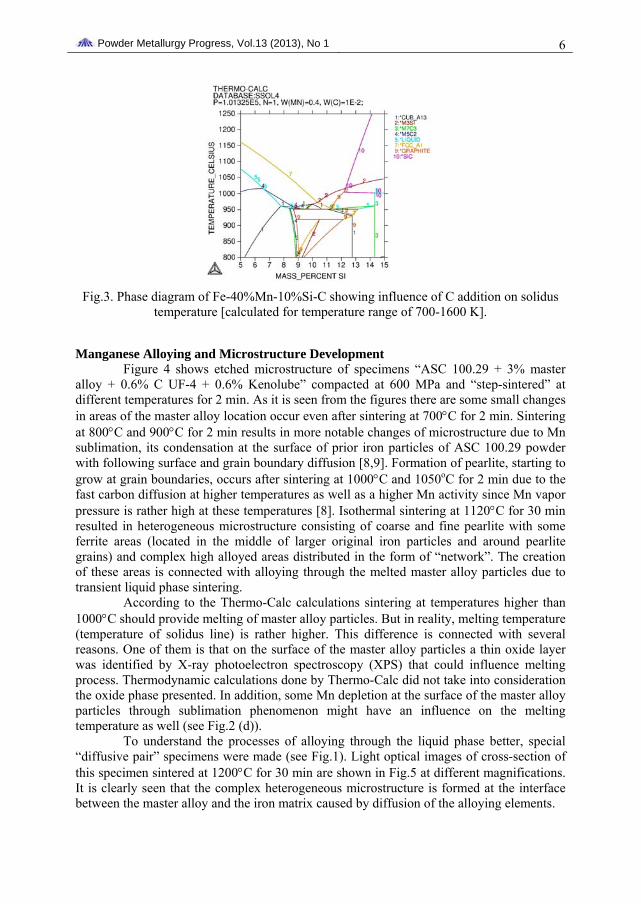
In the next step of calculations carbon was added to the system with the aim to decrease the solidus temperature further. Adding carbon allowed to decrease the solidus temperature from 1020°C to approximately 950°C (see Fig.3).
Powder Metallurgy Progress, Vol.13 (2013), No 1 6
Fig.3. Phase diagram of Fe-40%Mn-10%Si-C showing influence of C addition on solidus
temperature [calculated for temperature range of 700-1600 K].
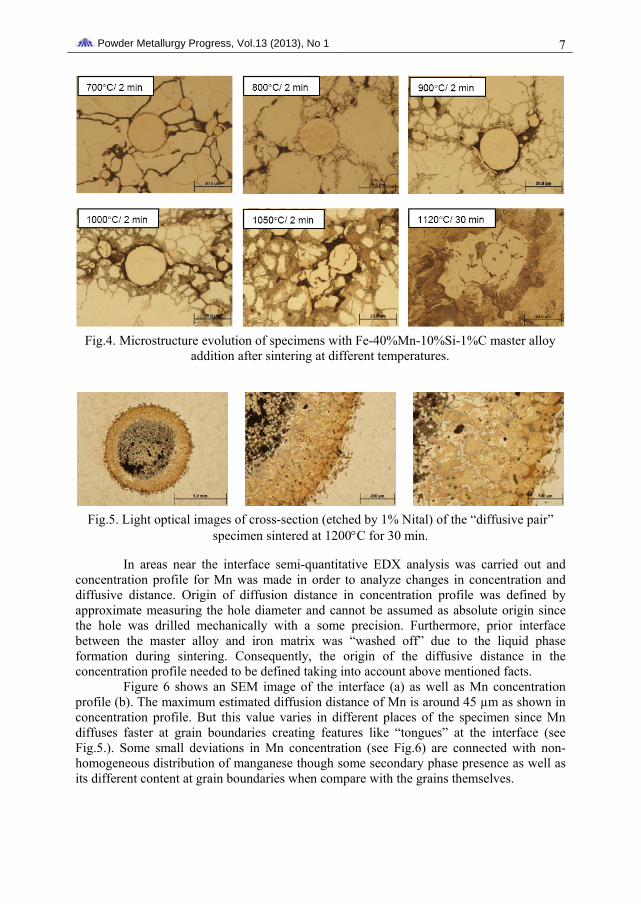
Manganese Alloying and Microstructure Development Figure 4 shows etched microstructure of specimens “ASC 100.29 + 3% master
alloy + 0.6% C UF-4 + 0.6% Kenolube” compacted at 600 MPa and “step-sintered” at different temperatures for 2 min. As it is seen from the figures there are some small changes in areas of the master alloy location occur even after sintering at 700°C for 2 min. Sintering at 800°C and 900°C for 2 min results in more notable changes of microstructure due to Mn sublimation, its condensation at the surface of prior iron particles of ASC 100.29 powder with following surface and grain boundary diffusion [8,9]. Formation of pearlite, starting to grow at grain boundaries, occurs after sintering at 1000°C and 1050oC for 2 min due to the fast carbon diffusion at higher temperatures as well as a higher Mn activity since Mn vapor pressure is rather high at these temperatures [8]. Isothermal sintering at 1120°C for 30 min resulted in heterogeneous microstructure consisting of coarse and fine pearlite with some ferrite areas (located in the middle of larger original iron particles and around pearlite grains) and complex high alloyed areas distributed in the form of “network”. The creation of these areas is connected with alloying through the melted master alloy particles due to transient liquid phase sintering.
According to the Thermo-Calc calculations sintering at temperatures higher than 1000°C should provide melting of master alloy particles. But in reality, melting temperature (temperature of solidus line) is rather higher. This difference is connected with several reasons. One of them is that on the surface of the master alloy particles a thin oxide layer was identified by X-ray photoelectron spectroscopy (XPS) that could influence melting process. Thermodynamic calculations done by Thermo-Calc did not take into consideration the oxide phase presented. In addition, some Mn depletion at the surface of the master alloy particles through sublimation phenomenon might have an influence on the melting temperature as well (see Fig.2 (d)).
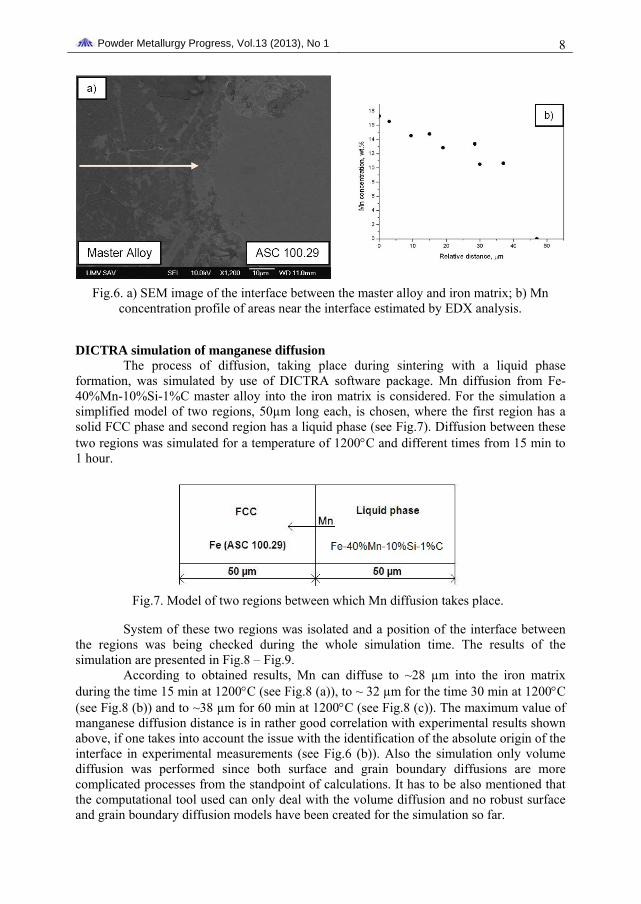
To understand the processes of alloying through the liquid phase better, special “diffusive pair” specimens were made (see Fig.1). Light optical images of cross-section of this specimen sintered at 1200°C for 30 min are shown in Fig.5 at different magnifications. It is clearly seen that the complex heterogeneous microstructure is formed at the interface between the master alloy and the iron matrix caused by diffusion of the alloying elements.
Powder Metallurgy Progress, Vol.13 (2013), No 1 7
Fig.4. Microstructure evolution of specimens with Fe-40%Mn-10%Si-1%C master alloy
addition after sintering at different temperatures.
Fig.5. Light optical images of cross-section (etched by 1% Nital) of the “diffusive pair”
specimen sintered at 1200°C for 30 min.
In areas near the interface semi-quantitative EDX analysis was carried out and concentration profile for Mn was made in order to analyze changes in concentration and diffusive distance. Origin of diffusion distance in concentration profile was defined by approximate measuring the hole diameter and cannot be assumed as absolute origin since the hole was drilled mechanically with a some precision. Furthermore, prior interface between the master alloy and iron matrix was “washed off” due to the liquid phase formation during sintering. Consequently, the origin of the diffusive distance in the concentration profile needed to be defined taking into account above mentioned facts.
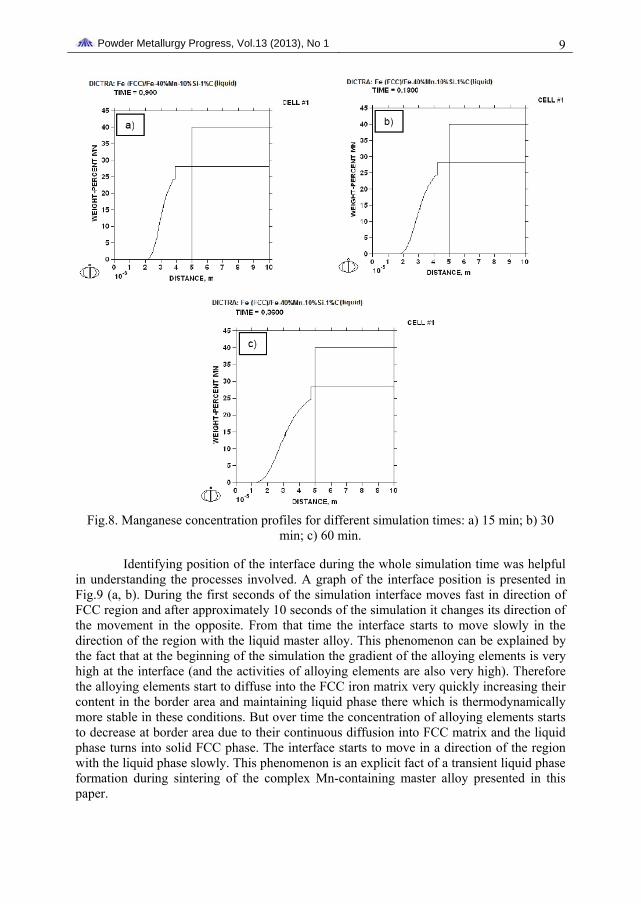
Figure 6 shows an SEM image of the interface (a) as well as Mn concentration profile (b). The maximum estimated diffusion distance of Mn is around 45 µm as shown in concentration profile. But this value varies in different places of the specimen since Mn diffuses faster at grain boundaries creating features like “tongues” at the interface (see Fig.5.). Some small deviations in Mn concentration (see Fig.6) are connected with non-homogeneous distribution of manganese though some secondary phase presence as well as its different content at grain boundaries when compare with the grains themselves.
Powder Metallurgy Progress, Vol.13 (2013), No 1 8
Fig.6. a) SEM image of the interface between the master alloy and iron matrix; b) Mn
concentration profile of areas near the interface estimated by EDX analysis.
DICTRA simulation of manganese diffusion The process of diffusion, taking place during sintering with a liquid phase
formation, was simulated by use of DICTRA software package. Mn diffusion from Fe-40%Mn-10%Si-1%C master alloy into the iron matrix is considered. For the simulation a simplified model of two regions, 50µm long each, is chosen, where the first region has a solid FCC phase and second region has a liquid phase (see Fig.7). Diffusion between these two regions was simulated for a temperature of 1200°C and different times from 15 min to 1 hour.
Fig.7. Model of two regions between which Mn diffusion takes place.
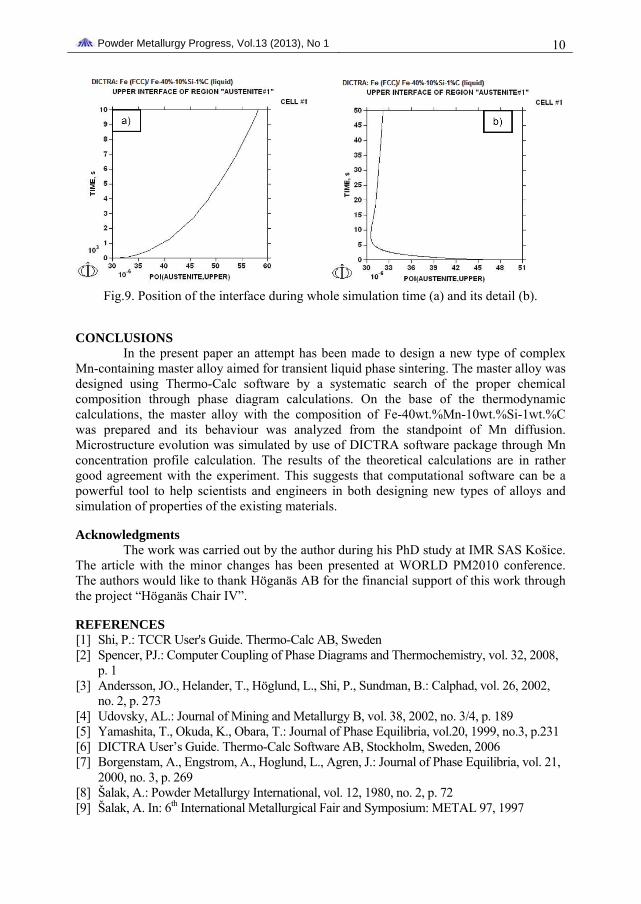
System of these two regions was isolated and a position of the interface between the regions was being checked during the whole simulation time. The results of the simulation are presented in Fig.8 – Fig.9.
According to obtained results, Mn can diffuse to ~28 µm into the iron matrix during the time 15 min at 1200°C (see Fig.8 (a)), to ~ 32 µm for the time 30 min at 1200°C (see Fig.8 (b)) and to ~38 µm for 60 min at 1200°C (see Fig.8 (c)). The maximum value of manganese diffusion distance is in rather good correlation with experimental results shown above, if one takes into account the issue with the identification of the absolute origin of the interface in experimental measurements (see Fig.6 (b)). Also the simulation only volume diffusion was performed since both surface and grain boundary diffusions are more complicated processes from the standpoint of calculations. It has to be also mentioned that the computational tool used can only deal with the volume diffusion and no robust surface and grain boundary diffusion models have been created for the simulation so far.
Powder Metallurgy Progress, Vol.13 (2013), No 1 9
Fig.8. Manganese concentration profiles for different simulation times: a) 15 min; b) 30
min; c) 60 min.
Identifying position of the interface during the whole simulation time was helpful in understanding the processes involved. A graph of the interface position is presented in Fig.9 (a, b). During the first seconds of the simulation interface moves fast in direction of FCC region and after approximately 10 seconds of the simulation it changes its direction of the movement in the opposite. From that time the interface starts to move slowly in the direction of the region with the liquid master alloy. This phenomenon can be explained by the fact that at the beginning of the simulation the gradient of the alloying elements is very high at the interface (and the activities of alloying elements are also very high). Therefore the alloying elements start to diffuse into the FCC iron matrix very quickly increasing their content in the border area and maintaining liquid phase there which is thermodynamically more stable in these conditions. But over time the concentration of alloying elements starts to decrease at border area due to their continuous diffusion into FCC matrix and the liquid phase turns into solid FCC phase. The interface starts to move in a direction of the region with the liquid phase slowly. This phenomenon is an explicit fact of a transient liquid phase formation during sintering of the complex Mn-containing master alloy presented in this paper.
Powder Metallurgy Progress, Vol.13 (2013), No 1 10
Fig.9. Position of the interface during whole simulation time (a) and its detail (b).
CONCLUSIONS In the present paper an attempt has been made to design a new type of complex
Mn-containing master alloy aimed for transient liquid phase sintering. The master alloy was designed using Thermo-Calc software by a systematic search of the proper chemical composition through phase diagram calculations. On the base of the thermodynamic calculations, the master alloy with the composition of Fe-40wt.%Mn-10wt.%Si-1wt.%C was prepared and its behaviour was analyzed from the standpoint of Mn diffusion. Microstructure evolution was simulated by use of DICTRA software package through Mn concentration profile calculation. The results of the theoretical calculations are in rather good agreement with the experiment. This suggests that computational software can be a powerful tool to help scientists and engineers in both designing new types of alloys and simulation of properties of the existing materials.
Acknowledgments The work was carried out by the author during his PhD study at IMR SAS Košice.
The article with the minor changes has been presented at WORLD PM2010 conference. The authors would like to thank Höganäs AB for the financial support of this work through the project “Höganäs Chair IV”.
REFERENCES [1] Shi, P.: TCCR User's Guide. Thermo-Calc AB, Sweden [2] Spencer, PJ.: Computer Coupling of Phase Diagrams and Thermochemistry, vol. 32, 2008,
p. 1 [3] Andersson, JO., Helander, T., Höglund, L., Shi, P., Sundman, B.: Calphad, vol. 26, 2002,
no. 2, p. 273 [4] Udovsky, AL.: Journal of Mining and Metallurgy B, vol. 38, 2002, no. 3/4, p. 189 [5] Yamashita, T., Okuda, K., Obara, T.: Journal of Phase Equilibria, vol.20, 1999, no.3, p.231 [6] DICTRA User’s Guide. Thermo-Calc Software AB, Stockholm, Sweden, 2006 [7] Borgenstam, A., Engstrom, A., Hoglund, L., Agren, J.: Journal of Phase Equilibria, vol. 21,
2000, no. 3, p. 269 [8] Šalak, A.: Powder Metallurgy International, vol. 12, 1980, no. 2, p. 72 [9] Šalak, A. In: 6th International Metallurgical Fair and Symposium: METAL 97, 1997