Embed Size (px)
Citation preview
Application of Charged Aerosol HPLC Detection in Biopharmaceutical Analysis
Bill Kopaciewicz, David Thomas, Bruce Bailey, Qi Zhang, Marc Plante and Ian Acworth Thermo Fisher Scientifi c, Chelmsford, MA
Po
ster No
te 7180
3
Signal is directly proportional to the analyte quantity
1
2
3
4
5 6
7
8
9
Conclusions Charged Aerosol Detection provides a universal
response that does not require a chromophore
Glycans and other carbohydrates can be detected without the need for labeling
Virtually all types of excipients can be detected and quantified
CAD can be combined with UV, Mass Spec. or fluorescence detection to provide a more complete view of the sample
Although not shown here, CAD has also been used for the analysis of phospholipids in liposomes and the quantification of extractables.
© 2015 Thermo Fisher Scientific Inc. All rights reserved. All trademarks are the property of Thermo Fisher Scientific and its subsidiaries unless otherwise specified. This information is not intended to encourage use of these products in any manner that might infringe the intellectual property rights of others.
Application of Charged Aerosol HPLC Detection in Biopharmaceutical Analysis
Bill Kopaciewicz, David Thomas, Bruce Bailey, Qi Zhang, Marc Plante & Ian Acworth, Thermo Fisher Scientific, Chelmsford, MA
0.0 5.0 10.0 15.0 20.0 25.0 30.0 35.0
-5.4
0.0
5.0 MONOSIALYLATED
DISIALYLATED
DIGEST REAGENTS TRISIALYLATED
TETRASIALYLATED
ALDITOLS STANDARD
FETUIN
a1-ACID GLYCOPROTEIN
Column: Thermo Scientific™ GlycanPac™ AXR-1 1.9 µm, 2.1 x 100 mm Column Temp: 30 °C Flow Rate: 0.4 mL/min Injection Vol.: 2 µL Mobile Phase A: Deionized water Mobile Phase B: 100 mM ammonium formate, pH 4.4 Gradient: Time, %B; 0, 4; 4, 4; 35, 39
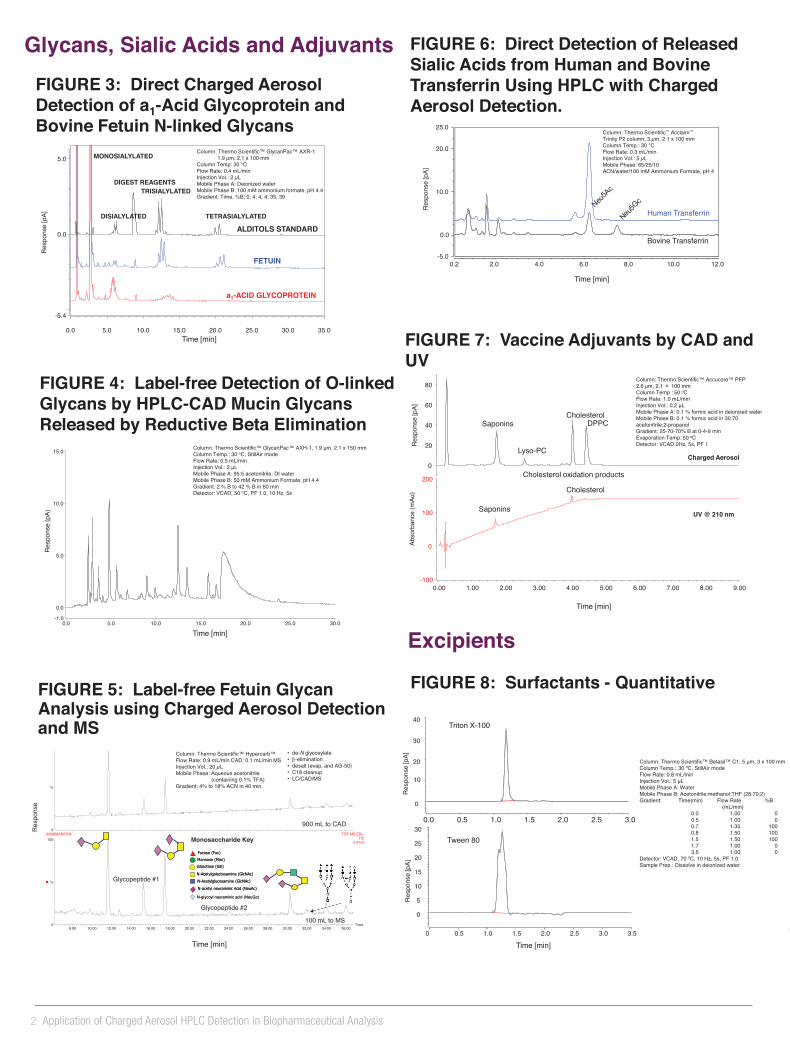
FIGURE 3: Direct Charged Aerosol Detection of a1-Acid Glycoprotein and Bovine Fetuin N-linked Glycans
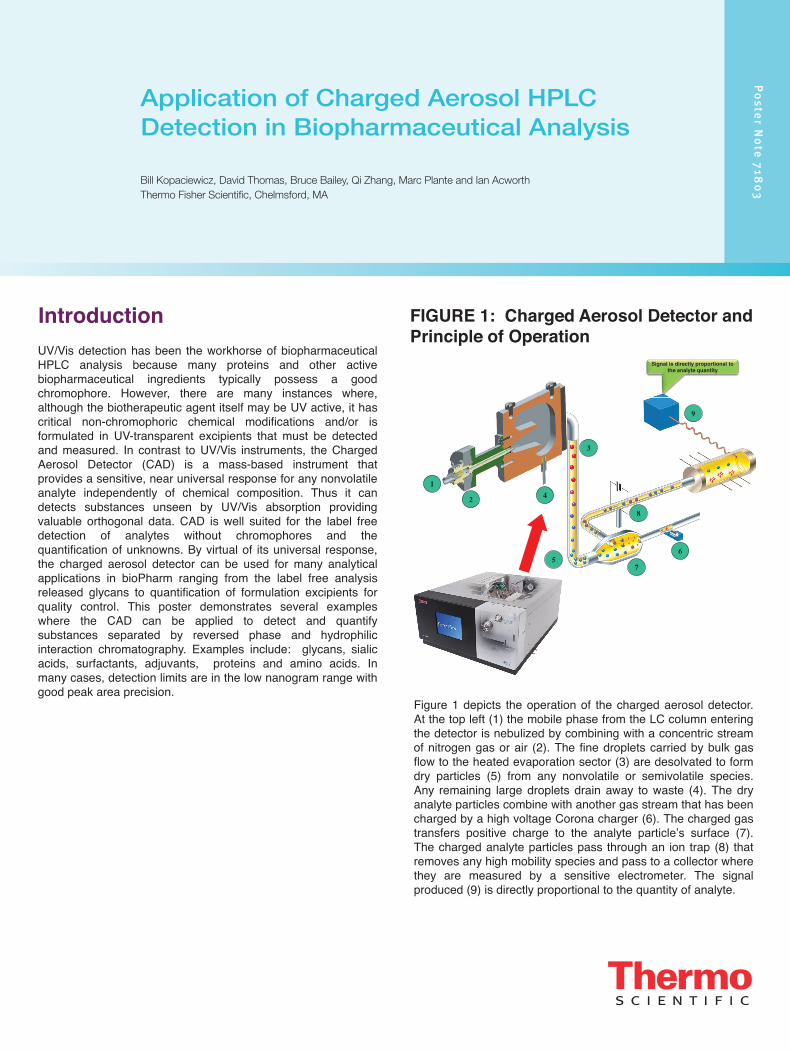
FIGURE 1: Charged Aerosol Detector and Principle of Operation
FIGURE 5: Label-free Fetuin Glycan Analysis using Charged Aerosol Detection and MS 128B, C18, 100 ug
8.00 10.00 12.00 14.00 16.00 18.00 20.00 22.00 24.00 26.00 28.00 30.00 32.00 34.00 36.00Time0
100
%
0
100
%
AH08MAR0704 Channel 1An1
5.72e4
AH08MAR0704 TOF MS ES+ TIC
5.91e3
Glycopeptide #1
900 mL to CAD
100 mL to MS
Glycopeptide #2
• de-N glycosylate • -elimination • desalt (evap. and AG-50) • C18 cleanup • LC/CAD/MS
Monosaccharide Key
N-acetyl neuraminic Acid (NeuAc)
N-Acetylglucosamine (GlcNAc)
Galactose (Gal)
Mannose (Man)
Fucose (Fuc)
N-glycoyl neuraminic acid (NeuGc)
N-Acetylgalactosamine (GlcNAc)
N-acetyl neuraminic Acid (NeuAc)
N-Acetylglucosamine (GlcNAc)
Galactose (Gal)
Mannose (Man)
Fucose (Fuc)
N-glycoyl neuraminic acid (NeuGc)
N-Acetylgalactosamine (GlcNAc)
UV/Vis detection has been the workhorse of biopharmaceutical HPLC analysis because many proteins and other active biopharmaceutical ingredients typically possess a good chromophore. However, there are many instances where, although the biotherapeutic agent itself may be UV active, it has critical non-chromophoric chemical modifications and/or is formulated in UV-transparent excipients that must be detected and measured. In contrast to UV/Vis instruments, the Charged Aerosol Detector (CAD) is a mass-based instrument that provides a sensitive, near universal response for any nonvolatile analyte independently of chemical composition. Thus it can detects substances unseen by UV/Vis absorption providing valuable orthogonal data. CAD is well suited for the label free detection of analytes without chromophores and the quantification of unknowns. By virtual of its universal response, the charged aerosol detector can be used for many analytical applications in bioPharm ranging from the label free analysis released glycans to quantification of formulation excipients for quality control. This poster demonstrates several examples where the CAD can be applied to detect and quantify substances separated by reversed phase and hydrophilic interaction chromatography. Examples include: glycans, sialic acids, surfactants, adjuvants, proteins and amino acids. In many cases, detection limits are in the low nanogram range with good peak area precision.
FIGURE 7: Vaccine Adjuvants by CAD and UV
0.00 1.00 2.00 3.00 4.00 5.00 6.00 7.00 8.00 9.00 -100
0
100
200
Saponins
Cholesterol
0
20
40
60
80
Saponins
Lyso-PC
Cholesterol oxidation products
Cholesterol DPPC
Column: Thermo Scientific™ Accucore™ PFP 2.6 μm, 2.1 100 mm Column Temp.: 50 oC Flow Rate: 1.0 mL/min Injection Vol.: 0.2 μL Mobile Phase A: 0.1 % formic acid in deionized water Mobile Phase B: 0.1 % formic acid in 30:70 acetonitrile:2-propanol Gradient: 25-70-70% B at 0-4-9 min Evaporation Temp: 50 oC Detector: VCAD 2Hz, 5s, PF 1
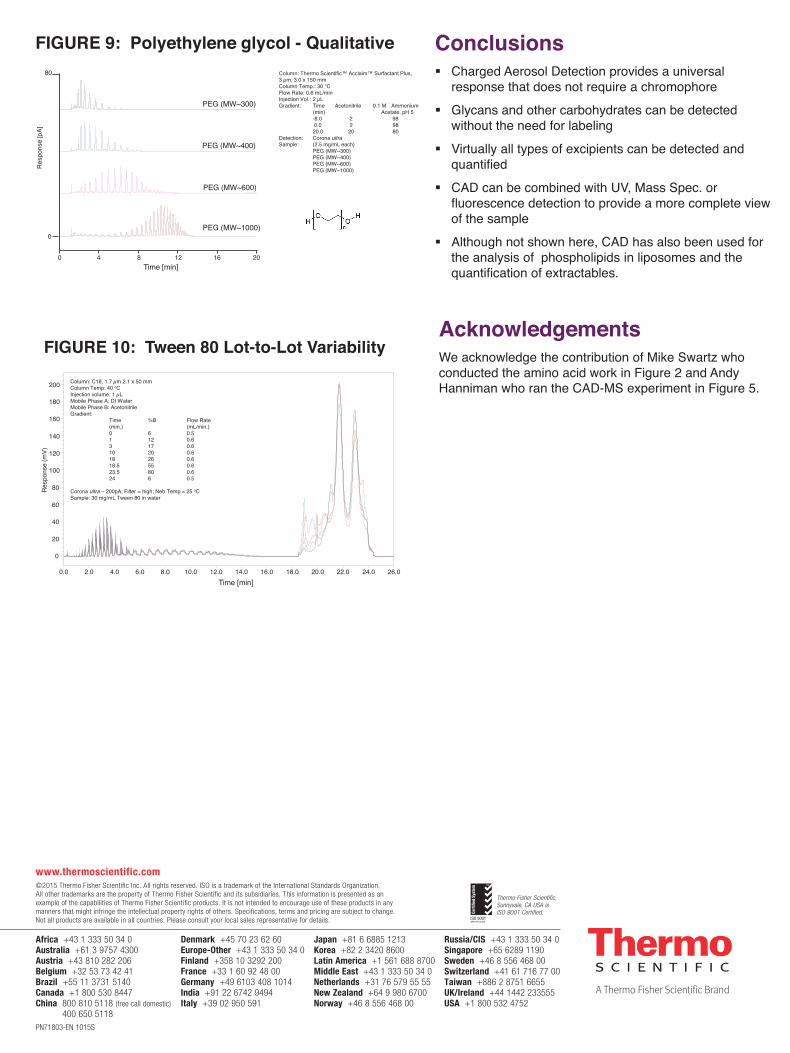
FIGURE 10: Tween 80 Lot-to-Lot Variability
FIGURE 8: Surfactants - Quantitative
Triton X-100
0.0 0.5 1.0 1.5 2.0 2.5 3.0
Time [min]
0
20
30
40
Res
pons
e [p
A]
10
Column: Thermo Scientific™ Betasil™ C1, 5 μm, 3 x 100 mm Column Temp.: 30 ºC, StillAir mode Flow Rate: 0.8 mL/min Injection Vol.: 5 μL Mobile Phase A: Water Mobile Phase B: Acetonitrile:methanol:THF (28:70:2) Gradient: Time(min) Flow Rate %B
(mL/min) 0.0 1.00 0 0.5 1.00 0 0.7 1.35 100 0.8 1.50 100 1.5 1.50 100 1.7 1.00 0 3.5 1.00 0
Detector: VCAD, 70 ºC, 10 Hz, 5s, PF 1.0 Sample Prep.: Dissolve in deionized water
0 0.5 1.0 1.5 2.0 2.5 3.0 3.5
0
5
10
15
20
25
30
Res
pons
e [p
A]
Tween 80
FIGURE 9: Polyethylene glycol - Qualitative
16 12 20
PEG (MW~300)
PEG (MW~400)
PEG (MW~600)
PEG (MW~1000)
0 8 4
0
80 Column: Thermo Scientific™ Acclaim™ Surfactant Plus, 3 µm, 3.0 x 150 mm Column Temp.: 30 °C Flow Rate: 0.6 mL/min Injection Vol.: 2 µL Gradient: Time Acetonitrile 0.1 M Ammonium (min) Acetate, pH 5 -8.0 2 98 0.0 2 98 20.0 20 80 Detection: Corona ultra Sample: (2.5 mg/mL each) PEG (MW~300) PEG (MW~400) PEG (MW~600) PEG (MW~1000)
FIGURE 6: Direct Detection of Released Sialic Acids from Human and Bovine Transferrin Using HPLC with Charged Aerosol Detection.
0.2 2.0 4.0 6.0 8.0 10.0 12.0 -5.0
0.0
10.0
20.0
25.0
Human Transferrin
Bovine Transferrin
Column: Thermo Scientific™ Acclaim™ Trinity P2 column, 3 µm, 2.1 x 100 mm Column Temp.: 30 °C Flow Rate: 0.3 mL/min Injection Vol.: 5 µL Mobile Phase: 65/25/10 ACN/water/100 mM Ammonium Formate, pH 4
Res
pons
e [p
A]
Time [min]
Time [min]
Res
pons
e [p
A]
Time [min]
Res
pons
e [p
A]
Time [min]
Res
pons
e
0
20
40
60
80
100
120
140
160
180
200
0.0 2.0 4.0 6.0 8.0 10.0 12.0 14.0 16.0 18.0 20.0 22.0 24.0 26.0
Tween 80 Column: C18, 1.7 µm 2.1 x 50 mm Column Temp: 40 oC Injection volume: 1 µL Mobile Phase A: DI Water Mobile Phase B: Acetonitrile Gradient: Time %B Flow Rate (min.) (mL/min.) 0 6 0.5 1 12 0.6 3 17 0.6 10 20 0.6 18 26 0.6 18.5 55 0.6 23.5 80 0.6 24 6 0.5 Corona ultra – 200pA; Filter = high; Neb Temp = 25 oC Sample: 30 mg/mL Tween 80 in water
Time [min]
Res
pons
e (m
V)
Time [min]
Res
pons
e [p
A]
Abso
rban
ce (m
Au)
0.0
0.5
1.0
1.5
2.0
2.5
0.00 4.00 8.00 12.00 16.00 20.00 24.00 28.00
Abso
rban
ce (m
Au)
UV 214 nm
His Phe
Trp
Time [min]
Met
4.00 8.00 12.00 16.00 20.00 24.00 28.00
0
50
100
150
200
250
0.00
Res
pons
e [m
V]
Gly
Arg
Glu
Phe Trp His
Charged Aerosol Detection
FIGURE 2: Direct Measurement of Amino Acids and BSA by Charged Aerosol and UV Absorbance Detection
Column: C18 4.6 x 250mm, 5µm Column Temp.: Ambient Flow Rate: 0.6 mL/min. Injection Vol.: 10 µL of 1 mg/mL Mobile Phase: 0.1% TFA in water (A) and ACN (B) Gradient: 5 min hold at 100% A, 0-40% B in 20 min
FIGURE 4: Label-free Detection of O-linked Glycans by HPLC-CAD Mucin Glycans Released by Reductive Beta Elimination
0.0 5.0 10.0 15.0 20.0 25.0 30.0 -1.0
0.0
5.0
10.0
15.0
Time [min]
Res
pons
e (p
A)
Column: Thermo Scientific™ GlycanPac™ AXH-1, 1.9 μm, 2.1 x 150 mm Column Temp.: 30 oC, StillAir mode Flow Rate: 0.5 mL/min Injection Vol.: 2 μL Mobile Phase A: 95:5 acetonitrile: DI water Mobile Phase B: 50 mM Ammonium Formate, pH 4.4 Gradient: 2 % B to 42 % B in 60 min Detector: VCAD, 50 oC, PF 1.0, 10 Hz, 5s
Column: Thermo Scientific™ Hypercarb™ Flow Rate: 0.9 mL/min CAD: 0.1 mL/min MS Injection Vol.: 20 µL Mobile Phase: Aqueous acetonitrile (containing 0.1% TFA) Gradient: 4% to 18% ACN in 40 min.
UV @ 210 nm
Charged Aerosol
0.0 2.0 4.0 6.0 8.0 10.0 12.0 14.0 16.0 18.0 20.0 -4.0 0.0 4.0 8.0 12.0 16.0 20.0 24.0 28.0
UV 280nm
CAD
Time [min]
Res
pons
e
BSA Column: Thermo Scientific™ Accucore™ 150, C4 Column Temp.: 45 ºC Flow Rate: 0.4 mL/min Injection Vol.: 1 µL of 0.5 mg/mL std. Mobile Phase A: 0.2% Aqueous TFA Mobile Phase B: 0.1% TFA in ACN Gradient: 10–90% B in 20 min
Amino Acids and Proteins
Glycans, Sialic Acids and Adjuvants Excipients Introduction
Figure 1 depicts the operation of the charged aerosol detector. At the top left (1) the mobile phase from the LC column entering the detector is nebulized by combining with a concentric stream of nitrogen gas or air (2). The fine droplets carried by bulk gas flow to the heated evaporation sector (3) are desolvated to form dry particles (5) from any nonvolatile or semivolatile species. Any remaining large droplets drain away to waste (4). The dry analyte particles combine with another gas stream that has been charged by a high voltage Corona charger (6). The charged gas transfers positive charge to the analyte particle’s surface (7). The charged analyte particles pass through an ion trap (8) that removes any high mobility species and pass to a collector where they are measured by a sensitive electrometer. The signal produced (9) is directly proportional to the quantity of analyte.
Acknowledgements We acknowledge the contribution of Mike Swartz who conducted the amino acid work in Figure 2 and Andy Hanniman who ran the CAD-MS experiment in Figure 5.
PO71803-EN 1015S
Signal is directly proportional to the analyte quantity
1
2
3
4
5 6
7
8
9
Conclusions Charged Aerosol Detection provides a universal
response that does not require a chromophore
Glycans and other carbohydrates can be detected without the need for labeling
Virtually all types of excipients can be detected and quantified
CAD can be combined with UV, Mass Spec. or fluorescence detection to provide a more complete view of the sample
Although not shown here, CAD has also been used for the analysis of phospholipids in liposomes and the quantification of extractables.
© 2015 Thermo Fisher Scientific Inc. All rights reserved. All trademarks are the property of Thermo Fisher Scientific and its subsidiaries unless otherwise specified. This information is not intended to encourage use of these products in any manner that might infringe the intellectual property rights of others.
Application of Charged Aerosol HPLC Detection in Biopharmaceutical Analysis
Bill Kopaciewicz, David Thomas, Bruce Bailey, Qi Zhang, Marc Plante & Ian Acworth, Thermo Fisher Scientific, Chelmsford, MA
0.0 5.0 10.0 15.0 20.0 25.0 30.0 35.0
-5.4
0.0
5.0 MONOSIALYLATED
DISIALYLATED
DIGEST REAGENTS TRISIALYLATED
TETRASIALYLATED
ALDITOLS STANDARD
FETUIN
a1-ACID GLYCOPROTEIN
Column: Thermo Scientific™ GlycanPac™ AXR-1 1.9 µm, 2.1 x 100 mm Column Temp: 30 °C Flow Rate: 0.4 mL/min Injection Vol.: 2 µL Mobile Phase A: Deionized water Mobile Phase B: 100 mM ammonium formate, pH 4.4 Gradient: Time, %B; 0, 4; 4, 4; 35, 39
FIGURE 3: Direct Charged Aerosol Detection of a1-Acid Glycoprotein and Bovine Fetuin N-linked Glycans
FIGURE 1: Charged Aerosol Detector and Principle of Operation
FIGURE 5: Label-free Fetuin Glycan Analysis using Charged Aerosol Detection and MS 128B, C18, 100 ug
8.00 10.00 12.00 14.00 16.00 18.00 20.00 22.00 24.00 26.00 28.00 30.00 32.00 34.00 36.00Time0
100
%
0
100
%
AH08MAR0704 Channel 1An1
5.72e4
AH08MAR0704 TOF MS ES+ TIC
5.91e3
Glycopeptide #1
900 mL to CAD
100 mL to MS
Glycopeptide #2
• de-N glycosylate • -elimination • desalt (evap. and AG-50) • C18 cleanup • LC/CAD/MS
Monosaccharide Key
N-acetyl neuraminic Acid (NeuAc)
N-Acetylglucosamine (GlcNAc)
Galactose (Gal)
Mannose (Man)
Fucose (Fuc)
N-glycoyl neuraminic acid (NeuGc)
N-Acetylgalactosamine (GlcNAc)
N-acetyl neuraminic Acid (NeuAc)
N-Acetylglucosamine (GlcNAc)
Galactose (Gal)
Mannose (Man)
Fucose (Fuc)
N-glycoyl neuraminic acid (NeuGc)
N-Acetylgalactosamine (GlcNAc)
UV/Vis detection has been the workhorse of biopharmaceutical HPLC analysis because many proteins and other active biopharmaceutical ingredients typically possess a good chromophore. However, there are many instances where, although the biotherapeutic agent itself may be UV active, it has critical non-chromophoric chemical modifications and/or is formulated in UV-transparent excipients that must be detected and measured. In contrast to UV/Vis instruments, the Charged Aerosol Detector (CAD) is a mass-based instrument that provides a sensitive, near universal response for any nonvolatile analyte independently of chemical composition. Thus it can detects substances unseen by UV/Vis absorption providing valuable orthogonal data. CAD is well suited for the label free detection of analytes without chromophores and the quantification of unknowns. By virtual of its universal response, the charged aerosol detector can be used for many analytical applications in bioPharm ranging from the label free analysis released glycans to quantification of formulation excipients for quality control. This poster demonstrates several examples where the CAD can be applied to detect and quantify substances separated by reversed phase and hydrophilic interaction chromatography. Examples include: glycans, sialic acids, surfactants, adjuvants, proteins and amino acids. In many cases, detection limits are in the low nanogram range with good peak area precision.
FIGURE 7: Vaccine Adjuvants by CAD and UV
0.00 1.00 2.00 3.00 4.00 5.00 6.00 7.00 8.00 9.00 -100
0
100
200
Saponins
Cholesterol
0
20
40
60
80
Saponins
Lyso-PC
Cholesterol oxidation products
Cholesterol DPPC
Column: Thermo Scientific™ Accucore™ PFP 2.6 μm, 2.1 100 mm Column Temp.: 50 oC Flow Rate: 1.0 mL/min Injection Vol.: 0.2 μL Mobile Phase A: 0.1 % formic acid in deionized water Mobile Phase B: 0.1 % formic acid in 30:70 acetonitrile:2-propanol Gradient: 25-70-70% B at 0-4-9 min Evaporation Temp: 50 oC Detector: VCAD 2Hz, 5s, PF 1
FIGURE 10: Tween 80 Lot-to-Lot Variability
FIGURE 8: Surfactants - Quantitative
Triton X-100
0.0 0.5 1.0 1.5 2.0 2.5 3.0
Time [min]
0
20
30
40
Res
pons
e [p
A]
10
Column: Thermo Scientific™ Betasil™ C1, 5 μm, 3 x 100 mm Column Temp.: 30 ºC, StillAir mode Flow Rate: 0.8 mL/min Injection Vol.: 5 μL Mobile Phase A: Water Mobile Phase B: Acetonitrile:methanol:THF (28:70:2) Gradient: Time(min) Flow Rate %B
(mL/min) 0.0 1.00 0 0.5 1.00 0 0.7 1.35 100 0.8 1.50 100 1.5 1.50 100 1.7 1.00 0 3.5 1.00 0
Detector: VCAD, 70 ºC, 10 Hz, 5s, PF 1.0 Sample Prep.: Dissolve in deionized water
0 0.5 1.0 1.5 2.0 2.5 3.0 3.5
0
5
10
15
20
25
30
Res
pons
e [p
A]
Tween 80
FIGURE 9: Polyethylene glycol - Qualitative
16 12 20
PEG (MW~300)
PEG (MW~400)
PEG (MW~600)
PEG (MW~1000)
0 8 4
0
80 Column: Thermo Scientific™ Acclaim™ Surfactant Plus, 3 µm, 3.0 x 150 mm Column Temp.: 30 °C Flow Rate: 0.6 mL/min Injection Vol.: 2 µL Gradient: Time Acetonitrile 0.1 M Ammonium (min) Acetate, pH 5 -8.0 2 98 0.0 2 98 20.0 20 80 Detection: Corona ultra Sample: (2.5 mg/mL each) PEG (MW~300) PEG (MW~400) PEG (MW~600) PEG (MW~1000)
FIGURE 6: Direct Detection of Released Sialic Acids from Human and Bovine Transferrin Using HPLC with Charged Aerosol Detection.
0.2 2.0 4.0 6.0 8.0 10.0 12.0 -5.0
0.0
10.0
20.0
25.0
Human Transferrin
Bovine Transferrin
Column: Thermo Scientific™ Acclaim™ Trinity P2 column, 3 µm, 2.1 x 100 mm Column Temp.: 30 °C Flow Rate: 0.3 mL/min Injection Vol.: 5 µL Mobile Phase: 65/25/10 ACN/water/100 mM Ammonium Formate, pH 4
Res
pons
e [p
A]
Time [min]
Time [min]
Res
pons
e [p
A]
Time [min]
Res
pons
e [p
A]
Time [min]
Res
pons
e
0
20
40
60
80
100
120
140
160
180
200
0.0 2.0 4.0 6.0 8.0 10.0 12.0 14.0 16.0 18.0 20.0 22.0 24.0 26.0
Tween 80 Column: C18, 1.7 µm 2.1 x 50 mm Column Temp: 40 oC Injection volume: 1 µL Mobile Phase A: DI Water Mobile Phase B: Acetonitrile Gradient: Time %B Flow Rate (min.) (mL/min.) 0 6 0.5 1 12 0.6 3 17 0.6 10 20 0.6 18 26 0.6 18.5 55 0.6 23.5 80 0.6 24 6 0.5 Corona ultra – 200pA; Filter = high; Neb Temp = 25 oC Sample: 30 mg/mL Tween 80 in water
Time [min]
Res
pons
e (m
V)
Time [min]
Res
pons
e [p
A]
Abso
rban
ce (m
Au)
0.0
0.5
1.0
1.5
2.0
2.5
0.00 4.00 8.00 12.00 16.00 20.00 24.00 28.00
Abso
rban
ce (m
Au)
UV 214 nm
His Phe
Trp
Time [min]
Met
4.00 8.00 12.00 16.00 20.00 24.00 28.00
0
50
100
150
200
250
0.00
Res
pons
e [m
V]
Gly
Arg
Glu
Phe Trp His
Charged Aerosol Detection
FIGURE 2: Direct Measurement of Amino Acids and BSA by Charged Aerosol and UV Absorbance Detection
Column: C18 4.6 x 250mm, 5µm Column Temp.: Ambient Flow Rate: 0.6 mL/min. Injection Vol.: 10 µL of 1 mg/mL Mobile Phase: 0.1% TFA in water (A) and ACN (B) Gradient: 5 min hold at 100% A, 0-40% B in 20 min
FIGURE 4: Label-free Detection of O-linked Glycans by HPLC-CAD Mucin Glycans Released by Reductive Beta Elimination
0.0 5.0 10.0 15.0 20.0 25.0 30.0 -1.0
0.0
5.0
10.0
15.0
Time [min]
Res
pons
e (p
A)
Column: Thermo Scientific™ GlycanPac™ AXH-1, 1.9 μm, 2.1 x 150 mm Column Temp.: 30 oC, StillAir mode Flow Rate: 0.5 mL/min Injection Vol.: 2 μL Mobile Phase A: 95:5 acetonitrile: DI water Mobile Phase B: 50 mM Ammonium Formate, pH 4.4 Gradient: 2 % B to 42 % B in 60 min Detector: VCAD, 50 oC, PF 1.0, 10 Hz, 5s
Column: Thermo Scientific™ Hypercarb™ Flow Rate: 0.9 mL/min CAD: 0.1 mL/min MS Injection Vol.: 20 µL Mobile Phase: Aqueous acetonitrile (containing 0.1% TFA) Gradient: 4% to 18% ACN in 40 min.
UV @ 210 nm
Charged Aerosol
0.0 2.0 4.0 6.0 8.0 10.0 12.0 14.0 16.0 18.0 20.0 -4.0 0.0 4.0 8.0 12.0 16.0 20.0 24.0 28.0
UV 280nm
CAD
Time [min]
Res
pons
e
BSA Column: Thermo Scientific™ Accucore™ 150, C4 Column Temp.: 45 ºC Flow Rate: 0.4 mL/min Injection Vol.: 1 µL of 0.5 mg/mL std. Mobile Phase A: 0.2% Aqueous TFA Mobile Phase B: 0.1% TFA in ACN Gradient: 10–90% B in 20 min
Amino Acids and Proteins
Glycans, Sialic Acids and Adjuvants Excipients Introduction
Figure 1 depicts the operation of the charged aerosol detector. At the top left (1) the mobile phase from the LC column entering the detector is nebulized by combining with a concentric stream of nitrogen gas or air (2). The fine droplets carried by bulk gas flow to the heated evaporation sector (3) are desolvated to form dry particles (5) from any nonvolatile or semivolatile species. Any remaining large droplets drain away to waste (4). The dry analyte particles combine with another gas stream that has been charged by a high voltage Corona charger (6). The charged gas transfers positive charge to the analyte particle’s surface (7). The charged analyte particles pass through an ion trap (8) that removes any high mobility species and pass to a collector where they are measured by a sensitive electrometer. The signal produced (9) is directly proportional to the quantity of analyte.
Acknowledgements We acknowledge the contribution of Mike Swartz who conducted the amino acid work in Figure 2 and Andy Hanniman who ran the CAD-MS experiment in Figure 5.
PO71803-EN 1015S
2 Application of Charged Aerosol HPLC Detection in Biopharmaceutical Analysis
Signal is directly proportional to the analyte quantity
1
2
3
4
5 6
7
8
9
Conclusions Charged Aerosol Detection provides a universal
response that does not require a chromophore
Glycans and other carbohydrates can be detected without the need for labeling
Virtually all types of excipients can be detected and quantified
CAD can be combined with UV, Mass Spec. or fluorescence detection to provide a more complete view of the sample
Although not shown here, CAD has also been used for the analysis of phospholipids in liposomes and the quantification of extractables.
© 2015 Thermo Fisher Scientific Inc. All rights reserved. All trademarks are the property of Thermo Fisher Scientific and its subsidiaries unless otherwise specified. This information is not intended to encourage use of these products in any manner that might infringe the intellectual property rights of others.
Application of Charged Aerosol HPLC Detection in Biopharmaceutical Analysis
Bill Kopaciewicz, David Thomas, Bruce Bailey, Qi Zhang, Marc Plante & Ian Acworth, Thermo Fisher Scientific, Chelmsford, MA
0.0 5.0 10.0 15.0 20.0 25.0 30.0 35.0
-5.4
0.0
5.0 MONOSIALYLATED
DISIALYLATED
DIGEST REAGENTS TRISIALYLATED
TETRASIALYLATED
ALDITOLS STANDARD
FETUIN
a1-ACID GLYCOPROTEIN
Column: Thermo Scientific™ GlycanPac™ AXR-1 1.9 µm, 2.1 x 100 mm Column Temp: 30 °C Flow Rate: 0.4 mL/min Injection Vol.: 2 µL Mobile Phase A: Deionized water Mobile Phase B: 100 mM ammonium formate, pH 4.4 Gradient: Time, %B; 0, 4; 4, 4; 35, 39
FIGURE 3: Direct Charged Aerosol Detection of a1-Acid Glycoprotein and Bovine Fetuin N-linked Glycans
FIGURE 1: Charged Aerosol Detector and Principle of Operation
FIGURE 5: Label-free Fetuin Glycan Analysis using Charged Aerosol Detection and MS 128B, C18, 100 ug
8.00 10.00 12.00 14.00 16.00 18.00 20.00 22.00 24.00 26.00 28.00 30.00 32.00 34.00 36.00Time0
100
%
0
100
%
AH08MAR0704 Channel 1An1
5.72e4
AH08MAR0704 TOF MS ES+ TIC
5.91e3
Glycopeptide #1
900 mL to CAD
100 mL to MS
Glycopeptide #2
• de-N glycosylate • -elimination • desalt (evap. and AG-50) • C18 cleanup • LC/CAD/MS
Monosaccharide Key
N-acetyl neuraminic Acid (NeuAc)
N-Acetylglucosamine (GlcNAc)
Galactose (Gal)
Mannose (Man)
Fucose (Fuc)
N-glycoyl neuraminic acid (NeuGc)
N-Acetylgalactosamine (GlcNAc)
N-acetyl neuraminic Acid (NeuAc)
N-Acetylglucosamine (GlcNAc)
Galactose (Gal)
Mannose (Man)
Fucose (Fuc)
N-glycoyl neuraminic acid (NeuGc)
N-Acetylgalactosamine (GlcNAc)
UV/Vis detection has been the workhorse of biopharmaceutical HPLC analysis because many proteins and other active biopharmaceutical ingredients typically possess a good chromophore. However, there are many instances where, although the biotherapeutic agent itself may be UV active, it has critical non-chromophoric chemical modifications and/or is formulated in UV-transparent excipients that must be detected and measured. In contrast to UV/Vis instruments, the Charged Aerosol Detector (CAD) is a mass-based instrument that provides a sensitive, near universal response for any nonvolatile analyte independently of chemical composition. Thus it can detects substances unseen by UV/Vis absorption providing valuable orthogonal data. CAD is well suited for the label free detection of analytes without chromophores and the quantification of unknowns. By virtual of its universal response, the charged aerosol detector can be used for many analytical applications in bioPharm ranging from the label free analysis released glycans to quantification of formulation excipients for quality control. This poster demonstrates several examples where the CAD can be applied to detect and quantify substances separated by reversed phase and hydrophilic interaction chromatography. Examples include: glycans, sialic acids, surfactants, adjuvants, proteins and amino acids. In many cases, detection limits are in the low nanogram range with good peak area precision.
FIGURE 7: Vaccine Adjuvants by CAD and UV
0.00 1.00 2.00 3.00 4.00 5.00 6.00 7.00 8.00 9.00 -100
0
100
200
Saponins
Cholesterol
0
20
40
60
80
Saponins
Lyso-PC
Cholesterol oxidation products
Cholesterol DPPC
Column: Thermo Scientific™ Accucore™ PFP 2.6 μm, 2.1 100 mm Column Temp.: 50 oC Flow Rate: 1.0 mL/min Injection Vol.: 0.2 μL Mobile Phase A: 0.1 % formic acid in deionized water Mobile Phase B: 0.1 % formic acid in 30:70 acetonitrile:2-propanol Gradient: 25-70-70% B at 0-4-9 min Evaporation Temp: 50 oC Detector: VCAD 2Hz, 5s, PF 1
FIGURE 10: Tween 80 Lot-to-Lot Variability
FIGURE 8: Surfactants - Quantitative
Triton X-100
0.0 0.5 1.0 1.5 2.0 2.5 3.0
Time [min]
0
20
30
40
Res
pons
e [p
A]
10
Column: Thermo Scientific™ Betasil™ C1, 5 μm, 3 x 100 mm Column Temp.: 30 ºC, StillAir mode Flow Rate: 0.8 mL/min Injection Vol.: 5 μL Mobile Phase A: Water Mobile Phase B: Acetonitrile:methanol:THF (28:70:2) Gradient: Time(min) Flow Rate %B
(mL/min) 0.0 1.00 0 0.5 1.00 0 0.7 1.35 100 0.8 1.50 100 1.5 1.50 100 1.7 1.00 0 3.5 1.00 0
Detector: VCAD, 70 ºC, 10 Hz, 5s, PF 1.0 Sample Prep.: Dissolve in deionized water
0 0.5 1.0 1.5 2.0 2.5 3.0 3.5
0
5
10
15
20
25
30
Res
pons
e [p
A]
Tween 80
FIGURE 9: Polyethylene glycol - Qualitative
16 12 20
PEG (MW~300)
PEG (MW~400)
PEG (MW~600)
PEG (MW~1000)
0 8 4
0
80 Column: Thermo Scientific™ Acclaim™ Surfactant Plus, 3 µm, 3.0 x 150 mm Column Temp.: 30 °C Flow Rate: 0.6 mL/min Injection Vol.: 2 µL Gradient: Time Acetonitrile 0.1 M Ammonium (min) Acetate, pH 5 -8.0 2 98 0.0 2 98 20.0 20 80 Detection: Corona ultra Sample: (2.5 mg/mL each) PEG (MW~300) PEG (MW~400) PEG (MW~600) PEG (MW~1000)
FIGURE 6: Direct Detection of Released Sialic Acids from Human and Bovine Transferrin Using HPLC with Charged Aerosol Detection.
0.2 2.0 4.0 6.0 8.0 10.0 12.0 -5.0
0.0
10.0
20.0
25.0
Human Transferrin
Bovine Transferrin
Column: Thermo Scientific™ Acclaim™ Trinity P2 column, 3 µm, 2.1 x 100 mm Column Temp.: 30 °C Flow Rate: 0.3 mL/min Injection Vol.: 5 µL Mobile Phase: 65/25/10 ACN/water/100 mM Ammonium Formate, pH 4
Res
pons
e [p
A]
Time [min]
Time [min]
Res
pons
e [p
A]
Time [min]
Res
pons
e [p
A]
Time [min]
Res
pons
e
0
20
40
60
80
100
120
140
160
180
200
0.0 2.0 4.0 6.0 8.0 10.0 12.0 14.0 16.0 18.0 20.0 22.0 24.0 26.0
Tween 80 Column: C18, 1.7 µm 2.1 x 50 mm Column Temp: 40 oC Injection volume: 1 µL Mobile Phase A: DI Water Mobile Phase B: Acetonitrile Gradient: Time %B Flow Rate (min.) (mL/min.) 0 6 0.5 1 12 0.6 3 17 0.6 10 20 0.6 18 26 0.6 18.5 55 0.6 23.5 80 0.6 24 6 0.5 Corona ultra – 200pA; Filter = high; Neb Temp = 25 oC Sample: 30 mg/mL Tween 80 in water
Time [min]
Res
pons
e (m
V)
Time [min]
Res
pons
e [p
A]
Abso
rban
ce (m
Au)
0.0
0.5
1.0
1.5
2.0
2.5
0.00 4.00 8.00 12.00 16.00 20.00 24.00 28.00
Abso
rban
ce (m
Au)
UV 214 nm
His Phe
Trp
Time [min]
Met
4.00 8.00 12.00 16.00 20.00 24.00 28.00
0
50
100
150
200
250
0.00
Res
pons
e [m
V]
Gly
Arg
Glu
Phe Trp His
Charged Aerosol Detection
FIGURE 2: Direct Measurement of Amino Acids and BSA by Charged Aerosol and UV Absorbance Detection
Column: C18 4.6 x 250mm, 5µm Column Temp.: Ambient Flow Rate: 0.6 mL/min. Injection Vol.: 10 µL of 1 mg/mL Mobile Phase: 0.1% TFA in water (A) and ACN (B) Gradient: 5 min hold at 100% A, 0-40% B in 20 min
FIGURE 4: Label-free Detection of O-linked Glycans by HPLC-CAD Mucin Glycans Released by Reductive Beta Elimination
0.0 5.0 10.0 15.0 20.0 25.0 30.0 -1.0
0.0
5.0
10.0
15.0
Time [min]
Res
pons
e (p
A)
Column: Thermo Scientific™ GlycanPac™ AXH-1, 1.9 μm, 2.1 x 150 mm Column Temp.: 30 oC, StillAir mode Flow Rate: 0.5 mL/min Injection Vol.: 2 μL Mobile Phase A: 95:5 acetonitrile: DI water Mobile Phase B: 50 mM Ammonium Formate, pH 4.4 Gradient: 2 % B to 42 % B in 60 min Detector: VCAD, 50 oC, PF 1.0, 10 Hz, 5s
Column: Thermo Scientific™ Hypercarb™ Flow Rate: 0.9 mL/min CAD: 0.1 mL/min MS Injection Vol.: 20 µL Mobile Phase: Aqueous acetonitrile (containing 0.1% TFA) Gradient: 4% to 18% ACN in 40 min.
UV @ 210 nm
Charged Aerosol
0.0 2.0 4.0 6.0 8.0 10.0 12.0 14.0 16.0 18.0 20.0 -4.0 0.0 4.0 8.0 12.0 16.0 20.0 24.0 28.0
UV 280nm
CAD
Time [min]
Res
pons
e
BSA Column: Thermo Scientific™ Accucore™ 150, C4 Column Temp.: 45 ºC Flow Rate: 0.4 mL/min Injection Vol.: 1 µL of 0.5 mg/mL std. Mobile Phase A: 0.2% Aqueous TFA Mobile Phase B: 0.1% TFA in ACN Gradient: 10–90% B in 20 min
Amino Acids and Proteins
Glycans, Sialic Acids and Adjuvants Excipients Introduction
Figure 1 depicts the operation of the charged aerosol detector. At the top left (1) the mobile phase from the LC column entering the detector is nebulized by combining with a concentric stream of nitrogen gas or air (2). The fine droplets carried by bulk gas flow to the heated evaporation sector (3) are desolvated to form dry particles (5) from any nonvolatile or semivolatile species. Any remaining large droplets drain away to waste (4). The dry analyte particles combine with another gas stream that has been charged by a high voltage Corona charger (6). The charged gas transfers positive charge to the analyte particle’s surface (7). The charged analyte particles pass through an ion trap (8) that removes any high mobility species and pass to a collector where they are measured by a sensitive electrometer. The signal produced (9) is directly proportional to the quantity of analyte.
Acknowledgements We acknowledge the contribution of Mike Swartz who conducted the amino acid work in Figure 2 and Andy Hanniman who ran the CAD-MS experiment in Figure 5.
PO71803-EN 1015S
PN71803-EN 1015S
Signal is directly proportional to the analyte quantity
1
2
3
4
5 6
7
8
9
Conclusions Charged Aerosol Detection provides a universal
response that does not require a chromophore
Glycans and other carbohydrates can be detected without the need for labeling
Virtually all types of excipients can be detected and quantified
CAD can be combined with UV, Mass Spec. or fluorescence detection to provide a more complete view of the sample
Although not shown here, CAD has also been used for the analysis of phospholipids in liposomes and the quantification of extractables.
© 2015 Thermo Fisher Scientific Inc. All rights reserved. All trademarks are the property of Thermo Fisher Scientific and its subsidiaries unless otherwise specified. This information is not intended to encourage use of these products in any manner that might infringe the intellectual property rights of others.
Application of Charged Aerosol HPLC Detection in Biopharmaceutical Analysis
Bill Kopaciewicz, David Thomas, Bruce Bailey, Qi Zhang, Marc Plante & Ian Acworth, Thermo Fisher Scientific, Chelmsford, MA
0.0 5.0 10.0 15.0 20.0 25.0 30.0 35.0
-5.4
0.0
5.0 MONOSIALYLATED
DISIALYLATED
DIGEST REAGENTS TRISIALYLATED
TETRASIALYLATED
ALDITOLS STANDARD
FETUIN
a1-ACID GLYCOPROTEIN
Column: Thermo Scientific™ GlycanPac™ AXR-1 1.9 µm, 2.1 x 100 mm Column Temp: 30 °C Flow Rate: 0.4 mL/min Injection Vol.: 2 µL Mobile Phase A: Deionized water Mobile Phase B: 100 mM ammonium formate, pH 4.4 Gradient: Time, %B; 0, 4; 4, 4; 35, 39
FIGURE 3: Direct Charged Aerosol Detection of a1-Acid Glycoprotein and Bovine Fetuin N-linked Glycans
FIGURE 1: Charged Aerosol Detector and Principle of Operation
FIGURE 5: Label-free Fetuin Glycan Analysis using Charged Aerosol Detection and MS 128B, C18, 100 ug
8.00 10.00 12.00 14.00 16.00 18.00 20.00 22.00 24.00 26.00 28.00 30.00 32.00 34.00 36.00Time0
100
%
0
100
%
AH08MAR0704 Channel 1An1
5.72e4
AH08MAR0704 TOF MS ES+ TIC
5.91e3
Glycopeptide #1
900 mL to CAD
100 mL to MS
Glycopeptide #2
• de-N glycosylate • -elimination • desalt (evap. and AG-50) • C18 cleanup • LC/CAD/MS
Monosaccharide Key
N-acetyl neuraminic Acid (NeuAc)
N-Acetylglucosamine (GlcNAc)
Galactose (Gal)
Mannose (Man)
Fucose (Fuc)
N-glycoyl neuraminic acid (NeuGc)
N-Acetylgalactosamine (GlcNAc)
N-acetyl neuraminic Acid (NeuAc)
N-Acetylglucosamine (GlcNAc)
Galactose (Gal)
Mannose (Man)
Fucose (Fuc)
N-glycoyl neuraminic acid (NeuGc)
N-Acetylgalactosamine (GlcNAc)
UV/Vis detection has been the workhorse of biopharmaceutical HPLC analysis because many proteins and other active biopharmaceutical ingredients typically possess a good chromophore. However, there are many instances where, although the biotherapeutic agent itself may be UV active, it has critical non-chromophoric chemical modifications and/or is formulated in UV-transparent excipients that must be detected and measured. In contrast to UV/Vis instruments, the Charged Aerosol Detector (CAD) is a mass-based instrument that provides a sensitive, near universal response for any nonvolatile analyte independently of chemical composition. Thus it can detects substances unseen by UV/Vis absorption providing valuable orthogonal data. CAD is well suited for the label free detection of analytes without chromophores and the quantification of unknowns. By virtual of its universal response, the charged aerosol detector can be used for many analytical applications in bioPharm ranging from the label free analysis released glycans to quantification of formulation excipients for quality control. This poster demonstrates several examples where the CAD can be applied to detect and quantify substances separated by reversed phase and hydrophilic interaction chromatography. Examples include: glycans, sialic acids, surfactants, adjuvants, proteins and amino acids. In many cases, detection limits are in the low nanogram range with good peak area precision.
FIGURE 7: Vaccine Adjuvants by CAD and UV
0.00 1.00 2.00 3.00 4.00 5.00 6.00 7.00 8.00 9.00 -100
0
100
200
Saponins
Cholesterol
0
20
40
60
80
Saponins
Lyso-PC
Cholesterol oxidation products
Cholesterol DPPC
Column: Thermo Scientific™ Accucore™ PFP 2.6 μm, 2.1 100 mm Column Temp.: 50 oC Flow Rate: 1.0 mL/min Injection Vol.: 0.2 μL Mobile Phase A: 0.1 % formic acid in deionized water Mobile Phase B: 0.1 % formic acid in 30:70 acetonitrile:2-propanol Gradient: 25-70-70% B at 0-4-9 min Evaporation Temp: 50 oC Detector: VCAD 2Hz, 5s, PF 1
FIGURE 10: Tween 80 Lot-to-Lot Variability
FIGURE 8: Surfactants - Quantitative
Triton X-100
0.0 0.5 1.0 1.5 2.0 2.5 3.0
Time [min]
0
20
30
40
Res
pons
e [p
A]
10
Column: Thermo Scientific™ Betasil™ C1, 5 μm, 3 x 100 mm Column Temp.: 30 ºC, StillAir mode Flow Rate: 0.8 mL/min Injection Vol.: 5 μL Mobile Phase A: Water Mobile Phase B: Acetonitrile:methanol:THF (28:70:2) Gradient: Time(min) Flow Rate %B
(mL/min) 0.0 1.00 0 0.5 1.00 0 0.7 1.35 100 0.8 1.50 100 1.5 1.50 100 1.7 1.00 0 3.5 1.00 0
Detector: VCAD, 70 ºC, 10 Hz, 5s, PF 1.0 Sample Prep.: Dissolve in deionized water
0 0.5 1.0 1.5 2.0 2.5 3.0 3.5
0
5
10
15
20
25
30
Res
pons
e [p
A]
Tween 80
FIGURE 9: Polyethylene glycol - Qualitative
16 12 20
PEG (MW~300)
PEG (MW~400)
PEG (MW~600)
PEG (MW~1000)
0 8 4
0
80 Column: Thermo Scientific™ Acclaim™ Surfactant Plus, 3 µm, 3.0 x 150 mm Column Temp.: 30 °C Flow Rate: 0.6 mL/min Injection Vol.: 2 µL Gradient: Time Acetonitrile 0.1 M Ammonium (min) Acetate, pH 5 -8.0 2 98 0.0 2 98 20.0 20 80 Detection: Corona ultra Sample: (2.5 mg/mL each) PEG (MW~300) PEG (MW~400) PEG (MW~600) PEG (MW~1000)
FIGURE 6: Direct Detection of Released Sialic Acids from Human and Bovine Transferrin Using HPLC with Charged Aerosol Detection.
0.2 2.0 4.0 6.0 8.0 10.0 12.0 -5.0
0.0
10.0
20.0
25.0
Human Transferrin
Bovine Transferrin
Column: Thermo Scientific™ Acclaim™ Trinity P2 column, 3 µm, 2.1 x 100 mm Column Temp.: 30 °C Flow Rate: 0.3 mL/min Injection Vol.: 5 µL Mobile Phase: 65/25/10 ACN/water/100 mM Ammonium Formate, pH 4
Res
pons
e [p
A]
Time [min]
Time [min]
Res
pons
e [p
A]
Time [min]
Res
pons
e [p
A]
Time [min]
Res
pons
e
0
20
40
60
80
100
120
140
160
180
200
0.0 2.0 4.0 6.0 8.0 10.0 12.0 14.0 16.0 18.0 20.0 22.0 24.0 26.0
Tween 80 Column: C18, 1.7 µm 2.1 x 50 mm Column Temp: 40 oC Injection volume: 1 µL Mobile Phase A: DI Water Mobile Phase B: Acetonitrile Gradient: Time %B Flow Rate (min.) (mL/min.) 0 6 0.5 1 12 0.6 3 17 0.6 10 20 0.6 18 26 0.6 18.5 55 0.6 23.5 80 0.6 24 6 0.5 Corona ultra – 200pA; Filter = high; Neb Temp = 25 oC Sample: 30 mg/mL Tween 80 in water
Time [min]
Res
pons
e (m
V)
Time [min]
Res
pons
e [p
A]
Abso
rban
ce (m
Au)
0.0
0.5
1.0
1.5
2.0
2.5
0.00 4.00 8.00 12.00 16.00 20.00 24.00 28.00
Abso
rban
ce (m
Au)
UV 214 nm
His Phe
Trp
Time [min]
Met
4.00 8.00 12.00 16.00 20.00 24.00 28.00
0
50
100
150
200
250
0.00
Res
pons
e [m
V]
Gly
Arg
Glu
Phe Trp His
Charged Aerosol Detection
FIGURE 2: Direct Measurement of Amino Acids and BSA by Charged Aerosol and UV Absorbance Detection
Column: C18 4.6 x 250mm, 5µm Column Temp.: Ambient Flow Rate: 0.6 mL/min. Injection Vol.: 10 µL of 1 mg/mL Mobile Phase: 0.1% TFA in water (A) and ACN (B) Gradient: 5 min hold at 100% A, 0-40% B in 20 min
FIGURE 4: Label-free Detection of O-linked Glycans by HPLC-CAD Mucin Glycans Released by Reductive Beta Elimination
0.0 5.0 10.0 15.0 20.0 25.0 30.0 -1.0
0.0
5.0
10.0
15.0
Time [min]
Res
pons
e (p
A)
Column: Thermo Scientific™ GlycanPac™ AXH-1, 1.9 μm, 2.1 x 150 mm Column Temp.: 30 oC, StillAir mode Flow Rate: 0.5 mL/min Injection Vol.: 2 μL Mobile Phase A: 95:5 acetonitrile: DI water Mobile Phase B: 50 mM Ammonium Formate, pH 4.4 Gradient: 2 % B to 42 % B in 60 min Detector: VCAD, 50 oC, PF 1.0, 10 Hz, 5s
Column: Thermo Scientific™ Hypercarb™ Flow Rate: 0.9 mL/min CAD: 0.1 mL/min MS Injection Vol.: 20 µL Mobile Phase: Aqueous acetonitrile (containing 0.1% TFA) Gradient: 4% to 18% ACN in 40 min.
UV @ 210 nm
Charged Aerosol
0.0 2.0 4.0 6.0 8.0 10.0 12.0 14.0 16.0 18.0 20.0 -4.0 0.0 4.0 8.0 12.0 16.0 20.0 24.0 28.0
UV 280nm
CAD
Time [min]
Res
pons
e
BSA Column: Thermo Scientific™ Accucore™ 150, C4 Column Temp.: 45 ºC Flow Rate: 0.4 mL/min Injection Vol.: 1 µL of 0.5 mg/mL std. Mobile Phase A: 0.2% Aqueous TFA Mobile Phase B: 0.1% TFA in ACN Gradient: 10–90% B in 20 min
Amino Acids and Proteins
Glycans, Sialic Acids and Adjuvants Excipients Introduction
Figure 1 depicts the operation of the charged aerosol detector. At the top left (1) the mobile phase from the LC column entering the detector is nebulized by combining with a concentric stream of nitrogen gas or air (2). The fine droplets carried by bulk gas flow to the heated evaporation sector (3) are desolvated to form dry particles (5) from any nonvolatile or semivolatile species. Any remaining large droplets drain away to waste (4). The dry analyte particles combine with another gas stream that has been charged by a high voltage Corona charger (6). The charged gas transfers positive charge to the analyte particle’s surface (7). The charged analyte particles pass through an ion trap (8) that removes any high mobility species and pass to a collector where they are measured by a sensitive electrometer. The signal produced (9) is directly proportional to the quantity of analyte.
Acknowledgements We acknowledge the contribution of Mike Swartz who conducted the amino acid work in Figure 2 and Andy Hanniman who ran the CAD-MS experiment in Figure 5.
PO71803-EN 1015S
Africa +43 1 333 50 34 0Australia +61 3 9757 4300Austria +43 810 282 206Belgium +32 53 73 42 41Brazil +55 11 3731 5140Canada +1 800 530 8447China 800 810 5118 (free call domestic)
400 650 5118
Denmark +45 70 23 62 60Europe-Other +43 1 333 50 34 0Finland +358 10 3292 200France +33 1 60 92 48 00Germany +49 6103 408 1014India +91 22 6742 9494Italy +39 02 950 591
Japan +81 6 6885 1213Korea +82 2 3420 8600Latin America +1 561 688 8700Middle East +43 1 333 50 34 0Netherlands +31 76 579 55 55 New Zealand +64 9 980 6700 Norway +46 8 556 468 00
Russia/CIS +43 1 333 50 34 0Singapore +65 6289 1190Sweden +46 8 556 468 00 Switzerland +41 61 716 77 00Taiwan +886 2 8751 6655UK/Ireland +44 1442 233555USA +1 800 532 4752
www.thermoscientific.com©2015 Thermo Fisher Scientifi c Inc. All rights reserved. ISO is a trademark of the International Standards Organization. All other trademarks are the property of Thermo Fisher Scientifi c and its subsidiaries. This information is presented as an example of the capabilities of Thermo Fisher Scientifi c products. It is not intended to encourage use of these products in any manners that might infringe the intellectual property rights of others. Specifi cations, terms and pricing are subject to change. Not all products are available in all countries. Please consult your local sales representative for details.
Thermo Fisher Scientifi c,Sunnyvale, CA USA is ISO 9001 Certifi ed.