Embed Size (px)
Citation preview
Application of CAPS Markers for Genomic Studies in Wild Emmer Wheat 1
In: Cleaved Amplified Polymorphic Sequences … ISBN: 978-1-63117-553-4
Editor: Yuri Shavrukov © 2014 Nova Science Publishers, Inc.
Chapter 3
APPLICATION OF CAPS MARKERS FOR GENOMIC
STUDIES IN WILD EMMER WHEAT
Dina Raats1, Elitsur Yaniv
1,4, Assaf Distelfeld
2, Roi Ben-David
3,
Johanna Shanir1, Valery Bocharova
1, Alan Schulman
4
and Tzion Fahima1*
1Institute of Evolution and Department of Evolutionary and Environmental Biology,
University of Haifa, Haifa 31905, Israel 2Faculty of Life Sciences, Department of Molecular Biology and Ecology of Plants, Tel
Aviv University, Tel Aviv 69978, Israel 3Institute of Plant Sciences, Department of Vegetable and Field crops, Agricultural
Research Organization (ARO)-Volcani Center, Bet Dagan 5025000, Israel 4MTT/BI Plant Genomics Lab, MTT Agrifood Research, Jokioinen, Finland; Institute of
Biotechnology, Viikki Biocenter, University of Helsinki, P.O. Box 65, Helsinki, Finland
ABSTRACT
Wild emmer wheat, Triticum dicoccoides, the tetraploid progenitor of domesticated
wheat, is a promising source for crop improvement. Wild wheat populations harbor broad
phenotypic diversity for numerous agronomic traits such as yield, grain quality, disease
resistance, tolerance to abiotic stresses, and phenological characters. Wheat is of great
societal and economic importance. However, it possesses a large and complex genome
due to polyploidy and a high proportion of repetitive DNA, making genomic analysis and
development of markers for wheat improvement a significant challenge. Single-
nucleotide polymorphisms (SNPs) are considered among the most reliable and
reproducible types of sequence-based genetic markers. SNP genotyping by cleaved
amplified polymorphic sequences (CAPS) and derived CAPS (dCAPS) markers are
commonly used to target specific chromosome regions in genetic and breeding projects.
However, the application of CAPS markers for genetic mapping in polyploid wheat is
* Corresponding author: Tel: +972-4-8240-784, Fax: +972-4-8288-602, Email: [email protected].
Dina Raats, Elitsur Yaniv, Assaf Distelfeld et al. 2
complicated by the presence of both paralogous and homoeologous gene copies.
Therefore, an essential part of any mapping strategy is the development of genome-
specific markers. Previously, the development of CAPS markers was based on very
limited resources such as wheat expressed sequence tags (EST) and syntenic information
from rice, making the allocation of loci on homoeologous genomes a very laborious task.
Nevertheless, CAPS markers served as a major tool for high-resolution genetic mapping
and QTL cloning of the high grain protein transcription factor Gpc-B1 and the slow-
rusting resistance gene, Yr36, derived from wild emmer wheat. The recent efforts to
develop whole-genome sequence and chromosome-specific bacterial artificial
chromosome (BAC) libraries have permitted the establishment of large-scale wheat
genomics resources. An increase in wheat sequence data and the sequencing of complete
model grass genomes, used to infer wheat gene content and order based on comparative
genomics, had a major impact on CAPS marker development. Gene isolation projects,
including the powdery mildew resistance genes PmG16 and PmG3M, as well as the stripe
rust resistance genes Yr15 and YrH52 derived from wild emmer wheat, are currently
underway. In these projects, the development of genome-specific CAPS primers is based
on comparisons of wheat genome survey sequence data of individually sorted
chromosome arms. Although high throughput development and genotyping of markers
has progressed significantly in wheat, CAPS markers remain the method of choice for
fine genetic dissection and positional cloning of genes derived from T. dicoccoides and
other species in the genus because they provide simple analysis of complex genomes.
INTRODUCTION
Wild emmer wheat, Triticum turgidum ssp. dicoccoides (Korn.) Thell (T. dicoccoides
hereafter), is a winter annual, predominantly self-pollinating, grass of the Poaceae family and
Triticeae tribe, which was discovered in northern Israel by Aaronsohn in 1906 (Aaronsohn,
1910). T. dicoccoides is considered to be the progenitor of both cultivated bread and durum
wheat (McFadden and Sears, 1946). Wild emmer is an allotetraploid species comprised of
two sub-genomes (AA and BB) with 2n = 4x = 28 chromosomes. The A genome of wild
emmer originated from T. urartu (AA genome, 2n = 14; Dvořák et al., 1993; Huang et al.,
2002) and the BB genome from an extinct member of the sitopsis section closely related to
Aegilops speltoides (SS genome, 2n = 14; Feldman et al., 1995). Both genomes (AA and BB)
evolved from a common ancestor about 2.5 to 4.5 million years ago and were fused back into
a common nucleus about 0.36 to 0.5 million years ago by a spontaneous amphiploidization
event (Dvorak and Akhunov, 2005; Huang et al., 2002). Wild emmer is fully compatible with
the tetraploid (AABB) durum wheat T. turgidum ssp. durum and can be crossed with the
hexaploid (AABBDD) bread wheat T. aestivum L. (Feldman and Sears, 1981). In many crop
species, the domestication process resulted in a population bottleneck (Buckler et al., 2001)
that drastically decreased the gene pool of the domesticated populations; many alleles, or
gene variants, that were present in the original progenitor populations were lost. In particular,
the small initial population sizes and intense human selection for agronomic traits have
decreased the available genetic diversity of domesticated wheat, making it more sensitive to
biotic and abiotic stresses (Tanksley and McCouch, 1997).
Wild emmer wheat has been recognized as a promising source for improvement of
cultivated wheat. The wide ecological amplitude of wild emmer in the Fertile Crescent and its
unique genetic structure makes its gene pool of great importance for wheat breeding (Harlan
Application of CAPS Markers for Genomic Studies in Wild Emmer Wheat 3
and Zohary, 1966; Nevo et al., 2002; Peleg et al., 2005). Broad phenotypic diversity, both
between and within wild emmer populations, has been reported for numerous characters
including agronomic traits such as yield (Nevo et al., 2002; Peleg et al., 2005; Peleg et al.,
2008a), tolerance to abiotic stresses (Krugman et al., 2010; Krugman et al., 2011; Peleg et al.,
2005), grain constituents such as protein (Peleg et al., 2008a; Peleg et al., 2009; Uauy et al.,
2006) and mineral concentration (Bonfil and Kafkafi, 2000; Peleg et al., 2008a), phenological
traits (Kato et al., 1997), and resistance to diseases including powdery mildew (Gerechter-
Amitai and Silfhout, 1984; Moseman et al., 1985), stripe rust (Fahima et al., 1998; Gerechter-
Amitai and Stubbs, 1970; Nevo et al., 1986), and leaf rust (Moseman et al., 1985; Nevo et al.,
1986). The high grain protein transcription factor, Gpc-B1, and the stripe rust resistance gene,
Yr36, recently isolated by a map-based cloning approach, were found to be absent in
cultivated wheat germplasm and therefore demonstrated value of wild wheat biodiversity for
improvement of domesticated bread and pasta wheats (Fu et al., 2009; Uauy et al., 2006).
Gene isolation through map-based cloning in wheat is challenging because of its large
genome size (11.6 Gb in tetraploids, 17 Gb in hexaploids) and the high content (>80%) of
repetitive DNA, particularly retrotransposons (Bennett and Smith, 1976; Hollister and Gaut,
2009). Most wheat genes are present in more than one copy as homologs, usually located in
the same chromosomal regions of homoeologous chromosomes (Akhunov et al., 2003). In
addition, many genes have paralogs within each constituent genome as well as related gene
pairs stemming from the ancient whole-genome duplication. This genetic redundancy has
made it difficult to follow specific loci in genetics and breeding projects (Blake et al., 2004).
The development of genome-specific markers is hence an important goal. Polymerase chain
reaction (PCR)-based markers, such as those employing simple sequence repeats (SSRs) and
single nucleotide polymorphisms (SNPs), can potentially be genome-specific, allowing
polyploid wheat to be treated as a diploid in genetic analysis (Blake et al., 2004). Cleaved
amplified polymorphic sequence (CAPS) markers, which can be analyzed by PCR followed
by restriction enzyme treatment and agarose electrophoresis, are commonly used as a method
of choice for SNP genotyping in map-based cloning projects when marker identification and
saturation is required to cover a defined chromosome region.
In polyploids, SNP discovery is confounded by the presence of two types of SNPs. The
first corresponds to polymorphisms between homoeologous genomes that occur within
homozygous individuals. These SNPs are commonly found in wheat because the
homoeologous genomes share sequence identities of ~96-98% (Dvorak et al., 2006). These
SNPs are referred to as inter-homoeologue polymorphisms (IHP). The second type of
polymorphism corresponds to varietal SNPs between individuals, representing what is
traditionally referred to as allelic variation. This type of SNP is much less frequent (Trick et
al., 2012). The combined importance of gene flow in wild emmer populations, the synergy of
self-pollination, and the action of Ph1-like genes results in low and heterogeneous diversity
across wild emmer genomes (Akhunov et al., 2010). Nucleotide diversity θπ (Tajima, 1983)
was reported to be 2.7 × 10⁻³
in 21 A- and B-genome wild emmer genes in 28 accessions from
16 geographic locations (Haudry et al., 2007) and 0.72 × 10⁻³
in 585 and 576 A- and B-
genome loci in 10 wild emmer accessions from a Diyarbakir, Turkey population (Akhunov et
al., 2010). For comparison, θπ was estimated to be 9.7 × 10⁻³
in teosinte genes (Zea mays ssp.
parviglumis; Wright et al., 2005) and 7.7 to 8.1 × 10⁻³
in wild barley genes (Hordeum vulgare
ssp. spontaneum; Morrell et al., 2006). These studies show that wild wheat genomes exhibit
lower SNP levels as compared with other crop progenitors. Haudry et al.. (2007) estimated

Dina Raats, Elitsur Yaniv, Assaf Distelfeld et al. 4
SNP frequency to be 9.8 SNP/kb, while Akhunov et al.. (2010) detected 4.3 SNP/kb in the A
genome and 5.5 SNP/kb in the B genome of wild emmer wheat. Therefore, the molecular
diversity found in the A and B genomes of wild emmer wheat is still much higher than the
diversity found in the same genomes of cultivated wheat: 1.80 (±1.46) SNP/kb (Trick et al.,
2012) and 4.29 SNP/kb (Barker and Edwards 2009).
Because a complete reference genome sequence is not yet available for wheat, several
alternative strategies for locus allocation have been used so far to develop genome-specific
primers (GSPs) that amplify DNA markers from only a single genome in the allopolyploid
wheat. One approach to distinguish between A, B, and D genome -derived loci of hexaploid
wheat is based on comparisons with genomic DNA sequences of putative diploid wheat
ancestors of wheat. Triticum urartu or T. monococcum represents the A-genome donor, Ae.
speltoides, represents the source of the B-genome, and Ae. tauschii, is the ancestral D-genome
(Akhunov et al., 2010; Brenchley et al., 2012). A complementary approach to validate the
specificity of GSPs is based on assignment to a particular genome using aneuploid
cytogenetic stocks available for hexaploid wheat. Given that polyploid wheat can tolerate a
loss of chromosome segments, chromosome arms and even entire chromosomes, these
genetic stocks can enable more specific locus assignment (Endo and Gill, 1996). Wheat
aneuploid cytogenetic stocks available today include nulli-tetrasomics, ditelosomics and
deletion lines. All of these lines were developed in Chinese Spring (CS) background (Endo
and Gill, 1996). A set of T.durum cv Langdon (LDN)/CS D-genome disomic substitution
lines was established by Joppa and Williams (1988). These cytogenetic stocks present a
powerful tool for marker allocation to a specific chromosome arm as well as for sub-arm
assignment. However, these stocks provide limited resolution due to large deletion sizes
(average ~35 Mb) and the inability to order markers within a given bin (Paux et al., 2008).
The development of new polymorphic CAPS markers for wild emmer wheat was based
on very limited resources, including small sets of expressed sequence tags (ESTs) and
comparative genomic mapping exploiting synteny between wheat, rice (Oryza sativa), and
Brachypodium distachyon (hereafter, Brachypodium). ESTs are typically unedited,
automatically processed, single-read sequences produced from complementary DNA (cDNA)
copies of the 3’ end of mRNA, and therefore correspond to the transcribed region of the
genome (Rudd, 2003). Cytogenetic stocks were used for EST allocation to chromosomal
“deletion bins”, which are regions delineated by neighboring deletion breakpoints, followed
by construction of chromosome deletion bin maps of ESTs (Qi et al., 2004).
Comparative mapping in plants has provided evidence for a remarkable conservation of
gene content (synteny) and order (colinearity) between related genomes and has resulted in
the new discipline of comparative genomics (Tang et al., 2008). Rice emerged as a
particularly valuable reference for comparative mapping in wheat, when its small diploid
genome become the first of the cereals to be sequenced (Goff et al., 2002; Yu et al., 2002;
International Rice Genome Sequencing Project, 2005). Large-scale EST mapping allowed
establishment of comparative wheat-rice genomic maps, which served as the basis for marker
enrichment in map-based cloning projects with wild emmer wheat. These resources enabled
in silico chromosome walking, using the rice genome sequence as a reference for mapping
wheat ESTs to the chromosome region harboring the target gene (Distelfeld et al., 2006). In
recent years, Brachypodium has perhaps replaced rice as the favorite grass model genome,
due to its small genome size (270 Mb) and recent divergence time from wheat some 32-39
million years ago. Brachypodium has become increasingly widely used for gene prediction
Application of CAPS Markers for Genomic Studies in Wild Emmer Wheat 5
and construction of synteny-based maps in wheat (Bossolini et al., 2007; Wicker et al., 2011),
complemented by other grass genomes.
The recent convergence of several technologies has dramatically changed the situation
for wheat genomics. The public database of wheat ESTs rapidly increased from 549,926 in
2004 to over 1,286,060 ESTs by 2012 (http://www.ncbi.nlm.nih.gov/dbEST/). The ability to
sort out individual wheat chromosomes by flow cytometry led to reduction in the complexity
of wheat genome analysis, making possible the development of chromosome-specific
bacterial artificial chromosome (BAC) libraries from aneuploid lines of the model wheat
genotype Chinese Spring (Dolezel et al., 2012; Safar et al., 2004; Safar et al., 2010).
Nowadays, chromosome- and chromosome-arm-specific BAC libraries are available for all
wheat chromosomes (Dolezel et al., 2012). These technologies have allowed the International
Wheat Genome Sequencing Consortium (IWGSC; http://www.wheatgenome.org/),
established with the goal to generate a reference genome sequence for hexaploid wheat
(Feuillet and Eversole, 2007), to adopt a chromosome-by-chromosome sequencing strategy
involving the construction of BAC-based physical maps as a necessary intermediate step.
Massive genomic resources have been generated by IWGSC and are now accessible at the
Unité de Recherches en Génomique Info (URGI; http://wheat-urgi.versailles.inra.fr/).
Physical maps of individual wheat chromosomes and chromosome arms are now being
established via various fingerprinting technologies (Luo et al., 2003; Philippe et al., 2012). To
anchor the physical contigs and to provide useful sequencing data, survey sequencing (~1.5 to
80-fold genome coverage) has been carried out using “next generation” sequencing (NGS) for
42 individually sorted wheat chromosome arms, followed by assembly of contigs from the
data (survey sequence contigs; SSCs). Gene content and a hypothetical gene order in the
syntenic regions of the wheat genome has been deduced by compilation of synteny
information from the completely sequenced genomes of grasses such as rice (International
Rice Genome Sequencing Project, 2005), sorghum, Sorghum bicolor (Paterson et al., 2009),
and Brachypodium (International Brachypodium Initiative, 2010) using the GenomZipper
approach (Mayer et al., 2009; Mayer et al., 2011) and deposited to URGI (http://wheat-
urgi.versailles.inra.fr/). Brenchley et al. (2012) analyzed a low-coverage, long-read (Roche
454) shotgun sequence of the hexaploid wheat genome. They created assemblies of wheat
genes in an orthologous gene family framework by using diploid wheat relatives to classify
homologous relationships. This allowed production of a genome-wide catalogue of SNPs in
the A, B and D genomes. These new resources, developed for domesticated wheat, have
contributed in parallel to the advancement of wild emmer wheat genomic research and to the
promotion of marker development.
In this chapter, we will illustrate the challenges involved in developing CAPS markers
within the complex wheat genome milieu, as well as the evolution of CAPS marker
development in tetraploid emmer wheat during the past 12 years. Initially, these challenges
were managed with minimal genomic resources, which included limited EST data, and relied
mainly on rice genome sequences as a reference model for pioneering microcolinearity
studies. Over the last decade or so, dramatic progress was achieved, aided by the availability
of survey sequences of individual wheat chromosome arms; the complete reference genome
sequence of wheat is expected to be available within several years. We provide here examples
from several genetic fine-mapping projects for stripe rust and powdery mildew resistance
genes derived from wild emmer wheat, as well as from the positional cloning of the high
grain protein QTL, Gpc-B1, and the slow rusting gene, Yr36.
Dina Raats, Elitsur Yaniv, Assaf Distelfeld et al. 6
GENERAL APPROACH FOR CAPS MARKER DEVELOPMENT IN WILD
EMMER WHEAT
Development of CAPS markers, in the absence of a wheat reference genome sequence,
has had to rely on conserved gene sequences, which allow the assignment of wheat ESTs into
defined chromosomal regions based on comparative genomics with other grass genomes.
Previously, before the GenomeZipper became available for all wheat chromosomes, each lab
had to pave its own way into a specific region of interest. The first step in such a comparative
study is to identify the orthologous chromosomal regions on the wheat and model grass
genomes by a homology search using the basic local alignment search tool (BLAST; Altschul
et al., 1990). Wheat sequences, such as restriction fragment length polymorphism (RFLP)
markers (Distelfeld et al., 2004) or ESTs, previously assigned to wheat deletion bins (Ben-
David et al., 2010; Qi et al., 2004), can be used for BLAST searches against rice and
Brachypodium (Ben-David et al., 2010). The following step is to BLAST the model grass
sequences covering the orthologous regions against the wheat EST database in order to detect
the syntenic wheat genes residing in the specific chromosome regions, while performing in
silico chromosome walking. This stage in the process of CAPS marker development has been
significantly facilitated by the recent construction of a GenomeZipper for all wheat
chromosomes (http://www.wheatgenome.org/). Wheat sequences assigned to chromosomal
positions along the GenomeZipper are easily extracted, and provide a high success rate in
CAPS marker development because they have a high probability of being mapped to the
region of interest. The synteny and the colinearity in the orthologous chromosomal regions
are reliably reflected by the GenomeZipper because the ordering of genes or gene-related
sequences is based on a high degree of homology with three model grass genomes, instead of
on comparisons of wheat sequences to only one of the grass genomes (Bossolini et al., 2007;
Feuillet et al., 2001). Furthermore, the assignment of loci to the various homoeologous
chromosomes of polyploid wheat is now possible due to the availability of the wheat SSCs.
Wheat sequences retrieved by homology search can be used to derive further markers. The
genomic positions of the newly developed markers are finally verified by genetic linkage
mapping.
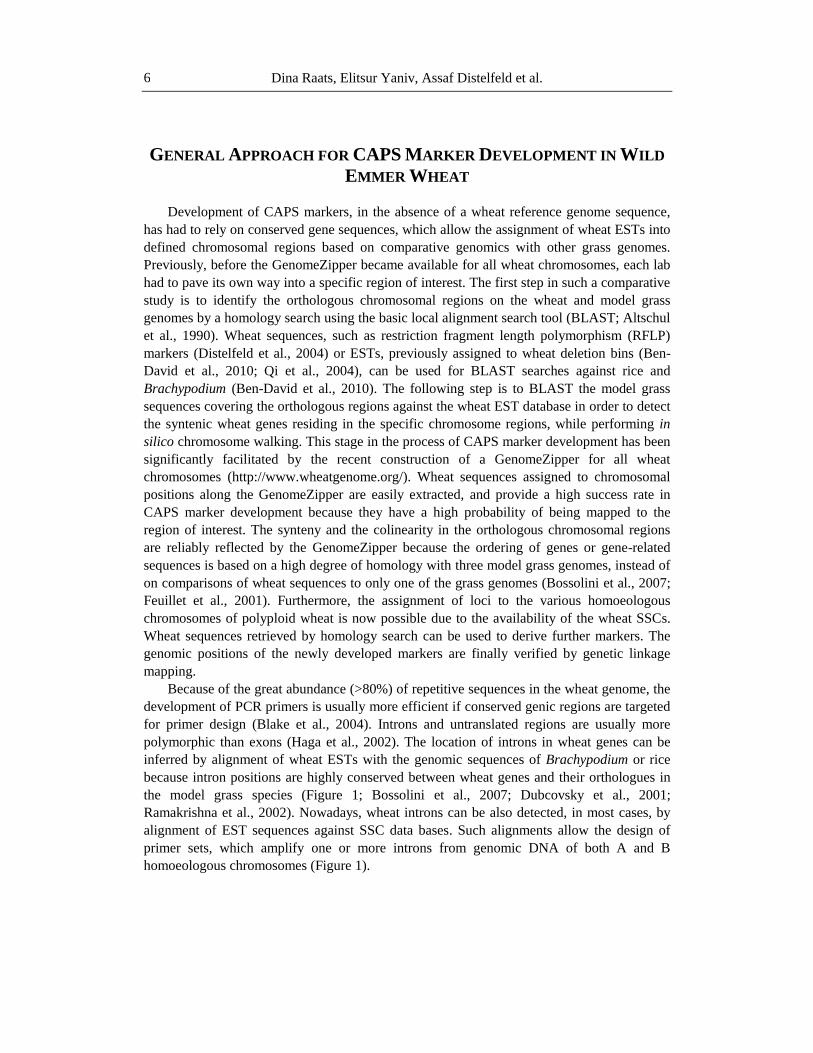
Because of the great abundance (>80%) of repetitive sequences in the wheat genome, the
development of PCR primers is usually more efficient if conserved genic regions are targeted
for primer design (Blake et al., 2004). Introns and untranslated regions are usually more
polymorphic than exons (Haga et al., 2002). The location of introns in wheat genes can be
inferred by alignment of wheat ESTs with the genomic sequences of Brachypodium or rice
because intron positions are highly conserved between wheat genes and their orthologues in
the model grass species (Figure 1; Bossolini et al., 2007; Dubcovsky et al., 2001;
Ramakrishna et al., 2002). Nowadays, wheat introns can be also detected, in most cases, by
alignment of EST sequences against SSC data bases. Such alignments allow the design of
primer sets, which amplify one or more introns from genomic DNA of both A and B
homoeologous chromosomes (Figure 1).
Application of CAPS Markers for Genomic Studies in Wild Emmer Wheat 7
Figure 1. Development of cleaved amplified polymorphic sequences (CAPS) markers based on
comparative genomics. Conserved gene sequences, indicated in green, which matched Brachypodium
exons, were identified by alignment of homologous wheat ESTs against Brachypodium genomic
sequences. The sequences were used to design conserved primers (red boxes). The conserved primers
amplified homoeologous alleles (A and B genomes) of the same size in tetraploid T. dicoccoides. In
most cases, longer fragments were amplified by the conserved primers from T. dicoccoides genomic
DNA than expected based on EST sequences, validating the presence of introns. Sequence
polymorphism between the amplified homoeologues was used to develop B genome-specific primers
(purple boxes). Furthermore, usually these primers are designed to flank a SNP generating a specific
restriction site in one of the alleles, which can differentiate between the alternative alleles amplified
from T. dicoccoides and T. durum and can be detected by enzymatic digestion. Allelic polymorphisms
obtained by the digestion of the genome B-specific fragments with a restriction enzyme can be mapped
in the segregating population derived from a cross of T. dicoccoides with T. durum.
In polyploid wheat, PCR products amplified from genomic DNA may include multiple
fragments of similar size, which are derived from more than one of the component genomes
(Figure 1). One possible strategy to overcome this obstacle is to sequence the different
homoeoalleles and to design a GSP that amplifies only the target allele (Helguera et al.,
2000). Because direct Sanger sequencing of a mixture of PCR products will not yield
meaningful results, the way to separate amplicons corresponding to the different genomes, as
well to detect allelic polymorphism in one of the homoeologous sub-genomes, is to clone the
PCR products into a plasmid vector prior to sequencing. To distinguish between
homoeologous genomes prior to sequencing, five or six colonies, randomly selected from
each parental line, can be screened with a restriction enzyme panel (e.g. AciI, BamHI, AraIII,
EcoRV, MnlI, and NlaIII; Figure 2). Only two clones corresponding to different genomes are
sequenced for each parental line, the sequences compared, and IHPs used to design GSPs.
Nowadays, with the cost of sequencing dramatically dropping, several colonies from each
parental line can be directly sequenced and IHP and GSP detected based on alignment of
several sequences derived from each parental line (Figure 3). Traditionally, GSPs were
Dina Raats, Elitsur Yaniv, Assaf Distelfeld et al. 8
validated by testing them in a set of aneuploid lines, but recently it became more common,
due to its accuracy, to use DNA samples of sorted chromosome arms (Dolezel et al., 2012) to
assign the two types of clones to the A and B genomes (Figure 4A). The GSPs are then used
to amplify DNA samples of the parental lines for sequencing. A comparison of genome-
specific sequences allows the identification of allelic polymorphisms suitable for genetic
mapping. The development of CAPS markers is based on the identification of SNPs that
generate differential restriction patterns between the tested lines. Once a polymorphic
restriction site is identified, the allele-specific PCR fragments generated by the GSP are
digested with the corresponding restriction enzyme and the restriction profiles analyzed by
agarose gel electrophoresis (Figure 4B).
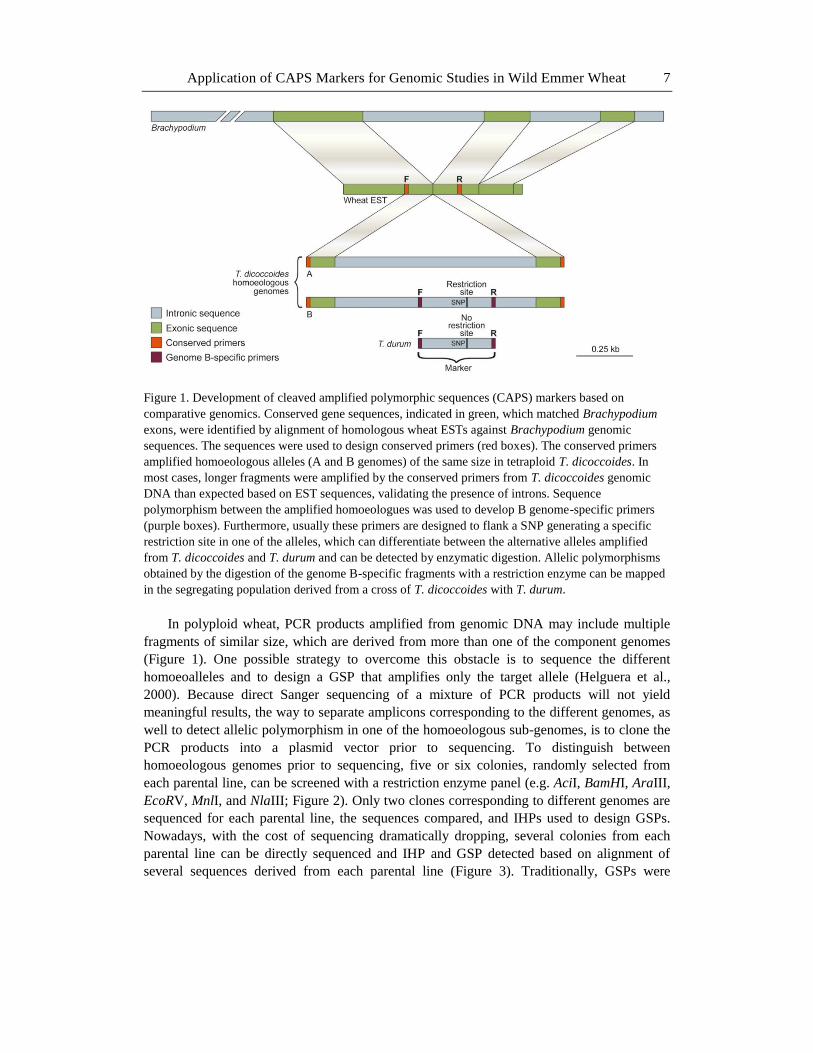
Figure 2. Characterization of homoeologous polymorphism by a restriction enzyme panel. PCR
products amplified from T. durum and T. dicoccoides were cloned into plasmids and transformed into
E. coli cells. PCR products were amplified from six different E. coli colonies randomly selected for
each of the parental lines (Lanes 1-6 are derived from T. durum, while 7-12 represent T. dicoccoides).
These PCR products were digested with a panel of six restriction enzymes. AciI (a) and BamHI (b)
digestions identified two types of colonies corresponding to homoeologous alleles (representing A and
B genomes) in both lines. The digestion with BamHI gave only two restriction patterns in all 12
colonies (b1,5,6,8,9 vs. b2,3,4,7,10,11,12), indicating the presence of a consistent SNP distinguishing
between the A and B homoeoalleles in both T. durum and T. dicoccoides. In contrast, the digestion with
AciI gave three different restriction patterns (a1,5,6,9; a2,3,4; a7,10,11,12; for a8, see troubleshooting
below), which may indicate the presence of an additional SNP differentiating between the T. durum and
T. dicoccoides alleles, within the same sub-genome. AraIII (c) digestion identified two cases (c2 and
c4) that may indicate the presence of possible SNPs or simple technical errors (see troubleshooting
below). EcoRV (d) digestion detected an allelic polymorphism in one of the homoeologous sub-
genomes in T. dicoccoides. MnlI (e) and NlaIII (f) digestions resulted in no polymorphism. M, DNA
ladder.
Application of CAPS Markers for Genomic Studies in Wild Emmer Wheat 9
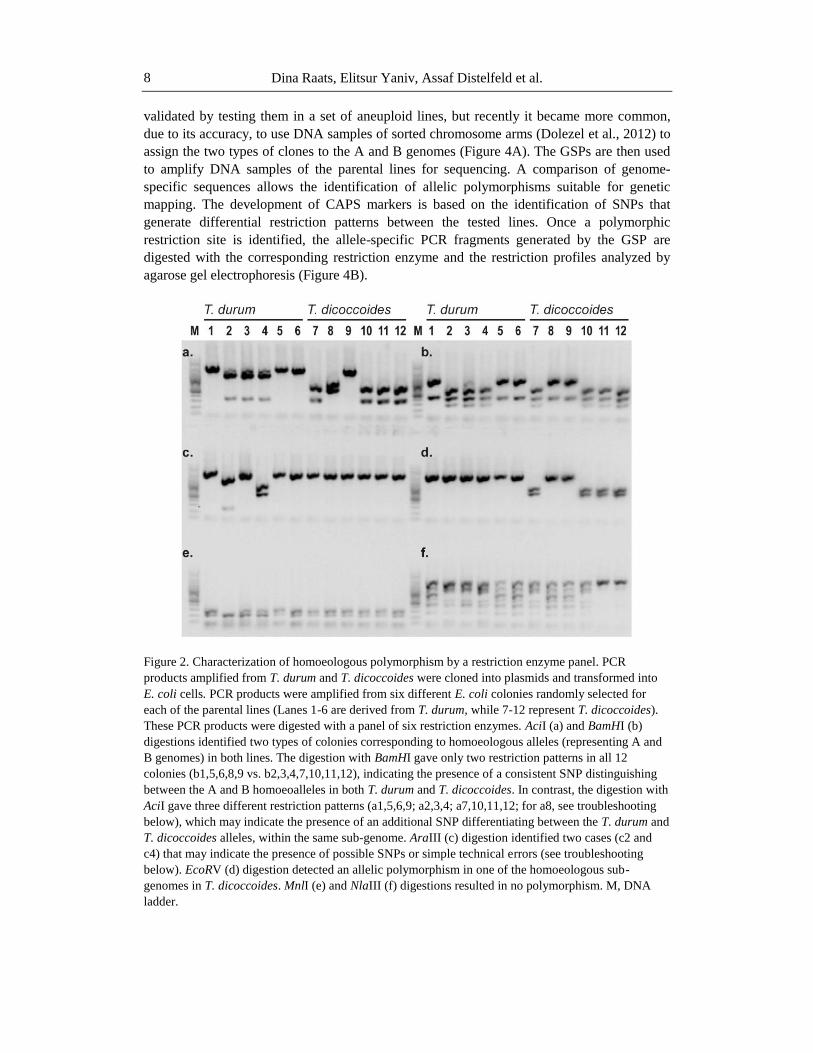
Figure 3. Sequence alignment to design a cleaved amplified polymorphic sequence (CAPS) marker.
The alignment of sequenced fragments amplified by conserved primers (shown by light green box)
from T. dicoccoides and T. durum revealed the presence of homoeoalleles (A and B) derived from both
parental lines. The conserved primers, which were designed to match an EST exon region amplified an
intron from the genomic DNA. Inter-homoeologue sequence (IHS) polymorphisms (indicated as
colored nucleotides: red A; green T; blue G; yellow C) were used to design genome B-specific primers
(GBSP, shown by orange box). Comparison of sequences delimited by GBSP from T. dicoccoides and
T. durum revealed the presence of a SNP-generated restriction site for the restriction enzyme DraIII
(designated by a purple box) in the T. durum allele, thus enabling the development of a CAPS marker.
Digestion of the GBSP-amplified products from T. dicoccoides and T. durum with DraIII differentiate
between the alternative alleles resulting in two bands for T. durum after an agarose gel electrophoresis,
compared to only one band for T. dicoccoides. This allelic polymorphism may be used to map the
corresponding locus in a mapping population derived from the cross between T. dicoccoides and T.
durum.

Dina Raats, Elitsur Yaniv, Assaf Distelfeld et al. 10
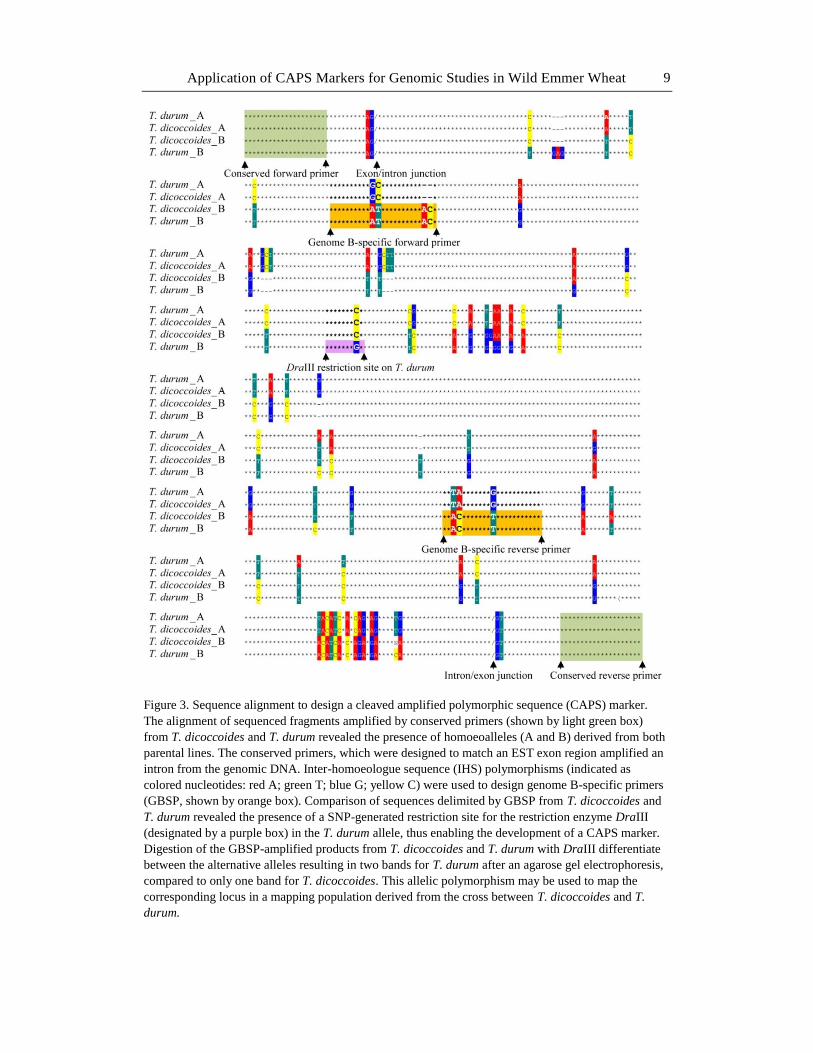
Figure 4. Cleaved amplified polymorphic sequence (CAPS) marker for mapping of a specific locus to
1BS chromosome 1BS. A. Marker assignment to chromosome 1BS deletion bin 1BS19-0.31-0.50
performed by PCR with aneuploid lines of Chinese Spring (CS) corresponding to a ditelosomic 1BL-
(Dt-1BL; Endo and Gill, 1996), two sorted chromosome arms 1BS and 1AS (Dolezel et al., 2012), and
five deletion lines (1BS4, 1BS9, 1BS10, 1BS18, 1BS19; Endo and Gill, 1996). B. PCR products
digested with restriction enzyme DraIII are shown for parental lines (lanes 1 & 2) and an F2 mapping
population (lanes 3-20; L, LDN, Triticum durum allele; D, DIC, T. diccocoides allele; H heterozygous,
M, DNA ladder).
Troubleshooting: We deliberately do not present a "perfect" gel here. Instead we present
a typical gel, which demonstrates effective discrimination between the two homoeoalleles (A
vs. B) and even indicates possible allelic polymorphism in only one of the homoeologous
chromosomes (e.g. T. durum and T. dicoccoides alleles). However, this experiment suffers
from several flaws. First, the restriction pattern in lane a8 is not supported by the results
obtained with other enzymes. Colony 8 derived from T. dicoccoides should be identical to
colony 9 in all panels; therefore, we can suspect that a technical error occurred in a8. Second,
the digestion of T. durum PCR products with AraIII gave three different restriction patterns in
colonies c2, 3 and 4, which show identical restriction patterns by five other enzymes.
Although a technical error is the most likely explanation for these patterns, an alternative
explanation is that c2 or c4 represent a different homoeoallele, while c4 and c2 represent Taq
polymerase error that created de novo mutations. Therefore, only c3 represents a true
technical error (i.e. no restriction enzyme added).
In some cases, the SNP between alleles does not generate any polymorphic restriction
site. This kind of SNP could be utilized for development of PCR-based markers by an
alternative approach designated as "derived CAPS" (dCAPS; Komori and Nitta, 2005;
Michaels and Amasino, 1998). To distinguish alleles that differ by a SNP, the region of DNA
containing the base change is amplified using GSP, which contains one or two mismatches.
The introduction of these base changes into the PCR product, together with the base change
between the alleles, creates a unique restriction site in one of the alleles (Michaels and
Amasino, 1998). CAPS/dCAPS markers are then used for screening of mapping populations
(Figure 4B) and genetic mapping.
DLM
539
344195
bp L L L LLD D D D D D D DH H H H H1
1
2 4 65 7 8 9 1011 141213 1815 17163
A.
B.
2019
1BS-4 1AS1BS
1BS-18
1BS-9
1BS-19
1BS-10 CS
Dt1BL
M
500
bp
Application of CAPS Markers for Genomic Studies in Wild Emmer Wheat 11
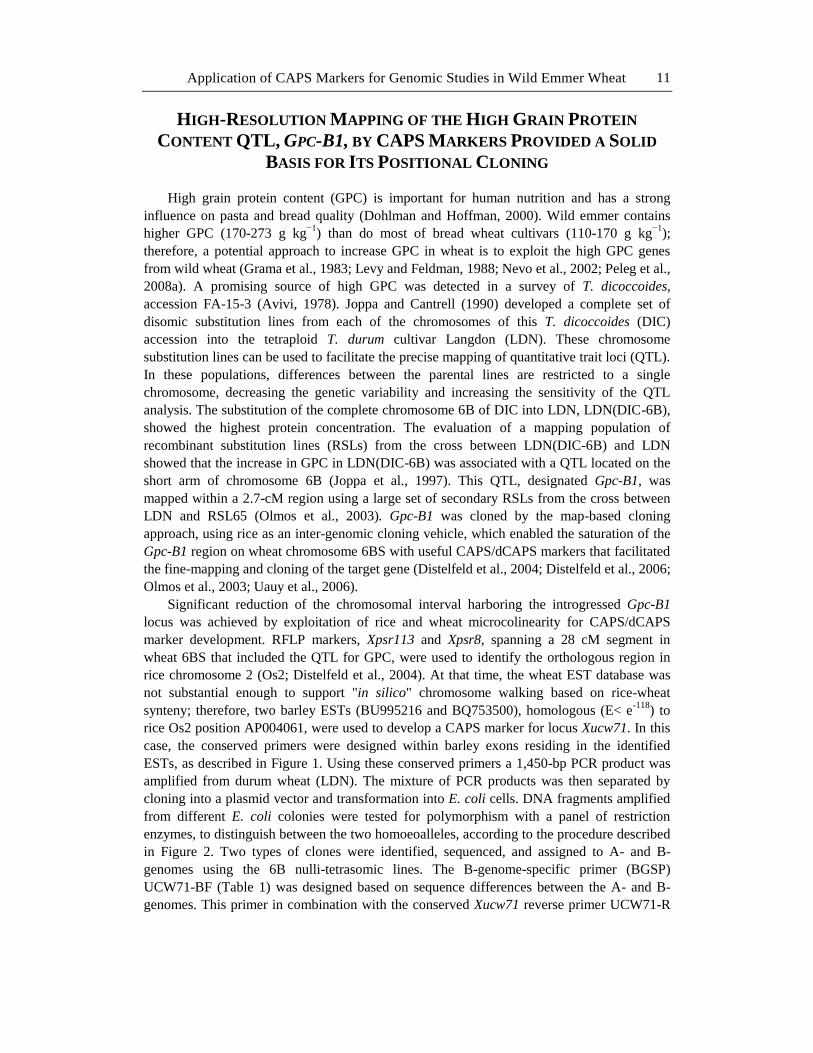
HIGH-RESOLUTION MAPPING OF THE HIGH GRAIN PROTEIN
CONTENT QTL, GPC-B1, BY CAPS MARKERS PROVIDED A SOLID
BASIS FOR ITS POSITIONAL CLONING
High grain protein content (GPC) is important for human nutrition and has a strong
influence on pasta and bread quality (Dohlman and Hoffman, 2000). Wild emmer contains
higher GPC (170-273 g kg−1
) than do most of bread wheat cultivars (110-170 g kg−1
);
therefore, a potential approach to increase GPC in wheat is to exploit the high GPC genes
from wild wheat (Grama et al., 1983; Levy and Feldman, 1988; Nevo et al., 2002; Peleg et al.,
2008a). A promising source of high GPC was detected in a survey of T. dicoccoides,
accession FA-15-3 (Avivi, 1978). Joppa and Cantrell (1990) developed a complete set of
disomic substitution lines from each of the chromosomes of this T. dicoccoides (DIC)
accession into the tetraploid T. durum cultivar Langdon (LDN). These chromosome
substitution lines can be used to facilitate the precise mapping of quantitative trait loci (QTL).
In these populations, differences between the parental lines are restricted to a single
chromosome, decreasing the genetic variability and increasing the sensitivity of the QTL
analysis. The substitution of the complete chromosome 6B of DIC into LDN, LDN(DIC-6B),
showed the highest protein concentration. The evaluation of a mapping population of
recombinant substitution lines (RSLs) from the cross between LDN(DIC-6B) and LDN
showed that the increase in GPC in LDN(DIC-6B) was associated with a QTL located on the
short arm of chromosome 6B (Joppa et al., 1997). This QTL, designated Gpc-B1, was
mapped within a 2.7-cM region using a large set of secondary RSLs from the cross between
LDN and RSL65 (Olmos et al., 2003). Gpc-B1 was cloned by the map-based cloning
approach, using rice as an inter-genomic cloning vehicle, which enabled the saturation of the
Gpc-B1 region on wheat chromosome 6BS with useful CAPS/dCAPS markers that facilitated
the fine-mapping and cloning of the target gene (Distelfeld et al., 2004; Distelfeld et al., 2006;
Olmos et al., 2003; Uauy et al., 2006).
Significant reduction of the chromosomal interval harboring the introgressed Gpc-B1
locus was achieved by exploitation of rice and wheat microcolinearity for CAPS/dCAPS
marker development. RFLP markers, Xpsr113 and Xpsr8, spanning a 28 cM segment in
wheat 6BS that included the QTL for GPC, were used to identify the orthologous region in
rice chromosome 2 (Os2; Distelfeld et al., 2004). At that time, the wheat EST database was
not substantial enough to support "in silico" chromosome walking based on rice-wheat
synteny; therefore, two barley ESTs (BU995216 and BQ753500), homologous (E< e-118
) to
rice Os2 position AP004061, were used to develop a CAPS marker for locus Xucw71. In this
case, the conserved primers were designed within barley exons residing in the identified
ESTs, as described in Figure 1. Using these conserved primers a 1,450-bp PCR product was
amplified from durum wheat (LDN). The mixture of PCR products was then separated by
cloning into a plasmid vector and transformation into E. coli cells. DNA fragments amplified
from different E. coli colonies were tested for polymorphism with a panel of restriction
enzymes, to distinguish between the two homoeoalleles, according to the procedure described
in Figure 2. Two types of clones were identified, sequenced, and assigned to A- and B-
genomes using the 6B nulli-tetrasomic lines. The B-genome-specific primer (BGSP)
UCW71-BF (Table 1) was designed based on sequence differences between the A- and B-
genomes. This primer in combination with the conserved Xucw71 reverse primer UCW71-R
Dina Raats, Elitsur Yaniv, Assaf Distelfeld et al. 12
(Table 1) amplified a segment from the B genome of DIC. A comparison of B-genome
sequences of LDN and DIC revealed the presence of one SNP that generated a restriction site
for BsmI, thus allowing the development of a CAPS marker. Digestion of the amplified
product with BsmI produced fragments of 385 bp in LDN and 429 bp in DIC which were used
to map the Xucw71 locus in a mapping population of RSLs from the cross between
LDN(DIC-6B) and LDN (Table 2; Distelfeld et al., 2004).
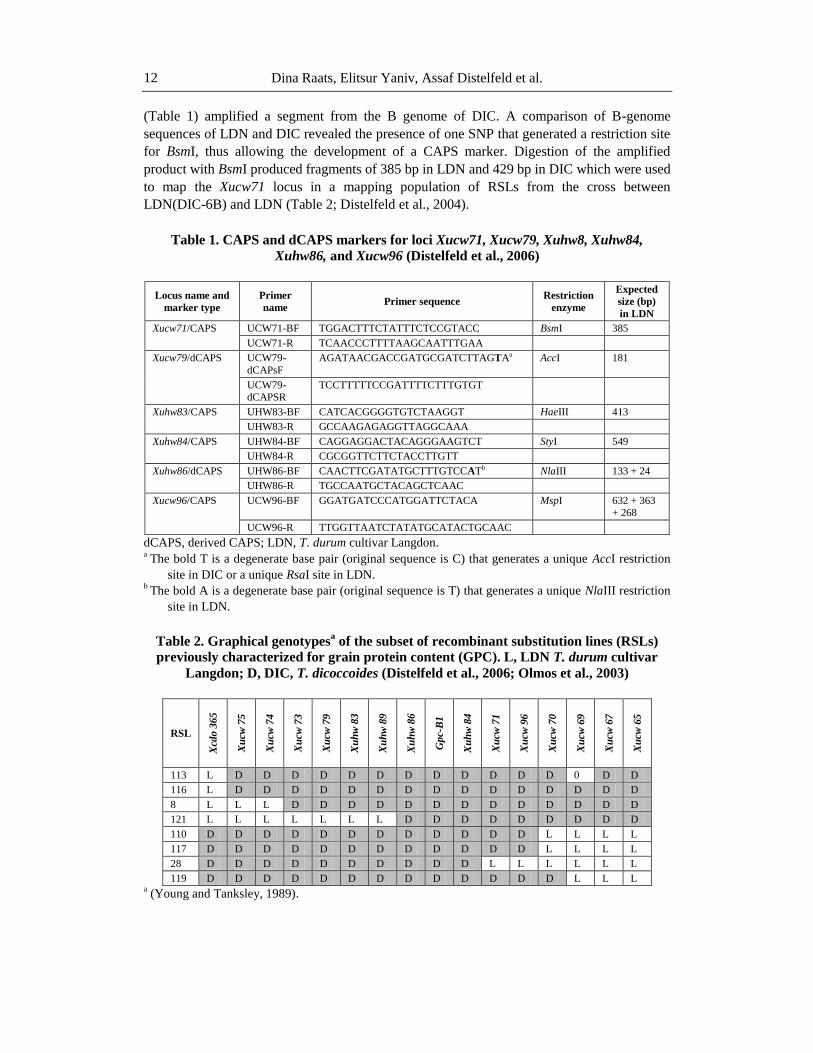
Table 1. CAPS and dCAPS markers for loci Xucw71, Xucw79, Xuhw8, Xuhw84,
Xuhw86, and Xucw96 (Distelfeld et al., 2006)
Locus name and
marker type
Primer
name Primer sequence
Restriction
enzyme
Expected
size (bp)
in LDN
Xucw71/CAPS UCW71-BF TGGACTTTCTATTTCTCCGTACC BsmI 385
UCW71-R TCAACCCTTTTAAGCAATTTGAA
Xucw79/dCAPS UCW79-
dCAPsF
AGATAACGACCGATGCGATCTTAGTAa AccI 181
UCW79-dCAPSR
TCCTTTTTCCGATTTTCTTTGTGT
Xuhw83/CAPS UHW83-BF CATCACGGGGTGTCTAAGGT HaeIII 413
UHW83-R GCCAAGAGAGGTTAGGCAAA
Xuhw84/CAPS UHW84-BF CAGGAGGACTACAGGGAAGTCT StyI 549
UHW84-R CGCGGTTCTTCTACCTTGTT
Xuhw86/dCAPS UHW86-BF CAACTTCGATATGCTTTGTCCATb NlaIII 133 + 24
UHW86-R TGCCAATGCTACAGCTCAAC
Xucw96/CAPS
UCW96-BF GGATGATCCCATGGATTCTACA MspI 632 + 363 + 268
UCW96-R TTGGTTAATCTATATGCATACTGCAAC
dCAPS, derived CAPS; LDN, T. durum cultivar Langdon. a
The bold T is a degenerate base pair (original sequence is C) that generates a unique AccI restriction
site in DIC or a unique RsaI site in LDN. b
The bold A is a degenerate base pair (original sequence is T) that generates a unique NlaIII restriction
site in LDN.
Table 2. Graphical genotypesa of the subset of recombinant substitution lines (RSLs)
previously characterized for grain protein content (GPC). L, LDN T. durum cultivar
Langdon; D, DIC, T. dicoccoides (Distelfeld et al., 2006; Olmos et al., 2003)
RSL
Xcd
o 3
65
Xu
cw
75
Xu
cw
74
Xu
cw
73
Xu
cw
79
Xu
hw
83
Xu
hw
89
Xu
hw
86
Gp
c-B
1
Xu
hw
84
Xu
cw
71
Xu
cw
96
Xu
cw
70
Xu
cw
69
Xu
cw
67
Xu
cw
65
113 L D D D D D D D D D D D D 0 D D
116 L D D D D D D D D D D D D D D D
8 L L L D D D D D D D D D D D D D
121 L L L L L L L D D D D D D D D D
110 D D D D D D D D D D D D L L L L
117 D D D D D D D D D D D D L L L L
28 D D D D D D D D D D L L L L L L
119 D D D D D D D D D D D D D L L L a (Young and Tanksley, 1989).
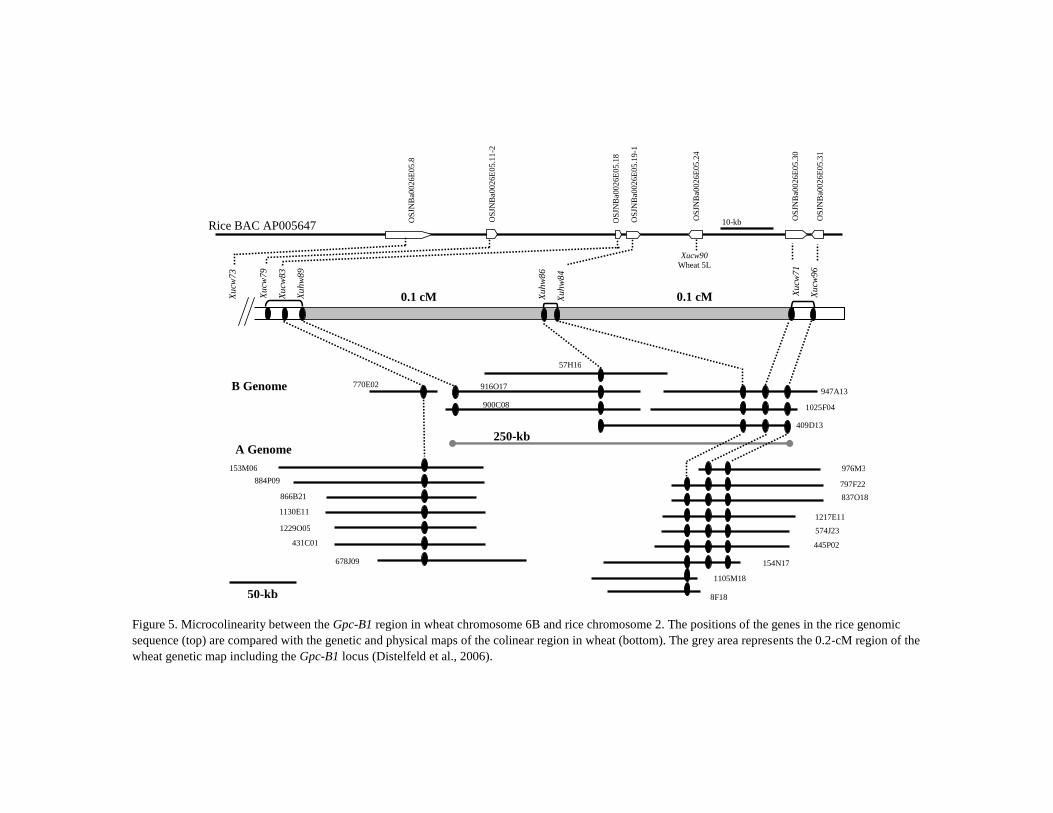
Figure 5. Microcolinearity between the Gpc-B1 region in wheat chromosome 6B and rice chromosome 2. The positions of the genes in the rice genomic
sequence (top) are compared with the genetic and physical maps of the colinear region in wheat (bottom). The grey area represents the 0.2-cM region of the
wheat genetic map including the Gpc-B1 locus (Distelfeld et al., 2006).
Xu
cw8
3
X
uh
w8
9
Xu
hw
86
Xu
cw7
1 X
ucw
96
250-kb
770E02 900C08
916O17
409D13
947A13 1025F04
0.1 cM 0.1 cM
A Genome
1229O05 1130E11 866B21
678J09 431C01
884P09 153M06 976M3
1105M18 8F18
1217E11 574J23
797F22 837O18
154N17 X
uh
w8
4
445P02
B Genome
Xu
cw7
9
57H16
Rice BAC AP005647 10-kb OS
JNB
a002
6E
05
.19
-1
OS
JNB
a002
6E
05
.24
OS
JNB
a002
6E
05
.30
OS
JNB
a002
6E
05
.18
OS
JNB
a002
6E
05
.11
-2
OS
JNB
a002
6E
05
.8
Xucw90
Wheat 5L
OS
JNB
a002
6E
05
.31
Xu
cw7
3
50-kb
Dina Raats, Elitsur Yaniv, Assaf Distelfeld et al. 14
Wheat EST CA643341 which is homologous (E< e-24
) to rice Os2 at position AP004061,
was used to develop a dCAPS marker for locus Xucw79. Using EST-based conserved
primers, a 4.5-kb fragment from LDN and DIC was amplified and cloned. The PCR
fragments from different transformed E. coli colonies were assigned to the A and B genomes
as described above. The B-genome clones from DIC and LDN were sequenced and BGSPs
were developed. The B-genome sequences amplified by BGSPs contained no SNPs that could
generate any restriction site. Therefore, a dCAPS marker (Michaels and Amasino, 1998) was
developed by adding a degenerate T into BGSP UCW79-dCAPSF (Table 1) in the second
base from the 3’ end (the original base was C), creating a unique AccI restriction site in the
amplified product from DIC and a unique RsaI restriction site in the amplified product from
LDN. This primer, in combination with the BGSP UCW79-dCAPSR (Table 1) amplified a
181-bp fragment which, after digestion with AccI, produced a polymorphism between DIC
(156 bp + 25 bp) and LDN (181 bp). This polymorphism was used to map Xucw79 in the
Gpc-B1 RSL population (Table 2). This approach enabled the narrowing down of the position
of the Gpc-B1 locus to a 0.2-cM region flanked by CAPS and dCAPS markers, Xucw71 and
Xucw79, respectively, which corresponded to a 64-kb region in rice chromosome 2 (Figure 5;
Distelfeld et al., 2006).
Further exploitation of rice-wheat microcolinearity and CAPS marker development
allowed the construction of the physical map covering the 6BS chromosomal region that
harbors the Gpc-B1 locus. Two additional CAPS markers, Xuhw83 and Xuhw84, were
developed based on wheat ESTs BQ789353 and BE444066, respectively, and identified based
on homology with rice Os2 (Table 1). The marker Xuhw83 co-segregated with Xucw79, while
Xuhw84 co-segregated with the target locus Gpc-B1, as was shown by genetic and physical
mapping of the recombination events that flank the Gpc-B1 locus (Table 2, Figure 5). A
tetraploid wheat RSL65 BAC library, which carries a 30 cM T. diccocoides 6BS
chromosomal segment harboring the high GPC gene (Cenci et al., 2003), was hybridized with
DNA probes that represent loci Xucw71, Xuhw83, and Xuhw84. Several BAC clones
corresponding to two non-overlapping BAC contigs were detected (Figure 5). Using BAC-
end sequences (BES), additional CAPS (Xucw96) and dCAPS (Xuhw86) markers were
developed, enabling the correct orientation of the BAC contigs (Table 1, Figure 5). A
modified probe for locus Xuhw86 was designed for further steps of chromosome walking.
Hybridization of this probe with a RSL65 BAC library revealed three positive BAC clones
and closed the gap between the two previously identified BAC contigs. An allele-specific
marker Xuhw89, which was developed from BES of BAC 916O17, was mapped on the
critical RSLs and was completely linked to Xuhw83 and one crossover distal to the Gpc-B1
gene (Table 2, Figure 5). Mapping of CAPS/dCAPS markers located the Gpc-B1 gene within
a BAC contig composed of six overlapping BAC clones, which spans a region of
approximately 250 kb (Figure 5; Distelfeld et al., 2006). The complete sequence of this region
revealed five candidate genes. A high-resolution genetic map based on approximately 9000
gametes and seven new markers (three CAPS, two dCAPS, and two SSR), was used to
determine linkage between these genes and the Gpc-B1 locus. The region harboring the Gpc-
B1 was delimited by CAPS markers Xuhw106 and Xuhw109 (Uauy et al., 2006). The
annotation of this 7.4 kb region identified a single gene encoding a NAC domain protein
which was designated NAM-B1
(Uauy et al., 2006). The cloning and the functional study of the Gpc-B1 provide a direct link
Application of CAPS Markers for Genomic Studies in Wild Emmer Wheat 15
between the regulation of senescence and nutrient remobilization. This important discovery,
based on high-resolution mapping with CAPS markers, may contribute to a more efficient
breeding of cereal crops and may be translated into the development of food products with
enhanced nutritional value.
ADVANCEMENTS IN CAPS MAPPING OF DISEASE RESISTANCE
GENES DERIVED FROM WILD EMMER WHEAT
Average yield losses of 18% (Oerke, 2006) due to microbial diseases put a substantial
economic burden on wheat growers and consumers around the world. Many wheat diseases
are hard to control without the use of pesticides, resulting in risks to human health and
environmental pollution. Development of resistant cultivars is the most effective approach to
reduce these risks and to minimize yield losses due to diseases. The wild emmer wheat gene
pool provides a valuable source of natural resistance for the major diseases of wheat (Cheng
et al., 2010; Nevo et al., 2002; Peng et al., 1999; The et al., 1993). Among T. dicoccoides
populations in Israel and its vicinity, there are many genotypes that are highly resistant to
yellow rust (Cheng et al., 2010; Gerechter-Amitai and Van Silfhout, 1989; Nevo et al., 2002;
Peng et al., 1999; The et al., 1993), powdery mildew (Murphy et al., 2009), glume blotch
(Chu et al., 2008), leaf rust (Moseman et al., 1985; Nevo et al., 1986), and Fusarium
graminearum (Buerstmayr et al., 2003). CAPS markers are commonly used in wild emmer
genomic studies to achieve high-resolution mapping of resistance loci, via comparative
genomic analysis, as a basis for map-based cloning of these valuable genes. Furthermore,
genetic mapping of the resistance loci derived from T. dicoccoides by CAPS can facilitate
their introgression into elite breeding materials via marker-assisted selection.
POSITIONAL CLONING OF THE SLOW-RUSTING STRIPE RUST
RESISTANCE GENE, YR36, DERIVED FROM WILD EMMER WHEAT
Map-based cloning of the high-temperature adult-plant (HTAP) stripe rust resistance
gene, Yr36, derived from T. dicoccoides accession FA15-3 from Israel (Avivi, 1978; Uauy et
al., 2005) was accomplished by means of CAPS markers developed based on a comparative
genomic analysis of wheat-rice microcolinearity (Fu et al., 2009). HTAP resistance is
conferred by a particular class of adult-plant resistance genes that is effective after stem
elongation and when average night temperatures remain above 10°C and day temperatures are
between 25°C and 30°C (Line and Chen, 1995; Milus and Line, 1986a; Milus and Line,
1986b; Qayoum and Line, 1985). HTAP genes are non-race-specific resistance genes, which
are expressed at later stages of plant development, provide a broader range of resistance to
pathogens, and tend to be more durable than race-specific seedling resistance genes (Line and
Chen, 1995).

Dina Raats, Elitsur Yaniv, Assaf Distelfeld et al. 16
High-resolution map of the Yr36 gene region was developed using a large F2 mapping
population (4500 F2 plants) obtained by crossing the susceptible T. durum cv Langdon (LDN)
with the resistant isogenic recombinant substitution line RSL65. This line, carries a 6BS
chromosome segment introgressed from T. dicoccoides, which harbors Yr36 in the LDN
genetic background (Uauy et al., 2005). On the basis of gene-related sequences obtained from
the rice colinear region (Distelfeld et al., 2004), eight CAPS markers (Table 3) were
developed to construct a high-density map of Yr36, in which Yr36 was mapped to 0.14 cM
interval delimited by CAPS markers Xucw113 and Xucw111 (Table 3; Fu et al., 2009).
Screening of a RSL65-specific BAC library, which carries Yr36 in an LDN genetic
background (Cenci et al., 2003), with the distal CAPS marker Xucw113 yielded six BAC
clones. BESs were used to screen the library and extend the contig by chromosome walking.
Two BAC clones were sequenced and a contiguous 314-kb sequence, including the flanking
co-dominant markers CAPS Xucw113 and sequence-tagged-site (STS) Xucw127 (LDN: 110-
bp and RSL65: 105-bp), was obtained. Using this sequence, new dominant markers present
only in RSL65 were developed, and the Yr36 resistance gene was mapped between Xucw129
and Xucw148 (0.02 cM; Fu et al., 2009). The complete 186-kb Yr36 region flanked by
markers Xucw129 and Xucw148 was absent in LDN.
PCR-based allele-specific markers can be used in breeding programs to accelerate the
deployment of Yr36 in commercial bread wheat varieties. Although the RSL65 specific
dominant markers, Xucw129 and Xucw148, are useful for selecting progenies that carry Yr36,
they are not appropriate for differentiating between progenies that are heterozygous for Yr36
from the homozygous ones. This differentiation is critical for selecting plants homozygous for
Yr36 in F2 segregating populations or after self-pollination of the heterozygous progenies
from the previous cycle of a backcrossing program. Therefore, CAPS, dCAPS, and STS
markers developed in the course of the Yr36 cloning (Table 3) are useful for selecting
progenies that are homozygous for Yr36 and thus expected to facilitate the introgression of
Yr36 into new bread wheat varieties.
A pair of genes duplicated in tandem, designated Wheat Kinase START 1 and 2 (WKS1
and WKS2), was identified by sequence annotation and was subjected to further analysis.
Functional analysis by EMS mutagenesis using the TILLING (targeting induced local lesion
in genome) approach (McCallum et al., 2000) suggested that WKS1 corresponds to Yr36 (Fu
et al., 2009). Functional analysis of several independent TILLING mutants demonstrated that
both the kinase and the START domains are necessary for the resistance response. The
identity between WKS1 and Yr36 was also validated by genetic transformation of WKS1 into a
susceptible wheat variety. WKS1 alone was proven to be sufficient to improve resistance of
susceptible wheat varieties. WKS1 was detected in only ~24% of the wild emmer wheat
accessions tested by Fu et al.. (2009) and was not detected in any of the tested bread or pasta
wheat varieties. These findings suggest that WKS1 was not incorporated into the initial
domesticated forms. Since this gene is absent from almost all modern commercial varieties
(except for lines that already contain 6B introgression from T. dicoccoides), the introgression
of Yr36 into elite cultivated germplasm could have a broad impact in improving the resistance
to stripe rust (Fu et al., 2009).
Application of CAPS Markers for Genomic Studies in Wild Emmer Wheat 17
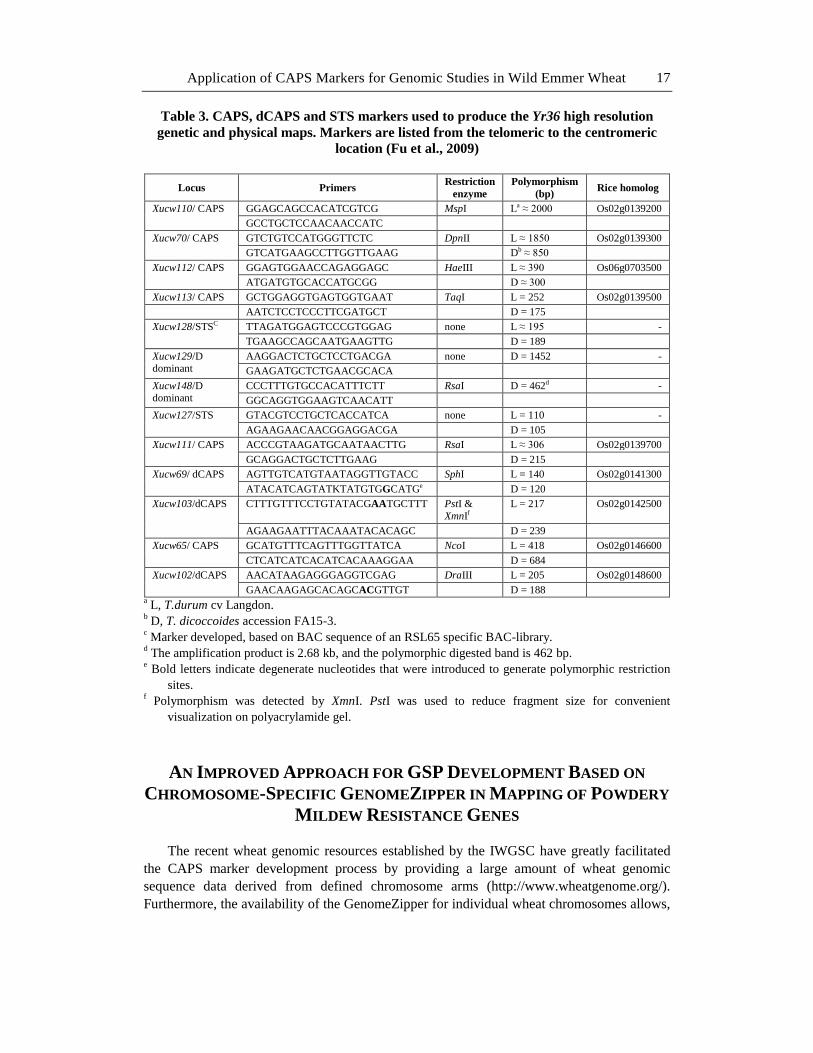
Table 3. CAPS, dCAPS and STS markers used to produce the Yr36 high resolution
genetic and physical maps. Markers are listed from the telomeric to the centromeric
location (Fu et al., 2009)
Locus Primers Restriction
enzyme
Polymorphism
(bp) Rice homolog
Xucw110/ CAPS GGAGCAGCCACATCGTCG MspI La ≈ 2000 Os02g0139200
GCCTGCTCCAACAACCATC
Xucw70/ CAPS GTCTGTCCATGGGTTCTC DpnII L ≈ 1850 Os02g0139300
GTCATGAAGCCTTGGTTGAAG Db ≈ 850
Xucw112/ CAPS GGAGTGGAACCAGAGGAGC HaeIII L ≈ 390 Os06g0703500
ATGATGTGCACCATGCGG D ≈ 300
Xucw113/ CAPS GCTGGAGGTGAGTGGTGAAT TaqI L = 252 Os02g0139500
AATCTCCTCCCTTCGATGCT D = 175
Xucw128/STSC TTAGATGGAGTCCCGTGGAG none L ≈ 195 -
TGAAGCCAGCAATGAAGTTG D = 189
Xucw129/D dominant
AAGGACTCTGCTCCTGACGA none D = 1452 -
GAAGATGCTCTGAACGCACA
Xucw148/D dominant
CCCTTTGTGCCACATTTCTT RsaI D = 462d -
GGCAGGTGGAAGTCAACATT
Xucw127/STS GTACGTCCTGCTCACCATCA none L = 110 -
AGAAGAACAACGGAGGACGA D = 105
Xucw111/ CAPS ACCCGTAAGATGCAATAACTTG RsaI L ≈ 306 Os02g0139700
GCAGGACTGCTCTTGAAG D = 215
Xucw69/ dCAPS AGTTGTCATGTAATAGGTTGTACC SphI L = 140 Os02g0141300
ATACATCAGTATKTATGTGGCATGe D = 120
Xucw103/dCAPS CTTTGTTTCCTGTATACGAATGCTTT PstI &
XmnIf
L = 217 Os02g0142500
AGAAGAATTTACAAATACACAGC D = 239
Xucw65/ CAPS GCATGTTTCAGTTTGGTTATCA NcoI L = 418 Os02g0146600
CTCATCATCACATCACAAAGGAA D = 684
Xucw102/dCAPS
AACATAAGAGGGAGGTCGAG DraIII L = 205 Os02g0148600
GAACAAGAGCACAGCACGTTGT D = 188 a L, T.durum cv Langdon.
b D, T. dicoccoides accession FA15-3.
c Marker developed, based on BAC sequence of an RSL65 specific BAC-library.
d The amplification product is 2.68 kb, and the polymorphic digested band is 462 bp.
e Bold letters indicate degenerate nucleotides that were introduced to generate polymorphic restriction
sites. f Polymorphism was detected by XmnI. PstI was used to reduce fragment size for convenient
visualization on polyacrylamide gel.
AN IMPROVED APPROACH FOR GSP DEVELOPMENT BASED ON
CHROMOSOME-SPECIFIC GENOMEZIPPER IN MAPPING OF POWDERY
MILDEW RESISTANCE GENES
The recent wheat genomic resources established by the IWGSC have greatly facilitated
the CAPS marker development process by providing a large amount of wheat genomic
sequence data derived from defined chromosome arms (http://www.wheatgenome.org/).
Furthermore, the availability of the GenomeZipper for individual wheat chromosomes allows,
Dina Raats, Elitsur Yaniv, Assaf Distelfeld et al. 18
in most cases, the identification of genic sequences belonging to specific chromosome
intervals based on their order along the GenomeZipper. Moreover, comparisons of
homoeoalleles from the A and B genomes allow identification of IHP and development of
GSP bioinformatically, thus modifying and simplifying the process of GSP identification
during CAPS marker development for wheat. The efficiency of the improved approach of
GSP identification can be demonstrated by the recent advancements in the mapping of
powdery mildew (Pm) resistance genes derived from wild emmer wheat.
Two novel Pm resistance genes, temporarily designated PmG16 and PmG3M, derived
from wild emmer wheat accessions G18-16 and G-305-3M, were recently identified and
assigned to chromosomes 7AL and 6BL, respectively, in mapping populations derived from
crosses of the resistant T. dicoccoides accessions with the susceptible T. durum cv Langdon
(LDN; Ben-David et al., 2010; Xie et al., 2012). Chromosomal assignment and construction
of the primary genetic maps for these two genes were conducted by the screening of publicly
available molecular markers, including markers derived from the whole genome genetic maps
of wild emmer wheat developed by our group (e.g. Peleg et al., 2008b; Peng et al., 2000).
These marker resources included: SSR, EST-SSR, STS, inter-simple sequence repeat (ISSR),
sequence-tagged microsatellite (STM), resistance gene analog (RGA), target region
amplification polymorphism (TRAP), and diversity array technology (DArT) markers (Ben-
David et al., 2010; Xie et al., 2012). Due to the relatively low polymorphism between the two
T. turgidum species and lack of linkage to the locus of interest, this laborious approach
resulted in the mapping of a very small proportion of the screened markers. For example, the
screening of 225 SSRs mapped to the A and B genomes of wheat (Ganal and Röder, 2007;
Röder et al., 1998) did not yield polymorphic markers linked to PmG3M locus, while the
screening of 320 RGA primer pair combinations (Xie et al., 2012) detected only seven (2.1%)
polymorphic markers that were linked to the target gene. A similar rate of polymorphism and
linkage (1.7%, 5 out 288) was obtained by the screening of TRAP markers (Liu et al., 2005).
It should be noted that each RGA and/or TRAP primer combination amplifies a profile of 20-
50 PCR bands each, of which only one band is eventually converted into a dominant marker.
Therefore, the real rate of success in detecting polymorphism using these methods is 20-50
times lower. After localization of Pm genes on wheat chromosomes, additional markers
mapped to these chromosomes were screened for polymorphism and linkage. Five SSR
markers derived from three 6BL SSR maps (Röder et al., 1998; Somers et al., 2004; Sourdille
et al., 2004) and one EST-SSR (Mullan et al., 2005) were mapped to the PmG3M region.
Eight of the 46 markers (17%) mapped to chromosome 7AL of wild emmer wheat by Peleg et
al., (2008b) were found to be closely linked to the PmG16 locus (Ben-David et al., 2010).
One CAPS marker was developed and mapped to the PmG16 region. As a consequence of the
described mapping efforts, the PmG16 locus was mapped to a 3.6 cM interval on the distal
part of 7AL, while the size of the chromosomal interval that contains PmG3M on the distal
part of chromosome 6BL ranged from 9.2 to 22.3 cM on various genetic maps developed
using different mapping populations (Ben-David et al., 2010; Xie et al., 2012). Further efforts
aimed at constructing a high-resolution map of the PmG3M gene are focused mainly on the
development of CAPS markers by a comparative genomics approach. In total, 176 wheat
ESTs physically mapped to chromosome 6BL (http://wheat.pw.usda.gov/wEST/ binmaps/)
were compared by individual BLAST searches to rice chromosome 2 (Os2) and
Brachypodium chromosome 3 (Bd3). Nine of these ESTs were successfully converted into
Application of CAPS Markers for Genomic Studies in Wild Emmer Wheat 19
genetic markers, including three STS and six CAPS markers that were mapped to the PmG3M
gene region (Ben David, 2011).
Further saturation of the PmG3M genetic map was performed by an improved method for
CAPS marker development based on the currently available group 6 GenomeZipper and the
6BL survey sequences (http://wheat-urgi.versailles.inra.fr/Seq-Repository). EST-derived
markers spanning a 6.5 cM interval, which harbors PmG3M, were used as anchors to the
corresponding region on 6BL GenomeZipper delimiting a 1.06 Mb segment (scaled according
to Bd3) containing 58 wheat SSCs (http://www.wheatgenome.org/). In order to minimize
mapping efforts, the 1.06 Mb GenomeZipper interval was divided into several fragments, and
nine SSCs from each fragment were chosen for CAPS marker development. The
homoeologues SSCs were obtained for the A and B genomes from the 6AL and 6BL survey
sequences. In total, 32 conserved GSP sets were designed, based on the sequence
polymorphisms identified between the A and B genomes, using the procedure demonstrated
in Figure 3. Screening of nulli-tetrasomic lines and sorted 6BL and 6AL chromosomes
revealed that 34% (11 of 32) of the primers developed by this approach were specific to the B
genome, 50% (16 of 32) amplified the same fragment from both the A and B genomes, while
five of them yielded no amplification products (Bocharova et al., unpublished). These GSPs
are now being used to develop CAPS markers according to the procedure described in Figure
4. The fragments amplified from genomic DNA of the two parental lines will be sequenced,
and SNP-generating restriction sites will be identified. Digestion of the amplified products
will be used to map these loci, by graphical genotyping, in a mapping population of
recombinant inbred lines (RIL) from the cross of a resistant T. dicoccoides with a susceptible
T. durum line. The first CAPS marker mapped using this approach reduced the chromosomal
interval that contains PmG3M from 6.5 cM to 5.5 cM (Bocharova et al., unpublished). The
mapping of additional CAPS markers is underway to delimit the PmG3M to a smaller
chromosomal interval, providing a solid foundation for positional cloning of the target Pm
gene.
UTILIZATION OF 1BS PHYSICAL MAP FOR CAPS MARKER
DEVELOPMENT TO TARGET STRIPE RUST RESISTANCE GENES
DERIVED FROM T. DICOCCOIDES
CAPS marker development using colinearity was found to be highly efficient in the
mapping of two novel stripe rust resistance genes, Yr15 and YrH52, derived from
chromosome 1BS of wild emmer wheat. High-resolution and physical mapping of these genes
significantly benefit from the availability of a complete physical map of chromosome 1BS of
bread wheat constructed by our group within the framework of the European consortium
TriticeaeGenome (Raats et al., 2013).
Yr15 and YrH52 were assigned to chromosome 1BS, and primary genetic maps of these
genes were constructed with the aid of marker systems including amplified fragment length
polymorphism (AFLP), random amplified polymorphic DNA (RAPD), and SSRs (Peng et al.,
1999; Peng et al., 2000; Sun et al., 1997). Mapping of nucleolar organizing region (Nor)1 as
an RFLP probe allowed physical allocation of Yr15 and YrH52 to the deletion bin map of
chromosome 1BS. Fifteen wheat ESTs mapped to a specific deletion bin

Dina Raats, Elitsur Yaniv, Assaf Distelfeld et al. 20
(http://wheat.pw.usda.gov/wEST/binmaps/) provided a source for the development of four
new CAPS markers. Mapping of these markers in large (>4000) F2 populations segregating
for these genes has lead to a significant reduction of the genetic intervals spanning Yr15 and
YrH52 genes from 25.9 and 39.6 cM respectively to 5.8 and 3.0 cM. Three of these EST-
based CAPS markers were used as anchors to the orthologous region on rice chromosome
Os5. Homologue searches with sequences of rice BACs covering this orthologous found more
than 20 wheat ESTs, which were used to develop additional CAPS markers (Yaniv et al.,
unpublished). The syntenic regions on rice chromosome 5 (Os5), Brachypodium chromosome
2 (Bd2), sorghum chromosome 9 (Sb9), and the wheat chromosome 1BS region containing
the two Yr genes were identified using the GenomeZipper (Mayer et al., 2009; Mayer et al.,
2011). Orthologous regions of 824 kb in rice, 876 kb in Brachypodium and 889 kb in
sorghum were delimited by the closest flanking markers. Wheat ESTs matching orthologous
rice, Brachypodium and sorghum genes were used to develop and map six additional CAPS
markers, resulting in a dramatic reduction of the chromosomal intervals spanning the Yr genes
to 0.2 cM and 1.1 respectively for Yr15 and YrH52 (Yaniv et al., unpublished, Raats et al.,
unpublished).
The construction of the BAC-contig-based physical map for chromosome 1BS of bread
wheat, T. aestivum cv. Chinese Spring (Raats et al., 2013), together with the availability of
727 Mb generated by Roche 454 sequence platform (Wicker et al., 2011) and 207 Mb of
survey sequences (http://www.wheatgenome.org/), of 1BS reinforced the fine-mapping
efforts of the Yr genes derived from T. dicoccoides. The assembly of the 1BS physical map by
the linear topology contig (LTC) program (Frenkel et al., 2010) resulted in 57 very long BAC
scaffolds covering 77.4% of 1BS. In total, 2,133 gene-derived markers were integrated into
the 1BS physical map by direct molecular (PCR and microarray) or in silico analyses (Raats
et al., 2013). Screening of the 1BS BAC library with CAPS markers obtained from high
resolution genetic maps of the two Yr genes revealed long scaffolds (8.4 Mb and 14.3 Mb)
covering the corresponding Yr gene regions. Assignment of Yr genes to 1BS BAC scaffolds
provides immediate access to a great amount of wheat genomic sequences and markers with
known chromosomal positions, including BES, wheat sequence contigs, wheat unigenes and
PCR-based markers.
Annotation of wheat genomic sequence contigs mapped to this region by comparisons
(BLAST) against the gene set from Brachypodium and wheat ESTs led to precise predictions
of conserved genic regions and thus to the accurate construction of primers and rapid
development of additional CAPS markers, reducing the interval containing the Yr15 gene to
less than 1 Mb (Yaniv et al., unpublished). The sequencing of these clones generated 0.8 Mb
of sequence data that were exploited for the development of additional CAPS markers (Yaniv
et al., unpublished). The availability of wheat genomic sequences allows the utilization of the
abundant repetitive sequence fraction in this specific genome region for CAPS marker
development. The potential of the repetitive fraction of genomic sequences for developing
genome-specific molecular markers, based on particular insertion site-based polymorphisms
(ISBPs), was demonstrated by Paux et al. (2006, 2010). The mining of 0.8 Mb 1BS
chromosome genomic sequences by IsbpFinder (Paux et al., 2010) resulted in the
identification of many ISBP primer sets; two of them were used to develop genome B-
specific CAPS markers. The Yr15 gene was mapped to the 0.15 cM region including four
markers that co-segregat with the gene. The screening of T. dicoccoides accession-specific
Application of CAPS Markers for Genomic Studies in Wild Emmer Wheat 21
BAC libraries with CAPS markers derived from high-resolution physical map of Yr15 and
YrH52 gene regions on chromosome 1BS of CS has a potential to directly land on the target
site, skipping the laborious chromosome walking stage.
CONCLUSION
Wild emmer is considered to be the progenitor of cultivated bread and durum wheats,
and, as such, its gene pool is an excellent source for their improvement. The dissected
environments of the Fertile Crescent represent wide ecological amplitude that harbor a broad
phenotypic and genetic diversity of wild emmer populations which can provide great value to
wheat breeding for many traits, ranging from growth habit to disease resistance. However,
identification and isolation of the genes responsible for a trait of interest in wild emmer and
other species in the genus as a whole is challenging because of the combined complexities of
polyploidy and large genomes.
In this chapter, we have described the utilization of CAPS markers for high resolution
mapping and positional cloning of economically important genes derived from wild emmer.
The feasibility of the CAPS/dCAPS marker method for in silico chromosome walking, based
on wheat-rice synteny, was demonstrated in the positional cloning of the GpcB1 and Yr36
genes (Uauy et al.. 2006; Fu et al.. 2009), and in high resolution and physical mapping of Yr
and Pm resistance genes derived from wild emmer wheat. CAPS markers are highly useful
tools in overcoming the difficulties of fine-mapping and positional cloning in Triticum. The
general approach for fine mapping is to begin with two markers, perhaps 3 to 5 cM to either
side of the gene of interest for the screening of large populations, and then to proceed with the
addition of markers derived from EST- or gene-derived markers. For the development of
additional CAPS markers in a region, generally a long PCR product, up to 2 kb and including
intronic sequences, is best because it maximizes the likelihood of revealing polymorphism.
Development of locus and homoeologue-specific primers often requires the screening of
several primer sets. The use of genome-specific chromosome preparations is highly useful for
testing primer discrimination.
Of the two main challenges in developing sufficient CAPS markers for polyploid
Triticum, one is to avoid cross-amplification in the PCR of targets in paralogs from the same
genome and from homologs and paralogs in the homoeologous chromosomes of the other
genome(s). This problem can only be overcome by sequence comparisons of homoeologous
chromosomes and screening of sufficient primer pairs and target regions. The other main
challenge is to develop sufficient markers to achieve the density required for positional
cloning. The availability of annotated whole-genome sequences from species with largely
collinear gene order on syntenic chromosomes, including Brachypodium, rice and sorghum,
has greatly increased the efficiency of developing candidates for CAPS markers in Triticum.
Moreover, the emergence of physical and genetic maps linked to deep EST resources, such as
for barley, has benefited CAPS development in Triticum. The current genome projects in
Triticum will ultimately provide the best basis for efficient marker saturation for positional
cloning.
Although high-throughput development and genotyping of SNP markers has progressed
to a significant degree in wheat, resulting in the development of DNA chips enabling the
Dina Raats, Elitsur Yaniv, Assaf Distelfeld et al. 22
construction of genetic maps carrying several hundred markers (Feuillet et al., 2012;
http://wheat.pw.usda.gov/GG2/index.shtml), CAPS markers remain the method of choice in
gene mapping projects. One of the main advantages of the CAPS/dCAPS method is that it can
potentially utilize any sequence polymorphism in the development of PCR-based markers. In
addition, the CAPS/dCAPS marker approach is relatively inexpensive and easy to score. The
CAPS/dCAPS method does not require special techniques or equipment, thus fulfilling the
needs of gene mapping projects that rely on screening relatively of few lines or cultivars with
a limited number of markers. For alleles carrying multiple polymorphisms with respect to a
polyploid introgression host, CAPS markers can be more reliable than SSRs and SNP assays
on high-throughput platforms.
CAPS markers can serve, due to their co-dominant nature, to investigate whether a
sample contains a mixture of different cultivars, to determine the allelic state at the locus of
interest in germplasm collections, and as markers in backcross breeding projects. The
potential disadvantage of dominant markers is frequently the confusion in distinguishing
between a non-specific negative reaction and a failed or faint reaction in various experimental
or laboratory conditions. In contrast, specific differences between individuals can clearly be
detected with a co-dominant CAPS marker system. Given the high level of accuracy observed
in germplasm screening (Helguera et al., 2000; Okoń et al., 2012) and gene introgression
(Chen et al., 2003; Helguera et al., 2005; Mago et al., 2011; Seyfarth et al., 1999), CAPS
markers provide breeders with an easy to score selection tool for economically important
genes of wheat.
In summary, although the development and genotyping of high-throughput markers has
progressed significantly in wheat, CAPS markers remain the method of choice for fine
genetic dissection and positional cloning of genes derived from T. dicoccoides and other
species in the genus because they provide a simple way to analyze complex genomes.
ACKNOWLEDGEMENTS
The authors wish to thank the International Wheat Genome Sequencing Consortium for
generating the wheat chromosome survey sequences and making them available to us for
analysis. This work was supported by the European Community’s Seventh Framework
Programme TriticeaeGenome (grant number FP7-212019), the Israel Science Foundation
(ISF) grant 205/08 and the Binational Agricultural Research and Development Fund (BARD)
grant IS-4628-13. Dina Raats is grateful for the Eshkol Fellowship awarded by the Israeli
Ministry of Science.
REFERENCES
Aaronsohn, A. (1910). Agricultural and botanical explorations in Palestine. Bulletin of Plant
Industry, 180, 1-63.
Akhunov, E., Akhunova, A., Linkiewicz, A. M., Dubcovsky, J., Hummel, D., Lazo, G., Chao,
S., Anderson, O. D., David, J. & Qi, L. (2003). Synteny perturbations between wheat
homoeologous chromosomes caused by locus duplications and deletions correlate with
recombination rates. Proceedings of the National Academy of Sciences of the USA, 100,
10836-10841.

Application of CAPS Markers for Genomic Studies in Wild Emmer Wheat 23
Akhunov, E., Akhunova, A., Anderson, O., Anderson, J., Blake, N., Clegg, M., Coleman-
Derr, D., Conley, E., Crossman, C. & Deal, K. (2010). Nucleotide diversity maps reveal
variation in diversity among wheat genomes and chromosomes. BMC Genomics, 11, 702.
Altschul, S. F., Gish, W., Miller, W., Myers, E. W. & Lipman, D. J. (1990). Basic local
alignment search tool. Journal of Molecular Biology, 215, 403-410.
Avivi, L. (1978). High grain protein content in wild tetraploid wheat Triticum dicoccoides
Korn. Proceedings of the 5th International Wheat Genetic Symposium, New Delhi,
372-380.
Barker, G. L. & Edwards, K. J. (2009). A genome-wide analysis of single nucleotide
polymorphism diversity in the world's major cereal crops. Plant Biotechnology Journal,
7, 318-325.
Ben-David, R. (2011). Molecular mapping of powdery mildew resistance genes derived from
the Triticum turgidum gene pool. PhD Thesis, University of Haifa, Haifa, Israel.
Ben-David, R., Xie, W., Peleg, Z., Saranga, Y., Dinoor, A. & Fahima, T. (2010).
Identification and mapping of PmG16, a powdery mildew resistance gene derived from
wild emmer wheat. Theoretical and Applied Genetics, 121, 499-510.
Bennett, M. D. & Smith, J. (1976). Nuclear DNA amounts in angiosperms. Philosophical
Transactions of the Royal Society of London. Biological Sciences, 274, 227-274.
Blake, N., Sherman, J., Dvorak, J. & Talbert, L. (2004). Genome-specific primer sets for
starch biosynthesis genes in wheat. Theoretical and Applied Genetics, 109, 1295-1302.
Bonfil, D. J. & Kafkafi, U. (2000). Wild wheat adaptation in different soil ecosystems as
expressed in the mineral concentration of the seeds. Euphytica, 114, 123-134.
Bossolini, E., Wicker, T., Knobel, P. A. & Keller, B. (2007). Comparison of orthologous loci
from small grass genomes Brachypodium and rice: implications for wheat genomics and
grass genome annotation. The Plant Journal, 49, 704-717.
Brenchley, R., Spannagl, M., Pfeifer, M., Barker, G. L. A., D’Amore, R., Allen, A. M.,
McKenzie, N., Kramer, M., Kerhornou, A. & Bolser, D. (2012). Analysis of the bread
wheat genome using whole-genome shotgun sequencing. Nature, 491, 705-710.
Buckler, E. S., Thornsberry, J. M. & Kresovich, S. (2001). Molecular diversity, structure and
domestication of grasses. Genetical Research, 77, 213-218.
Buerstmayr, H., Stierschneider, M., Steiner, B., Lemmens, M., Griesser, M., Nevo, E. &
Fahima, T. (2003). Variation for resistance to head blight caused by Fusarium
graminearum in wild emmer (Triticum dicoccoides) originating from Israel. Euphytica,
130, 17-23.
Cenci, A., Chantret, N., Kong, X., Gu, Y., Anderson, O. D., Fahima, T., Distelfeld, A. &
Dubcovsky, J. (2003). Construction and characterization of a half million clone BAC
library of durum wheat (Triticum turgidum ssp. durum). Theoretical and Applied
Genetics, 107, 931-939.
Chen, X., Soria, M. A., Yan, G., Sun, J. & Dubcovsky, J. (2003). Development of sequence
tagged site and cleaved amplified polymorphic sequence markers for wheat stripe rust
resistance gene. Crop Science, 43, 2058-2064.
Cheng, J., Yan, J., Sela, H., Manisterski, J., Lewinsohn, D., Nevo, E. & Fahima, T. (2010).
Pathogen race determines the type of resistance response in the stripe rust – Triticum
dicoccoides pathosystem. Physiologia Plantarum, 139, 269-279.

Dina Raats, Elitsur Yaniv, Assaf Distelfeld et al. 24
Chu, C., Xu, S., Faris, J., Nevo, E. & Friesen, T. (2008). Seedling resistance to tan spot and
Stagonospora nodorum leaf blotch in wild emmer wheat (Triticum dicoccoides). Plant
Disease, 92, 1229-1236.
Distelfeld, A., Uauy, C., Olmos, S., Schlatter, A. R., Dubcovsky, J. & Fahima, T. (2004).
Microcolinearity between a 2-cM region encompassing the grain protein content locus
Gpc-6B1 on wheat chromosome 6B and a 350-kb region on rice chromosome 2.
Functional and Integrative Genomics, 4, 59-66.
Distelfeld, A., Uauy, C., Fahima, T. & Dubcovsky, J. (2006). Physical map of the wheat high-
grain protein content gene Gpc-B1 and development of a high-throughput molecular
marker. New Phytologist, 169, 753-763.
Dohlman, E. & Hoffman, L. (2000). The new agricultural trade negotiations: background and
issues for the US wheat sector. Wheat Situation and Outlook Yearbook, WHS-2000, 35-
46.
Dolezel, J., Vrana, J., Safar, J., Bartos, J., Kubalakova, M. & Simkova, H. (2012).
Chromosomes in the flow to simplify genome analysis. Functional and Integrative
Genomics, 12, 397-416.
Dubcovsky, J., Ramakrishna, W., SanMiguel, P. J., Busso, C. S., Yan, L., Shiloff, B. A. &
Bennetzen, J. L. (2001). Comparative sequence analysis of colinear barley and rice
bacterial artificial chromosomes. Plant Physiology, 125, 1342-1353.
Dvorak, J., Terlizzi, P., Zhang, H. & Resta, P. (1993). The evolution of polyploid wheats:
identification of the A genome donor species. Genome, 36, 21-31.
Dvorak, J. & Akhunov, E. (2005). Tempos of gene locus deletions and duplications and their
relationship to recombination rate during diploid and polyploid evolution in the Aegilops-
Triticum alliance. Genetics, 171, 323-332.
Dvorak, J., Akhunov, E., Akhunov, A., Deal, K. R. & Luo, M. (2006). Molecular
characterization of a diagnostic DNA marker for domesticated tetraploid wheat provides
evidence for gene flow from wild tetraploid wheat to hexaploid wheat. Molecular
Biology and Evolution, 23, 1386-1396.
Endo, T. R. & Gill, B. S. (1996). The deletion stocks of common wheat. Journal of Heredity,
87, 295-307.
Fahima, T., Roder, M. S., Grama, A. & Nevo, E. (1998). Microsatellite DNA polymorphism
divergence in Triticum dicoccoides accessions highly resistant to yellow rust. Theoretical
and Applied Genetics, 96, 187-195.
Feldman, M. & Sears, E. R. (1981). The wild gene resources of wheat. Scientific American,
244, 102-112.
Feldman, M., Lupton, F. G. H., Miller, T. E. & Feldman, M. (1995). Wheats. In: Smartt J,
Simmonds NW (Eds). Evolution of Crops, Vol. 2, London: Longman Scientific, 184-192.
Feuillet, C., Penger, A., Gellner, K., Mast, A. & Keller, B. (2001). Molecular evolution of
receptor-like kinase genes in hexaploid wheat. Independent evolution of orthologs after
polyploidization and mechanisms of local rearrangements at paralogous loci. Plant
Physiology, 125, 1304-1313.
Feuillet, C. & Eversole, K. (2007). Physical mapping of the wheat genome: A coordinated
effort to lay the foundation for genome sequencing and develop tools for breeders. Israel
Journal of Plant Sciences, 55, 307-313.
Application of CAPS Markers for Genomic Studies in Wild Emmer Wheat 25
Feuillet, C., Stein, N., Rossini, L., Praud, S., Mayer, K., Schulman, A., Eversole, K. &
Appels, R. (2012). Integrating cereal genomics to support innovation in the Triticeae.
Functional and Integrative Genomics, 12, 573-583.
Frenkel, Z., Paux, E., Mester, D., Feuillet, C. & Korol, A. (2010). LTC: a novel algorithm to
improve the efficiency of contig assembly for physical mapping in complex genomes.
BMC Bioinformatics, 11, 584.
Fu, D., Uauy, C., Blechl, A., Epstein, L., Chen, X. M., Distelfeld, A., Sela, H., Fahima, T. &
Dubcovsky, J. (2009). A novel kinase-START gene confers temperature-dependent
resistance to wheat stripe rust. Science, 323, 1357-1360.
Ganal, M. W. & Röder, M. S. (2007). Microsatellite and SNP markers in wheat breeding. In:
Varshney R, Tuberosa R (Eds). Genomics-Assisted Crop Improvement, Vol. 2, Springer:
Dordrecht, Netherlands, 1-24.
Gerechter-Amitai, Z. K. & Stubbs, R. W. (1970). A valuable source of yellow rust resistance
in Israeli populations of wild emmer, Triticum dicoccoides Koern. Euphytica, 19, 12-21.
Gerechter-Amitai, Z. & Silfhout, C. H. (1984). Resistance to powdery mildew in wild emmer
(Triticum dicoccoides Körn.). Euphytica, 33, 273-280.
Gerechter-Amitai, Z. & Van Silfhout, C. (1989). Race-specificity of temperature-sensitive
genes for resistance to Puccinia striiformis in Triticum dicoccoides. Euphytica, 43, 7-14.
Goff, S. A., Ricke, D., Lan, T. H., Presting, G. & Wang, R. et al. (2002). A draft sequence of
the rice genome (Oryza sativa L. ssp. japonica). Science, 296, 92-100.
Grama, A., Gerechter-Amitai, Z. K. & Blum, A. (1983). Wild emmer as a donor of genes for
resistance to stripe rust and for high protein content. In: Sakamoto S (Ed). Proceedings of
the 6th International Wheat Genetics Symposium. Kyoto, Japan: Plant Germplasm
Institute, University of Kyoto, 187-192.
Haga, H., Yamada, R., Ohnishi, Y., Nakamura, Y. & Tanaka, T. (2002). Gene-based SNP
discovery as part of the Japanese Millennium Genome Project: identification of 190 562
genetic variations in the human genome. Journal of Human Genetics, 47, 0605-0610.
Harlan, J. R. & Zohary, D. (1966). Distribution of wild wheat and barley. Science, 153,
1074-1080.
Haudry, A., Cenci, A., Ravel, C., Bataillon, T., Brunel, D., Poncet, C., Hochu, I., Poirier, S.,
Santoni, S. & Glemin, S. (2007). Grinding up wheat: a massive loss of nucleotide
diversity since domestication. Molecular Biology and Evolution, 24, 1506-1517.
Helguera, M., Khan, I. & Dubcovsky, J. (2000). Development of PCR markers for the wheat
leaf rust resistance gene Lr47. Theoretical and Applied Genetics, 100, 1137-1143.
Helguera, M., Vanzetti, L., Soria, M., Khan, I., Kolmer, J. & Dubcovsky, J. (2005).
PCR markers for leaf rust resistance gene and their use to develop isogenic hard red
spring wheat lines. Crop Science, 45, 728-734.
Hollister, J. D. & Gaut, B. S. (2009). Epigenetic silencing of transposable elements: a trade-
off between reduced transposition and deleterious effects on neighboring gene
expression. Genome Research, 19, 1419-1428.
Huang, S., Sirikhachornkit, A., Su, X., Faris, J., Gill, B., Haselkorn, R. & Gornicki, P. (2002).
Genes encoding plastid acetyl-CoA carboxylase and 3-phosphoglycerate kinase of the
Triticum/Aegilops complex and the evolutionary history of polyploid wheat. Proceedings
of the National Academy of Sciences of the USA, 99, 8133-8138.
International Brachypodium Initiative. (2010). Genome sequencing and analysis of the model
grass Brachypodium distachyon. Nature, 463, 763-768.
Dina Raats, Elitsur Yaniv, Assaf Distelfeld et al. 26
International Rice Genome Sequencing Project. (2005). The map-based sequence of the rice
genome. Nature, 436, 793-800.
Joppa, L. & Williams, N. (1988). Langdon durum disomic substitution lines and aneuploid
analysis in tetraploid wheat. Genome, 30, 222-228.
Joppa, L. & Cantrell, R. (1990). Chromosomal location of genes for grain protein content of
wild tetraploid wheat. Crop Science, 30, 1059-1064.
Joppa, L., Du, C., Hart, G. E. & Hareland, G. A. (1997). Mapping gene(s) for grain protein in
tetraploid wheat (Triticum turgidum L.). using a population of recombinant inbred
chromosome lines. Crop Science, 37, 1586-1589.
Kato, K., Mori, Y., Beiles, A. & Nevo, E. (1997). Geographical variation in heading traits in
wild emmer wheat, Triticum dicoccoides. I. Variation in vernalization response and
ecological differentiation. Theoretical and Applied Genetics, 95, 546-552.
Komori, T. & Nitta, N. (2005). Utilization of the CAPS/dCAPS method to convert rice SNPs
into PCR-based markers. Breeding Science, 55, 93-98.
Krugman, T., Chagué, V., Peleg, Z., Balzergue, S., Just, J., Korol, A. B., Nevo, E., Saranga,
Y., Chalhoub, B. & Fahima, T. (2010). Multilevel regulation and signaling processes
associated with adaptation to terminal drought in wild emmer wheat. Functional and
Integrative Genomics, 10, 167-186.
Krugman, T., Peleg, Z., Quansah, L., Chagué, V., Korol, A. B., Nevo, E., Saranga, Y., Fait,
A., Chalhoub, B. & Fahima, T. (2011). Alteration in expression of hormone-related genes
in wild emmer wheat roots associated with drought adaptation mechanisms. Functional
and Integrative Genomics, 11, 565-583.
Levy, A. & Feldman, M. (1988). Ecogeographical distribution of HMW glutenin alleles in
populations of the wild tetraploid wheat Triticum turgidum var. dicoccoides. Theoretical
and Applied Genetics, 75, 651-658.
Line, R. F. & Chen, X. (1995). Successes in breeding for and managing durable resistance to
wheat rusts. Plant Disease, 79, 1254-1255.
Liu, Z., Anderson, J., Hu, J., Friesen, T., Rasmussen, J. & Faris, J. (2005). A wheat
intervarietal genetic linkage map based on microsatellite and target region amplified
polymorphism markers and its utility for detecting quantitative trait loci. Theoretical and
Applied Genetics, 111, 782-794.
Luo, M. C., Thomas, C., You, F. M., Hsiao, J., Ouyang, S., Buell, C. R., Malandro, M.,
McGuire, P. E., Anderson, O. D. & Dvorak, J. (2003). High-throughput fingerprinting of
bacterial artificial chromosomes using the snapshot labeling kit and sizing of restriction
fragments by capillary electrophoresis. Genomics, 82, 378-389.
Mago, R., Brown-Guedira, G., Dreisigacker, S., Breen, J., Jin, Y., Singh, R., Appels, R.,
Lagudah, E., Ellis, J. & Spielmeyer, W. (2011). An accurate DNA marker assay for stem
rust resistance gene Sr2 in wheat. Theoretical and Applied Genetics, 122, 735-744.
Mayer, K. F. X., Taudien, S., Martis, M., Simkova, H., Suchankova, P., Gundlach, H.,
Wicker, T., Petzold, A., Felder, M., Steuernagel, B., Scholz, U., Graner, A., Platzer, M.,
Dolezel, J. & Stein, N. (2009). Gene content and virtual gene order of barley
chromosome 1H. Plant Physiology, 151, 496-505.
Mayer, K. F. X., Martis, M., Hedley, P. E., Simkova, H., Liu, H., Morris, J. A., Steuernagel,
B., Taudien, S., Roessner, S. & Gundlach, H. (2011). Unlocking the barley genome by
chromosomal and comparative genomics. Plant Cell, 23, 1249-1263.
Application of CAPS Markers for Genomic Studies in Wild Emmer Wheat 27
McCallum, C. M., Comai, L., Greene, E. A. & Henikoff, S. (2000). Targeted screening for
induced mutations. Nature Biotechnology, 18, 455-457.
McFadden, E. S. & Sears, E. R. (1946). The origin of Triticum spelta and its free-threshing
hexaploid relatives. Journal of Heredity, 37, 81-89.
Michaels, S. D. & Amasino, R. M. (1998). A robust method for detecting single-nucleotide
changes as polymorphic markers by PCR. The Plant Journal, 14, 381-385.
Milus, E. & Line, R. (1986a). Gene action for inheritance of durable, high-temperature, adult-
plant resistance to stripe rust in wheat. Phytopathology, 76, 435-411.
Milus, E. & Line, R. (1986b). Number of genes controlling high-temperature, adult-plant
resistance to stripe rust in wheat. Phytopathology, 76, 93-96.
Morrell, P. L., Toleno, D. M., Lundy, K. E. & Clegg, M. T. (2006). Estimating the
contribution of mutation, recombination and gene conversion in the generation of
haplotypic diversity. Genetics, 173, 1705-1723.
Moseman, J. G., Nevo, E., Gerechter-Amitai, Z. K., El-Morshidy, M. A. & Zohary, D.
(1985). Resistance of Triticum dicoccoides collected in Israel to infection with Puccinia
recondita tritici. Crop Science, 25, 262-265.
Mullan, D. J., Platteter, A., Teakle, N. L., Appels, R., Colmer, T. D., Anderson, J. M. &
Francki, M. G. (2005). EST-derived SSR markers from defined regions of the wheat
genome to identify Lophopyrum elongatum specific loci. Genome, 48, 811-822.
Murphy, L. R., Santra, D., Kidwell, K., Yan, G., Chen, X. & Campbell, K. G. (2009).
Linkage maps of wheat stripe rust resistance genes and for use in marker-assisted
selection. Crop Science, 49, 1786-1786.
Nevo, E., Gerechter-Amitai, Z., Beiles, A. & Golenberg, E. M. (1986). Resistance of wild
wheat to stripe rust: Predictive method by ecology and allozyme genotypes. Plant
Systematics and Evolution, 153, 13-30.
Nevo, E., Korol, A. B., Beiles, A. & Fahima, T. (2002). Evolution of wild emmer and wheat
improvement: Population genetics, genetic resources, and genome organization of
wheat's progenitor, Triticum dicoccoides. Berlin, Germany: Springer-Verlag.
Oerke, E. C. (2006). Crop losses to pests. The Journal of Agricultural Science, 144, 31-43.
Okon, S., Kowalczyk, K. & Miazga, D. (2012). Identification of Ppd-B1 alleles in common
wheat cultivars by CAPS marker. Russian Journal of Genetics, 48, 532-537.
Olmos, S., Distelfeld, A., Chicaiza, O., Schlatter, A. R., Fahima, T., Echenique, V. &
Dubcovsky, J. (2003). Precise mapping of a locus affecting grain protein content in
durum wheat. Theoretical and Applied Genetics, 107, 1243-1251.
Paterson, A. H., Bowers, J. E., Bruggmann, R., Dubchak, I., Grimwood, J., Gundlach, H.,
Hellsten, U., Mitros, T. & Poliakov, A. (2009). The Sorghum bicolor genome and the
diversification of grasses. Nature, 457, 551-556.
Paux, E., Roger, D., Badaeva, E., Gay, G., Bernard, M., Sourdille, P. & Feuillet, C. (2006).
Characterizing the composition and evolution of homoeologous genomes in hexaploid
wheat through BAC- end sequencing on chromosome 3B. The Plant Journal, 48,
463-474.
Paux, E., Sourdille, P., Salse, J., Saintenac, C. & Choulet, F. et al. (2008). A physical map of
the 1-gigabase bread wheat chromosome 3B. Science, 322, 101-104.
Paux, E., Faure, S., Choulet, F., Roger, D., Gauthier, V., Martinant, J. P., Sourdille, P.,
Balfourier, F., Le, P. M. C., Chauveau, A., Cakir, M., Gandon, B. & Feuillet, C. (2010).
Dina Raats, Elitsur Yaniv, Assaf Distelfeld et al. 28
Insertion site-based polymorphism markers open new perspectives for genome saturation
and marker-assisted selection in wheat. The Plant Biotechnology Journal, 8, 196-210.
Peleg, Z., Fahima, T., Abbo, S., Krugman, T., Nevo, E., Yakir, D. & Saranga, Y. (2005).
Genetic diversity for drought resistance in wild emmer wheat and its ecogeographical
associations. Plant, Cell and Environment, 28, 176-191.
Peleg, Z., Saranga, Y., Yazici, A., Fahima, T., Ozturk, L. & Cakmak, I. (2008a). Grain zinc,
iron and protein concentrations and zinc-efficiency in wild emmer wheat under
contrasting irrigation regimes. Plant and Soil, 306, 57-67.
Peleg, Z., Fahima, T., Abbo, S., Krugman, T. & Saranga ,Y. (2008b). Genetic structure of
wild emmer wheat populations as reflected by transcribed versus anonymous SSR
markers. Genome, 51, 187-195.
Peleg, Z., Fahima, T., Krugman, T., Abbo, S., Yakir, D., Korol, A. B. & Saranga, Y. (2009).
Genomic dissection of drought resistance in durum wheat × wild emmer wheat
recombinant inbreed line population. Plant, Cell and Environment, 32, 758-779.
Peng, J., Korol, A. B., Fahima, T., Röder, M. S., Ronin, Y. I., Li, Y. C. & Nevo, E. (2000).
Molecular genetic maps in wild emmer wheat, Triticum dicoccoides: genome-wide
coverage, massive negative interference, and putative quasi-linkage. Genome Research,
10, 1509-1531.
Peng, J. H., Fahima, T., Röder, M. S., Li, Y. C., Dahan, A., Grama, A., Ronin, Y. I., Korol,
A. B. & Nevo, E. (1999). Microsatellite tagging of the stripe-rust resistance gene YrH52
derived from wild emmer wheat, Triticum dicoccoides, and suggestive negative crossover
interference on chromosome 1B. Theoretical and Applied Genetics, 98, 862-872.
Philippe, R., Choulet, F., Paux, E., van Oeveren, J., Tang, J., Wittenberg, A. H., Janssen, A.,
van Eijk, M. J., Stormo, K. & Alberti, A. (2012). Whole genome profiling provides a
robust framework for physical mapping and sequencing in the highly complex and
repetitive wheat genome. BMC Genomics, 13, 47.
Qayoum, A. & Line, R. (1985). High-temperature, adult-plant resistance to stripe rust of
wheat. Phytopathology, 75, 1121-1125.
Qi, L., Echalier, B., Chao, S., Lazo, G., Butler, G., Anderson, O., Akhunov, E., Dvorak, J.,
Linkiewicz, A. & Ratnasiri, A. (2004). A chromosome bin map of 16,000 expressed
sequence tag loci and distribution of genes among the three genomes of polyploid wheat.
Genetics, 168, 701-712.
Raats, D., Frenkel, Z., Krugman, T., Dodek, I., Sela, H., et al. (2013). The physical map of
wheat chromosome 1BS provides insights into its gene space organization and evolution.
Genome Biology, 14, R138. DOI: 10.1186/gb-2013-14-12-r138.
Ramakrishna, W., Dubcovsky, J., Park, Y., Busso, C., Emberton, J., SanMiguel, P. &
Bennetzen, J. L. (2002). Different types and rates of genome evolution detected by
comparative sequence analysis of orthologous segments from four cereal genomes.
Genetics, 162, 1389-1400.
Röder, M. S., Korzun, V., Wendehake, K., Plaschke, J., Tixier, M. H., Leroy, P. & Ganal, M.
W. (1998). A microsatellite map of wheat. Genetics, 149, 2007-2023.
Rudd, S. (2003). Expressed sequence tags: alternative or complement to whole genome
sequences? Trends in Plant Science, 8, 321-329.
Safar, J., Bartos, J., Janda, J., Bellec, A., Kubalakova, M., Valarik, M., Pateyron, S.,
Weiserova, J., Tuskova, R. & Cihalikova, J. (2004). Dissecting large and complex
Application of CAPS Markers for Genomic Studies in Wild Emmer Wheat 29
genomes: flow sorting and BAC cloning of individual chromosomes from bread wheat.
The Plant Journal, 39, 960-968.
Safar, J., Simkova, H., Kubalakova, M., Cihalikova, J., Suchankova, P., Bartos, J. & Dolezel,
J. (2010). Development of chromosome-specific BAC resources for genomics of bread
wheat. Cytogenetics and Genome Research, 129, 211-223.
Seyfarth, R., Feuillet, C., Schachermayr, G., Winzeler, M. & Keller, B. (1999). Development
of a molecular marker for the adult plant leaf rust resistance gene Lr35 in wheat.
Theoretical and Applied Genetics, 99, 554-560.
Somers, D. J., Isaac, P. & Edwards, K. (2004). A high-density microsatellite consensus map
for bread wheat (Triticum aestivum L.). Theoretical and Applied Genetics, 109,
1105-1114.
Sourdille, P., Singh, S., Cadalen, T., Brown-Guedira, G., Gay, G., Qi, L., Qi, L. L., Dufour,
P., Murigneux, A. & Bernard, M. (2004). Microsatellite-based deletion bin system for the
establishment of genetic-physical map relationships in wheat (Triticum aestivum L.).
Functional and Integrative Genomics, 4, 12-25.
Sun, G. L., Fahima, T., Korol, A. B., Turpeinen, T., Grama, A., Ronin, Y. I. & Nevo, E.
(1997). Identification of molecular markers linked to the Yr15 stripe rust resistance gene
of wheat originated in wild emmer wheat, Triticum dicoccoides. Theoretical and Applied
Genetics, 95, 622-628.
Tajima, F. (1983). Evolutionary relationship of DNA sequences in finite populations.
Genetics, 105, 437-460.
Tang, H., Bowers, J. E., Wang, X., Ming, R., Alam, M. & Paterson, A. H. (2008). Synteny
and collinearity in plant genomes. Science, 320, 486-488.
Tanksley, S. D. & McCouch, S. R. (1997). Seed banks and molecular maps: unlocking
genetic potential from the wild. Science, 277, 1063-1066.
The, T. T., Nevo, E. & McIntosh, R. A. (1993). Responses of Israeli wild emmers to selected
Australian pathotypes of Puccinia species. Euphytica, 71, 75-81.
Trick, M., Adamski, N. M., Mugford, S. G., Jiang, C., Febrer, M. & Uauy, C. (2012).
Combining SNP discovery from next-generation sequencing data with bulked segregant
analysis (BSA) to fine-map genes in polyploid wheat. BMC Plant Biology, 12, 14.
Uauy, C., Brevis, J. C., Chen, X., Khan, I., Jackson, L., Chicaiza, O., Distelfeld, A., Fahima,
T. & Dubcovsky, J. (2005). High-temperature adult-plant (HTAP) stripe rust resistance
gene Yr36 from Triticum turgidum ssp. dicoccoides is closely linked to the grain protein
content locus Gpc-B1. Theoretical and Applied Genetics, 112, 97-105.
Uauy, C., Distelfeld, A., Fahima, T., Blechl, A. & Dubcovsky, J. (2006). A NAC gene
regulating senescence improves grain protein, zinc, and iron content in wheat. Science,
314, 1298-1301.
Wicker, T., Mayer, K. F. X., Gundlach, H., Martis, M., Steuernagel, B., Scholz, U., Šimková,
H., Kubaláková, M., Choulet, F. & Taudien, S. (2011). Frequent gene movement and
pseudogene evolution is common to the large and complex genomes of wheat, barley,
and their relatives. Plant Cell, 23, 1706-1718.
Wright, S. I., Bi, I. V., Schroeder, S. G., Yamasaki, M., Doebley, J. F., McMullen, M. D. &
Gaut, B. S. (2005). The effects of artificial selection on the maize genome. Science, 308,
1310-1314.
Xie, W., Ben-David, R., Zeng, B., Distelfeld, A., Röder, M. S., Dinoor, A. & Fahima, T.
(2012). Identification and characterization of a novel powdery mildew resistance gene

Dina Raats, Elitsur Yaniv, Assaf Distelfeld et al. 30
PmG3M derived from wild emmer wheat, Triticum dicoccoides. Theoretical and Applied
Genetics, 124, 911-922.
Young, N. D. & Tanksley, S. D. (1989). Restriction fragment length polymorphism maps and
the concept of graphical genotypes. Theoretical and Applied Genetics, 77, 95-101.
Yu, J., Hu, S., Wang, J., Wong, G. K. S., Li, S., Liu, B., Deng, Y., Dai, L., Zhou, Y. &
Zhang, X. (2002). A draft sequence of the rice genome (Oryza sativa L. ssp. indica).
Science, 296, 79-92.