Embed Size (px)
Citation preview

EUROPEAN MASTER IN QUALITY IN ANALYTICAL
LABORATORIES
APPLICATION OF BISMUTH MODIFIED
DISPOSABLE SCREEN PRINTED CARBON
ELECTRODE FOR METAL- PLANT THIOLS
COMPLEXATION STUDIES
Master thesis by Belachew Tolla Feyssa
Barcelona, February 2010

APPLICATION OF BISMUTH MODIFIED DISPOSABLE SCREEN
PRINTED CARBON ELECTRODE FOR METALS- PLANT THIOLS
COMPLEXATION STUDIES
A Thesis Submitted to University of Barcelona
Faculty of Chemistry
In Partial Fulfillment of the
Requirements for the Degree of
European Master in Quality in Analytical Laboratories
BELACHEW TOLLA FEYSSA
FEBRUARY, 2010

This master thesis has been accomplishedin by Belachew Tolla Feyssa in the Department of
Analytical Chemistry of the Faculty of Chemistry of the University of Barcelona (UB) under the
direction of Dr. Jose Manuel Diaz-Cruz.
Dr.Jose Manuel Diaz-Cruz
Associate professor of Analytical Chemistry
University of Barcelona
Barcelona, 8th February 2010

AKNOLEDGEMENT
For all his sincere devotion to help me for the accomplishment of this work much appreciation is
expressed for my supervisor Dr.Jose Manuel Diaz -Cruz.
I also gratefully acknowledge Prof. Miquel Esteban and Dr. Cristina Arino for their assistance
and support during my study.
I would also like to express my gratitude for financial support provided by European
Commission to complete this master’s course.
Special thanks are due to Dr. Elena Checkmeneva for her unlimited support and encouragement.
Also I can’t forget the help of Dr.Olga Gonzalo, Rui Gusmao and Angela Dago for their faithful
and continuous technical assistance.
In addition, the generous support and contribution of all my colleagues, friends and families are
deeply acknowledged and emphasized in all cases of my future life.

INDEX

Index
i
TABLE OF CONTENTS
TABLE OF CONTENTS i
LIST OF TABELES iv
LIST OF FIGURES v
LIST OF ACRONYM AND ABBREVIATION vii
ABSTRACT viii
1. INTRODUCTION 1
1.1. Toxicity and Sources of Cadmium 1
1.2. Effect of Cadmium Speciation on its Toxicity 2
1.3. General Description of Phytochelatins (PCn) 3
1.4. Analytical Methodologies for Characterization of Metal-thiol 5
Peptide Complexation
1.5. Types of Electrochemical Systems for Thiol peptides-Metal 7
Complexation Studies
1.5.1. Electrochemical System Based on Mercury Electrodes 7
1.5.2. Electrochemical System Based on Bismuth Film Electrodes 8
1.6. Screen Printed Carbon Electrodes 9
1.7. Overview of Modification of Surface of Electrode by Bismuth 11
1.7.1. Ex situ plating 12
1.7.2. In situ plating 12
1.7.3. Bi2O3 Modified Electrodes 13

Index
ii
1.8. Objectives and Scopes 13
1.8.1. General objectives 13
1.8.2. Specific objectives 14
2. EXPERIMENTAL 15
2.1. Apparatus 15
2.2. Reagents 17
2.3. Preparation of Film Electrodes 17
2.3.1. Preparation of Bismuth Modified Glassy Carbon Electrode 17
2.3.2. Preparation of Bismuth Modified Screen Printed Carbon Electrodes 18
2.4. Procedure for Voltammetric Measurements 18
2.4.1. Cyclic and Differential Pulse Anodic Striping Voltammetric 18
Measurements
2.4.2. Differential Pulse Voltammetric Measurements 19
2.5. ESI-MS Measurement 19
2.6. Data Treatment 22
3. RESULT AND DISCUSSION 25
3.1. ESI-MS Experiments 25
3.2. Selection of the Useful Potential Window 30
3.3. Effect of pH on the Electrochemical Reaction of the Cadmium Complex 31
on BiSPCE
3.4. Free Metal Reduction Signal 34
3.4.1. Free Metal Reduction Signal on the BiFE 34
3.4.2. Free Metal Reduction Signal on BiSPCE 36

Index
iii
3.4.3. Free Ligand Reduction Signal on BiSPCE and BiFE 38
3.5. Complaxation Study of Cd with Glutathion 40
3.5.1. Cd-GSH System on BiFE 40
3.5.2. Cd-GSH system on SPCE 44
3.6. (γ-Glu-Cys)2Gly Complexation with Cadmium study on BiSPCE 47
4. CONCLUSION 52
5. REFERENCES 54

Index
iv
LIST OF TABLES
Table Page
1. ESI-MS for data of binary solution of GSH/Cd(II) and GSH/Bi(III) in 1:9 26
acetonitrile: 20 mM ammonium acetate in water at pH 7.5
2. ESI-MS for data for ternary solution of GSH, Cd(II), and Bi (III) in 1:9 26
acetonitrile: 20 mM ammonium acetate in water at pH 7.5.
3. Repeatability of Peak current and stability of peak potential (n= 6) at 32
various pH values.
4. ESI-MS data for a solution containing GSH, Cd(II), and Bi(III) in various 49
proportion in 1:9 acetonitrile: 20 mM ammonium acetate in water at pH 7.5.

Index
v
LIST OF FIGURES
Figure page
1. The general structure of phytochelatins 4
2. (a) A typical plant capable of synthesising PC (b ) Plant cell structure showing 4
the place where PC-metal complexes are stored
3. Systematic representation of detoxification of process of Cd2+
by PC in a plant cell 5
4. Typical Dropsens screen printed electrode 10
5. The two common types of connector that links screen printed electrodes to the 10
potentiostat (taken from Dropsens)
6. A photograph showing the electrochemical system used in this study 15
Flow chart for the electrochemical set up 16
7. Systematic representation for the process of ion formation in ESI-MS 20
Flowchart for potential shift correction for MCR-ALS analysis applied for 23
Experimental data matrix Iexp
8. Electrospray ionization mass spectrum (ESI-MS) for (a) 1:4 (Bi:GSH) and 28
(b) 1:1:4 (Cd:Bi:GSH) in 10% acetonitraile-0.02 M Ammonum acetate in water.
9. CV Voltamograms for the different buffer solution at scan rate of 0.1V/s 30
10. CV voltamogram for 0.05 borate buffer solution at pH 7.5 and scan 31
rate of 0.1V/s with first and second vertex potential at -1.6 and 0.5V vs Ag/AgCl.
11. The effect of pH on the peak intensity of the1:2 Cd: GSH complex reduction signal 32
12. Peak current vs pH showing Effect of pH on the peak intensity of the 32
Cd-GSH complex signal
13. Normalized Singular values generated from the data matrix shown in Figure 14 34
14. Differential pulse voltammogram of Cd(II) on BiFE at different concentration of 35
Cadmium in Borate buffer at pH 7.5
15. The corresponding calibration curve for Cd(II) in borate buffer at 7.5 36
16. Differential pulse voltammogram on BiSPCE for increasing addition of 37
Cd to borate buffer at pH 7.5.

Index
vi
17. The corresponding calibration curve for Cd(II) in borate buffer at 7.5 37
20. Scanning electron microscopy images of: (a) a bare screen printed carbon electrode 38
(b) a bar glassy carbon electrode
21. The voltamogram of 1x10⁻⁴
M free GSH M in 0.05 borate buffer solution (pH7.5) 39
22. Differential voltamogram s measured during the titration of 2x10⁻⁵
M GSH with Cd 43
solution in borate buffer at pH 7.5 by using BiFE.
23. Peak current Vs [Cd]:[GSH] in borate buffer solution (a) for complex signal 43
(b) for labile and free Cd reduction signal.
24. Differential voltamograms measured using the titration of 2x10⁻⁵
M GSH with Cd 44
solution in borate buffer at pH 7.5 by using BiSPCE.
25. Peak current intensity vs Cd:GSH (a) for the 1:2 Cd:GSH complex and (b) for the 45
total labile and free metal cadmium reduction signal
26. Cd-GHS complex formation reaction when at low Cd:GSH ratio 46
27. Complex formation reaction for higher Cd:GSH ratio 46
28. (a) The voltamogram profile of titration of 2x10⁻⁵
with 1x10⁻³
M Cd2+
in 48
borate buffer solution at pH 7.5 (b) the corresponding mesh plot of the
current data matrix.
29. Analysis of experimental data matrix produced from titration of 2x10⁻⁵
PC2 with 49
1x10⁻³
M Cd in 0.05 borate buffer solution at pH 7.5
30. Error distributions along the potential axis(c) as a result of deviation of the 30
Irep (b) from the Iexp (a)
Index
vii
LIST OF ACRONYMS AND ABBREVIATIONS
AdCSV Adsorptive Cathodic Stripping Voltammetry
ASV Anodic Stripping Voltammetry
BiFE Bismuth Film Electrode
BiSPCFE Bismuth Modified Screen Printed Carbone Electrode
BLM Biotic Ligand Model
CCSCP Constant Current Stripping Chronopotentiometry Potentiometry
CV Cyclic Voltammetry
DME Dropping Mercury Electrode
DPV Differential Pulse Voltammetry
ESI-MS Electron Spry Ionization Mass Spectrometry
FIAM Free Ion Activity Model
GSH Glutathione
HMDE Hanging Mercury Drop Electrode
ICT Isothermal Calorimetry Titration
MCR-ALS Multivariate Curve Resolution Alternating Least Square
MFE Mercury Film Electrode
MTs Metallothioneins
NMR Nuclear Magnatic Resonance
PCn Phytochelatins
RSD Relative Standard Deviation
SCE Size-exclusion Chromatography
SPCE Screen Printed Carbone Electrode
SVD Singular Value Decomposition

Index
viii
ABSTRACT
The application of Bismuth modified cheap and disposable screen printed carbon electrode
(BiSPCE) for voltammetric studies of metal–thiol rich peptides complexation was evaluated
considering systems consisting of cadmium as a metal and GSH and PC2 as thiol peptides.
Comparison of the performance of BiSPCE with the commonly used glassy carbon electrode
(BiFE) was made. The information obtained about the complexation sequence using the former
electrode was quite consistent with previous studies made on GSH and Cd systems using the
conventional mercury electrodes due to the absence of signal splitting, the good sensitivity and
the wider linearity range. In contrast with the conventional mercury electrodes, the anodic
signals associated with bismuth electrode material were observed to be weakened and all the
available signals were well resolved which shows the suitability of Bismuth based electrode for
metal- thiol complexation studies. MCR-ALS could not be applied due to the continuous shift
of the peak potentials, loss of linearity of the species and anomalous shape of the complex signal
formed between Cd and GSH. Therefore, the complexation sequence between GSH and Cd2+
was evaluated qualitatively. However, a relatively well defined shape and intense
voltammograms were observed for Cd-PC2 system and consequently, MCR-ALS was applied
after correction of the continuous peak potential shift for the complex signals. The peak intensity
associated with complex signal was dominated by the intense signal of the free metal reduction
in acidic and fairly basic medium. However a relatively intense signal of the complexes was
obtained at pH 7.5 in borate buffer solution. In addition extensive Bi complexation was observed
from ESI-MS experiment which proves the suitability of ex situ mode of Bi film preparation for
thiol- metal complexation studies by voltammetric titration technique.
Key words: Differential pulse voltammetry, Bismuth film electrodes, Screen printed carbon
electrode, ESI-MS, MCR-ALS.

ABSTRACT

Abstract
i
ABSTRACT
The application of Bismuth modified cheap and disposable screen printed carbon electrode
(BiSPCE) for voltammetric studies of metal–thiol rich peptides complexation was evaluated
considering systems consisting of cadmium as a metal and GSH and PC2 as thiol peptides.
Comparison of the performance of BiSPCE with the commonly used glassy carbon electrode
(BiFE) was made; the information obtained about the complexation sequence using the former
electrode was quite consistent with previous studies made on GSH and Cd systems using the
conventional mercury electrodes due to the absence of signal splitting, the good sensitivity and
the wider linearity range. In contrast with the conventional mercury electrodes, the anodic
signals associated with bismuth electrode material were observed to be weakened and all the
available signals were well resolved which shows the suitability of Bismuth based electrode for
metal- thiol complexation studies. MCR-ALS could not be applied due to the continuous shift
of the peak potentials, loss of linearity of the species and anomalous shape of the complex signal
formed between Cd and GSH. Therefore, the complexation sequence between GSH and Cd2+
was evaluated qualitatively. However, a relatively well defined shape and intense
voltammograms were observed for Cd-PC2 system and consequently, MCR-ALS was applied
after correction of the continuous peak potential shift for the complex signals. The peak intensity
associated with complex signal was dominated by the intense signal of the free metal reduction
in acidic and fairly basic medium. However a relatively intense signal of the complexes was
obtained at pH 7.5 in borate buffer solution. In addition extensive Bi complexation was observed
from ESI-MS experiment which proves the suitability of ex situ mode of Bi film preparation for
thiol- metal complexation studies by voltammetric titration technique.
Key words: Differential pulse voltammetry, Bismuth film electrodes, Screen printed carbon
electrode, ESI-MS, MCR-ALS.

INTRODUCTION

Introduction
1
1. INTRODUCTION
1.1 Toxicity and Sources of Cadmium
The presence of toxic metals such as Cd and Pb in the environment has been a source of concern
to environmentalist and governmental agencies. This is mainly due to their health implication
since they are toxic above a certain tolerable level to human, animals and plants. The adverse
effect of these metals is aggravated by their ability to accumulate in the living organisms and
resist for bio-degradation process. Although the existence of cadmium containing carbonic
anhydrase from some marine diatoms has been recently found [1], it is generally accepted that
Cd2+
is non-essential metal for both plants and animals. The International Agency for Research
on Cancer has classified cadmium as human carcinogen [2]. In plants Cd2+
causes various
effects, such as inhibition of photosynthesis, respiration, nitrogen metabolism as well as the
decrease of water and mineral uptake [3]. Those Cd2+
- induced changes in plant metabolism
finally lead to inhibition of plant growth. Cd2+
inhibits the growth or production of cells in
mammals, causes cell death and may cause cancer [4]. Particularly in human it replaces the role
of Zn in enzymes and accumulates in the bones, kidney, and liver leading to failure after
prolonged exposure [5]. Although the final reaction of plants and mammals to Cd2+
may be
different, many Cd2+
related processes are common in both types of cells [6].
Cadmium is naturally present in the environment as minor constituent of soil, surface and
groundwater as hydrated ion and inorganic complexes such as carbonates, hydroxides, chlorides
or sulphates, or as organic complexes with humic acids [7]. However, a wide range of human
activities contributed to the current increased level of Cd metal in the natural environment.
Cadmium is commonly introduced to the natural environmental systems through atmospheric
deposition, direct discharge from industrial operations, leakage from landfills and contaminated
sites, and the use of sludge and fertilisers in agricultural activities.

Introduction
2
1.2 Effect of Cadmium Speciation on its Toxicity
Generally, significant relationship have been found in many cases, between metal bioavailability
and free metal ion concentrations as predicted by the Free Ion Activity Model (FIAM) [8] or the
Biotic Ligand Model (BLM) [9]. It should be noticed that the free metal ion activity or
bioavailability in the natural environment is not a function of only the total recoverable amount
of metal rather, speciation of the metal in the medium greatly affect the bioavailability of the
metal. The concept of “toxicity is simply a function of the total concentration of a metal” can be
or extremely oversimplification of the truth in some cases. Nowadays, the importance of
considering bioavailability in assessing ecological impacts of metals has been recognized by both
regulatory authorities and the scientific community in contrast to the original concept which
relates heavy metals toxicity solely with the total recoverable amount [10]. More specifically
various studies on the speciation have shown that absorption of toxic metals like cadmium by an
organism decreases in the presence of natural organic and inorganic ligands due to the
complexation phenomena [11, 12, 13, 14] according to :
(1)
Phytochelatins (PCs) produced by plants and Metallothioneins (MTs) synthesized by animals are
among those essential naturally occurring metal-binding organic ligands that play a key role in
metal binding processes and thus influencing metal speciation, bioavailability and toxic effect in
cellular environments [15]. In the particular case of metal detoxification (i.e., the response of the
organism to an excessive uptake of heavy metals), the process involves simple molecules like
glutathione and longer chain peptides MT and PCs. PCs and MTs are different classes of
cysteine-rich, heavy metal-binding protein molecules. PCs are enzymatically synthesized
peptides, whereas MTs are gene-encoded polypeptides [16]. The thiol groups of MT and PCn
ensure the formation of very stable metal-peptide bonds which immobilize the metal, thus
decreasing its toxicity and making its elimination easier.
Currently plant derived phytochelatins are being used for developing a technology called
Phytoremediation that can potentially reduces the problem of contaminated soil or water with

Introduction
3
toxic metals [18]. In this technology genetically engineered plants are involved that uptake metal
and metalloids ions from the polluted site by the process called phytoextraction. Therefore it is
quite interesting to study the complexation mechanism of metals with plant thiols for better
understanding of the role of phytochelatins and the mechanism in metal detoxification processes.
1.3 General Description of Phytochelatines (PCn)
PCn were first identified in the fission yeast Schizosaccharomyces pombe, currently PCn have
been found in some fungi, some marine diatoms, and all types of plant species investigated [4].
They act as high affinity metal chelators and for this reason plant cells are capable of tolerating
high levels of metals like Cd2+
. It was well confirmed that metal induced phytochelatin
production decreases cellular levels of glutathione [16]. Hence they are synthesized from a
precursor glutathione in the presence of some metals such as Cd, Cu, Hg, As or Pb, in a reaction
controlled by enzyme γ- glutamylcysteine dipeptidyl transpeptidase (PC synthase) that catalyzes
the transfer of γ- glutamylcysteine dipeptide part of GSH to an active GSH molecule for growing
of PC chain according to the following reaction [18]:
γ-Glue-Cys-Gly + (γ-Glu-Cys)n-Gly (γ-Glu-Cys)n+1-Gly + Gly (2)
The above reaction is highly dependent on the presence of heavy metal in the plant cell and it has
been shown that the efficiency of activation of the metals on the enzyme is according to the
following:
Cd2+
>Ag+>Pb
2+>Cu
2+>Hg
2+>Zn
2+>Sn
2+>Au
3+>As
5- > In
3+>Tl
3+>Ge
4+>Bi
3+>Ga
3+
However 39 elements in the periodic table have no any tendency to activate the enzyme
responsible for PC synthesis [18].
PCn are represented by a formula of [γ-Glu(-Cys)]n-Glyc where n varies from 2 to 11 and their
general structure is depicted in figure 1 .
Introduction
4
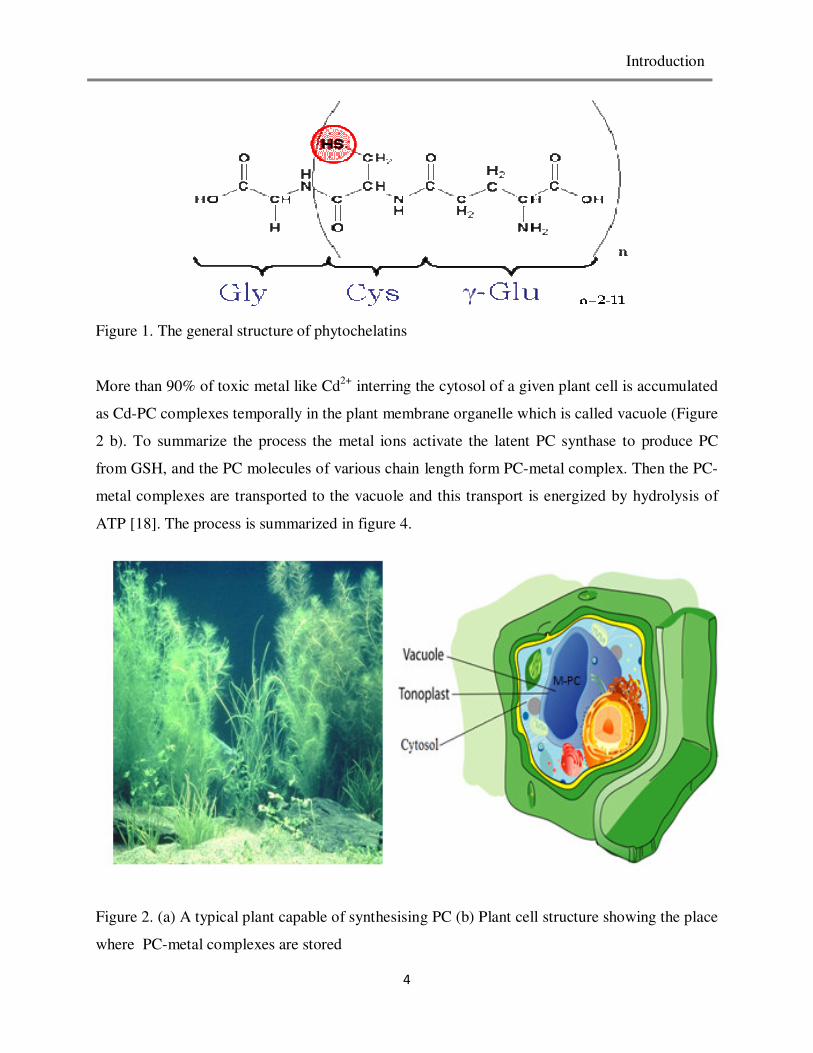
Figure 1. The general structure of phytochelatins
More than 90% of toxic metal like Cd2+
interring the cytosol of a given plant cell is accumulated
as Cd-PC complexes temporally in the plant membrane organelle which is called vacuole (Figure
2 b). To summarize the process the metal ions activate the latent PC synthase to produce PC
from GSH, and the PC molecules of various chain length form PC-metal complex. Then the PC-
metal complexes are transported to the vacuole and this transport is energized by hydrolysis of
ATP [18]. The process is summarized in figure 4.
Figure 2. (a) A typical plant capable of synthesising PC (b) Plant cell structure showing the place
where PC-metal complexes are stored

Introduction
5
Inactive
PC synthase
Cell wall
Active
PC synthase
+ ATP
Cd-PC-GlyGSH
Vacuole
PC + Cd2+ Cd2+.PC
Degradation
H+
Cd2+
Cytosol
Figure 3. Systematic representation of the process of detoxification of Cd2+
by PC in a plant cell
Although animal metallothioneins are relatively well characterized and confirmed to contain
cysteinyl-sulphur coordinated metal ions arranged in multinuclear center (clusters) the structural
information about phytochelanies metal complex is not fully understood yet [19]. However the
relative stability and the possible stoichiometries of the resulting complexes formed were
extensively studied by various techniques.
1.4 Analytical Methodolegies for Characterization of Metal-thiol Peptide Complexation
The speciation of toxic metals in the presence of phytochelatins and essential biological
compounds have been studied by various techniques extensively. An approach based on size-
exclusion chromatography (SEC) with off-line mode for the detection of phytochelatins and
atomic absorption spectrometry for metal quantification has been used to study Cd and Pb

Introduction
6
phytochelatin complexes distribution [20]. In the study of Cd2+
complexation with GSH in
human erythrocytes glutathione was monitored by 1H-NMR [21]. UV spectroscopy and
potentiometric techniques were also applied for quantification of free glutathione and free
cadmium ion respectively to explain the mechanism of cadmium complexation with gluthation
[22]. More recently Isothermal Titration calorimetry (ITC), ESI-MS and electroanalytical
techniques were used simultanously for study of competitive Binding of Cd and Zn with the
Phytochelatin (γ-Glu-Cys)4-Gly [23].
However, electroanalytical techniques are one of the imperative ways for metal speciation
studies because of their low detection limit, high selectivity for a particular redox state of a
species, speed, low cost and convenient operation. In addition they can be employed for field (at-
site) study and flow analysis methodologies [24]. Particularly voltammetric and
chronopotentiomeric techniques have been extensively used to study the metal complexation
phenomena with phytochelatins and other biological organic ligand using mercury electrodes and
other material film electrodes . The common way of characterization of the complexation process
is by titrating the metals with the ligand or using the reverse process to get a progressively
changing ligand-to-metal ratio that yield valuable information about the relative stability of the
metal bound in different manners and possible stoichiometries of the resulting complexes.
Developing electroanalytical methods having sufficient detection limit down to the cellular level
is essential to model the complexation process in the living organism cell. To achieve that,
anodic stripping techniques seems to be a prior option. However, due to the strong attachment of
the metal ion on to the thiol site of the ligand, oxidative striping of the metal from the complex is
not possible because the reduction of the metal complex becomes irreversible [25]. For this
reason adsorption stripping chronopotentiometric (AdSCP) method, which is less affected by
the presence of organic matter, and performs a reductive stripping of the previously adsorbed
complex, was proposed for the study of thiol-metal complexation [26]. However differential
pulse polarography or voltammetry are being used extensively to study complexation because of
their low detection limit which are still enough to quantify low level metal and ligand
concentration comparable to those existing in organisms cells and they present the advantage of a

Introduction
7
higher simplicity. Moreover the appearance of signals for the free peptide, free metal ion and
complex in different peak potentials position makes this technique to be more preferable.
1.5 Types of Electrochemical Measuring Systems for Thiol peptides-Metal Complexation
Studies
1.5.1 Electrochemical System Based on Mercury Electrodes
Mercury electrodes, most frequently the mercury film electrode (MFE), the hanging mercury
drop electrode (HMDE) and the dropping mercury electrode (DME) have been used extensively
for routine stripping analysis and complexation studies. This is due to some important
advantages over solid electrodes and other material film electrodes that are used for anodic
scanning purposes. First, mercury is the best for cathodic scanning because of its large hydrogen
over voltage that extends the negative limit of potential window and show a well defined
electrochemical behavior in the negative potential region with very low background and noise as
compared to the solid electrodes [27]. The other advantage originated from the periodic renewal
of the surface of the electrode that reduces the problem of contamination. However, the main
disadvantage of this electrode and the corresponding film electrode (MFEs) is related to its
toxicity, volatility, and disposal and so that it is considered environmentally undesirable [28]. In
addition to this as mercury electrodes have low mechanical stability and require special handling
their application for flow analysis is very limited [28].
With regard to the application of mercury for the study of thiol- metal complexation, its good
sensitivity and reproducibility for free metal, free ligand and complex entities facilitates such
studies by polarographic techniques. However, mercury electrodes usually give complicated sets
of overlapping signals that correspond to the reversible reduction of metal ions, the non
reversible reduction of strongly bound metal to the thiol peptide and signals associated with the
oxidation of mercury electrode itself [23, 25, 26]. In the latter case the oxidized mercury forms
thiol complexes by itself to give important anodic signals which complicate the interpretation of
the complexation process. This makes necessary the use of chemometric techniques, especially

Introduction
8
multivariate curve resolution by alternating least squares (MCR-ALS) to resolve the signals of
pure species and the evolution of their concentrations during the titration.
Due to the aforementioned disadvantages of mercury electrodes different inert solid materials
like carbon, silver, and gold electrodes have been tried as a substituent of mercury electrode [29].
These electrodes exhibit good mechanical stabilities together with the possibilities for surface
modification which increases their performance. However, bare solid electrodes suffer from
memory effects due to lack of surface regeneration and consequently, either polishing or a
tedious chemical or electrochemical surface regeneration is frequently required [28]. As a result
electrodes which are environmentally friendly and that have properties which removes the
problem associated with the use of solid electrodes are being sought continuously. For the first
time Wang and coworkers introduced an environmentally friendly bismuth- film electrode by
their pioneered works as a best alternative electrode for mercury and bare solid electrodes [30].
1.5.2 Electrochemical System Based on Bismuth Film Electrodes
Researches within the past few years have shown that the performance of bismuth film
electrodes (BiFE) which is composed of metallic bismuth on a conductive supporting substrate is
comparable or even surpass that of the conventional mercury electrodes that are being used
commonly for anodic stripping voltammetry analysis [31] and chronopotentiometric stripping
analysis [32]. In addition, adsorptive cathodic stripping voltammetry (AdCSV) has been
successfully employed at Bi film electrode [33]. The most important characteristics of this
electrode are simplicity of preparation, high sensitivity , good mechanical stability , well defined
and highly reproducible stripping signal, good resolution between neighboring peaks, low
background characteristics , less affected by potential interferents such as surfactants and ionic
species, large cathodic potential working range, removal of the film easily when it is required
and being insensitive for dissolved oxygen that greatly reduce the time required and amount of
nitrogen used for the deoxygenation step [33]. The high sensitivity of the electrode is due to the
property of Bismuth to form fused alloys with heavy metals, which is analogous to the amalgams
that mercury forms according to equation 3. In addition, bismuth is known to be a non-toxic

Introduction
9
element [35] as compared to mercury electrode whose use as an electrode material may in the
future be constrained.
Mn+
+ ne- Bi(M
0) (3)
Specifically more recently Bismuth modified glassy carbon electrode (BiFE) was proposed as an
alternative method for complexation study [34]. It was shown that all signal observed in mercury
film electrode were also present in voltammograms obtained using Bismuth film electrode.
Moreover, good improvement was observed towards the problem associated with signal
overlapping. However it was noticed that the reduction process of the complexes showed
remarkably inert electrochemical character on bismuth film electrodes that hinder to do
experiments at very low concentration ( lower than 2x10⁻⁵
M) that were easily achieved by
using mercury film electrodes. In addition the free ligand evolution was not linear for
concentration higher than 2x10⁻⁵
M and its shape changes with increasing concentration
consequently it was not possible to apply MCR-ALS analysis. Fortunately this did not prevent
qualitative interpretation of the complexation process as all the signals were well resolved in
contrast to the signals observed using mercury film electrode. In light of the above mentioned
thiol-complexation study using BiFE, in this study the applicability of cheap and disposable
screen printed carbon electrode modified with bismuth was tested for heavy metal complexation
with phytochelatines considering the case of cadmium complexation with gluthation and PC2 as a
model ligand for the higher thiol peptides and other organic ligands.
1.6 Screen Printed Carbon Electrodes
Disposable carbon electrodes have a typical complete electrochemical cell configuration, i.e they
combine the working, reference and auxiliary electrode together and are highly suitable for
working with micro volumes and decentralized assays or to develop specific sensors by
modifying their surface with various materials. The typical screen printed carbon electrode by
Dropsens (Oviedo, Spain) is based on Ceramic substrate: H33 x L10 x W 0.5 mm, Electric
contacts: Silver. The electrochemical cell consists of Working electrode: Carbon (4 mm

Introduction
10
diameter), Counter electrode: Carbon and Reference electrode: Silver. The arrangements of the
parts of this electrode are shown in Figure 2.
The screen printed electrode is connected to any model of potentiostate by a special type of
connector which is manufactured by Dropsens that acts as bridge between the screen-printed
electrode and potentiostat. Figure 2 shows the two kinds of connector used for screen printed
electrodes. The sample is usually applied on the working electrode part in the form of small drop
on isitu or in the laboratory for stripping analysis of environmental or biological samples.
Figure 4. Typical Dropsense screen printed electrode
Figure5. The two common types of connector that links screen printed electrodes to the
potentiostat (taken from Dropsens)

Introduction
11
In addition to the above mode of application disposable carbon electrodes can also be used as
working electrode in the place of the conventional working electrodes in an electrochemical
system. The most important advantages of disposable screen printed electrodes are their
inexpensive price, disposable character, flexibility in design and that they are easy to produce.
For this reason one can use a new screen printed electrode every time, which eliminate the
problem associated with the carry over contamination and reutilization and reduce the fear of
expensive damage associated with reusable electrodes. In addition the working surface of solid
electrodes including glassy carbon usually needs to be polished quite frequently before formation
of bismuth film on them which leads to difficulty to use such electrodes with high precision for
online analysis with the use of automated systems and for on-site filed portable instruments [29].
For this reason screen printed electrodes (SPEs) can be a good substrate for preparation of film
electrodes for the purpose of anodic stripping voltammetry measurements of trace elements and
speciation studies. Another important advantage of the screen printed carbon electrode provide a
better surface structure for platting of bismuth as the film electrode on SCPCE showed a better
sensitivity in stripping analysis than the corresponding glassy carbon electrode [28]. In this study
the carbon screen printed electrode modified with bismuth film was used as working electrode
for thiol–metal complexation studies.
1.7 Overview of Modification of Surface of Electrode by Bismuth
Bismuth can be plated on several materials, such as glassy carbon [30], carbon paste [36],
Screen–printed carbon ink [37], carbon- fibers [38] and gold [39]. A large number of studies
used carbon electrodes as supporting material for preparation of Bi-film electrode. The common
way of preparation of BiFEs is by electroplating of the conductive supporting material such as
glassy carbon, carbon pest, and screen printed carbon ink electrode with Bi from Bi(III) solution
by applying a negative potential in the reductive potential regime at either in situ or ex situ
condition. In addition the surface of those electrodes can be modified with Bi2O3 to further
electrochemically reduce bismuth

Introduction
12
1.7.1 Ex situ plating
Ex situ mode of film electrode preparation involves electroplating of the substrate material with
the Bismuth from a solution containing Bi (III) ion separately and before the use of the electrode
for analysis in the pre-analysis step. Consequently this requires a transfer of the prepared
bismuth film electrode to the measurement solution or in flow system. Since bismuth film
prepared is used for several measurements the overall stability of the electrode is very important
[40]. It has been reported that formation of mercury film electrode by ex situ mode is
complicated by the difficulties associated with the preparation of the mercury coating which
result in the loss of mercury up on transfer to a solution to be measured [41]. In contrast, stability
problem with bismuth film electrode prepared using normal sized glassy carbon electrode or
screen carbon electrode were not observed [42]. The ex situ mode of deposition of bismuth film
was also proved to be a better option of film electrode preparation by a previous study for study
of metal complexation where the presence of Bi(III)-ions in the solution could interfere with the
speciation of other metals [43].
1.7.2 In situ plating
The Bi film electrode can be electrochemically formed by in situ mode if the film is plated on the
substrate material simultaneously with the target metal ion to form metal alloy during the
preconcentration step from the solution containing about 400 to 1000 µg/L Bi(III) in stripping
analysis. As in situ plating does not require separate bismuth plating the time required for
completion of the analysis is shortened and the stability of the film is not a critical problem.
However, in situ plating is limited for fairly acidic pH range of the sample solution as the Bi(III)
ion undergoes immediate hydrolysis at natural and basic pH condition.
Bi3+
+ 3H2O Bi(OH)3 +3H+
(4)
Introduction
13
However, interestingly in situ plating can be applied at extremely high pH values and this is
because instead of insoluble Bi(OH)3 soluble and stable complex is formed according to the
following reaction:
Bi3+
+ OH- Bi(OH)
2+ (5)
During the deposition process the complex ion is reduced on the electrode surface as the free
Bi(III). The above property is one of the advantages of BiFE over MFE as the later is known to
be non functional at extreme basic conditions [28].
1.7.3 Bi2O3 Modified Electrodes
BiFE is also prepared by modifying the surface of the substrate electrode with Bi2O3 [44]. This is
based on the reduction of Bi2O3 on the surface electrode by applying a sufficiently high negative
potential, usually -1.0 V vs Ag/AgCl according to the following reaction:
Bi2O3(s) + 3H2O +6e- 2Bi(s) + 6OH- (6)
Then the electrode is said to be activated and can be used readily for the intended purpose. It is
interesting to note that this mode of BiFE preparation does not require Bi(III) for deposition of
Bi film and can be applied simply for in situ analysis after activating at an appropriate potential.
However Bi2O3 is prepared by mixing it in carbon paste to integrate it into the electrode surface;
therefore this mode of BiFE preparation is practically confined to carbon paste electrodes.
1.8 Objectives and Scopes
1.8.1 General objectives
This work reports the application of a new method for complexation studies of cadmium with
phytochelatins using screen printed carbon electrodes which are modified by plating with

Introduction
14
bismuth in ex situ mode of deposition (BiSPCE). Although cadmium phytochelatin complexation
has been extensively studied by polarographic techniques and other analytical methods the
current study evaluate if there are significant advantages of using BiSPCE in resolution of
overlapped signals, and minimization of the number of signals in order to facilitate the
interpretation of the process. Also the possibilities of application of MCR-ALS will be evaluated
for this particular system which was not possible in the case of BiFE.
1.8.2 Specific objectives
� To develop a method for the study of cadmium complexation with gluthatione and PC2
using bismuth modified screen printed carbon electrode (BiSPCE) with special attention
to the optimization of the experimental conditions.
� To compare critically the results obtained from BiSPCE with those results from
conventional glassy carbon disk electrode (BiFE) and mercury film electrodes (MFE) and
to see the possible merits of bismuth modified screen printed carbon electrodes over that
of the MFE and BiFE.
� To apply MCR-ALS methodologies to resolve the concentration profile and the pure
signal of each species during the titration process
� To propose possible complexation mechanisms and compare the results with other
literature results and the result obtained from ESI-MS experiments.
� Apply ESI-MS experiments to understand the different behaviour of the anodic signal of
thiol compound in bismuth film electrodes.

EXPERIMENTAL

Experimental
15
EXPERIMENTAL
2.1 Apparatus
All voltammetric measurements were performed using a Metrohm 663 VA Stand (Metrohm,
Switzerland) interfaced to a computer controlled potentiostat/galvanostat Autolab System
PGSTAT12 (Eco Chemie, The Netherlands) and measurements were controlled by a general
purpose electrochemical software operating system, Autolab GPES 4.9 (software version for
windows 2000 and XP). Bi modified glassy carbon electrode (BiFE) of 2mm diameter
(Metrohm) and Bismuth modified Carbon Screen Printed Electrode (BiSCPE) 4 mm diameter
provided by Dropsens (Oviedo, Spain) were used as working electrodes. The reference electrode
and the auxiliary electrode were Ag/AgCl/KCl (3 mol L−1
) and a Pt wire, respectively. The
whole electrochemical set up is shown in Figure 6 and Figure 7.
Figure 6. A photograph showing the electrochemical system used in this study

Experimental
16
N2
20 min
AutolabPGSTAT 12
Three electrode system
WE: BiFE and BiSPCERE: Ag/AgClAE:Pt
Micropipettes
Stand 663 VA
or Cd2+
ligands
PC controlled by GPES 4.9
Figure7. Flow chart for the electrochemical set up
The electrochemical parameters used for DPV and DPASV measurements were a pulse time of
50 ms, pulse amplitude of 50 mV, potential step of 2 mV. During DPASV measurement the
deposition potential (Ed) was applied for 60 s and a rest period of 5 s was made between the
deposition and the stripping steps. For cyclic voltammetery measurement the scan rate was set at
0.1 V/s.
The measurement of pH value during the experiments was carried out by means of a Crison
micro pH meter. All experiments were performed at a controlled room temperature of 20oC.
ESI-MS experiments in positive ion-mode for a mixture containing Cd(II), B(III), GSH and PC2
were done using an Agilent 1100 Q-TOF instrument. The instrument control was performed
using Analyst QS software.

Experimental
17
2.2 Reagents
Glutathione (GSH), in the reduced form, was provided by Merck with purity greater than 99%
and Phytochelatins with n = 2 was provided as trifluoroacetate salt by Diver- Drugs S.L.
(Barcelona, Spain) with a purity of ca. 90% . A standard Bi(III) solution (996 gL−1
, atomic
absorption standard solution) was purchased from Fluka. All other reagents used were Merck and
Sigma/Aldrich analytical grade. 10−2
mol L−1
Cd(II) stock solutions were prepared from
Cd(NO3)2·4H2O and standardized complexometrically. Borate buffer were prepared from sodium
tetraborate, and the pH was adjusted to the value of 7.0, 7.5 and 8.5 with the addition of ultra
pure HNO3 (65%, Merck). Maleic acid–KOH buffer solution was used for pH control at the
value of 6.4. KNO3 was employed as supporting electrolyte. Ultrapure water (Milli-Q plus 18.2
systems, Millipore) was used in all experiments.
1.1 Preparation of Film Electrodes
2.3.1 Preparation of Bismuth Modified Glassy Carbon Electrode
New BiFE were prepared every day immediately before voltammetric measurements. Ex situ
preparation of the Bi film on glassy carbon electrode was performed based on an optimized
procedure as described in N. Serrano et al [17]. To describe it briefly, prior to bismusth film
formation the glassy carbon electrode which serves as the supporting substrate was properly
polished with 0.05 µm alumina powder suspension on a polishing pad (metrohm) and washed
several times with ultrapure water and sonicated for several minute in ultrapure water bath .
Then the electrode was rinsed with pure water and pure alcohol and connected to the
electrochemical system as working electrode and placed in a plating solution containing 100
ppm Bi(III) solution in 0.2 M acetate buffer (pH=4.5). After deoxygenation of the solution for 20
min with pure nitrogen the bismuth film was generated using a deposition potential of -0.6V
applied for 300 s with stirring at the rate of 500 rpm. The solution was left for 20 s without
stirring to equilibrate. After preparation of BiFE all electrodes of the electrochemical system
were washed several times with ultrapure water carefully without scratching the bismuth film.
Finally the Bi(III) solution was substituted with the analyte solution to be measured.

Experimental
18
2.3.2 Preparation of Bismuth Modified Screen Printed Carbon Electrodes
To prepare BiSPCE the same procedure was applied as BiFE preparation with slight
modification. To describe it briefly, first the screen printed carbon electrode was connected to the
potentiostat as working electrode using a 1 meter length cable provided by the electrode
manufacturer (Dropsens). Then the three electrode system was immersed to a 20 mL solution
containing 100 ppm Bi (III) in 0.2 M acetate buffer at pH 4.5. The solution was deoxygenated
with pure nitrogen for 20 min followed by deposition of bismuth on to the screen printed
electrode at deposition potential of -0.8 V for 300 second with solution stirring (by means of an
external mechanical stirrer) and then the solution was left for 20 s without stirring to equilibrate.
Finally, before using voltammetric measurements of the analytes solution the whole electrode
system was rinsed with ultrapure water several times without scratching the bismuth film on the
screen printed electrode.
2.4 Procedure for Voltammetric Measurements
2.4.1 Cyclic and Differential Pulse Anodic Striping Voltammetry Measurements
In order to assess the useful potential window and reversibility of electrochemical reactions on
the BiSPCE cyclic voltammetry measurements were done at different pH values. CV of borate
buffer at pH 7.0, 7.5, 8.5 and maleic/maleate buffer at pH 6.4 were measured in the absence of
either peptide ligand or Cd(II) to select the widest potential window. 20 ml of the respective
buffer solution were placed in to the voltammetric cell and the solution was deoxygenated for 20
min then the CV was recorded for each buffer system at scan rate of 0.1 V/s with the limit of first
and second vertex potential at -0.5 and -1.6 V respectively. In addition differential pulse anodic
striping voltammetry was recorded for Cd(II) solution to locate the peak potential at the selected
pH value (7.5) by placing 20 mL of borate buffer solution in to the voltammetric cell and 40 µL
of 10-2
M Cd(II) solution followed by purging for 20 min then DPASV was recorded. In addition,
before each voltammetric titration process, the presence of Cd(II) was checked by recording
DPASV of the blank buffer solution.

Experimental
19
2.4.2 Adsorptive Cathodic Stripping Voltammetery Measurements
The procedure used to obtain adsorptive cathodic stripping voltammograms was as follows: 20
mL of 0.05 M borate buffer solution at pH 7.5 was transferred in to the voltammetric cell. The
stirrer was switched on and the solution was purged with nitrogen gas for 20 min. Then
accumulation was effected for 120 s at -0.6 V whilst stirring the solution. At the end of the
accumulation time the stirrer was switched off. After 5 s had elapsed to allow the solution to
become quiescent, the potential was scanned from -0.6 to -1.1 V using differential stripping
voltammetry. When further ligand or metal solution was added to the cell, the solution was
deoxygenated with nitrogen before carrying out further voltammetric measurement.
2.4.3 Differential Pulse Voltammetric Measurements
Differential pulse voltammetry was performed according to the following procedure: 20 ml of
buffer solution containing 0.01 M maleic–maleate (pH=6.4) and 0.05 M KNO3 as supporting
electrolyte or a buffer solution containing 0.05 M Borate (pH = 7.5, 7.0 and 8.5) were put in an
acid cleaned and dried glass cell. Then the solution was purged with pure nitrogen for 30 min
and blank anodic stripping voltamograms were recorded to check the presence of cadmium
contamination in the solution. Then to investigate the voltammetric nature of pure Cd2+
and
GSH, solutions containing these pure species were added to the cell to obtain concentration
range of 10-4
to 10-7
M in the voltammetric cell and the respective voltammograms were
recorded. Titration of Cd2+
with GSH or PC2 was done by adding 40 µL of 1x10⁻²
M Cd2+
solution to the cell to get its concentration exactly 2x10⁻⁵
M and titrating it with 1x10⁻³
M freshly
prepared GSH or PC2 solution in order to get various ligand to metal ratios (from 0 to 3). The
reverse titration was also done in such a way with successive addition of 1x10⁻³
M Cd2+
solution
to 2x10⁻⁵
M GSH solution in the voltammetric cell. Voltammograms were measured after
deoxygenation of the solution for 1 min with stirring after each addition of GSH or Cd2+
solution
to the cell.
Experimental
20
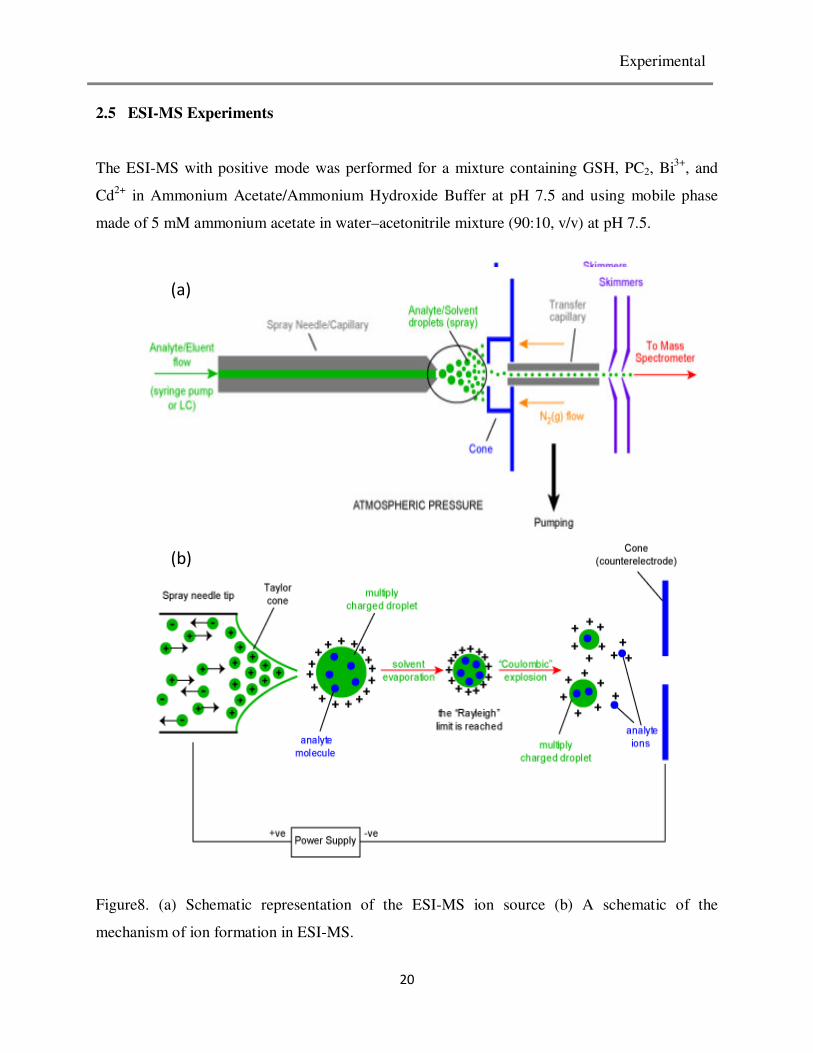
2.5 ESI-MS Experiments
The ESI-MS with positive mode was performed for a mixture containing GSH, PC2, Bi3+
, and
Cd2+
in Ammonium Acetate/Ammonium Hydroxide Buffer at pH 7.5 and using mobile phase
made of 5 mM ammonium acetate in water–acetonitrile mixture (90:10, v/v) at pH 7.5.
Figure8. (a) Schematic representation of the ESI-MS ion source (b) A schematic of the
mechanism of ion formation in ESI-MS.
(a)
(b)

Experimental
21
The operational procedure was adapted from E.Chekmeneva et.al [45]. To explain briefly:
samples were introduced in to the electron spray source by direct injection mode of 50µL in
Ammonium Acetate/Ammonium Hydroxide Buffer at pH 7.5 at flow rate of 40 µL /min at a
source temperature of 300 oC. The applied voltage was maintained at 4.0 kV for the capillary
and 200 V for the fragmentor. The mass spectra were collected through m/z range from 100 to
1500. The mixture containing GSH, Bi3+
and Cd2+
were prepared by mixing 1x10⁻³
M of each
species in the buffer solution to get ratio of Cd2+
: GSH and Bi3+
:GSH (1:1:1, 1:2:1, 2:1:1) and
Cd2+
:Bi3+
:GSH(1:1:1, 1:1:2, 2:2:1, 1:2:1, 2:1:1, 1:1:4 ).
ESI-MS is especially useful in producing ions from macromolecules where the analyte often
requires that non-covalent molecule-protein or protein- metal complexes are representatively
transferred into the gas-phase by overcoming the propensity of these molecules to fragment
when ionized. This is the reason why this technique was selected for this particular investigation
as it helps to see unfragmented PC-Metal complex in the spectra. Figure 8 summarises the main
steps in ion production in ESI-MS technique.
As any other mass spectroscopic devices ESI-MS combines four basic parts. Ion source, mass
analyzer, detector and recorder. As stated above the unoqe properties of ESI-MS arises from its
ion source. To describe briefly the process involved in ion formation the liquid containing the
analyte is injected into the system from the injection syringe pump and passes through the
electrospray needle, that has high potential difference in reference to the counter electrode. This
results in formation of a spray of charged droplets from the needle and then the droplets are
repelled from the needle towards the source sampling cone on the counter electrode and finally
solvent evaporation occurs when the droplets travel between the electrospray needle and the
collecting cone (Figure 8b). As the solvent evaporation occurs, the droplet shrinks until it reaches
the point that the surface tension provided by the solvent can no longer sustain the charge (the
Rayleigh limit) at which point a "Coulombic explosion" occurs and the droplet is ripped apart.
This produces smaller droplets that can repeat the process as well as naked charged analyte
molecules. These charged analyte molecules can be singly or multiply charged and trapped to the
mass analyzers. Because the formation of ions involves extensive solvent evaporation, the
typical solvents used for electrospray ionization are prepared by mixing water with volatile

Experimental
22
organic compounds like acetonitrile. The ions observed by mass spectrometry may be
quasimolecular ions created by the addition of a proton (a hydrogen ion) and denoted [M + H]+,
or of another cation such as sodium ion, [M + Na]+, or the removal of a proton, [M − H]
−.
The ions are then sorted according to their mass to charge ratio by the mass analyzer. In this
experiment the analyzer is time of flight analyzer (TOF). In this mass analyzer the total time
elapsed for a given ion to travel from the iterance point to the detector is determined by:
2.6 Data Treatment
The raw electrochemical data were converted into the corresponding current data matrix I that
contains as many rows as the number of recorded voltammograms and as many columns as
potentials scanned during the current measurements using a homemade programs developed in
Mathlab [46]. First singular value decomposition (SVD) is applied to estimate the minimum
number of mathematical components (principal components) which corresponds to the number
of possible electrochemical reaction which contribute linearly to the signal. Then the matrix I is
decomposed as the product of a matrix C (concentration of each component) and a matrix VT
( that correspond to the pure voltamograms that contribute to the current) plus an error matrix X
[47] which is denoted by the following equation:
I = CVT + X (8)
Where VT stands for the transposed matrix V and the unit of I and X is current (A), mol L
-1 for
C and A mol-1
L for V.
The above procedure is made in an itertative way from a first estimation of concentration profile
or pure signals which is postulated from the data matrix. In the ALS analysis several restrictions
(7)

Experimental
23
can be made such as selectivity (only one component exists in some part of the matrix), non-
negativity (for concentration and voltammetric signals), unimodality (single peak shape of
concentration profiles and or pure voltammograms), closure (mass balance application) and
signal shape (fitting signals to empirical equations) [47]. The error associated with
decomposition of the original current matrix is expressed as the percentage of lack of fit (lof) as
the following equation:
Where Iij are the element of the original current matrix Iij, and resulting matrix
calculated from the product of C and VT by ALS analysis.
In the case that any of the signals moves along the potential axis during the titration, the linearity
of the signal decreases and a correction is necessary prior to the use of MCR-ALS. This can be
done by shiftfit/shifitcalc program which is developed on the Matlab. Before the correction of
the potential shift estimation of the initial reference voltamograme is required by a program
called peak maker on Matlab that generate Gaussian peaks according to the equation:
(10)
Whose characteristic parameters (height a, position b and width c) are selected manually with the
mouse by visual comparison to the data matrix (I). The peaks are then integrated into a matrix
that can be used whether as a set of reference voltammograms (V0) to be applied in shiftfit or as
an initial estimation of the pure voltammograms (V) used to start the MCR-ALS iterations. This
is done from the 2D plot of the experimental data matrix by moving the curser of the mouse on
the top of the possible components and pressing the mouse button. Then the parameters a, b, and
c are defined and the guasian peak for each component is established on the experimental 2D
(9)

Experimental
24
current matrix. Using the initial reference voltamograms (Vo) developed the shift correction is
done. Figure 9 show that the combined application of shiftfit and shiftcalc to an experimental
matrix Iexp affected by lateral movement of one or more signals.
.
Figure9. Flowchart for potential shift correction for MCR-ALS analysis applied for experimental
data matrix Iexp ( A.Alberich et al).

Experimental
25
To describe briefly how the function works shiftcalc displaces every voltammogram from the
experimental matrix, Iexp, a given potential ∆E to produce a matrix Ishift and shiftfit optimize the
value of ∆E iteratively to produce a new matrix Icor that has a fixed potential as assigned in the
Vo matrix (a matrix which is defined intuitively from the original experimental matrix), a
concentration matrix and a potential shift matrix ∆E. Then Icor can be treated by the usual MCR-
ALS to obtain optimized C and V matrices and ∆E can be used in further investigation for the
calculation of parameters for the complex such as stability constant by fitting hard models
developed by the DeFord and Hume [48] according to the following equation:
(11)
where F0 is the Leden function of zero order, F is the Faraday unit of charge, E0, I0 are the
characteristic potential and current, respectively, measured for the free metal ion in the absence
of the ligand, E, I, are the same parameters obtained for a bulk concentration cL of the ligand and
βi are the successive overall stability constants of the formed complexes (with i ranging from 1 to
m).

RESULTS AND
DISCUSSIONS

Result and Discussion
26
3. RESULTS AND DISCUSSION
3.1 ESI-MS Experiments
Electro spray ionization mass spectrometry (ESI-MS) is a versatile and efficient spectrometric
technique that allows a definitive identification of stoichiometries of ionic complexes through
interpretation of uncomplicated and easy to understand mass spectra established by a plot of
relative abundance as a function of mass-to-charge ratio (m/z) for the species detected in the gas
phase [ 23,45,50]. In electro spray mode of ionization soft energy is employed for ionization of
the analyte species which enables one to get prominent peaks for unfragmented molecular ionic
species in the mass spectrum unlike the other mode of ionization technique that are
conventionally used in mass spectroscopic techniques. Therefore, the technique is highly
desirable for the study of protein- metal complexes [50]. In this study the influence of adsorption
of peptide ligands on the Bismuth film electrode on the Cd2+
- thiol complexation is examined to
evaluate the potentiality of Bismuth-based electrodes for metal-thiol complexation studies. In
addition the result of ESI-MS experiment was used to get supportive information for proposal of
complexation mechanism for PC2 and GSH with Cd under the given experimental condition.
Positive ion ESI-MS has been applied for various proportion mixtures of Cd2+
, Bi3+
, GSH and
PC2 in NH4/AC buffer solution. In a previous investigation on metal complexation process by
ESI-MS incubation of the metals-ligand mixture for 12 hour was required for total complexation
reaction [50]. However in this study mixture solutions were prepared freshly to reproduce the
electrochemical measurement conditions. The more intense peaks observed in the spectra are
presented in Table 1 as m/z values. Peak assignments are listed according to the general formula:
m/z = [CdxBiy(GSH)z-nH] +
(12)
Where the dominant isotopic mass for Cd = 114, Bi =209, GSH= 307 and H=1 and the value of
x, y, and z are selected to assign the observed m/z values. Also the value of n corresponds to the
number of hydrogen that must be removed or added to optimize the observed m/z charge and
mass which is equal to 2 x +3y-1.

Result and Discussion
27
Solution
Components Molar Ratio of
the Components
Mass –to-
charge m/z +ve Assignment
Intensity
(number of
counts)
2:1 179 [Cys-Gly+H]+ 2.00E+05
308 [GSH+H]+ 2.00E+06
Cd,GSH 615 [(GSH) 2+H]+ 7.90E+05
419 [Cd(GSH)-H]+ 9.00E+02
725.44 [Cd(GSH)2-H]+ 4.80E+02
1:1 179 [Cys-Gly+H]+ 4.19E+05
308 [GSH+H]+ 5.00E+04
615 [(GSH) 2+H]+ 8.00E+05
419 [Cd(GSH)-H]+ 9.00E+03
725.44 [Cd(GSH)2-H]+ 4.80E+02
1:2 179 [Cys-Gly+H]+ 5.00E+04
308 [GSH+H]+ 8.00E+05
615 [(GSH)2+H]+ 3.00E+04
419 [Cd(GSH)-H]+ 1.00E+04
725.44 [Cd(GSH)2-H]+ 4.60E+03
836.94 [Cd2 (GSH)-H]+ 6.20E+02
Bi,GSH 2:1 179 [Cys-Gly+H]+ 4.00E+04
308 [GSH+H]+ 3.00E+05
514 Bi(GSH)-H]+ 1.00E+03
820.9 [Bi(GSH)2-H]+ 3.00E+03
1:1 179 [Cys-Gly+H]+ 2.00E+05
308 [GSH+H]+ 2.00E+06
615 [(GSH) 2+H]+ 1.00E+03
514 [Cd(GSH)-H]+ 2.00E+03
820.9 [Cd(GSH)2-H]+ 6.00E+02
1:2 179 [Cys-Gly+H]+ 8.00E+04
308 [GSH+H]+ 2.80E+05
615 [(GSH) 2+H]+ 4.40E+04
514 [Bi(GSH)-H]+ 1.90E+05
820.9 [Bi(GSH)2-H]+ 3.00E+05
Table 1.ESI-MS for data of a binary solution of GSH/Cd(II) and GSH/Bi(III) in 1:9 acetonitrile:
20 mM ammonium acetate in water at pH 7.5.

Result and Discussion
28
Solution
Components
Molar ratio of
the Components
m/z +ve(int.%) Assignment
Intensity
(number of
counts)
Table 2.ESI-MS for data for ternary solution of GSH, Cd(II), and Bi (III) in 1:9 acetonitrile: 20
mM ammonium acetate in water at pH 7.5.
Cd,Bi,GSH 1:1:1 308 [GSH+H]+ 1.40E+05
179 [Cys-Gly+H]+ 2.00E+04
615.06 [(GSH)2+H]+ 4.00E+03
514 [Bi(GSH)-2H]+ 1.75E+04
820.9 [Bi(GSH)2-2H]+ 3.50E+04
Cd,Bi,GSH 1:1:2 308 [GSH+H]+ 1.60E+06
179 [Cys-Gly+H]+ 1.00E+04
615.06 [(GSH)2-H]+ 9.50E+04
514 [Bi(GSH)-2H]+ 4.75E+04
820.9 [Bi(GSH)2-2H]+ 1.60E+05
Cd,Bi,GSH 2:2:1 308 [GSH+H]+ 1.00E+05
179 [Cys-Gly+H]+ 6.00E+03
615.06 [(GSH)2-H]+ 6.50E+03
514 [Bi(GSH)-2H]+ 9.50E+04
820.9 [Bi(GSH)2-2H]+ 5.00E+03
Cd,Bi,GSH 1:2:1 308 [GSH+H]+ 7.00E+05
179 [Cys-Gly+H]+ 3.60E+04
615.06 [(GSH)2-H]+ 1.50E+04
514 [Bi(GSH)-2H]+ 1.00E+04
820.9 [Bi(GSH)2-2H]+ 1.60E+04
Cd,Bi,GSH 2:1:1 308 [GSH+H]+ 1.60E+06
179 [Cys-Gly+H]+ 7.00E+04
725.44 [Cd(GSH)2-H]+ 5.80E+03
514 [Bi(GSH)-2H]+ 1.50E+04
820.9 [Bi(GSH)2-2H]+ 1.00E+05
Cd,Bi,GSH 1:1:4 308 [GSH+H]+ 7.50E+05
179 [Cys-Gly+H]+ 6.00E+04
615.06 [(GSH)2 + H]+ 5.00E+05
514 [Bi(GSH)-2H]+ 7.00E+04
820.9 [Bi(GSH)2-2H]+ 1.00E+05

Result and Discussion
29
Characteristic natural abundance isotopic pattern of cadmium was also used for definitive
assignation of the observed m/z by comparison of the experimental pattern with a statically
determined pattern [50].
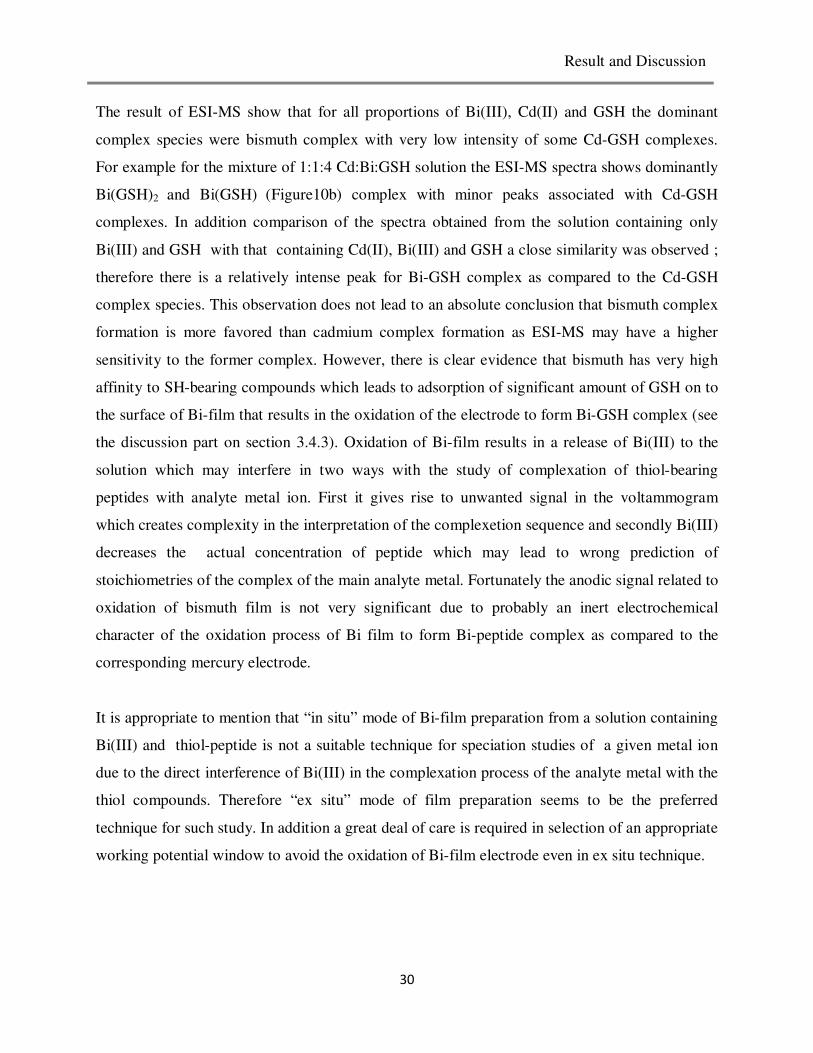
Figure10. Electrospray ionization mass spectrum (ESI-MS) for (a) 1:4 (Bi:GSH) and (b) 1:1:4
(Cd:Bi:GSH) in 10% acetonitrile-0.02 M Ammonum acetate in water.
[Bi(GSH)2-2H]+
[GSH +H]+
[Bi(GSH)2-2H]+
[Cys-Gly+H]+
[Bi(GSH) -2H]+
[GSH +H]+
(a)
(b)
[Cys-Gly+H]+
[Bi(GSH) -2H]+
Result and Discussion
30
The result of ESI-MS show that for all proportions of Bi(III), Cd(II) and GSH the dominant
complex species were bismuth complex with very low intensity of some Cd-GSH complexes.
For example for the mixture of 1:1:4 Cd:Bi:GSH solution the ESI-MS spectra shows dominantly
Bi(GSH)2 and Bi(GSH) (Figure10b) complex with minor peaks associated with Cd-GSH
complexes. In addition comparison of the spectra obtained from the solution containing only
Bi(III) and GSH with that containing Cd(II), Bi(III) and GSH a close similarity was observed ;
therefore there is a relatively intense peak for Bi-GSH complex as compared to the Cd-GSH
complex species. This observation does not lead to an absolute conclusion that bismuth complex
formation is more favored than cadmium complex formation as ESI-MS may have a higher
sensitivity to the former complex. However, there is clear evidence that bismuth has very high
affinity to SH-bearing compounds which leads to adsorption of significant amount of GSH on to
the surface of Bi-film that results in the oxidation of the electrode to form Bi-GSH complex (see
the discussion part on section 3.4.3). Oxidation of Bi-film results in a release of Bi(III) to the
solution which may interfere in two ways with the study of complexation of thiol-bearing
peptides with analyte metal ion. First it gives rise to unwanted signal in the voltammogram
which creates complexity in the interpretation of the complexetion sequence and secondly Bi(III)
decreases the actual concentration of peptide which may lead to wrong prediction of
stoichiometries of the complex of the main analyte metal. Fortunately the anodic signal related to
oxidation of bismuth film is not very significant due to probably an inert electrochemical
character of the oxidation process of Bi film to form Bi-peptide complex as compared to the
corresponding mercury electrode.
It is appropriate to mention that “in situ” mode of Bi-film preparation from a solution containing
Bi(III) and thiol-peptide is not a suitable technique for speciation studies of a given metal ion
due to the direct interference of Bi(III) in the complexation process of the analyte metal with the
thiol compounds. Therefore “ex situ” mode of film preparation seems to be the preferred
technique for such study. In addition a great deal of care is required in selection of an appropriate
working potential window to avoid the oxidation of Bi-film electrode even in ex situ technique.

Result and Discussion
31
3.2 Selection of the Working Potential Window
Previously the potential window for BiFE in stripping analysis was assessed in acetate buffer
and it was pointed out that basic pH conditions give the widest potential range with minimum
solvent reduction signal [33]. To confirm this fact and to find the widest potential window for the
case of BiSPCE buffer solutions with varying pH values were investigated. Cyclic voltammetric
measurements were done inside the potential range of -0.5 and -1.6 V for 0.01 M maleic-maleate
buffer at pH 6.4 and 0.05 M borate buffer system at pH 7.0, 7.5 and 8.5. The appropriate
potential window for each system is limited by reduction of solvent in the negative side and
oxidation of bismuth film in the positive direction. As it can be seen from Figure 11 the widest
potential window is observed in alkaline conditions (7.5 or 8.5). However there was no much
difference in the potential width between pH 7.5 and 8.5 and the former is preferable for
speciation studies as it is close to the natural conditions. In addition, to select the appropriate
potential window considering BiSPCE +0.5 V and -1.6 V were set as first vertex and second
vertex potential respectively for the system of 0.05 M borate buffer at pH 7.5. According to
Figure12 the positive and negative potentials are limited at -0.25 V and -1.5 V by oxidation of
bismuth film and reduction of the solvent respectively.
Figure11. CV Voltamograms for the different buffer solution at scan rate of 0.1V/s :(a) 0.01
maleic-malete buffer pH 6.4 (b) 0.05 borate buffer pH 7.0 (c) 0.05 borate buffer pH 7.5 (d) 0.05
borate buffer pH 8.5.
a
b
c d

Result and Discussion
32
Figure12. CV voltammogram for 0.05 borate buffer solution at pH 7.5 and scan rate of 0.1V/s
with first and second vertex potential at -1.6 and 0.5V vs Ag/AgCl.
3.3 Effect of pH on the Electrochemical Reaction of Cadmium Complex on BiSPCE
As a complementary work for the above preliminary investigation, the effect of pH on the
electrode response for complex and free metal was investigated at various pH values. For thiol
metal complexation process the removal of proton from sulfur group is required [51]. Therefore
theoretically it is expected that complexation process is far to complete when the pH of the
reaction medium is fairly high. Therefore it seems that higher pH value may help to improve the
low sensitivity problem of bismuth based electrodes to thiol-metal complex by mounting the
yield of the complex formed. However the repeatability of the peak intensity and the stability of
the peak potential should be evaluated at various pH to make sure that the data obtained are
suitable for further chemometrical analysis before choosing the best pH value.
The peak intensity of the complex and the free metal reduction signals were monitored at various
pH values (6.4, 7.0, 7.5, and 8.0) in 0.01 M maleic-maleate buffer system at pH 6.4 and 0.05 M
Borate buffer for the rest of pH values. The effect of pH on the peak intensity of 1:2 Cd: GSH is
shown in Figure 13 and also the plot of peak current against the pH value can be seen in Figure
14. The peak current associated with Cd-GSH complex reduction signal increases from 6.4 to 7.5
and drops sharply for pH values higher than 7.5. In contrast, the effect of pH on the free metal

Result and Discussion
33
reduction signal intensity is negligible as compared to its effect on the complex signal. This
suggests that the optimum working pH for thiol complexation studies on BiSPCE is at slightly
basic medium. At lower pH the thiol site of the ligand molecules are prtotonated and
consequently the complexation process is hindered and the signal will have very low intensity.
On the other hand higher pH values possibly affect the peak intensity of the complex signal due
to passivation of the electrode surface with hydroxide ions.
Figure 13. The effect of pH on the peak intensity of the1:2 Cd: GSH complex reduction signal
( 8x10⁻⁵
M GSH and Cd2+
)
Figure14. Peak current vs pH plot showing the effect of pH on the peak intensity of the 1:2 Cd-
GSH complex signal.
6 6.5 7 7.5 8 8.5 90.6
0.8
1
1.2
1.4
1.6
1.8x 10
-6
E/V
I/A

Result and Discussion
34
The stability of the reduction signal associated with the metal and the complex on BiSPCE was
assessed since a highly reproducible data is required to fulfill the necessary conditions for the
subsequent MCR-ALS analysis as stated previously. The peak current repeatability and peak
potential stability for 1:2 GSH:Cd mixture were estimated by calculating % RSD from six
repeated measurements at the various pH values. The peak intensity variability and peak
potential stability for the complex signals were observed to be small at the lowest pH value (6.4)
relative to the results obtained at higher pH values (Table 3). Anyways, the variability of peak
intensity and stability of peak potential at all pH values were not significantly different from
each other. Similar observations were seen for the free metal reduction signal. However
significant potential shift was observed for both free metal and complex signals going from
lower pH values to the higher values as potential is dependent on the pH of the medium [51].
Generally for reversible system the peak potential (half-wave potential) and pH of the medium at
25oC are related as:
E=Econt-(mRT/nF)pH (13)
Where m and n corresponds to the number of protons and electrons involved in the electrode
reactions, respectively [51]. In consistency with this fact the peak potentials for the reduction of
the complex signal were observed on average at -0.80, -0.85, -0.88, and -0.940 at pH 6.4, 7.0, 7.5
and 8.5 respectively.
From the potential window optimization and the study of the effect of pH on the current and
peak potential it is reasonable to select pH 7.5 for further complexation study of cadmium with
thiol-peptides in borate buffer on BiSPCE.
pH Average peak
current, Ip(A)
Average peak
potential, Ep(V)
CV% of Ip CV% of Ep
6.4 6.00x10⁻⁷
-0.80 3.5 0.58
7.0 1.05x10⁻⁶
-0.85 5.3 0.56
7.5 1.75x10⁻⁶
-0.88 7.9 0.61
8.5 1.50x10⁻⁶
-0.94 11.2 0.63
Table3. Repeatability of Peak current and stability of peak potential (n= 6) at various pH values.

Result and Discussion
35
3.4. Free Metal Reduction Signal on the Absence of Ligands
3.4.1 Free Metal Reduction Signal on the BiFE
To figure out thiol metal complexation process it is worth to see the electrochemical behavior of
the free metal and free ligand on BiSPCE and BiFE at the current experimental condition. In a
recent paper it was pointed out that the reduction signal of Cd(II) splits on BiFE in both
differential pulse stripping voltammetric and stripping chronpotentiometric analysis [27]. For
this reason the concentration range of Cd(II) that give reduction signal profile on the BiFE
similar to the signal observed on MFE was also investigated to apply BiFE for complexation
studies in the same manner as the corresponding MFE [34]. The signal splitting of cadmium
reduction on BiFE was also observed in this study in borate buffer solution at pH 7.5. In the
beginning two peaks were observed one at -0.7 and the other at -0.85V (Figure 15). The peak at
the more positive potential stabilizes at higher cadmium concentration while the other peak
increases up to the cadmium concentration of around 5.5x10⁻⁵
M and then it starts to be splitted
to give a new third peak (Figure 15). The old peak is stabilized while the new third peak
increases continuously with increasing cadmium concentration.
Figure15. Differential pulse voltammogram of Cd(II) on BiFE at different concentration of
Cadmium in Borate buffer at pH 7.5

Result and Discussion
36
Figure16. The corresponding calibration curve for Cd(II) in borate buffer at pH 7.5
1 2 3 4 5 6 7 8 9 100
0.2
0.4
0.6
0.8
1
Number of Components
No
rma
lize
d S
ing
ula
r V
alu
es
Figure17. Normalized singular value generated from the data matrix shown in Figure 15.

Result and Discussion
37
Even if only a single species, free metal, exist in the system MCR-ALS analysis was applied to
the experimental data matrix for a better understanding of the signal splitting pattern. Starting
from the result of SVD (Figure17) for the data matrix (Figure15) three components system was
assumed with constraints of non-negativity for both signals and concentrations and signal shape
for all components. However the lack of fit was very high (27%) and this is mainly because of
the continuous movement of the potential of the peaks under this experimental condition which
decreases the linearity of the data. Anyways, there is a clear evidence for the presence of Cd(II)
reduction signal splitting phenomena on BiFE in borate buffer at pH 7.5. In spite of the splitting
behavior of the signal of free Cd(II) quantitative analysis of the free cadmium metal is still
possible as the total area of all peak should be directly proportional to the concentration of Cd(II)
present in the solution. Figure16 shows the calibration plot of peak area against the concentration
of Cd(II) in the solution. A deviation from linearity was observed for higher cadmium
concentration due to the BiFE’s surface saturation.
3.4.2 Free Metal Reduction Signal on BiSPCE
In contrast to BiFE a notable signal splitting was not observed in the reduction signal of Cd(II)
at pH 7.5 (borate buffer) when BiSPCE electrode was used (Figure 18). This may be a good
improvement of bismuth film electrode as it minimizes the complexity that arises from signal
splitting when the thiol– metal complexation sequence is studied on this electrode. Specifically
this property of BiSPCE is essential for evaluating stoichiometries and stability constants of
metal complexes with various ligands.
The comparison between BiSPCE and BiFE reveals that the sensitivity for Cd(II) reduction is
higher on BiSPCE electrode (Figure 19), which could be due to the higher electrode area of the
screen printed electrode and rough surface structure (Figure20) which provides a better condition
for platting of bismuth that consequently enhance the reduction of Cd(II) from the bulk solution.
In addition the corresponding linearity range was wider on BiSPCE in comparison to BiFE
which ensures the potentiality of BiSPCE for metal determination and titration in a relatively
wide concentration range.

Result and Discussion
38
Figure 18 Differential pulse voltammogram on BiSPCE for increasing addition of Cd to borate
buffer at pH 7.5.
Figure19. The corresponding calibration curve for Cd(II) in borate buffer at 7.5

Result and Discussion
39
Figure20. Scanning electron microscopy images of: (a) a bare screen printed carbon electrode;
(b) a bar glassy carbon electrode (A.Economu, Trends in analytical chemistry 24 (2005) 334).
3.4.3 Free Ligand Reduction Signal on SPCE and BiFE
As observed for the case of mercury electrodes [52] it is believed that thiol compounds are
adsorbed on the other type of electrode material including bismuth film electrodes according to
the following:
nGSH + Bi(0) Bi(GSH)n(ads) + nH + ne- (14)
Hence, the diffusion controlled oxidation signal that corresponds to the above chemical reaction
corresponds to the oxidation of bismuth followed by the formation of bismuth–thiols adduct
(Equation 14). The anodic current does not diminish to the charging current, as would have been
expected if bismuth surface had been covered with the thiol blocking layer. This confirms that
the thiol species continuously react with the bismuth film surface as long as the potential is fixed
more than - 0.63 (see the following discussion).
In a previous study of lead-phytochelatin complexation on BiFE in maleic-maleate buffer (pH
6.4) anodic oxidation of the electrode material by the free thiol peptides was observed as a broad
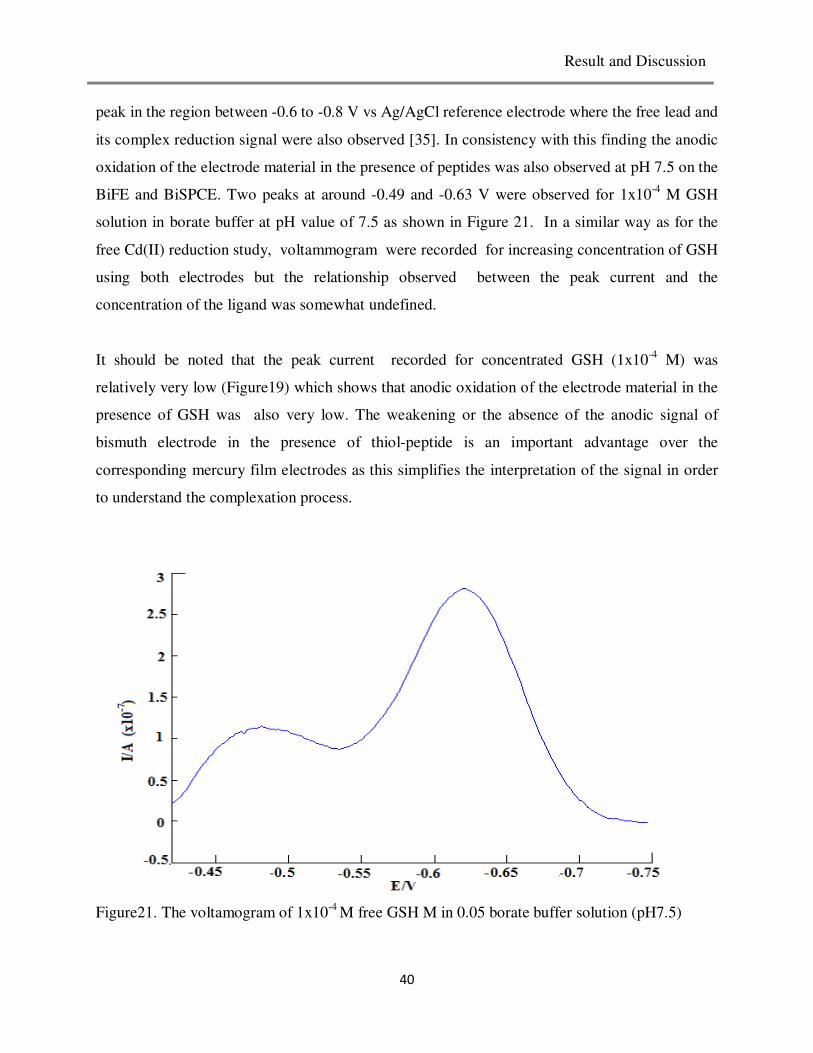
Result and Discussion
40
peak in the region between -0.6 to -0.8 V vs Ag/AgCl reference electrode where the free lead and
its complex reduction signal were also observed [35]. In consistency with this finding the anodic
oxidation of the electrode material in the presence of peptides was also observed at pH 7.5 on the
BiFE and BiSPCE. Two peaks at around -0.49 and -0.63 V were observed for 1x10⁻⁴
M GSH
solution in borate buffer at pH value of 7.5 as shown in Figure 21. In a similar way as for the
free Cd(II) reduction study, voltammogram were recorded for increasing concentration of GSH
using both electrodes but the relationship observed between the peak current and the
concentration of the ligand was somewhat undefined.
It should be noted that the peak current recorded for concentrated GSH (1x10⁻⁴
M) was
relatively very low (Figure19) which shows that anodic oxidation of the electrode material in the
presence of GSH was also very low. The weakening or the absence of the anodic signal of
bismuth electrode in the presence of thiol-peptide is an important advantage over the
corresponding mercury film electrodes as this simplifies the interpretation of the signal in order
to understand the complexation process.
Figure21. The voltamogram of 1x10⁻⁴
M free GSH M in 0.05 borate buffer solution (pH7.5)

Result and Discussion
41
3.4 Complexation Study of Cd with Glutathione
3.4.1 Adsorptive Cathodic Stripping Voltammetry
Study of thiol complexation at lower metal concentration is advantageous to model exactly the
detoxification mechanism at cellular level. In addition at lower concentrations of the peptides
and metals the signal intensity and concentration of all the chemical species show linear
relationship which allows applying MCR-ALS chemometrical methodologies to extract abundant
information for the complexation sequence. An attempt was made to study at lower
concentration (starting from 1x10⁻⁶
M) however no signal was observed for the complex species
except an intense signal associated with the free metal reduction signal.
Consequently, adsorptive cathodic stripping voltammetry was applied to accumulate complex
species on to the the Bi-film electrode surface by applying a constant potential for a given period
of time and then latter scanning in the negative potential direction to reduce the accumulated
species quantitatively. To select the best value of the key experimental parameters (i.e. the
adsorption potential and the accumulation time) various adsorptive cathodic stripping
voltammetry experiments were done. First the optimum adsorption potential was searched by
applying potential of -0.5, -0.6 and -0.7 V vs Ag/AgCl reference electrode and then latter
scanning from -0.4 to -1.1V. It was observed at -0.6V a better signal enhancement. Next
considering this potential the optimum accumulation time was selected from 60, 90,120,180 and
240s and the signal intensity was not observed to improve after 120s consequently this
accumulation time was taken as the optimal time.
Therefore, -0.6 V and 120 s were used as the adsorptive potential and accumulation potential
respectively for the study of Cd-GSH complexation by adsorptive cathodic stripping analysis at
concentration of 1x10⁻⁶
M for both Cd2+
and peptide. However a well established pattern
between the signal intensity of the complex and concentration of the metal and the petide could
not be seen. This is partly due to none reversible electrochemical character of these species as a
consequence of their strong adsorption on to the surface of the electrode. Therefore differential

Result and Discussion
42
pulse voltammetric technique was applied at higher concentration of the metal and the ligand
(2x10⁻⁵
M) for qualitative purpose of interpretation.
3.4.2 Cd-GSH System on BiFE
To see the evolution of the complexation process differential pulse voltammetric titrations were
done in two ways: addition of 1x10⁻³
M Cd to 2x10⁻⁵
M GSH solution and the reverse process,
addition of 1x10⁻³
M GSH solution to 2x10⁻⁵
Cd solution in borate buffer solution at pH 7.5.
However, the first mode of titration gave more detail and sufficient information and was selected
to explain the complexation process. In this mode of titration, before the first addition of Cd to
the GSH, a small peak at around -0.63 V was observed which further decreases and disappears
after addition of cadmium solution as shown in Figure 22. By analogy to the previous study of
SH-bearing compounds complexation with metals on BiFE [34] and to the signals observed for
free GSH on BiSPCE in this study; this signal is associated with the anodic oxidation of Bi
electrode in the presence of GHS. By comparing the peak potential of the free Cd(II) in the
absence of ligand with that of the peak located at -0.85 V it can be concluded that this
reduction signal can be related to a fraction of free Cd(II) associated with an electrochemically
labile complex as its potential position continuously shifts to the more positive side with
increasing concentration of Cd(II). Also the peak observed at -0.95 V is related to the reduction
signal of 1:2 Cd:GSH complex according to A.Alberich et al [34] which reports stabilization of a
similar signal at Cd:GSH ratio around 0.5. In this study the anodic signal associated with Cd-
GSH complex was not very important and could not be clearly seen in the expected potential
region (by the positive potential side close to the free metal reduction signal). However its
existence is clear, since it was observed in the beginning of the titration and before it was
dominated by the intense signal of the Cd(II) reduction. In the Pb-GSH complexation study on
BiFE the anodic signal was observed overlapped with the free metal reduction signal. Howevere
in the case of Cd-GSH complexation, the anodic signal was well separated from the Cd(II)
reduction signal.
MCR-ALS was not applied for this case as the free metal concentrations are out of the linear
range and due to the presence of anodic oxidation signals of the free peptide under this

Result and Discussion
43
experimental condition whose evolution pattern is quite unpredictable. In addition the shape of
the free metal reduction voltammograms changes continuously which hinder the correct
application of MCR- ALS methodology. However the observed signals are relatively well
separated as compared to the corresponding signals observed on mercury electrodes [51]
therefore there is a way to analyse the trend of the pure components during the titration process
qualitatively. To do so the peak intensity of free metal and the complex signals were plotted
against the ratio of cadmium added to the initial peptide concentration (Cd:GSH) (Figure 23).
Figure 23a shows that as the Cd:GSH ratio increases, the 1:2 Cd:GSH complex reduction signal
(located at -0.94 V) grows sharply to reach a plateau at a concentration ratio of 0.5. This result is
quite consistent with a previous study made using polarographic techniques [51]. Figure 23b
shows the evolution of the Cd(II) reduction signal which includes the labile complex and the
free metal. The attempt to explain the evolution of the free metal and the labile complex
concentration profile was not consistent with a previous finding as the free metal is not expected
to exist before the ratio of 0.25 [51]. Also a change in the slope is expected at Cd:GSH ratio of
around 1.0 due to the appearance of free metal but this was not observed in this case as Figure23
b shows. The most probable reason for this deviation is the splitting of the free metal signal
which creates ambiguity for the assignment of the peaks for the free metal and labile complex. In
the case of Pb-GSH complexation study on BiFE where signal splitting of free metal reduction
signal is absent a clear change of peak intensity and peak potential shift was observed which
means the appearance of free lead at higher Pb:GSH concentration ratio [34]. Therefore to get
clear information about the complexation process of Cd-GSH system either the concentration of
the metal ion should be very low, in the region where signal splitting is absent, or a different
electrode should be used. Then, the next step is to try if BiSPCE can improve the drawbacks of
BiFE, especially taking into account the absence of peak splitting for the free metal alone.

Result and Discussion
44
Figure 22. Differential voltamogram s measured during the titration of 2x10⁻⁵
M GSH with Cd
solution in borate buffer at pH 7.5 by using BiFE.
Figure 23. Peak current vs [Cd]:[GSH] ratio in borate buffer solution (a) for the complex signal
and (b) for the labile and free Cd reduction signal.

Result and Discussion
45
3.4.3 Cd-GSH system on BiSPCE
As stated above a better information is expected from the use of screen printed electrodes since
the signal splitting of the Cd(II) reduction is absent . An improvement in the peak intensity of the
signals is also expected as observed from the comparison of BiFE and BiSPCE sensitivity for the
metal. Comparing the results obtained using both electrodes, it can be seen that all the signal that
appear on BiFE are also present in BiSPCE (Figure 24). However the metal reduction signal on
BiSPCE is sharper than the corresponding in BiFE and the peak potentials for the free metal and
labile complex are relatively stable ( the lateral movement along the potential axis is reduced).
The difference in shape of the voltamograms is associated with the absence of splitting of Cd(II)
reduction signal on BiSPCE. As in the previous case, MCR-ALS analysis could not be applied
for BiSPCE due to the loss of linearity of the free metal reduction and the non familiar shape of
the voltamograms. However, as Figure 24 shows all the voltammograms are well separated and
qualitative analysis can be used for explanation of complexation process.
Figure 24. Differential voltamograms measured using the titration of 2x10⁻⁵
M GSH with Cd
solution in borate buffer at pH 7.5 by using BiSPCE.

Result and Discussion
46
Figure 25. Peak current intensity vs Cd:GSH rato (a) for the 1:2 Cd:GSH complex and (b) for the
total labile and free metal cadmium reduction signal
However it should be stated that some voltamograms recorded by this electrode had very
different peak potential position which was not observed in the case of BiFE. This indicates that
BiSPCE has lower reproducibility as compared to BiFE. Consequently these voltamograms were
removed from the data matrix before the data treatment step.
Like in the case of BiFE, at the beginning of the titration only the anodic signal for the free GSH
is observed , a signal which decreases with further addition of Cd(II) solution as shown in Figure
24. The peak current associated with the 1:2 Cd:GSH reduction signal increases sharply and
levels off when 0.5 Cd:GSH concentration ratio is reached (Figure 25a ) as observed in BiFE
and other previous studies [34,51]. The peak potential for this complex is quite stable, (Figure
24) which is quite consistent with previous observations showing the inert nature of Cd-GSH
formed between two GHS molecules and one Cd ion through the sulphur group of the ligand
(Figure 26).
With regards to the Cd(II) reduction process from the labile complex and free metal , Figure 25b
shows the total Cd(II) reduction profile contributed from the labile complex and the free Cd(II).
Accordingly, until a concentration ratio of 0.25 reduction of Cd(II) contributed from the labile
complex was not seen and this tells us that in the beginning of the titration Cd(II) ion forms
a b

Result and Discussion
47
preferably 1:2 stable complex and from the ratio of 0.25 reduction of Cd(II) starts and increases
sharply until the concentration ratio value of 1.0 is reached. Previously it was suggested by
M.S.Diaz-Cruz,et.al [51] that in this concentration ratio region the incoming Cd(II) is expected
to form complex of 2:2 Cd:GSH where the incoming Cd(II) is complexed probably with
carboxylate part of gluthation which was already complexed in 1:2 Cd-GSH with sulphur group
as shown in Figure 27.
Figure 26. Cd-GHS complex formation reaction at low Cd:GSH ratio
+ Cd2+
NHNH
NH2
O S
O
O
O
Cd
NHNH
NH2
O S
O
O
O
O
O-
O
O-
Cd
NHNH
NH2
O S
O
O
O-
Cd
NHNH
NH2
O S
O
O
O-
O
O-
O
O-
Figure27. Complex formation reaction for higher Cd:GSH ratios
Therefore in the concentration ratio region above 0.25 the labile and stable complexes exist
simultaneously even at higher metal concentration. This signifies that the electrochemical
process of the first complex (the stable one) is not substituted by the electrochemical response of
the second complex and the two complexes interact as shown in Figure 27. However, at higher
concentration ratios the dominant species is expected to be the 2:2 Cd:GSH complex. For higher
concentration ratio (Cd:GSH > 1) the free metal reduction signal starts to appear which is clearly
observed from the bending of the curve (Figure 25 b). The deflation of this curve is a result of
the loss of sensitivity of the electrode when its surface gets saturated by excessive metal ion
present in the solution.
+ Cd2+
NHNH
NH2
O S
O
O
O-
Cd
NHNH
NH2
O S
O
O
O-
O
O-
O
O-
NHNH
NH2
OS
-
O
O
O-
O
O-
2

Result and Discussion
48
From the above observation, it can be concluded that BiSPCE can be applied for speciation
studies of metals in the presence of relatively simple thiol peptides like GSH. Particularly for
metals like Cd(II) and Zn(II) whose reduction signal split on BiFE the use of BiSPCE is the best
optionto get comparable result with that of the conventional mercury electrodes whose use is
becoming unacceptable due to the adverse environmental implications.
3.5 (γ-Glu-Cys)2Gly Complexation with Cadmium Study on BiSPCE
Toevaluate the applicability of BiSPCE for metal complexation studies with phtochelatins PC2-
Cd complexation sequence was studied and the result was compared with previous studies. In a
similar way as in the study of Cd-GSH complexation, direct titration (i.e addition of 10-3
M PC2
into 2x10⁻⁵
M Cd2+
in 20 ml of buffer solution) and indirect titration (addition of 1x10⁻³
M Cd2+
to 2x10⁻⁵
M PC2) were performed. As the latter titration mode gave sufficient information
therefore it was selected to discuss the complexation process taking place between Cd and PC2.
Figure 28b shows the mesh plot for the current matrix produced during the titration process.
Before the addition of Cd2+
, anodic oxidation of the bismuth electrode (signal 1) was observed
at -0.65V which decreases and disappear upon the addition of Cd2+
solution. Again as the case of
Cd-GSH complexation anodic oxidation of the electrode material due to the presence of Cd- PC2
complex was very weak as compared to the case of mercury electrode [25]. Further additions of
Cd2+
produce a signal associated with complex reduction (signal 4) at around -1.0 V and then a
signal appears at -0.75 V ( signal 3) . Finally the free metal reduction signal is observed at high
metal to thiol ratios (signal 2).
To understand the concentration profile of the individual species present in the system during the
titration (free metal, complexes and free ligand) the usual MCR-ALS analysis was applied with
four component: one for the metal ion, two for the successive complexes and one for the free
ligand with the constraints of non-negativity and signal shape. But the lack of fit was much more
than the acceptable limit (27%) and for this reason the number of components was varied to
lower the error. However no improvement was observed. This is mainly due to loss of linearity
by the lateral movements of signals of some components along the potential axis [48].

Result and Discussion
49
-1.1-1-0.9-0.8-0.7-0.6-0.50
0.5
1
1.5
2
2.5
3x 10
-5
E/V
I/A
Figure28. (a) The voltammogram profile of the titration of 2x10⁻⁵
M of PC2 with 1x10⁻³
M of
Cd2+
in borate buffer solution at pH 7.5 (b) the corresponding mesh plot of the current data
matrix.
Due to this reason the alternative method was used, i.e. the shift of the potentials for those signal
whose peak potential is not at fixed position were corrected by a program shifcalc/shiftfit before
resolving the full data matrix by MCR-ALS as explained in section 2.6. Then the concentration
profile (C matrix) is obtained for all components and also additional information, shift potential
(∆E), is obtained which can be used for estimation of the stability constant of the labile
complex. In our case the best result was obtained by considering four components where three of
them have moving peaks along the potential axis while the remaining one shows stable peak
potential. A visual inspection of the experimental matrix depicted in Figure 29 a shows that all
the signals were moving except the first one (anodic oxidation of the electrode material
associated with the free peptide). Due to the weak intensity of this anodic signal, it can hardly
affect the linearity of the data even if there is a significant movement along the potential axis.
Therefore potential shift correction was not applied for this signal (∆E = 0).
After peak potential movement correction by shiftfit/shiftcal with reference to the unitary
voltamogram, Vo (Figure 29 a) MCR-ALS was applied by assuming the four components
defined by a single peak and applying the constraints of non-negativity (for both concentrations
(a) (b)

Result and Discussion
50
-1.1-1-0.9-0.8-0.7-0.6-0.50
0.5
1
1.5
2
2.5
3x 10
-5
E/V
I/A
-1.1-1-0.9-0.8-0.7-0.6-0.50
0.5
1
1.5
2
2.5
3x 10
-5
E/V
I/A
-1.1-1.05-1-0.95-0.9-0.85-0.8-0.75-0.7-0.65-0.60
0.2
0.4
0.6
0.8
1
E/V
No
rma
lize
d c
urr
en
t
and signals), selectivity and signal shape. Based on the above assumption, the lack of fit for the
matrix decomposition was improved to 7.6% which is much better than the error observed for
MCR-ALS analysis without potential peak correction step.
Figure 29. Analysis of the experimental data matrix produced from titration of 2x10⁻⁵
M PC2
with 1x10⁻³
M Cd in 0.05 borate buffer solution at pH 7.5 ; (a) estimation of the initial reference
voltammogram from the experimental data matrix (b) the application of shiftfit/shiftcalc for
correction of signals movements in the potential axis to produce corrected matrix (Icorr) (c)
application of MCR-ALS for the decomposition of Icorr into pure voltammograms and (d)
concentration matrix (C).
b a
d
4
3 2 1
1
4
2
3

Result and Discussion
51
Figure 29 summarizes the results of MCR-ALS decomposition obtained together with the shift
correction. The pure signals (Figure 29c) are named according to the position of their signals
and, as stated previously from the free ligand and metal study, component 1 and 2 correspond to
the anodic signal of the electrode material and free metal reduction signal, respectively, whereas
component 3 and 4 correspond to the reduction of cadmium complexed with the peptides in two
different ways [51]. The evolution of their concentration profiles is depicted in Figure 29d and
the complexation process is explained as follows.
As stated previously it is observed that the anodic oxidation of the electrode material decreases
with addition of Cd2+
(component 1). In the beginning of the titration where the peptide
concentration is very high Cd2+
ion are believed to form 1:2 Cd-PC2 complexes as observed from
the fast increase of this complex concentration (component 4) until metal-ligand concentration
ratio around 0.5, where it reaches a plateau (Figure 29 d). This observation confirms that the
stoichiometry of the complex involves two peptide units per metal ion. The continuous
movement of the peak potential of the reduction signal of this species (Figure29 a) implies the
lability of the complex. Though at low cadmium-to-ligand ratios 1:4 stable compelexes where
Cd2+
ion coordinates tetrahedrally with four sulfur atoms of different peptides were observed as a
dominant species by 1H-NMR [53], XAFS [19] and some electrochemical methods [25] under
the experimental condition of this study this species could not be observed. The results of ESI-
MS experiment at lower metal– to-ligand ratio also proved the absence of this complex species.
Starting from the ratio of 0.25 the signal related with another complex starts to be observed
which stabilizes at the ratio 1.0 (component 3). Therefore the stoichiometry of this will be 1:1,
where one cadmium ion binds with at least one sulfur group of the peptide. The formation of 1:1
Cd-PC2 complex was observed starting from Cd-PC2 ratio of about 0.25 before the 1:2 Cd-to-PC2
formation is completed at around 0.5 Cd-to-PC2 ratio. This suggests the simultaneous formation
of 1:2 and 1:1 complexes instead of successive complex formation. At metal-to-ligand ratio
higher than around 1.0, where component 3 is stabilized, the free metal reduction is observed
which is indicated by the linear increment of component 2.
The matrix (Irep) which resembles the experimental matrix (Iexp) was produced from the
product CVT of the matrices obtained by MCR-ALS shifted by the shiftcalc program by using
the optimal ∆E values. In general a good reproduction of the experimental matrix was possible

Result and Discussion
52
from the result of MCR-ALS analysis. The error distribution along the potential axis is shown in
Figure 30(c).
Figure30. Error distributions along the potential axis(c) as a result of the deviation of the
reproduced marix , Irep (b) from the experimental matrix Iexp (a)
X10-5
X10-5
X10-5
2

Result and Discussion
53
It can be seen that an appropriate choice of the reference signals (Fig. 7b) produces a set of
potential shifts and current decreases (Fig. 7e) with a good reproduction of the original data
matrix (Fig. 7d), confirmed by a reasonable lof (6.7%).
ESI-MS experiments at various metal to ligand concentration ratios were done to detect the
available complex species in a particular solution with the view to get supportive information for
the complexation sequence suggested from the result of voltammetric method above.
Molar ratio of the
components (Cd:PC2)
m/z + ve(int.%)
Assignment
1:4 538.33 [PC2+H]+
1191 [Cd(PC2)2-H]+
1301 [Cd2(PC2)2 -H]+
(minor)
1:1 538.33 [PC2+H]+
652.013 [Cd(PC2)-H]+
1191 Cd(PC2)2-H]+
761.9 Cd3(PC2)2-H]+ (minor)
2:1 538.33 [PC2+H]+
652.013 [Cd(PC2)-H]+
1410
[Cd3(PC2)-H]+
(minor)
Table 4. ESI-MS data obtained for solutions containing PC2, Cd(II), and Bi(III) in various
proportion in 1:9 acetonitrile: 20 mM ammonium acetate in water at pH 7.5.
For a solution containing 1:4 Cadmium-to-PC2 the dominantly observed species were Cd(PC2)
and Cd(PC2)2 as shown in Table 4 which support the finding for the existence of both 1:1 and
1:2 complexes at lower metal–to-ligand ratio. Quantitative comparison of the peaks appearing
for those complexes in the various sample solution was difficult from the main mass spectra
spectrum due to the large peak associated with the uncomplexed PC2 that obscure the rest of the
peaks. However magnification of the individual peaks in the spectrum reveals that Cd2PC2 and
CdPC2 are the dominant species for higher metal concentration while Cd(PC2)2 species was

Result and Discussion
54
observed to be dominant at equal metal-to-ligand ratio and at relatively higher ligand
concentration. However significant amount of polynuclear metal complexes were not detected in
any sample solution.

CONCLUSIONS

Conclusion
55
4. CONCLUSION
The present study demonstrates the suitability of BiSPCE for metal speciation studies of
Cd2+ in the presence of thiol rich peptides with possibility of using MCR-ALS in some
cases.
The absence of signal splitting, wider linearity, and higher sensitivity was observed for
metal determination as compared to BiFE which support the suitability of BiSPCE for
metal speciation studies in relatively wide concentration ranges especially for metals
whose reduction signal splits on the use of BiFE that include Cd2+
and Zn2+
. The other
improvement observed on the use of BiSPCE is that the anodic signal associated with
the free ligand was significantly weakened in comparison to its existence on the
mercury electrode. In addition the entire set of signals observed using this electrode
were well separated in most cases and this may allow a qualitative and quantitative
analysis of the complexation sequence without the need of chemometrical support. The
other important fact observed is that BiSPCE showed a very high sensitivity to the free
metal reduction signal which implies the suitability of this electrode for metal
determination investigations. Although the reproducibility of this electrode was lower
than the corresponding BiFE its use for such speciation studies is still reasonable.
From the results of ESI-MS experiment, extensive complex formation of Bi(III) with
thiol peptides was observed, which restricts the use of in situ mode of Bi-film electrode
preparation from a solution containing Bi(III), peptides and the analyte metals.
Consequently in this study Bi-film was prepared on the screen printed carbon electrode
in ex situ mode and gave consistent results with previous studies made on Cd2+
metal
complexation with SH-bearing compounds on the conventional mercury electrode.
From optimization of the experimental conditions it was found that the best condition
was pH 7.5 in 0.05 borate buffer solution, which gave a wide working potential window
and a relatively good signal improvement for the reduction of the complexes species.
Due to the inert electrochemical character of Cd-GSH species on the bismuth film
electrode the complexation study at lower metal and peptide concentration (< 10-5 M),
which is the useful range for further chemometrical data analysis, was not possible. For
this reason adsorptive accumulation of the complex species on to the film electrode was

Conclusion
56
applied to achieve the study of complexation process at lower peptide and ligand
concentration. However no significant improvement of the signal intensity of the
reduction of those complex species was found and also a well established relationship
between the concentration of species and their respective signal intensity was not
observed. Therefore complexation process was done at higher metal and peptide
concentration for the purpose of qualitative interpretation of the complexation sequence
for GSH-Cd system. In contrast, a relatively better signal intensity was obtained for
complexes associated with Cd-PC2 therefore MCR-ALS was applied to extract
information about the stiochiometries of the various Cd-PC2 complexes formed after the
necessary data correction.

REFERENCES

References
57
5. REFERENCES
[1] T.W.Lane, M.A.Saito, G.N.George, I.J.Pickering, R.C.Prince, Nature 42 (2005) 435.
[2] M.P.Waalkes, S.Rehm, M.G. Cherian, Toxicol Sci. 54 (2000)104
[3] L.Sanitá di Toppi, R.Gabbrielli, Environmental and Experimental Botany 41 (1999) 105
[4] J. Deckert, Biometal. 18 (2005) 475.
[5] S.E. Manahan, “Environmental Chemistry”, 7th ed., Lewis Publishers: Boca Ratón, FL;
1999; p.p 203-205.
[6] Y.Wang , J.Fang, L.S.Stephen, K.Rao, K.Murali, Free Radical Biol Med. 36 (2004) 1434
[7] L.Lu, I.Chang, T.Hsiao, Y.Yu, H. Wong-Wen Ma, Env. Sci. Pollut. Res. 14 (2007) 49
[8] P. G. Campbell, Interactions between Trace Metals and Aquatic Organisms: A Critique of
the Free Ion Activity Model. In A. Tessier, & D. R. Turner (Eds.), Metal speciation and
bioavailability in aquatic systems Chichester, UK: John Wiley & Sons. pp. 45–102
[9] O.E.Natale , M.V .Leis, Lakes & Reservoirs: Research and Management 2008; 13: 231
[10] Di Toro, D.M., Allen, H.E.Bergman, H.L.Meyer, J.S.Paquin, Environmental Toxicology
and Chemistry 10 (2001) 2397
[11] C.Lamelas, K. J.Wilkinson, V.I.Slaveykova, Environ. Sci. Technol. 39 (2005) 6109.
[12] J. Buffle, Complexation reactions in aquatic systems: Ananalytical approach; Ellis
Harwood: Chichester, UK, 1988.
[13] E.M.Thurman, Organic geochemistry of natural waters; Kluwer Academic Publishers
Group: Dordrecht, 1985.
[14] R.C .Santore, Environmental Toxicology and Chemistry 20 (2001) 2383.
[15] S. C. Christopher, Plant Physiol 123 (2000) 825.
[16] S.Klapheck, S. Schlunz, L.Bergmann, Plant Physiol. 107 (1995) 515.

References
58
[17] N.Serrano, N.Martin, J.M.Diaz-Cruz, C.Arino, M.Esteban, Electroanalysis 21(2009) 431.
[18] H. Meinhart, Gen 179 (1996) 21.
[19] H. Strasdeit, A. Duhme, R. Kneer, H. Zenk ,C.Hermes , H.Nolting , Gen 179 (1991) 9.
[20] S.Gioacchino, M. Elisabeth, Bio Metals 15 (2002) 145.
[21] D.L.Rabenstein, A.A.Isab, W. Kadima, P. Mohanakrishnan, Biophysica Acta. 762 (1983)
531.
[22] C. Ammar, B. Mediouni, H.Tray, Biologia planetarium 52 (2008) 314.
[23] E. Chekmeneva, J.MDíaz-Cruz, C. Ariño, M.Esteban Environ. Sci. Technol. 42(2008)
2860.
[24] K.Rober, Electroanalysis 12 (2000) 15.
[25] B.H.Cruz, I.Sestakova, J.M.Diaz-Cruz, J.Velek, C.Arino, M.Esteban,
J.Electroanal.Chem.520 (2002) 1111.
[26] N.Serrano, I.Sestakova, J.M. Diaz-Cruz, C. Arino, Electroanalysis 18 (2006)169.
[27] N.Serrano, I.Sestakova, J.M. Diaz-Cruz, C. Arino, J.Electroanal.Chem. 591(2006)105.
[28] A.M.Brett , S.H.Serrano , I.G.Gutz, M.A.La-Scalea, Electroanalysis 9 (1997) 9110.
[29] D.Demetriades, A.Economou, A.Volugaropous, Anal.Chim.Acta. 43 (2001) 434.
[30] J.Wang, J.Lu, S.B.Hocevar, P.A.M. Farias, Anal.Chem.72 (2000) 3218.
[31] G.U. Flechsig, O. Korbout, S.B. Hocevar, S. Thongngamdee, B. Ogorevc, P. Gruendler ,
J. Wang, Electroanalysis 13 (2001) 1153.
[32] S. Grugeon, L. Dupont and J.M. Tarascon, Electrochemical commun. 407 (2000) 2390.
[33] E.A.Hutton, B.Ogorevc, S.B.Hocevar, F.Weldon, M.R.Smyth, J.Wang, Electrochem.
Commun. 3 (2001) 707.
References
59
[34] A.Alberich, N.Serrano, C.Arino, J.M.Diaz-Cruz, M.Esteban, Talanta 78 (2009) 1017.
[35] A. Krolicka, R. Pauliukaite, I. Svancara, R. Metelka, Bobrowski, E. Norkus, K. Kalcher,
K. Vytras, Electrochem. Commun. 4 (2002) 193.
[36] T. Demetriadis, A. Economou, A. Voulgaropoulos, Anal. Chim. Acta 519 (2004) 167.
[37] J. Wang, J.M. Lu, S.B. Hocevar, B. Ogorevc, Electroanalysis (NY) 13 (2001) 13.
[38] E.A. Hutton, S.B. Hočevar, B. Ogorevc, Anal. Chim. Acta 537 (2005) 285.
[39] M. Kovačevič, W. Goessler, Anal.Chim.acta. 537 (2005) 285.
[40] S.B. Hocevar, B. Ogorevc, J. Wang, B. Pihlar, Electroanalysis 14 (2002) 1707.
[41] I. Lavilla, C. Bendicho, Anal.Bioanal.Chem. 374 (2002 1115.
[42] Z. Fang, J.M. Harris, J. Ruzicka , E.H. Hansen, Anal.Chem. 57 (1985) 33.
[43] R. Pauliukaite, R. Metelka, I. Svancara, A. Krolicka, A. Bobrowski, K. Vytras, E.
Norkus, K. Kalcher, Anal. Bioanal. Chem. 374 (2002) 1155.
[44] Rashid O. Kadara, Norman Jenkinson, Craig E. Banks, Electroananlysis 21(2009) 2410.
[45] E.Chekmeneva, J.M.Díaz-Cruz, C.Ariño, M.Esteban, Environ. Sci. Technol. 43 (2009)
7010.
[46] The Matlab Version 7.3.0.267, Mathworks Inc., Natick. MA.USA 2006.
[47] M.Esteban , C.Arino, J.M.Diaz-Cruz, R.Tauler, Trends Anal.Chem.19 (2001) 49.
[48] A.Alberich, J.M.Diaz-Cruz, C.Arino, M.Esteban, Analyst 133 (2008) 112.
[49] W. Windig, J. Guilment. Interactive Self-Modeling Mixture Analysis, Anal. Chem. 63
(1991) 1425.
[50] N.Burford, D. Ealanie, K.Groom, Journal of Ionorganic Biochemistry 99 (2005) 1992.
[51] M.S.Diaz-Cruz; J.Mendieta; R.Tauler; M.Esteban, J.Inorg.Chem. 6 (1997) 29.

References
60
[52] N.Muskal, D.Mandler, Current Separation 19 (2000) 2.
[53] R.Kobyashi, E.Yoshimura, Biological Trace Element Research 114 (2006) 313.