Embed Size (px)
Citation preview

~ 1283 ~
Journal of Entomology and Zoology Studies 2017; 5(5): 1283-1295
E-ISSN: 2320-7078
P-ISSN: 2349-6800
JEZS 2017; 5(5): 1283-1295
© 2017 JEZS
Received: 17-07-2017
Accepted: 18-08-2017
Sidharth Prasad Mishra
Department of Animal Genetics
& Breeding, WBUAFS, Kolkata,
West Bengal, India
Chinmoy Mishra
Department of Animal Breeding
& Genetics, OUAT,
Bhubaneswar, Odisha, India
Debi Prasad Mishra
Department of Veterinary
Pharmacology and Toxicology,
OUAT, Bhubaneswar, Odisha,
India
BP Rosalin
Department of Agricultural
Metrological, Orissa University
of Agriculture and Technology,
Bhubaneswar, Odisha, India
Chinmaya Bhuyan
Department of Veterinary
Anatomy and Histology, Orissa
University of Agriculture and
Technology, Bhubaneswar,
Odisha, India
Correspondence
Sidharth Prasad Mishra
Department of Animal Genetics
& Breeding, WBUAFS, Kolkata,
West Bengal, India
Application of advanced molecular marker
technique for improvement of animal: A critical
review
Sidharth Prasad Mishra, Chinmoy Mishra, Debi Prasad Mishra, BP
Rosalin and Chinmaya Bhuyan
Abstract The present study was conducted in collaboration with Department of Animal Genetics and Breeding,
OUAT and WBUAFS to review on new class of advanced molecular marker techniques derived from
combination of earlier basic molecular marker for the genetic improvement of livestock from December,
2016 to June, 2017. In the protein coding region of mtDNA, the cytochrome oxidase I gene has recently
gained more attention in developing DNA barcodes for species identification and biodiversity analysis.
Among, nuclear marker techniques, RAPD and AFLP are being applied to cDNA based templates to
study patterns of gene expression through advanced technique like ESTs and SSCP. While RFPL and
microsatellites techniques are used for detecting marker-QTL linkages that accomplished by the use of
MAS, genetic fingerprinting and mixture models based on segregation analysis principle. The present
study objective was to review the utility of advanced molecular marker technology for selection and
genetic improvement of animals.
Keywords: DNA Barcoding, ESTs, mtDNA, QTL, MAS, SSCP
1. Introduction During last century animal breeders had exploited the application of methods based on
population genetics and statistics allowed the development of animals with a high productive
efficiency. These systems are based on simplified models of genic action that assume a large
number of or genes with small individual effects in the expression of the phenotype
(polygenes) and emphasizes the average genic effects (additive effects) over their interactions [1]. Traditionally, the genetic improvement of livestock breeds has been based on phenotypic
selection. The past century was characterized by the development of quantitative theory and
methodology towards the accurate selection and prediction of genetic response [1]. The basis is
predicting the breeding values of the animals using phenotypic and genealogical information.
Properties of the predictions are equivalent to the levels of correlated random effects of a
mixed linear model or best linear unbiased predictors (BLUP) which is based to a large extent
on the work of Henderson [2]. Important advances to some of the economically important
characters in several species of livestock has been achieved based on phenotypic performance,
however, several limitations of these methods of improvement based on population genetics
alone are becoming evident with time. Their efficiency decreases when the characteristics are
difficult to measure or have a low heritability. Later, phenotype based genetic markers for
Drosophila led to the establishment of the theory of genetic linkage [3]. This application used
external animal characteristics as a marker that called morphological markers (i.e. udder shape,
coat color, body shape, skin structure, and anatomical characteristics) [4]. These markers
depend on visual observation and measurement to identify, classify, and characterize the
genetic evolution of different species or populations. The conclusions reached through
applying morphological markers are often not completely accurate when they used for the
evaluation of farm animal genetic because these markers based on subjective, judgments, and
descriptions. Another type of markers represent by using of cytological markers that were
included several criteria such as chromosome karyotypes, bandings, repeats, translocations,
deletions, and inversions to investigate the genetic resources of animals [5]. The chromosome
mutations lead to genetic variation [6]. These mutations were used as markers to identify a
certain location of the gene on a specific chromosome.

~ 1284 ~
Journal of Entomology and Zoology Studies
In the domestic animals, cytological markers allow to
investigate their genetic diversity by comparing chromosome
number and structure between domesticated animals and their
wild ancestors [7]. Cytological markers still widely used in
elucidating the origin and classification of species [8] because
of its good properties; rapid, economic, and straightforward
technique. The third type of markers is biochemical markers
such as blood type and isozymes. These markers represent
biochemical traits that could be analyzed by protein
electrophoresis. The differences in the amino acid
composition of isozymes and soluble proteins were used to
investigate the genetic variation within species and
phylogenetic relationships between species [9]. The
application of these markers was limited because the proteins
and isozymes are not genetic materials. They are products of
gene expression, so they could affect by environmental
factors [10]. Yang et al. [5] mentioned that the molecular
markers are the most reliable markers available based on the
nucleotide sequence mutations within the individual’s
genome. Molecular markers offer numerous advantages over
conventional phenotype based alternatives as they are stable
and detectable in all tissues regardless of growth,
differentiation, development, or defense status of the cell are
not confounded by the environment, pleiotropic and epistatic
effects. Several types of molecular markers, including
mitochondrial DNA (mtDNA) and nuclear DNA markers, are
available but none of them can be regarded as optimal for all
applications [11]. For molecular analysis, these markers are
first amplified by PCR using conserved primers and the
amplicons are sequenced. Sequencing data are then aligned
and compared using appropriate bioinformatics tools.
Substantial advances have been made over the past decades
through the application of molecular genetics in the
identification of loci and chromosomal regions that contain
loci that affect traits of importance in livestock production [12].
This has enabled opportunities to enhance genetic
improvement programs in livestock by direct selection on
genes or genomic regions that affect economic traits through
marker-assisted selection and gene introgression [13].
Molecular methods play an important role in estimating the
genetic diversity among individuals by comparing the
genotypes at a number of polymorphic loci [14]. So, the
objective of the present review was to integrate the utility of
advanced molecular marker technology, pedigree data and
phenotypic information through the markers and polygenic
inheritance for selection, genetic development of animal and
their various applications in characterizing animal genetic
resources.
2. Molecular and Quantitative Genetics
The most economically important traits in livestock are
continuous distributed and found genetically in the form of
quantitative trait loci. So, to exploit the genetic variation
among such traits two types of models can be adopted on the
basis of quantitative genetics, the infinitesimal model and on
the basis of molecular genetics, the finite loci model [15]. The
infinitesimal model describes that the quantitative traits are
determined by an infinite number of unlinked and additive
loci each with an infinitesimally small effect [16]. This model
forms the root for the discovery of breeding value estimation
theory to determine the genetic merit of an individual for
selection [2]. The finite loci model is the concept applicable to
genome postulate that a finite amount of genetically inherited
material exist that guide the trait [17]. The inherited genetic
materials are confined at a particular location in a
chromosome called loci. The effect of these loci on
quantitative traits could be classified to few genes with large
effect and many genes of small effect [3]. To get familiarize
with molecular markers first approach is to finding the
candidate gene for the trait. A large number of candidate
genes may be affecting a particular, so many genes must be
sequence and a large sample of animals is needed. Usually, a
gene responsible for certain trait could undergo mutation
causing variation in that trait by changing the DNA sequences [18]. If the mutation occurred in non-coding DNA further
increases the amount of sequencing required. So, when the
mutation associated with the phenotypic variation for certain
trait that occurs in another gene is considered as a non-
candidate gene [19]. Till now, many types of molecular
markers have been discovered to detect the variation among
individual and population in gene level. These markers can be
classified into three groups; protein variants (allozymes),
DNA sequence polymorphism, DNA repeat variation [20]. In
1980s, with the invention of Polymerase chain reaction (PCR)
many different types of DNA based molecular markers had
been discovered e.g. Restriction Fragment Length
Polymorphism (RFLP), Random Amplified Polymorphic
DNA (RAPD), Amplified Fragment Length Polymorphism
(AFLP), Single-Strand Conformation Polymorphism (SSCP)
and Microsatellite DNA. All of these DNA-based markers
contain specific advantage and disadvantages accordingly
they used in the evaluation of genetic diversity of farm
animals [9]. With development in computer science,
innovative strategies such as whole genome SNP chips and
DNA Barcoding have been discovered in which statistical
analysis is applied to solve the molecular biological problems
through advanced mathematical algorithms. At present
scenario, advanced DNA molecular marker techniques are
widely used in the fields of species identification,
phylogenetics and genetic structural analysis to observe the
diversity of the population [21, 22].
3. Molecular marker technique based on genetic sample
3.1 Mitochondrial ribosomal RNA marker
Animal mitochondria contain two ribosomal RNA (rRNA)
genes i.e., 12s rDNA and 16s rDNA. Typically, mitochondrial
12s rDNA is highly conserved, so it is being used to
understand the genetic diversity of higher categorical levels
like phylum [23]. On the other hand, the 16s rDNA is applied
for analyzing the genetic diversity at middle categorical levels
such as in families or genera [24]. For molecular analysis, these
markers are first amplified by PCR using conserved primers
and the amplicons are sequenced. Sequencing data are then
aligned and compared using appropriate bioinformatics tools.
Alvarez et al. [23] found that a specific haplotypes of 12S
rRNA gene is responsible to study the effects of geographical
isolation on genetic divergence of endangered spur thighed
tortoise (Testudo graeca). Using 12S rRNA, a 394–nucleotide
fragment of gene sequence was analyzed to examine the
genetic variation in Testudo graeca using 158 tortoise
specimens belonging to the four different sub-species [25]. Lei
et al. [26] testified the mitochondrial rRNA genes of Chinese
antelopes and determined that average sequence divergence
values for 16S and 12S rRNA genes were 9.9 percent and 6.3
percent respectively. But, the 12S rRNA fragment of Testudo
graeca was found to be less variable than the D–loop
fragment due to the inherently slower evolutionary rate of
rRNA genes than the variable parts of the D–loop [27]. Similar
types of findings was found on endangered Pecoran lower
sequence diversity in 16S rRNA gene has lower sequence

~ 1285 ~
Journal of Entomology and Zoology Studies
diversity than cytochrome b gene both between and within
species. However, the 16S rRNA gene carries larger number
of species–specific mutation sites as compared to cytochrome
b gene [28].
3.2 Mitochondrial Protein coding gene marker
Due to their faster evolutionary rates compared to ribosomal
RNA genes, the mitochondrial protein–coding genes are
regarded as powerful markers for genetic diversity analysis at
lower categorical levels, including families, genera and
species. Animal mitochondria contain 13 protein–coding
genes; however, one of the most extensively used protein
coding genes of the mitochondrial genome for molecular
analysis is cytochrome b (cyt b). Zhang and Jiang [21]
established that mitochondrial cyt b sequences have been used
to understand the genetic diversity for better conservation
management of Tibetan gazelle (Procapra picticaudata), a
threatened species on the Qinghai–Tibet Plateau of China.
Partial cyt b based molecular analysis of genetic distances has
revealed that there is considerable genetic divergence between
the Korean goral and the Chinese goral, but virtually none
between Korean and Russian gorals [29]. The Korean gorals
possessed two haplotypes with only one nucleotide difference
between them. While the Japanese serows (Japanese goat-
antelope) showed slightly higher sequence diversity with five
haplotypes [29]. Another important mitochondrial protein
coding gene, NADH dehydrogenase subunit 5 (318 bp), has
been used for phylogenetic analysis of multiple individuals of
different species from Felidae family [30]. Mitochondrial
cytochrome oxidase I (COI) gene has recently gained more
attention in developing DNA barcodes for species
identification and biodiversity analysis discussed below under
suitable heading [22, 31].
3.3 Mitochondrial D-loop marker
Mitochondrial DNA (mtDNA) is an extra-chromosomal
genome in the cell mitochondria that resides outside of the
nucleus [32], and is inherited from mother with no paternal
contribution [33]. This has been attributed to a faster mutation
rate in mtDNA that may result from a lack of repair
mechanisms during replication [34]. Mitochondrial DNA
contains a non–coding region termed the control region (CR
or D–loop) due to its role in replication and transcription of
mtDNA. The D–loop segment exhibits a comparatively higher
level of variation than protein–coding sequences such as the
cytochrome b gene due to reduced functional constraints and
relaxed selection pressure [35]. The length of the D–loop is ap-
proximately 1 kb and it can easily be amplified by PCR prior
to sequencing to determine the molecular diversity. Due to
higher evolutionary rates of mtDNA relative to the nuclear
genome [36], this marker is preferred in constructing
phylogenies and inferring evolutionary history, and is
therefore, ideal for within- and between-species comparisons [32]. Hu et al. [37] have studied the genetic diversity and
population structure in 40 samples of the Chinese water deer
(Hydropotes inermis inermis) by analyzing the 403 bp
fragment of mitochondrial D–loop and detected 18 different
haplotypes. They concluded that the samples having the
haplotype diversity of 0.923 and nucleotide diversity of 1.318,
whereas no obvious phylogenetic structure among haplotypes
was found for samples of different origin. Onuma et al. [38]
analyzied the sequence of the D-loop region of the sun bear
has been used to measure molecular diversity and to identify
conservation units for better management of the species. Wu
et al. [39] have sequenced a portion of mitochondrial CR (424
bp) to assess the population structure and gene flow among
the populations of black muntjac (Muntiacus crinifrons) using
47 samples collected from three large populations. It has been
suggested that the coexistence of distinct haplotypes in a
specific population was induced by historical population
expansion after fragmentation and that the current genetic
differentiation should be attributed to the reduction of female–
mediated gene flow due to recent habitat fragmentation and
subsequent loss [39]. A comparison between various types of
mitochondrial DNA type is given in Table 1.
Although mtDNA loci can exhibit large numbers of alleles
per loci, the limited number of markers available on the
mtDNA molecule positions its PIC values higher than those
for allozymes but lower than highly variable nuclear markers
such as RAPDs, microsatellites, AFLPs, and SNPs. Due to its
non-Mendelian mode of inheritance, the mtDNA molecule
must be considered a single locus in genetic investigations [20].
In addition, because mtDNA is maternally inherited, the
phylogenies and population structures derived from mtDNA
data may not reflect those of the nuclear genome due to
gender-biased migration [33] or introgression [40]. The
drawbacks of mtDNA analyses include hybridization,
introgression, and incomplete lineage sorting. Moreover,
mtDNA is of little use in investigating the recent loss of
genetic variation and any individual-level events such as
identity, individual dispersal, and mating systems [41]. In
addition, mtDNA markers are subject to the same problems
that exist for other DNA-based markers, such as back
mutation (sites that have already undergone substitution are
returned to their original state), parallel substitution
(mutations occur at the same site in independent lineages),
and rate heterogeneity or mutational hot spots (large
differences in the rate at which some sites undergo mutation
when compared to other sites in the same region).
Table 1: Comparison between various Mitochondrial DNA markers.
Type of Molecular Marker Characteristics
mtDNA
Inherited from the mother (maternal lineage); rare exceptions do exist
Degrades slower than nuclear DNA. It can be used in degraded or old samples
Evolves about 10–fold faster than nuclear DNA
12s rDNA Highly conserved; used for high–category levels: phyla and subphyla
16S rDNA Usually used in mid–category differentiation such as families
Protein–coding genes Conserved; used in low–categories such as families, genera and species
D-loop region Hypervariate; used for identification of species and sub–species
4. Advances in molecular marker technique
The technical advancements and genome based discoveries
has lead to the enhancement of molecular marker techniques.
These advanced molecular marker techniques are an
amalgamation of the advantageous characteristics of several
basic techniques as well as incorporation of modifications in
the methodology to increase the sensitivity and resolution to
detect genetic discontinuity and distinctiveness.

~ 1286 ~
Journal of Entomology and Zoology Studies
4.1 DNA Barcode markers
Parallel with the development of innovative practical
computer technologies, a new technology has emerged in
biological field for automatic scanning and identification of a
population. Biological taxonomists referred this technique as
DNA barcode. DNA barcoding has become a novel tool for
accurate identification of various taxa and unrecognized new
species in various classes of animal kingdom. It has become
the efficient method to improve the way the world relates to
wild biodiversity [42]. Moreover, the introduction of DNA
barcoding has highlighted the expanding use of the
cytochrome oxidase I (COI) as a genetic marker for species
identification as a means to quantify global biodiversity [31]. A
DNA barcode is a Short DNA sequence of 600–800 bp
segments selected from a standardized region of the genome.
Then the barcode is used for identifying the species by
applying the integrated innovative bioinformatics concept
with population genetics (Fig. 1). Tautz et al. [43] was the first
biological taxonomist who pertain the DNA sequences in
systematic biological taxonomy, called it as DNA taxonomy.
After that, Hebert et al. [22] proposed the concept of DNA
Barcoding by suggesting the COI as the only sequence in
mtDNA gene for animal DNA barcode analysis. DNA
Barcoding has a high accuracy of 97.9% [44], and provides a
new, quick, and convenient identification strategy for animal
genetic diversity [45]. This approach like other molecular
markers have some disadvantages that the genome fragments
are very difficult to obtain and are relatively conserve with
minimal variations. In some species the COI cannot be
identified because of the low evolution rates of COI
sequences in due course of period. Witt et al. [46] proposed
that determining genus Hyalella of amphipod crustaceans is
very difficult taxonomically by DNA barcoding technique.
Moreover, COI is an mtDNA sequence of maternal origin,
which could bias species diversity [42]. The above
disadvantages can be minimized by using one or more nuclear
gene barcodes together to make a standardized analysis for
animal genetic resource. However, still many biological
taxonomists apply this technique for species classification and
identifying new one.
Fig 1: Application of DNA Barcoding technique for new species identification.
4.2 Expressed sequence tags (ESTs)
Adams et al. [47] discovered that Expressed sequence tags
(ESTs) are single-pass sequence obtained from random
sequencing of cDNA clones. It is an efficient way to identify
genes and analyze their expression by means of expression
profiling [48]. ESTs are useful for the development of cDNA
microarrays that allow the geneticist to determine the analysis
of differentially expressed genes in a systematic manner for
genome mapping [49, 50]. It offers a rapid and valuable first
look at genes expressed in specific tissue types, under specific
physiological conditions, or during specific developmental
stages [51]. The steps for analyzing the gene expression by
ESTs technique of GPRS gene is given in the Fig. 2. Cox et
al., [52] studied cattle and swine genome mapping and
explained that ESTs are most useful for linkage mapping and
physical mapping in animal genomics where radiation hybrid
panels are available for mapping non-polymorphic DNA
marker. Typically, a radiation panel is consist of hybrid cells

~ 1287 ~
Journal of Entomology and Zoology Studies
lines, with each hybrid cell containing small fragments of
irradiated chromosomes of the species of interest.
Characterization of the chromosomal break points within
many hybrid cell lines would allow linkage and physical
mapping of markers and genes in the specific mammalian
genome [53, 54].
Fig 2: Steps for analyzing the expression of GPCR gene by ESTs.
4.3 Single strand conformation polymorphism (SSCP) Orita et al. [55] discovered that single strand conformation
polymorphism is the mobility shift analysis of single-stranded
DNA sequences on neutral polyacrylamide gel
electrophoresis, to detect polymorphisms produced by
differential folding of single-stranded DNA due to restrained
differences in sequence often a single base pair (Fig. 3). In the
absence of a complementary strand, the single strand
experiences intra strand base pairing, resulting in loops and
folds, that gives it a unique 3D structure which can be
considerably altered due to single base change resulting in
differential mobility [55]. The SSCP analysis proves to be a
powerful tool for assessing the complexity of PCR products
as the two DNA strands from the same PCR product often run
separately on SSCP gels [56]. Thereby, providing the
opportunities to keep count a polymorphism by resolving
internal sequence polymorphisms in some PCR products from
identical places in the two parental genomes. The PCR-based
SSCP analysis is a rapid, simple and sensitive technique for
detection of various mutations, including single nucleotide
substitutions, insertions and deletions, in PCR-amplified DNA
fragments [57]. Thus, it was a powerful technique for gene
analysis particularly for detection of point mutations.
However, unlike RFLP analysis, SSCP analysis can detect
DNA polymorphisms and mutations at multiple places in
DNA fragments [58]. The SSCP gels have been used to
increase throughput and reliability of scoring during mapping
by PCR fingerprinting in animal. Fluorescence-based PCR-
SSCP (F-SSCP) is an adapted version of SSCP analysis
involving amplification of the target sequence using
fluorescent primers [59]. The major disadvantage of the
technique is that the development of SSCP markers is labor
intensive and costly and cannot be automated.
Fig 3: (A) SSCP analysis is based on the mobility shift of the single
stranded DNA which is due to nucleotide changes (For SSCP
analysis, the amplified target sequence is denatured and analysed on
a native polyacrylamide gel). (B) IRAP markers are generated by the
proximity of two LTRs using outward-facing primers annealing to
LTR target sequences. (C) REMAP technique relies on amplification
using one outward-facing LTR primer and a second primer from a
microsatellite.
4.4 RNA-based molecular markers
Biological responses and developmental programming are
regulated by the precise control of genetic expression. To
obtain the detail information about the genetic expression the
scientist started to concentrate on the differential patterns of
gene expression at RNA level. PCR-based marker techniques,
such as, cDNA AFLP and RAP-PCR are used for differential
RNA study by selective amplification of cDNAs. cDNA-
SSCP analysis of RT-PCR products was used to evaluate the
expression status presence and relative quantity of highly
similar homologous gene pairs from a polyploid genome.
Replicate tests showed that cDNA-SSCP reliably separates
duplicated transcripts with 99% sequence identity [60]. This
technique has been used to gain remarkable insight into the
global frequency of silencing in synthetic and natural
polyploids.
4.5 RNA fingerprinting by arbitrarily primed PCR
(RAPPCR)
Welsh et al. [61] illustrated that the RAP-PCR technique
involves the fingerprinting of RNA populations using
arbitrarily selected primer at low inflexibility for first and
second strand cDNA synthesis followed by PCR

~ 1288 ~
Journal of Entomology and Zoology Studies
amplification of cDNA population [62]. The method required
very minute quantity of total RNA usually in nanograms and
remains unaffected by low levels of genomic DNA
contamination. Differential PCR fingerprintings are detected
for RNAs from the same tissue isolated from different
individuals or for RNAs from different tissues from the same
individual was expressed by Welsh et al. [61]. The individual-
specific differences revealed are due to sequence
polymorphisms which is useful for genetic mapping of genes.
The tissue-specific differences are useful for studying
differential gene expression. A novel RNA fingerprinting
technique is cDNA-AFLP developed to display differentially
expressed genes [63]. The methodology includes digestion of
cDNAs by two restriction enzymes followed by ligation of
oligonucleotide adapters and PCR amplification using primers
complementary to the adapter sequences with additional
selective nucleotides at the 30 end [64]. The cDNA-AFLP
technique is a more stringent and reproducible than RAP-PCR [65]. In contrast to hybridization-based techniques, such as
cDNA microarrays, cDNA-AFLP can distinguish between
highly homologous genes from individual gene families.
There is no requirement of any preexisting sequence
information in cDNA-AFLP as it is required in case of ESTs,
thus it is valuable as a tool for the identification of novel
process-related genes [66, 67]. Recently, the major of area of
research in cDNA-AFLP is applied for identification of stress-
regulated genes [68].
4.6 Marker Assisted Selection (MAS)
To improve the performance of animals, breeders have to
tackle the situation of selecting the best individual. From time
being it has been accomplished either by pedigree data
analysis or by phenotypic data estimation by Best Linear
Unbiased Prediction (BLUP) that ultimately responsible to
calculate estimated breeding values (EBVs). But with the
development of DNA markers techniques a new approach
named Marker assisted selection (MAS) has been discovered.
MAS can be based on DNA in linkage equilibrium with a
quantitative trait locus (QTL) by the phenomenon LE-MAS
with the help of LE Marker. LE refers to the genotype
frequencies at one locus which is independent of genotype
frequencies at the second locus. Andersson [12] described LE
markers stand for the loci that are in population-wide linkage
equilibrium with the functional mutation in outbred
populations. The LE markers can be readily detected on a
genome-wide basis by using breed crosses or analysis of large
half-sib families within the breed. Such genome scans require
only sparse marker maps (15 to 50 cM spacing, depending on
marker information and genotyping costs; to detect most QTL
of moderate to large effects. Similarly, MAS can be based on
molecular markers (LD marker) in linkage disequilibrium
with a QTL by the phenomenon LD-MAS [69]. LD refers to
the non-random association of alleles between two loci-, or
based on selection of the actual mutation causing the QTL
effect (Gene-MAS). LD markers: loci that are in population-
wide linkage disequilibrium with the functional mutation [70].
The LD markers are by necessity close to the functional
mutation for sufficient population-wide LD between the
marker and QTL to exist within 1 to 5 cM, depending on the
extent of LD, which depends on population structure and
history. The LD markers can be identified using candidate
genes or fine-mapping approaches [12]. Third type of marker
loci i.e., the direct markers (i.e., polymorphisms that code for
the functional mutations) are the most difficult to detect
because causality is difficult to prove and, as a result, a
limited number of examples are available, except for single-
gene traits [12]. Whereas direct markers and, to a lesser degree,
LD markers, allow for selection on genotype across the
population because of the consistent association between
genotype and phenotype, use of LE markers must allow for
different linkage phases between markers and QTL from
family to family. Thus, the ease and ability to use markers in
selection is opposite to their ease of detection and increases
from direct markers to LD markers and LE markers [70]. In
what follows, selection on these three types of markers will be
referred to as gene-assisted selection (GAS), LD markers-
assisted selection (LD-MAS), and LE marker-assisted
selection (LE-MAS). All three types of MAS are being used
in the livestock industries [70]. Evaluation of the success of
marker-assisted selection in breeding programs for different
types of markers is given in Table 2.
Table 2: Evaluation of the success of marker-assisted selection in breeding programs for different types of markers.
Level of evaluation Direct marker Linkage disequilibrium marker Linkage equilibrium marker
Frequency of marker locus Direct population estimate Direct population estimate Within-family assessment
Frequency of target locus Direct population estimate Population-wide marker-trait
association
Within-family marker-trait
association
Phenotypic effect of target
locus
Population-wide marker-trait
association
Population-wide marker-trait
association
Within-family marker-trait
association
Genetic merit of population Line comparison Line comparison Line comparison
Pongpisantham [71] established that the application of markers
could increase the genetic response to selection for growth
rate in a population of chickens up to 15% compared to that of
family based selection. Similar type of result was also
obtained by Ruane and Colleau [72] revealed that by the
adaptation of MAS in the selection response for milk
production in cattle nucleus that used multiple ovulation and
embryo transfer (MOET) in the first six generations of
selection was increased by 6 to 15%. So, significant increases
to the selection response are possible in several species using
MAS [73]. The estimated range of increase in selection
response combined parameters with maximum responses was
2 to 38% and with minimum responses was –0.7 to 22.4% as
analyzed by Clarke [74]. However, Ruane and Colleau [73]
illustrated that possible increase in selection response of only
0.2 to 1% in six generations using a single marker by applying
in cattle ONBS method of selection. The variation arises
because of differences in the assumed sizes of the QTL
effects, population structures, allelic frequencies,
environmental variances, residual polygenic variances, of
generations of selection, and selection procedures and most
important factor recombination rates between the marker and
the QTL and type of marker (single or haplotype). An unusual
result was determined by Meuwissen and Goddard [69] that
possible increases upto 64% in the genetic response to
selection of different characteristics in the first five
generations by MAS while the QTL explains only 33% of the
genetic variation in the base population. Meuwissen and
~ 1289 ~
Journal of Entomology and Zoology Studies
Goddard [69] concluded the following result from their study
by the use of Marker assisted selection (MAS):
1. MAS only can increase the rate of genetic gain in the long
term, when there is a continuous advantage of new identified
QTL (obviously, this has a biological limit determined by the
maximum proportion of the genetic variance that can be
explained by the segregation of QTL).
2. The extra genetic gain due to the MAS decreases very
quickly with the number of generations of selection for a
same QTL. The rate of identification of new QTL is difficult
to predict.
3. The gain due to MAS for a certain QTL is higher when the
characteristic is measured after the selection, as it happens
with the fertility and carcass characteristics.
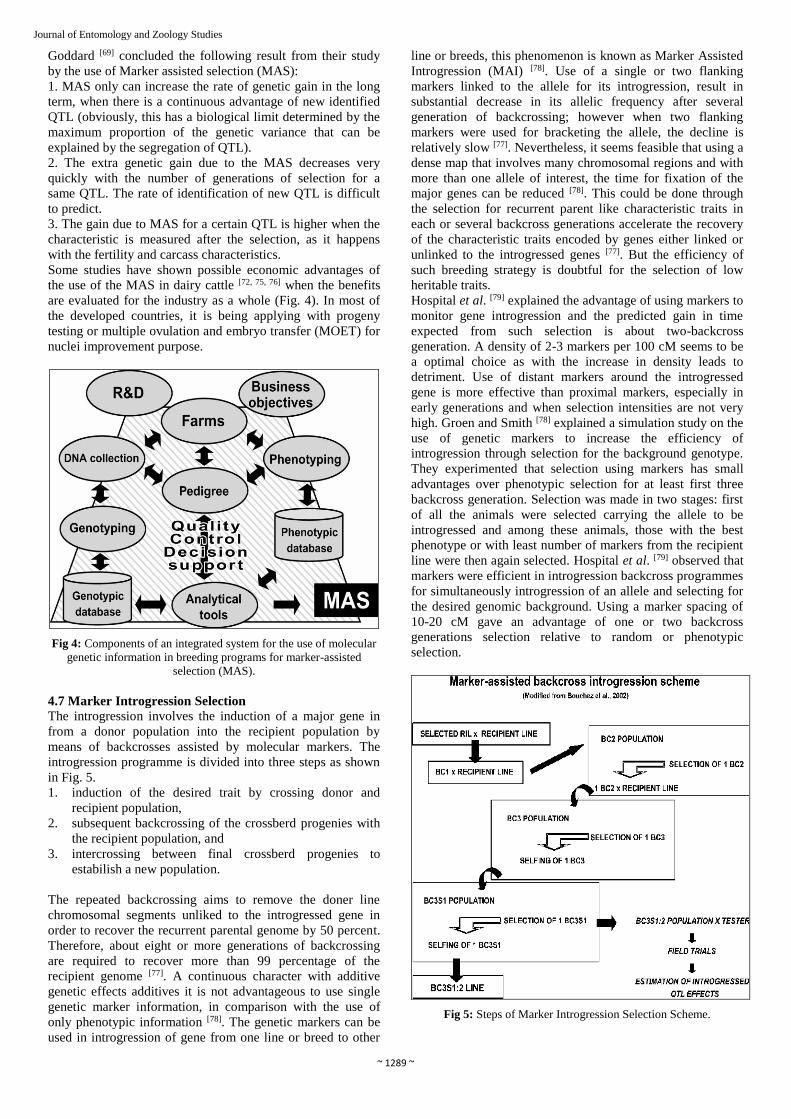
Some studies have shown possible economic advantages of
the use of the MAS in dairy cattle [72, 75, 76] when the benefits
are evaluated for the industry as a whole (Fig. 4). In most of
the developed countries, it is being applying with progeny
testing or multiple ovulation and embryo transfer (MOET) for
nuclei improvement purpose.
Fig 4: Components of an integrated system for the use of molecular
genetic information in breeding programs for marker-assisted
selection (MAS).
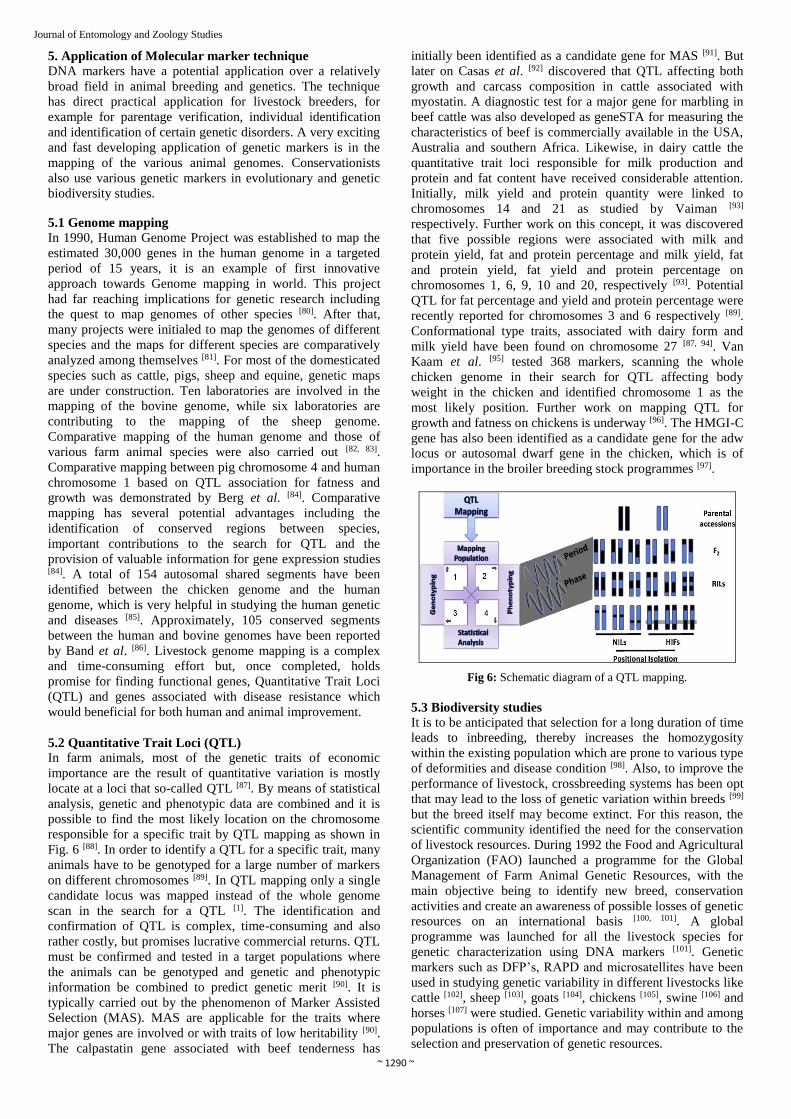
4.7 Marker Introgression Selection
The introgression involves the induction of a major gene in
from a donor population into the recipient population by
means of backcrosses assisted by molecular markers. The
introgression programme is divided into three steps as shown
in Fig. 5.
1. induction of the desired trait by crossing donor and
recipient population,
2. subsequent backcrossing of the crossberd progenies with
the recipient population, and
3. intercrossing between final crossberd progenies to
estabilish a new population.
The repeated backcrossing aims to remove the doner line
chromosomal segments unliked to the introgressed gene in
order to recover the recurrent parental genome by 50 percent.
Therefore, about eight or more generations of backcrossing
are required to recover more than 99 percentage of the
recipient genome [77]. A continuous character with additive
genetic effects additives it is not advantageous to use single
genetic marker information, in comparison with the use of
only phenotypic information [78]. The genetic markers can be
used in introgression of gene from one line or breed to other
line or breeds, this phenomenon is known as Marker Assisted
Introgression (MAI) [78]. Use of a single or two flanking
markers linked to the allele for its introgression, result in
substantial decrease in its allelic frequency after several
generation of backcrossing; however when two flanking
markers were used for bracketing the allele, the decline is
relatively slow [77]. Nevertheless, it seems feasible that using a
dense map that involves many chromosomal regions and with
more than one allele of interest, the time for fixation of the
major genes can be reduced [78]. This could be done through
the selection for recurrent parent like characteristic traits in
each or several backcross generations accelerate the recovery
of the characteristic traits encoded by genes either linked or
unlinked to the introgressed genes [77]. But the efficiency of
such breeding strategy is doubtful for the selection of low
heritable traits.
Hospital et al. [79] explained the advantage of using markers to
monitor gene introgression and the predicted gain in time
expected from such selection is about two-backcross
generation. A density of 2-3 markers per 100 cM seems to be
a optimal choice as with the increase in density leads to
detriment. Use of distant markers around the introgressed
gene is more effective than proximal markers, especially in
early generations and when selection intensities are not very
high. Groen and Smith [78] explained a simulation study on the
use of genetic markers to increase the efficiency of
introgression through selection for the background genotype.
They experimented that selection using markers has small
advantages over phenotypic selection for at least first three
backcross generation. Selection was made in two stages: first
of all the animals were selected carrying the allele to be
introgressed and among these animals, those with the best
phenotype or with least number of markers from the recipient
line were then again selected. Hospital et al. [79] observed that
markers were efficient in introgression backcross programmes
for simultaneously introgression of an allele and selecting for
the desired genomic background. Using a marker spacing of
10-20 cM gave an advantage of one or two backcross
generations selection relative to random or phenotypic
selection.
Fig 5: Steps of Marker Introgression Selection Scheme.
~ 1290 ~
Journal of Entomology and Zoology Studies
5. Application of Molecular marker technique
DNA markers have a potential application over a relatively
broad field in animal breeding and genetics. The technique
has direct practical application for livestock breeders, for
example for parentage verification, individual identification
and identification of certain genetic disorders. A very exciting
and fast developing application of genetic markers is in the
mapping of the various animal genomes. Conservationists
also use various genetic markers in evolutionary and genetic
biodiversity studies.
5.1 Genome mapping In 1990, Human Genome Project was established to map the
estimated 30,000 genes in the human genome in a targeted
period of 15 years, it is an example of first innovative
approach towards Genome mapping in world. This project
had far reaching implications for genetic research including
the quest to map genomes of other species [80]. After that,
many projects were initialed to map the genomes of different
species and the maps for different species are comparatively
analyzed among themselves [81]. For most of the domesticated
species such as cattle, pigs, sheep and equine, genetic maps
are under construction. Ten laboratories are involved in the
mapping of the bovine genome, while six laboratories are
contributing to the mapping of the sheep genome.
Comparative mapping of the human genome and those of
various farm animal species were also carried out [82, 83].
Comparative mapping between pig chromosome 4 and human
chromosome 1 based on QTL association for fatness and
growth was demonstrated by Berg et al. [84]. Comparative
mapping has several potential advantages including the
identification of conserved regions between species,
important contributions to the search for QTL and the
provision of valuable information for gene expression studies [84]. A total of 154 autosomal shared segments have been
identified between the chicken genome and the human
genome, which is very helpful in studying the human genetic
and diseases [85]. Approximately, 105 conserved segments
between the human and bovine genomes have been reported
by Band et al. [86]. Livestock genome mapping is a complex
and time-consuming effort but, once completed, holds
promise for finding functional genes, Quantitative Trait Loci
(QTL) and genes associated with disease resistance which
would beneficial for both human and animal improvement.
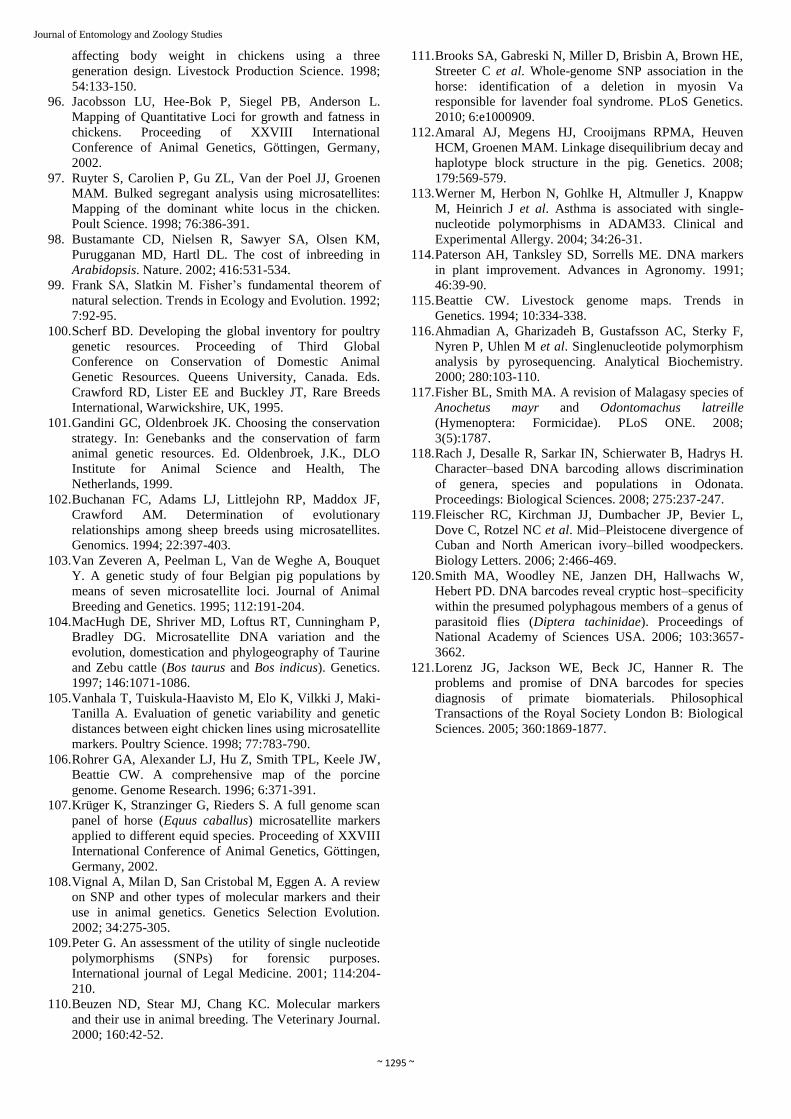
5.2 Quantitative Trait Loci (QTL)
In farm animals, most of the genetic traits of economic
importance are the result of quantitative variation is mostly
locate at a loci that so-called QTL [87]. By means of statistical
analysis, genetic and phenotypic data are combined and it is
possible to find the most likely location on the chromosome
responsible for a specific trait by QTL mapping as shown in
Fig. 6 [88]. In order to identify a QTL for a specific trait, many
animals have to be genotyped for a large number of markers
on different chromosomes [89]. In QTL mapping only a single
candidate locus was mapped instead of the whole genome
scan in the search for a QTL [1]. The identification and
confirmation of QTL is complex, time-consuming and also
rather costly, but promises lucrative commercial returns. QTL
must be confirmed and tested in a target populations where
the animals can be genotyped and genetic and phenotypic
information be combined to predict genetic merit [90]. It is
typically carried out by the phenomenon of Marker Assisted
Selection (MAS). MAS are applicable for the traits where
major genes are involved or with traits of low heritability [90].
The calpastatin gene associated with beef tenderness has
initially been identified as a candidate gene for MAS [91]. But
later on Casas et al. [92] discovered that QTL affecting both
growth and carcass composition in cattle associated with
myostatin. A diagnostic test for a major gene for marbling in
beef cattle was also developed as geneSTA for measuring the
characteristics of beef is commercially available in the USA,
Australia and southern Africa. Likewise, in dairy cattle the
quantitative trait loci responsible for milk production and
protein and fat content have received considerable attention.
Initially, milk yield and protein quantity were linked to
chromosomes 14 and 21 as studied by Vaiman [93]
respectively. Further work on this concept, it was discovered
that five possible regions were associated with milk and
protein yield, fat and protein percentage and milk yield, fat
and protein yield, fat yield and protein percentage on
chromosomes 1, 6, 9, 10 and 20, respectively [93]. Potential
QTL for fat percentage and yield and protein percentage were
recently reported for chromosomes 3 and 6 respectively [89].
Conformational type traits, associated with dairy form and
milk yield have been found on chromosome 27 [87, 94]. Van
Kaam et al. [95] tested 368 markers, scanning the whole
chicken genome in their search for QTL affecting body
weight in the chicken and identified chromosome 1 as the
most likely position. Further work on mapping QTL for
growth and fatness on chickens is underway [96]. The HMGI-C
gene has also been identified as a candidate gene for the adw
locus or autosomal dwarf gene in the chicken, which is of
importance in the broiler breeding stock programmes [97].
Fig 6: Schematic diagram of a QTL mapping.
5.3 Biodiversity studies
It is to be anticipated that selection for a long duration of time
leads to inbreeding, thereby increases the homozygosity
within the existing population which are prone to various type
of deformities and disease condition [98]. Also, to improve the
performance of livestock, crossbreeding systems has been opt
that may lead to the loss of genetic variation within breeds [99]
but the breed itself may become extinct. For this reason, the
scientific community identified the need for the conservation
of livestock resources. During 1992 the Food and Agricultural
Organization (FAO) launched a programme for the Global
Management of Farm Animal Genetic Resources, with the
main objective being to identify new breed, conservation
activities and create an awareness of possible losses of genetic
resources on an international basis [100, 101]. A global
programme was launched for all the livestock species for
genetic characterization using DNA markers [101]. Genetic
markers such as DFP’s, RAPD and microsatellites have been
used in studying genetic variability in different livestocks like
cattle [102], sheep [103], goats [104], chickens [105], swine [106] and
horses [107] were studied. Genetic variability within and among
populations is often of importance and may contribute to the
selection and preservation of genetic resources.

~ 1291 ~
Journal of Entomology and Zoology Studies
5.4 High density SNP Assay
Lander [41] proposed a new molecular marker technology
named SNP. The more recent SNP concept has basically
arisen from the recent need for very high densities of genetic
markers for the studies of multifactorial diseases [108]. The
fundamental principle of SNPs is to hybridize detected DNA
fragments with high-density DNA probe arrays (also called
SNP chips); the SNP allele is then named according to the
hybridization results [5]. SNPs are third generation molecular
marker technology coming after RFLPs and SSRs [109]. It is
estimated that when comparing two human DNA sequences,
there will be between 1.6 and 3.2 million SNP. They are bi-
allelic markers, indicating a specific polymorphism in two
alleles only of a population. SNP in coding regions can be
directly associated with the protein function and as the
inheritance pattern is more stable, they are more suitable
markers for selection over time [110]. Currently, DNA chip
technology is usually carried out during SNP investigations
(Fig. 7). A group of associated SNP loci located on a certain
region of the chromosome can form one SNP haplotype.
SNPs are third generation molecular marker technology
coming after RFLPs and SSRs [109]; it has been successfully
used to investigate genetic variation among different species
and breeds [111, 112]. Because of their extensive distribution and
abundant variations, SNPs play an important role in farm
animal population structure, genetic differentiation, origin,
and evolution research. Furthermore, we can gain information
concerning animal population diversity and population
evolution (origins, differentiation, and migrations) via SNP
haplotypes among different populations. But this can be
compensated for by employing a higher numbers of markers
(SNP chips) and whole-genome sequencing [22, 113].
Fig 7: DNA chips to analyze single nucleotide polymorphisms
(SNPs). A DNA chip is repaired by attaching DNA fragments of ~25
bp in length from a species to a glass or metal plate. These fragments
contain the SNP variants to be analyzed. Fluorescence-labeled
probes are hybridized with the DNA fragments on the plate, and the
DNA chip is washed. Finally, the probes are exposed to light of a
specific wavelength to induce fluorescence.
5.5 Whole genome sequencing
Highest resolution of DNA variation can be obtain by using
sequence analysis. Sequence analysis provides the
fundamental structure of gene systems of an individual. DNA
sequencing is a vital tool in the analysis of gene structure and
expression in an animal [10]. A step towards the use of
genomic information in livestock improvement is the location
of all markers and protein coding genes in the chromosomes [114]. So, the development of genetic maps of the species of
interest is required for detecting QTL using molecular
markers [88]. Additionally, the construction of physical maps
has been favored by means of the development of techniques
like the hybrids of somatic cells and fluorescence in situ
hybridization (FISH) [115]. With the improvement of
sequencing technology, whole-genome/gene sequencing has
become available for characterizing genetic diversity among
farm animals [116]. It is the most straight-forward method and
provides more complete information on the genetic variation
among different populations because it can detect all the
variations within the genome. Currently, the problem with
whole-genome sequencing is setting up a high-through data
analysis platform to explore useful information for the
conservation and utilization of farm animals.
5.6 Species identification and Genetic diversity with the
help of DNA Barcoding
Fisher and Smith [117] evaluated the role of DNA barcoding as
a tool to accelerate species identification and description of
arthropods. Fisher and Smith [117] examined the CO1 DNA
barcode morphological analysis of 500 individuals to
recognize five species of Anochetus and three species of
Odontomachus. The goal of DNA barcoding is to use a large-
scale screening of one or more reference genes in order to
assign unknown individuals to species, and to enhance the
chances of discovery of new species [22]. Rach et al. [118]
concluded that the DNA barcodes are able to identify entities
below the species level that may constitute separate
conservation units or even species units. Fleischer et al. [119]
have conducted DNA analysis of seven museum specimens of
the endangered North American ivory–billed woodpecker
(Campephilus principalis) whose sequences provided an
important DNA barcoding resource for identification of
critically endangered and charismatic woodpeckers nearer to
that region. So, the COI–DNA barcode has been considered
as a tool for species identification, biodiversity analysis and
discovery for species like Smith et al. [120] that has discovered
Belvosia parasitoid flies by applying this method. Lorenz et
al. [121] have suggested that depositing barcode sequences in a
public database, along with primer sequences, trace files and
associated quality scores, would make this technique widely
accessible and applicable for species identification and
biodiversity analysis.
6. Conclusion
The developments over the past ten years in molecular
genetics have created the potential for the application of
functional genomics over a broad field of animal
improvement and breeding. These methods provide a large
number of markers and opening up new opportunities for
evaluating diversity in farm animal genetic resources.
Currently, SSR and SNP markers subjected to many
researches to compare their validation for map built. In a
simulations prediction study, results showed that SNPs are at
least two to six times more necessary to achieve the same
resolution as microsatellites when used for individual

~ 1292 ~
Journal of Entomology and Zoology Studies
identification and the study of parentage assessment and
relatedness. The SNP markers have promising advantages
over microsatellite markers, due to high throughput automated
analysis, lower mutation rates and lower genotyping costs.
However, SNP markers can only be transferred to different
mapping populations within the same species, but not across
species. Mitochondrial DNA markers are particularly useful
for studying evolutionary relationship among various taxa.
DNA barcoding based on mitochondrial genes (most often
COI) has emerged as a powerful strategy for species
identification. In breeding, QTL will for example be applied
in the genotypic selection of superior animals. There is a
danger associated with a potentially inadequate use of QTL
information, giving an excessively high emphasis to simple
molecular information in detriment of the overall economic
gain through all traits and their polygenic effects in the
population. Dissemination of the information to the industry
is therefore a complex issue concerning QTL effects and
molecular markers. The characteristics on which the
application of the MAS can be effective are those that are
expressed late in the life of the animal, or those that are
controlled by a few pairs of alleles. Because of its high cost,
the use of MAS could be justified, in animal nuclei that allow
dilution of the costs when germplasm is extensively used
towards the commercial population. So, the use of advanced
molecular techniques offers new opportunities and challenges
for building and using more predictive and efficient statistical
models for livestock improvement.
7. Acknowledgment
The authors acknowledge the help and cooperation rendered
by the Department of Animal Genetics and Breeding of
Orissa University of Agriculture and Technology (OUAT)
and West Bengal University of Animal and Fishery Sciences
(WBUAFS) to carry out this innovative study successfully
and fruitfully.
8. Reference
1. Walsh B. Minireview: Quantitative genetics in the age of
genomics. Theoretical Population Biology. 2000; 59:175-
184.
2. Henderson CR. Applications of linear models in animal
breeding. Canada Catalogue Publication. Data,
University of Guelph, Canada, 1984, 89-93.
3. Shrimpton AE, Robertson A. The Isolation of Polygenic
Factors Controlling Bristle Score in Drosophila
melanogaster. II. Distribution of third chromosome
bristle effects within chromosome sections. Genetics.
1988; 118:445-459.
4. Van Wezel IL, Rodgers RJ. Morphological
characterization of bovine primordial follicles and their
environment in vivo. Biology of Reproduction. 1996;
55:1003-1011.
5. Yang W, Kang X, Yang Q, Lin Y, Fang M. Review on
the development of genotyping methods for assessing
farm animal diversity. Journal of Animal Science and
Biotechnology. 2013; 4(2):1-6.
6. Bitgood JJ, Shoffner RN. Cytology and cytogenetics.
Poultry breeding and Genetics. 1990; 22:401-427.
7. Becak ML, Becak W, Roberts FL. Fish, amphibians,
reptiles and birds. Berlin, Heidelberg: Springer-Verlag,
New York, 1973.
8. Jonker J, Meurs G, Balner H. Typing for RhLA-D in
rhesus monkeys: II. genetics of the D antigens and their
association with DR antigens in a population of unrelated
animals. Tissue Antigens. 1982; 19:69-78.
9. Buvanendran V, Finney DJ. Linkage relationships of egg
albumen loci in the domestic fowl. British Poultry
Science. 1967; 8:9-13.
10. Drinkwater RD, Hetzel DJS. Application of molecular
biology to understanding genotype-environment
interactions in livestock production. In Proceeding of an
International Symposium on Nuclear Techniques in
Animal Production and Health. Vienna: IAEA, FAO,
1991, 437-452.
11. Sunnucks P. Efficient genetic markers for population
biology. Trends in Ecology and Evolution. 2000; 15:199-
203.
12. Andersson L. Genetic dissection of phenotypic diversity
in farm animals. Nature Reviews Genetics. 2001; 2:130-
138.
13. Dekkers JCM, Hospital F. The use of molecular genetics
in the improvement of agricultural populations. Nature
Reviews Genetics. 2002; 3:22-32.
14. Avise JC, Helfman GS, Saunders NC, Hales LS.
Mitochondrial DNA differentiation in North Atlantic
eels: population genetic consequences of an unusual life
history pattern. Proceedings of National Academy of
Sciences USA. 1986; 83:4350-4354.
15. Goddard ME. A mixed model for analyses of data on
multiple genetic markers. Theoretical and Applied
Genetics. 1992; 83:878-886.
16. Fischer RA. The correlation between relatives: the
supposition of mendelain inheritance. Transactions of the
royal society of Edinburgh. 1918; 52:399.
17. Ewing B, Green P. Analysis of expressed sequence tags
indicates 35,000 human genes. Nature Genetics. 2000;
25:232-234.
18. Cornuet JM, Aulagnier S, Lek S, Franck S, Solignac M.
Classifying individuals among infra-specific taxa using
microsatellite data and neural networks. Competes
Rendus de I`Academie des Sciences III. 1996; 319:1167-
1177.
19. Eding H, Meuwissen THE. Marker-based estimates of
between and within population kinships for the
conservation of genetic diversity. Journal of Animal
Breeding and Genetics. 2001; 118:141-159.
20. Avise JC. Molecular Markers, Natural History, and
Evolution. Chapman and Hall, New York, NY, 1994,
511.
21. Zhang F, Jiang Z. Mitochondrial phylogeography and
genetic diversity of Tibetan gazelle (Procapra
picticaudata): implications for conservation. Molecular
Phylogenetics and Evolution. 2006; 41:313-321.
22. Hebert PDN, Cywinska A, Ball SL, de Waard JR.
Biological identifications through DNA barcodes.
Proceeding of Royal Society B: Biological Science.
2003; 270:313-321.
23. Alvarez Y, Mateo JA, Andreu AC, Diaz–Paniagua C,
Diez A, Bautista JM. Mitochondrial DNA haplotyping of
Testudo graeca on both continental sides of the Straits of
Gibraltar. Journal of Heredity. 2000; 91:39-41.
24. Gerber AS, Loggins R, Kumar S, Dowling TE. Does
nonneutral evolution shape observed patterns of DNA
variation in animal mitochondrial genomes? Annual
Reviews of Genetics. 2001; 35:539-566.
25. Van der Kuyl AC, Ballasina DLP, Zorgdrager F.
Mitochondrial haplotype diversity in the tortoise species
Testudo graeca from North Africa and the Middle East.
BMC Evolutionary Biology. 2005; 5:29.

~ 1293 ~
Journal of Entomology and Zoology Studies
26. Lei R, Jian Z, Hu Z, Yang W. Phylogenetic relationships
of Chinese antelopes (Subfamily Antilopinae) based on
mitochondrial Ribosomal RNA gene sequences. Journal
of Zoology. 2003; 261:227-237.
27. Pesole G, Gissi C, De Chirico A, Saccone C. Nucleotide
substitution rate of mammalian mitochondrial genomes.
Journal of Molecular Evolution. 1999; 48:427-434.
28. Guha S, Goyal SP, Kashyap VK. Genomic variation in
the mitochondrially encoded cytochrome b (MT–CYB)
and 16S rRNA (MT–RNR2) genes: characterization of
eight endangered Pecoran species. Animal Genetics.
2006; 37:262-265.
29. Min MS, Okumura H, Jo DJ, An JH, Kim KS, Kim CB et
al. Molecular phylogenetic status of the Korean goral and
Japanese serow based on partial sequences of the
mitochondrial cytochrome b gene. Molecular Cells. 2004;
17:365-372.
30. Johnson WE, O’Brien SJ. Phylogenetic Reconstruction of
the Felidae Using 16S rRNA and NADH–5
Mitochondrial Genes. Journal of Molecular Evolution.
1997; 44:98-116.
31. Dawnay N, Ogden R, McEwing R, Carvalho GR Thorpe
RS. Validation of the barcoding gene COI for use in
forensic genetic species identification. Forensic Science
International. 2007; 173(1):1-6.
32. Emadi A, Crim MT, Brotman DJ. Analytic validity of
genetic tests to identify factor V Leiden and prothrombin
G20210. American Journal of Hematology. 2010;
85(4):264-270.
33. Birky CW, Fuerst P, Maruyama T. Organelle gene
diversity under migration, mutation, and drift:
equilibrium expectations, approach to equilibrium, effect
of heteroplasmic cells, and comparison to nuclear genes.
Genetics. 1989; 121:613-627.
34. Wilson AC, Cann RL, Carr SM, George M, Gyllensten
UB, Helm-Bychowski KM et al. Mitochondrial DNA and
two perspectives on evolutionary genetics. Biological
Journal of Linnean Society. 1985; 26:375-400.
35. Brown JR, Bechenbach AT, Smith MJ. Intraspecific
DNA sequence variation of the mitochondrial control
region of white sturgeon (Acipenser transmontanus).
Molecular Biology and Evolution. 1993; 10:326-341.
36. Adams WT. Application of isozymes in tree breeding. In
S. D. Tanksley and T. J. Orton (eds.), Isozymes in plant
genetics and breeding, part A, Elsevier Science,
Amsterdam, The Netherlands, 1983, 381-400.
37. Hu J, Fang SG, Wan QH. Genetic diversity of Chinese
water deer (Hydropotes inermis inermis): implications for
conservation. Biochemical Genetics. 2006; 44:161-172.
38. Onuma M, Suzuki M, Ohtaishi N. Possible conservation
units of the sun bear (Helarctos malayanus) in Sarawak
based on variation of mtDNA control region. Japanese
Journal of Veterinary Research. 2006; 54:135-139.
39. Wu HL, Wan QH, Fang SG. Population structure and
gene flow among wild populations of the black muntjac
(Muntiacus crinifrons) based on mitochondrial DNA
control region sequences. Zoological Science. 2006;
23:333-340.
40. Chow S, Kishino H. Phylogenetic relationships between
tuna species of the genus Thunnus (Scombriidae:
Teleosrei): inconsistent implications from morphology,
nuclear and mitochondrial genomes. Journal of Molecular
Evolution. 1995; 41:741-748.
41. Lander ES. The new genomics: global views of biology.
Science. 1996; 274:536-539.
42. Hajibabaei M, Janzen DH, Burns JM. DNA barcodes
distinguish species of tropical Lepidoptera. Proceedings
of National Academy of Sciences USA. 2006; 103:968-
971.
43. Tautz D, Arctander P, Minelli A, Thomas RH. DNA
points the way ahead in taxonomy. Nature. 2002;
418:479.
44. Goodfellow PN. Variation is now the theme. Nature.
1992; 359:777-778.
45. Morin PA, Luikart G, Wayne RK. SNPs in ecology,
evolution VA, USA, pp. 277D280. And conservation.
Trends in Ecology and Evolution. 2004; 19:208-216.
46. Witt JD, Threloff DL, Hebert PD. DNA barcoding
reveals extraordinary cryptic diversity in an amphipod
genus: implications for desert spring conservation.
Molecular Ecology. 2006; 15:3073-3082.
47. Adams MD, Kelley JM, Gocayne JD, Dubnick M,
Polymeropoulos MH, Xiao H et al. Complementary DNA
sequencing: expressed sequence tags and human genome
project. Science. 1991; 252:1651-1656.
48. Lee CK, Weindruch R, Prolla TA. Gene-expression
profile of the aging skin in mice. Nature Genetics. 2000;
25:294-297.
49. Schena M, Shalon D, Heller R, Chai A, Brown PO, Davis
RW. Parallel human genome analysis: microarray-based
expression monitoring of 1000 genes. Proceedings of
National Academy of Sciences USA. 1996; 93:10614-
10619.
50. Schuler GD, Boguski MS, Hudson TJ, Hui L, Ma J,
Castle AB et al. Genome maps 7. The human transcript
map. Science. 1996; 274:547-562.
51. Hudson TJ, Stein LD, Gerety SS, Ma J, Castle AB, Silva
J et al. An STS-based map of the human genome.
Science. 1995; 270:1945-1954.
52. Cox DR, Burmeister M, Price E, Kim S, Myers RM.
Radiation hybrid mapping: a somatic cell genetic method
for constructing high-resolution map of mammalian
chromosomes. Science. 1990; 250:245-250.
53. Yang YP, Womack JE. Parallel radiation hybrid
mapping: a powerful tool for high-resolution genomic
comparison. Genome Research. 1998; 8:731-736.
54. Amaral ME, Kata SR, Womack JE. A radiation hybrid
map of bovine X chromosome (BTAX). Mammalian
Genome. 2002; 13:268-271.
55. Orita M, Iwahana H, Kanazawa H, Hayashi K, Sekiya T.
Detection of polymorphisms of human DNA by gel
electrophoresis as single-strand conformation
polymorphism. Proceedings of National Academy of
Sciences USA. 1989; 86:2766-2770.
56. Hayashi K. PCR-SSCP—rapid and easy detection of
DNA sequence changes. Human Cell. 1992; 5:180-184.
57. Hayashi K. How sensitive is PCR-SSCP? Human
Mutation. 1993; 2:338-346.
58. Fukuoka S, Inoue T, Miyao A, Monna L. Mapping of
sequence-tagged sites in rice by single conformation
polymorphism. DNA Research. 1994; 1:271-277.
59. Makino R, Yazyu H, Kishimoto Y, Sekiya T, Hayashi K.
F-SSCP (fluorescence-based polymerase chain reaction-
singlestrand conformation polymorphism (PCR-SSCP)
analysis. PCR Methods and Application. 1992; 2:10-13
60. Cronn RC, Adams KL. Quantitative analysis of transcript
accumulation from genes duplicated by polyploidy using
cDNA SSCP. Biotechniques. 1990; 34:726-734
61. Welsh J, McClelland M. Fingerprinting genomes using
PCR with arbitrary primers. Nucleic Acids Research.

~ 1294 ~
Journal of Entomology and Zoology Studies
2003; 18:7213-7218.
62. Welsh J, Chada K, Dalal SS, Ralph D, Cheng R,
McClelland M. Arbitrarily primed PCR fingerprinting of
RNA. Nucleic Acids Research. 1992; 20:4965-4970.
63. Bachem CWB, van der Hoeve RS, de Bruijn SM,
Vreugdenhil D, Zabeau M, Visser RGF. Visualization of
differential gene expression using a novel method of
RNA fingerprinting based on AFLP: analysis of gene
expression during potato tuber development. The Plant
Journal. 1996; 9:745-753.
64. Bachem CWB, Oomen RJFJ, Visser GF. Transcript
imaging with cDNA-AFLP: a step-by-step protocol. Plant
Molecular Biology Reporter. 1998; 16:157
65. Liang P, Pardee AB. Differential display of eukaryotic
messenger RNA by means of the polymerase chain
reaction. Science. 1992; 257:967-997
66. Akihiro T, Umezawa T, Ueki C, Lobna B, Mizuno K,
Ohta M et al. Genome wide cDNA-AFLP analysis of
genes rapidly induced by combined sucrose and ABA
treatment in rice cultured cells. FEBS Letters. 2006;
580(25):5947-5995.
67. Yaa YX, Li M, Liu Z, Hao YJ, Zhai H. A novel gene,
screened by cDNA-AFLP approach, contributes to
lowering the acidity of fruit in apple. Plant Physiology
and Biochemistry. 2007; 45:139-145.
68. Mao C, Yi K, Yang L, Zheng B, Wu Y, Liu F et al.
Identification of aluminium-regulated genes by cDNA-
AFLP in rice (Oryza sativa L.): aluminium-regulated
genes for the metabolism of cell wall components.
Journal of Experimantal Botony. 2004; 55:137-143.
69. Meuwissen THE, Goddard ME. The use of marker-
haplotypes in animal breeding schemes. Genetics
Selection Evolution. 1996; 28:161-176.
70. Dekkers JC. Commercial application of marker- and
gene-assisted selection in livestock: strategies and
lessons. Journal of Animal Science. 2004; 82:313-328.
71. Pongpisantham B. Applying genotype and marker-
assisted selection for the improvement of quantitative
traits in poultry. M.Sc. thesis. University of New
England, 1994, 121.
72. Ruane J, Colleau JJ. Marker assisted selection for a sex-
limited character in a nucleus breeding population.
Journal of Dairy Science. 1996; 79:1666-1678.
73. Ruane J, Colleau JJ. Marker assisted selection for genetic
improvement of animal populations when a single QTL is
marked. Genetics Research. 1995; 66:71-83.
74. Clarke BE. Use of molecular markers in genetic
evaluation of animals with applications in Australian
Merinos. Ph.D. Thesis. University of New England.
Armidale, NSW, Australia, 1997.
75. Meuwissen THE, van Arendonk JAM. Potential
improvements in rate of genetic gain from marker
assisted selection in dairy cattle breeding schemes.
Journal of Dairy Science. 1992; 75:1651-1659.
76. Spelman R, Garrick D. Utilisation of marker assisted
selection in a commercial dairy cow population.
Livestock Production Science. 1997; 47:139-147.
77. Gootwine E, Zenu A, Bor A, Yossafi S, Rosov A, Pollott
GE. Genetic and economic analysis of introgression the B
allele of the FecB (Booroola) gene into the Awassi and
Assaf dairy breeds. Livestock Production Science. 2001;
71:49-58.
78. Groen AF, Smith C. A stochastic simulation study of the
efficiency of marker-assisted introgression in livestock.
Journal of Animal Breeding and Genetics. 1995;
112:161-170.
79. Hospital F, Bouchez A, Lecomte L, Causse M,
Charcosset A. Use of markers in plant breeding: Lessons
from genotype building experiments. Electronic
communication in Proceeding of 7th World Congress
Genetics Applied to Livestock Production. Montpellier,
France, 2002, 22:05
80. Baltimore D. Our genome unveiled. Nature. 2001;
409:814-816.
81. Rubin GM. The Draft sequences: Comparing species.
Nature. 2001; 409:820-821.
82. Dodgson JB, Cheng HH. Poultry genomics: An alien
perspective. Agri Biotech Net. 1999; 1:005.
83. Hayes H, Elduque M, Gautier L, Schibler E, Cribiu E,
Eggen A. Gene mapping progress in cattle and updated
comparative map with man, mouse, rat and pig.
Proceeding of XXVIII International Conference of
Animal Genetics, Göttingen, Germany, 2002.
84. Berg F, Archibald A, Anderson S, Moller M.
Comparative genome analyses between pig chromosome
4 and human chromosome 1 and 8. Proceeding of
XXVIII International Conference of Animal Genetics,
Göttingen, Germany, 2002.
85. Schmid M, Nanda I, Guttenbach M, Steinlein C, Hoehn
M, Schartl M et al. First report on chicken genes and
chromosomes. Cytogenetics and Cell Genetics. 2000;
90:169-218.
86. Band MRJH, Larson M, Reibeiz CA, Green DW, Heynen
J, Donovan R et al. An ordered comparative map of the
cattle and human genomes. Genome Research. 2000;
10:1359-1368.
87. Sonstegard TS, Van Tassel CP, Ashwell MS. Dairy cattle
genomics: Tools to accelerate genetic improvement?
Journal of Animal Science. 2001; 79:307-315.
88. Bovenhuis H, van Arendonk JAM, Davis G, Elsen JM,
Haley CS, Hill WG et al. Detection and mapping of
quantitative trait loci in farm animals. Livestock
Production Science. 1997; 52:135-144.
89. Ashwell MS, Heyen DW, Da Y, Sonstegard TS, Tassel
CP, Lewin HA. Detection of QTL affecting milk
production in 6 Diary Bull DANN Repository grandsire
families. Proceeding of XXVIII International Conference
of Animal Genetics, Göttingen, Germany, 2002.
90. Davis GP, Denise SK. The impact of genetic markers on
selection. Journal of Animal Science. 1998; 76:2331-
2339.
91. Marshall DM. Genetics of meat quality. In The genetics
of cattle. Eds. Fries, R. & Ruvinsky, A. CABI Publishing
CAB International, UK, 1999.
92. Casas E, Shackelford SD, Keele JW, Stone RT, Kappes
SM, Koohmaraie M. Quantitative trait loci affecting
growth and carcass composition of cattle segregating
alternate forms of myostatin. Journal of Animal Science.
2000; 78:560-569.
93. Vaiman D. The molecular genetics of cattle. In: The
Genetics of Cattle. Eds. Fries, R. and Ruvinsky, A.,
CABI Publishing, CAB International, UK, 1999.
94. Ashwell MS, Rexroad CE, Miller RH, Van Raden PM,
Da Y. Detection of loci affecting milk production and
health traits in an elite US Holstein population using
microsatellite markers. Animal Genetics. 1997; 28:216-
222.
95. Van Kaam JBCHM, Van Arendonk JAM, Groenen
MAM, Bovenhuis H, Vereijken ALJ, Crooijmans RPMA
et al. Whole genome scan for quantitative trait loci
~ 1295 ~
Journal of Entomology and Zoology Studies
affecting body weight in chickens using a three
generation design. Livestock Production Science. 1998;
54:133-150.
96. Jacobsson LU, Hee-Bok P, Siegel PB, Anderson L.
Mapping of Quantitative Loci for growth and fatness in
chickens. Proceeding of XXVIII International
Conference of Animal Genetics, Göttingen, Germany,
2002.
97. Ruyter S, Carolien P, Gu ZL, Van der Poel JJ, Groenen
MAM. Bulked segregant analysis using microsatellites:
Mapping of the dominant white locus in the chicken.
Poult Science. 1998; 76:386-391.
98. Bustamante CD, Nielsen R, Sawyer SA, Olsen KM,
Purugganan MD, Hartl DL. The cost of inbreeding in
Arabidopsis. Nature. 2002; 416:531-534.
99. Frank SA, Slatkin M. Fisher’s fundamental theorem of
natural selection. Trends in Ecology and Evolution. 1992;
7:92-95.
100. Scherf BD. Developing the global inventory for poultry
genetic resources. Proceeding of Third Global
Conference on Conservation of Domestic Animal
Genetic Resources. Queens University, Canada. Eds.
Crawford RD, Lister EE and Buckley JT, Rare Breeds
International, Warwickshire, UK, 1995.
101. Gandini GC, Oldenbroek JK. Choosing the conservation
strategy. In: Genebanks and the conservation of farm
animal genetic resources. Ed. Oldenbroek, J.K., DLO
Institute for Animal Science and Health, The
Netherlands, 1999.
102. Buchanan FC, Adams LJ, Littlejohn RP, Maddox JF,
Crawford AM. Determination of evolutionary
relationships among sheep breeds using microsatellites.
Genomics. 1994; 22:397-403.
103. Van Zeveren A, Peelman L, Van de Weghe A, Bouquet
Y. A genetic study of four Belgian pig populations by
means of seven microsatellite loci. Journal of Animal
Breeding and Genetics. 1995; 112:191-204.
104. MacHugh DE, Shriver MD, Loftus RT, Cunningham P,
Bradley DG. Microsatellite DNA variation and the
evolution, domestication and phylogeography of Taurine
and Zebu cattle (Bos taurus and Bos indicus). Genetics.
1997; 146:1071-1086.
105. Vanhala T, Tuiskula-Haavisto M, Elo K, Vilkki J, Maki-
Tanilla A. Evaluation of genetic variability and genetic
distances between eight chicken lines using microsatellite
markers. Poultry Science. 1998; 77:783-790.
106. Rohrer GA, Alexander LJ, Hu Z, Smith TPL, Keele JW,
Beattie CW. A comprehensive map of the porcine
genome. Genome Research. 1996; 6:371-391.
107. Krüger K, Stranzinger G, Rieders S. A full genome scan
panel of horse (Equus caballus) microsatellite markers
applied to different equid species. Proceeding of XXVIII
International Conference of Animal Genetics, Göttingen,
Germany, 2002.
108. Vignal A, Milan D, San Cristobal M, Eggen A. A review
on SNP and other types of molecular markers and their
use in animal genetics. Genetics Selection Evolution.
2002; 34:275-305.
109. Peter G. An assessment of the utility of single nucleotide
polymorphisms (SNPs) for forensic purposes.
International journal of Legal Medicine. 2001; 114:204-
210.
110. Beuzen ND, Stear MJ, Chang KC. Molecular markers
and their use in animal breeding. The Veterinary Journal.
2000; 160:42-52.
111. Brooks SA, Gabreski N, Miller D, Brisbin A, Brown HE,
Streeter C et al. Whole-genome SNP association in the
horse: identification of a deletion in myosin Va
responsible for lavender foal syndrome. PLoS Genetics.
2010; 6:e1000909.
112. Amaral AJ, Megens HJ, Crooijmans RPMA, Heuven
HCM, Groenen MAM. Linkage disequilibrium decay and
haplotype block structure in the pig. Genetics. 2008;
179:569-579.
113. Werner M, Herbon N, Gohlke H, Altmuller J, Knappw
M, Heinrich J et al. Asthma is associated with single-
nucleotide polymorphisms in ADAM33. Clinical and
Experimental Allergy. 2004; 34:26-31.
114. Paterson AH, Tanksley SD, Sorrells ME. DNA markers
in plant improvement. Advances in Agronomy. 1991;
46:39-90.
115. Beattie CW. Livestock genome maps. Trends in
Genetics. 1994; 10:334-338.
116. Ahmadian A, Gharizadeh B, Gustafsson AC, Sterky F,
Nyren P, Uhlen M et al. Singlenucleotide polymorphism
analysis by pyrosequencing. Analytical Biochemistry.
2000; 280:103-110.
117. Fisher BL, Smith MA. A revision of Malagasy species of
Anochetus mayr and Odontomachus latreille
(Hymenoptera: Formicidae). PLoS ONE. 2008;
3(5):1787.
118. Rach J, Desalle R, Sarkar IN, Schierwater B, Hadrys H.
Character–based DNA barcoding allows discrimination
of genera, species and populations in Odonata.
Proceedings: Biological Sciences. 2008; 275:237-247.
119. Fleischer RC, Kirchman JJ, Dumbacher JP, Bevier L,
Dove C, Rotzel NC et al. Mid–Pleistocene divergence of
Cuban and North American ivory–billed woodpeckers.
Biology Letters. 2006; 2:466-469.
120. Smith MA, Woodley NE, Janzen DH, Hallwachs W,
Hebert PD. DNA barcodes reveal cryptic host–specificity
within the presumed polyphagous members of a genus of
parasitoid flies (Diptera tachinidae). Proceedings of
National Academy of Sciences USA. 2006; 103:3657-
3662.
121. Lorenz JG, Jackson WE, Beck JC, Hanner R. The
problems and promise of DNA barcodes for species
diagnosis of primate biomaterials. Philosophical
Transactions of the Royal Society London B: Biological
Sciences. 2005; 360:1869-1877.


![barcodes [Recovered]](https://img.pdfslide.us/doc/110x75/5885f0ec1a28ab864f8b5c79/barcodes-recovered.jpg)