Embed Size (px)
Citation preview
APPLICATION OF ACCOUNTING PRINCIPLES: A CASE-BY-CASE STUDY
by
Austin Lee Daher
A thesis submitted to the faculty of The University of Mississippi in partial fulfillment of
the requirements of the Sally McDonnell Barksdale Honors College.
Oxford
May 2019
Approved by
___________________________________
Advisor: Dr. Victoria Dickinson
___________________________________
Reader: Dean W. Mark Wilder

ii
© 2019
Austin Lee Daher
ALL RIGHTS RESERVED
iii
ABSTRACT
AUSTIN LEE DAHER: Application of Accounting Principles: A Case-by-Case Study
(Under the direction of Dr. Victoria Dickinson)
This thesis consists of a series of case studies investigating various accounting
issues in real world situations. Each case study, independent of one another, focuses on
the application of different accounting standards in a variety of industries. This thesis also
reinforces the understanding of underlying accounting concepts in financial statement
preparation and analysis, and it presents rising accounting issues. By utilizing the
Financial Accounting Standards Board (FASB) Accounting Standards Codification, I was
able to apply the appropriate FASB guidelines and proper accounting treatment to these
specific situations. Through the completion of these studies, I have gained an enhanced
understanding of accounting principles that can be applied to my academic and
professional career.
iv
TABLE OF CONTENTS
Table of Figures ..................................................................................................................v
Case Study 1: Home Heaters, Inc ........................................................................................5
Case Study 2: Molson Coors Brewing Company ..............................................................21
Case Study 3: Pearson, PLC ..............................................................................................32
Case Study 4: Palfinger AG ...............................................................................................45
Case Study 5: Volvo Group ................................................................................................59
Case Study 6: Google Fusion Tables .................................................................................71
Case Study 7: Rite Aid Corporation...................................................................................83
Case Study 8: Merck & Co., Inc ......................................................................................100
Case Study 9: State Street Corporation ............................................................................ 111
Case Study 10: ZAGGS, Inc ............................................................................................125
Case Study 11: Apple, Inc ................................................................................................140
v
TABLE OF FIGURES
Case Study 1:
Figure 1-1 .............................................................................................................................3
Figure 1-2 .............................................................................................................................6
Figure 1-3 ...........................................................................................................................10
Figure 1-4 ...........................................................................................................................13
Figure 1-5 ...........................................................................................................................16
Figure 1-6 ...........................................................................................................................19
Case Study 3:
Figure 3-1 ...........................................................................................................................39
Figure 3-2 ...........................................................................................................................42
Figure 3-3 ...........................................................................................................................44
Case Study 4:
Figure 4-1 ...........................................................................................................................54
Figure 4-2 ...........................................................................................................................55
Figure 4-3 ...........................................................................................................................55
Case Study 5:
Figure 5-1 ...........................................................................................................................66
Figure 5-2 ...........................................................................................................................67
Figure 5-3 ...........................................................................................................................68
Figure 5-4 ...........................................................................................................................68
Figure 5-5 ...........................................................................................................................69
Figure 5-6 ...........................................................................................................................69
vi
Figure 5-7 ...........................................................................................................................70
Case Study 7:
Figure 7-1 ...........................................................................................................................97
Case Study 8:
Figure 8-1 .........................................................................................................................109

1
Case Study 1: Home Heaters, Inc.
September 6, 2017
2
I. Executive Summary
In this scenario, two companies begin operations selling home heating units.
Glenwood Heating, Inc. and Eads Heater, Inc. are both located in Colorado and operate
under similar economic decisions. Throughout their first year, the two companies have
identical transactions; however, they begin to diverge with their accounting choices and
records. By applying different methods and managerial decisions, the two companies
resulted in different outcomes. This scenario illustrates the effects of choosing different
estimates and methods when applying generally accepted accounting principles (GAAP)
in preparing a company’s financial statements. Even though two companies started up the
same with identical transactions, managerial decisions and accounting methods can result
in differences in the companies’ financial statements.
From this case, I have learned which accounts need to be in specific places on the
financial statements for them to be accurate and balance. Specifically, the accounts
related to the rental or capital lease of equipment were different for the two companies
because of the managerial decision involved. With Eads’ capital lease agreement, the paid
principal must be deducted from the payable account in order for the interest payable and
lease payable to be accurate. In addition to learning, I was able to improve upon my
existing knowledge of creating financial statements and calculating depreciations and
liabilities. This scenario has fully taught me the importance of GAAP methods and
managerial decisions for the future success of a company.
3
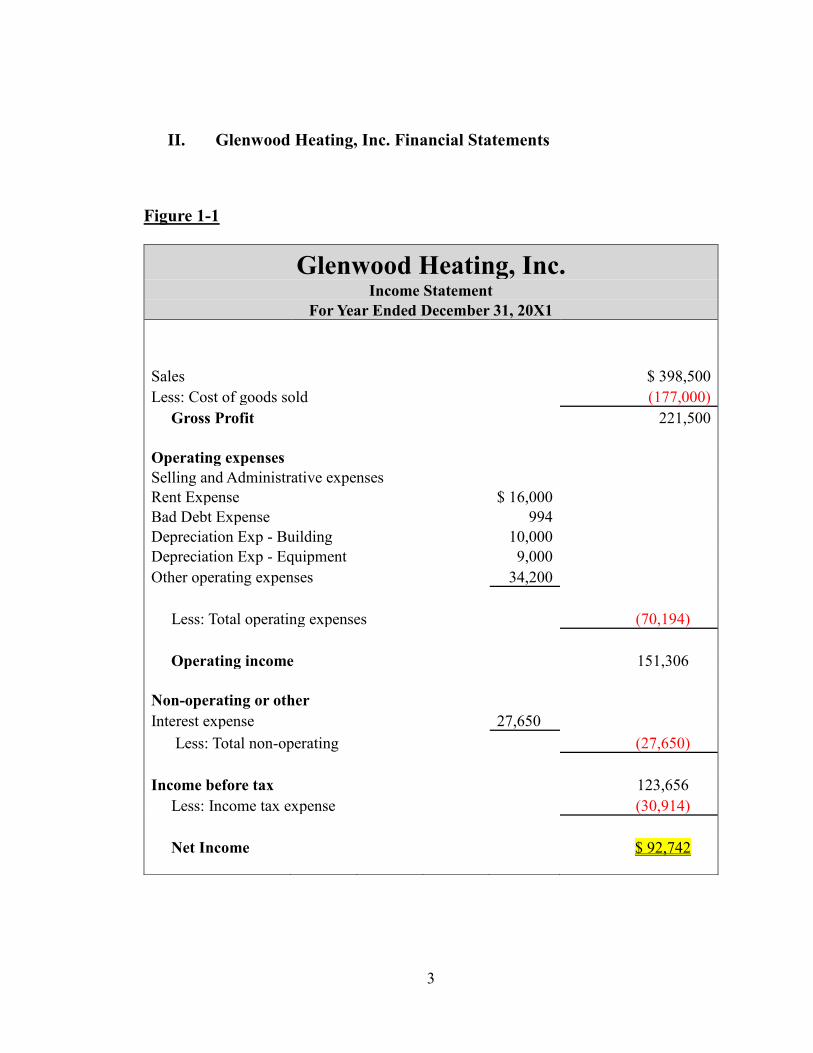
II. Glenwood Heating, Inc. Financial Statements
Figure 1-1
Glenwood Heating, Inc. Income Statement
For Year Ended December 31, 20X1
Sales $ 398,500
Less: Cost of goods sold (177,000)
Gross Profit 221,500
Operating expenses
Selling and Administrative expenses
Rent Expense $ 16,000 Bad Debt Expense 994 Depreciation Exp - Building 10,000 Depreciation Exp - Equipment 9,000 Other operating expenses 34,200
Less: Total operating expenses (70,194)
Operating income 151,306
Non-operating or other
Interest expense 27,650
Less: Total non-operating (27,650)
Income before tax 123,656
Less: Income tax expense (30,914)
Net Income $ 92,742
4
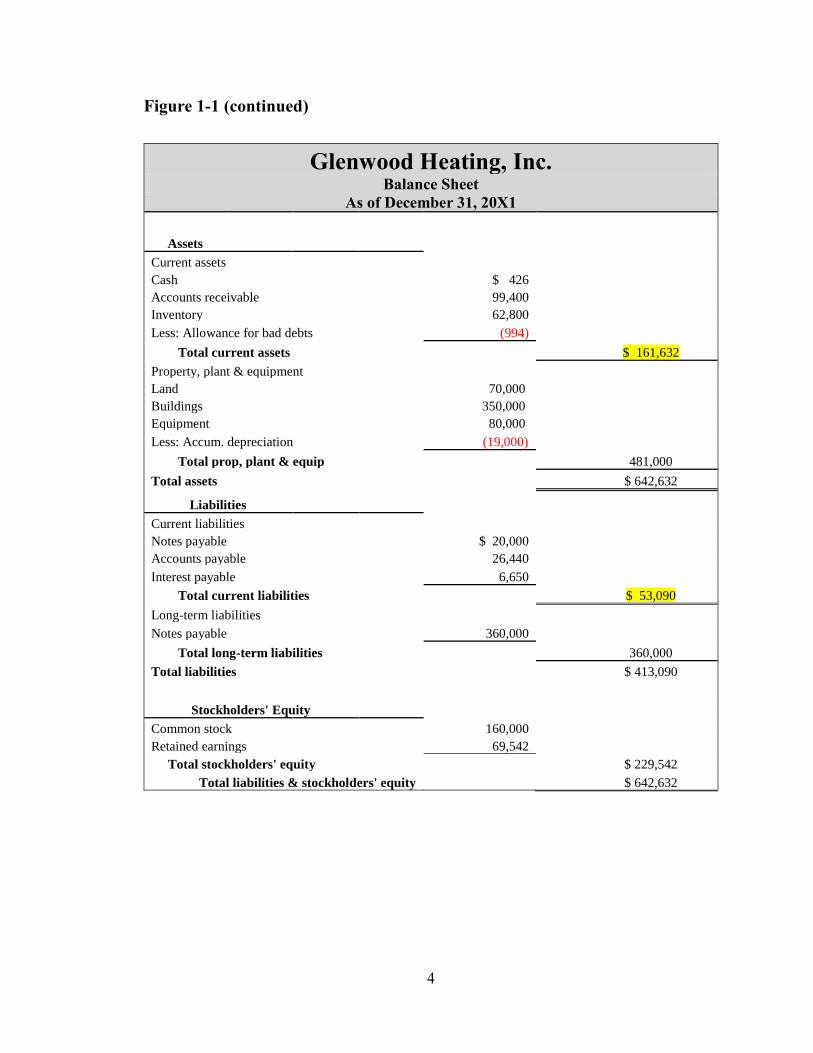
Figure 1-1 (continued)
Glenwood Heating, Inc. Balance Sheet
As of December 31, 20X1
Assets
Current assets
Cash $ 426
Accounts receivable 99,400
Inventory 62,800
Less: Allowance for bad debts (994)
Total current assets $ 161,632
Property, plant & equipment Land 70,000 Buildings 350,000 Equipment 80,000
Less: Accum. depreciation (19,000)
Total prop, plant & equip 481,000
Total assets $ 642,632
Liabilities
Current liabilities
Notes payable $ 20,000
Accounts payable 26,440
Interest payable 6,650
Total current liabilities $ 53,090
Long-term liabilities
Notes payable 360,000
Total long-term liabilities 360,000
Total liabilities $ 413,090
Stockholders' Equity
Common stock 160,000
Retained earnings 69,542
Total stockholders' equity $ 229,542
Total liabilities & stockholders' equity $ 642,632
5
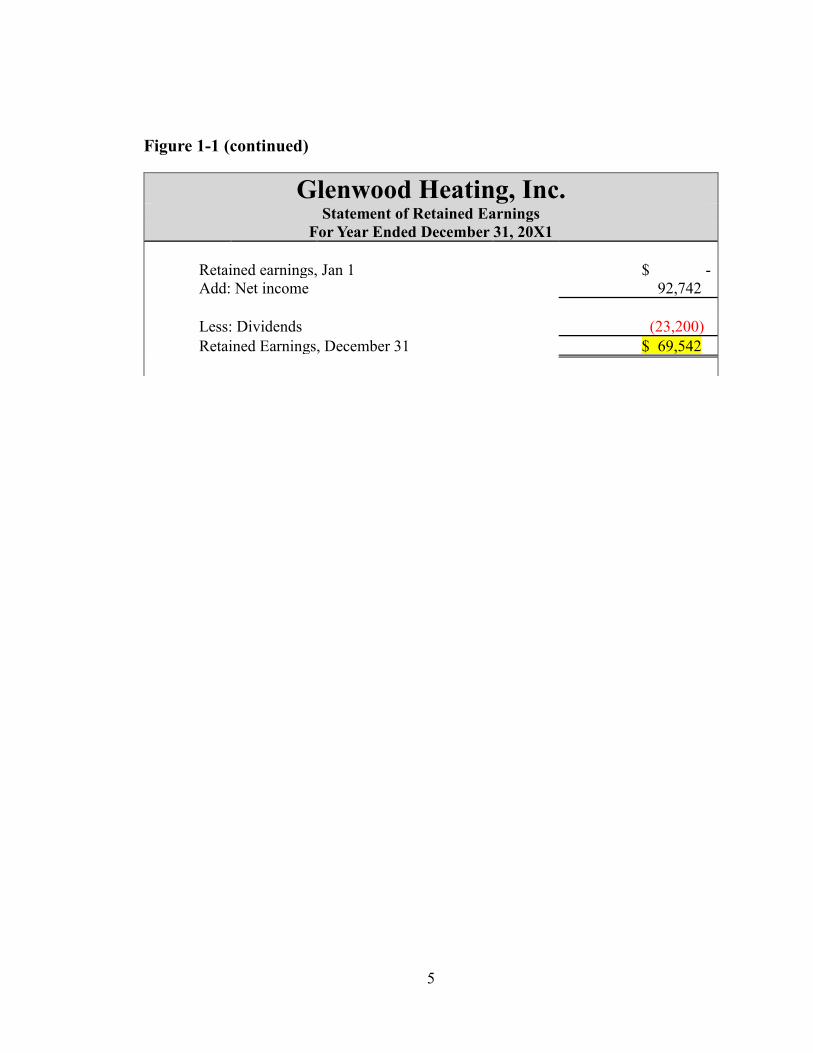
Figure 1-1 (continued)
Glenwood Heating, Inc. Statement of Retained Earnings
For Year Ended December 31, 20X1
Retained earnings, Jan 1 $ -
Add: Net income 92,742
Less: Dividends (23,200)
Retained Earnings, December 31 $ 69,542
6
III. Eads Heating, Inc. Financial Statements
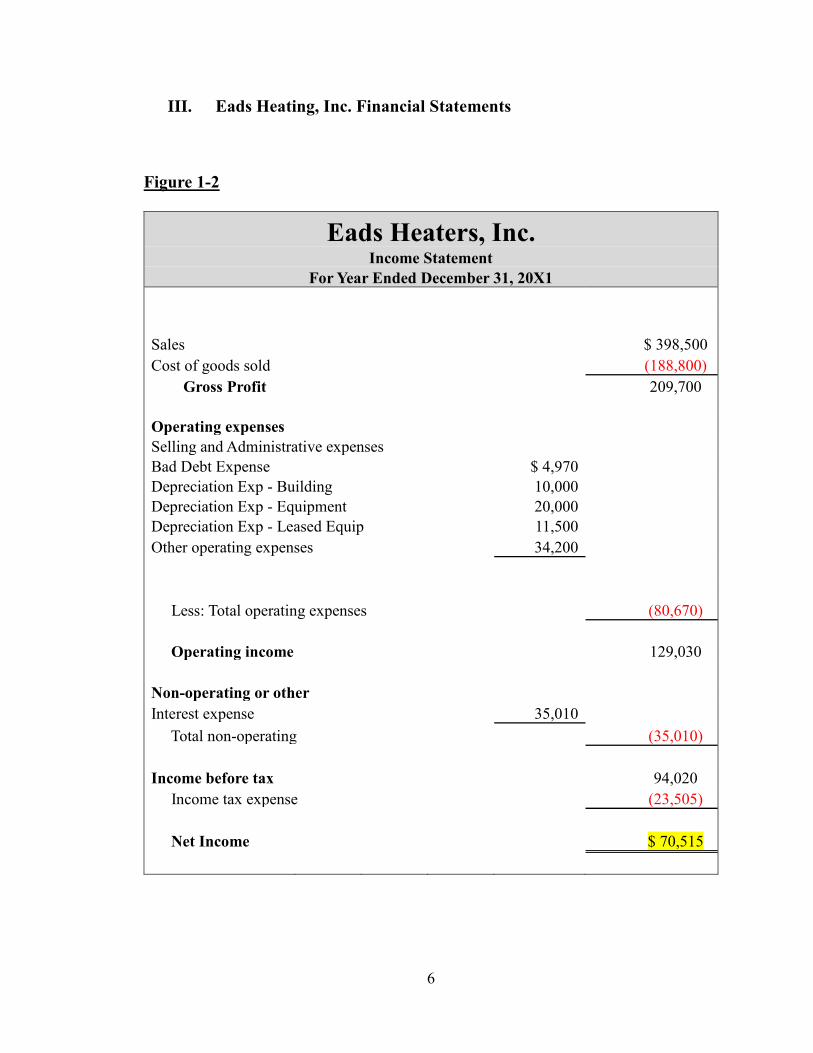
Figure 1-2
Eads Heaters, Inc. Income Statement
For Year Ended December 31, 20X1
Sales
$ 398,500
Cost of goods sold (188,800)
Gross Profit 209,700
Operating expenses
Selling and Administrative expenses
Bad Debt Expense $ 4,970 Depreciation Exp - Building 10,000 Depreciation Exp - Equipment 20,000 Depreciation Exp - Leased Equip 11,500 Other operating expenses 34,200
Less: Total operating expenses (80,670)
Operating income 129,030
Non-operating or other
Interest expense 35,010
Total non-operating (35,010)
Income before tax 94,020
Income tax expense (23,505)
Net Income $ 70,515
7
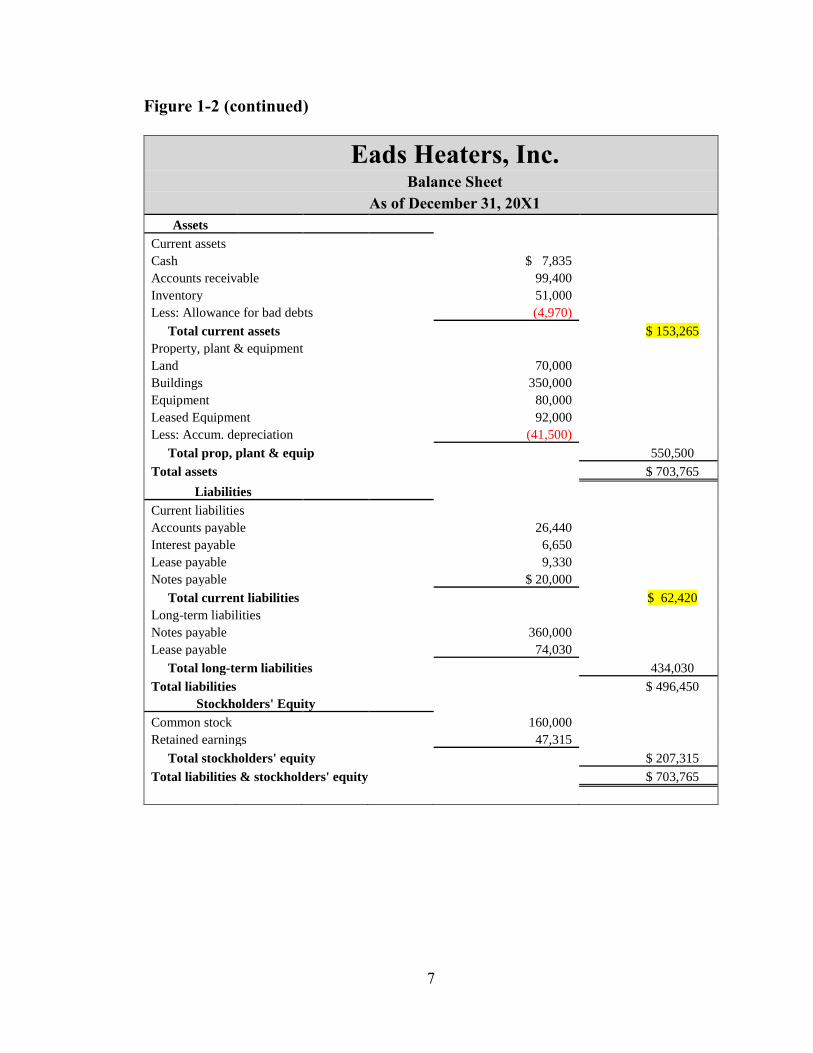
Figure 1-2 (continued)
Eads Heaters, Inc. Balance Sheet
As of December 31, 20X1
Assets
Current assets
Cash $ 7,835 Accounts receivable 99,400 Inventory 51,000 Less: Allowance for bad debts (4,970)
Total current assets $ 153,265
Property, plant & equipment Land 70,000 Buildings 350,000 Equipment 80,000 Leased Equipment 92,000 Less: Accum. depreciation (41,500)
Total prop, plant & equip 550,500
Total assets $ 703,765
Liabilities
Current liabilities Accounts payable 26,440 Interest payable 6,650 Lease payable 9,330 Notes payable $ 20,000
Total current liabilities $ 62,420
Long-term liabilities Notes payable 360,000 Lease payable 74,030
Total long-term liabilities 434,030
Total liabilities $ 496,450
Stockholders' Equity
Common stock 160,000 Retained earnings 47,315
Total stockholders' equity $ 207,315
Total liabilities & stockholders' equity $ 703,765
8
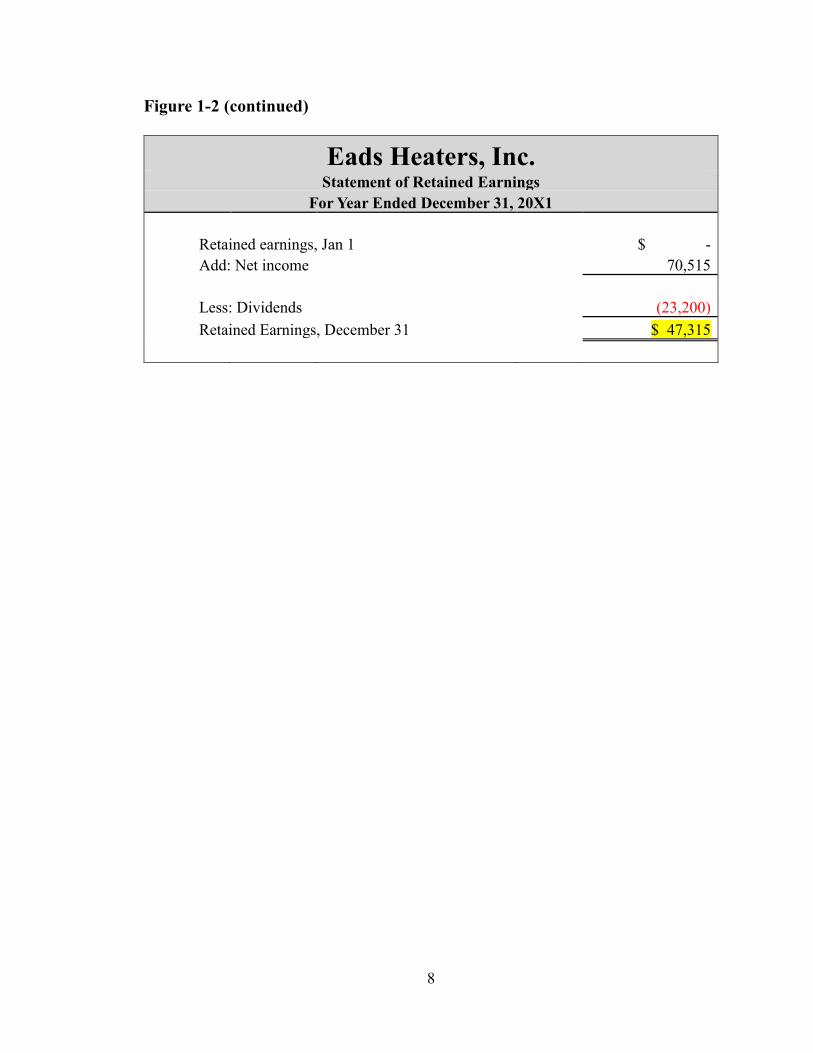
Figure 1-2 (continued)
Eads Heaters, Inc.
Statement of Retained Earnings
For Year Ended December 31, 20X1
Retained earnings, Jan 1 $ -
Add: Net income 70,515
Less: Dividends (23,200)
Retained Earnings, December 31 $ 47,315
9
IV. Analysis
Between the two companies, Glenwood Heating, Inc. is revealed to be the better
investment option. This company has a higher net income of $ 92,742 and retained
earnings of $ 69,542 than Eads Heaters, Inc’s net income of $70,515 and retained
earnings of $ 47,315. Furthermore, Glenwood has higher current assets of $ 161,632, as
well as, lower current liabilities of $53,090. This means Glenwood has the better ability
to pay off its short-term debts. Eads’ financial statements show $ 153,265 in current
assets and $ 62,420 in current liabilities. (All of these balances are highlighted within the
statements for easier identification.) With the higher profitability and better standing,
Glenwood Heating, Inc. has better prospects for the investments.

10
V. Additional Figures
Glenwood Heating, Inc. and Eads Heaters, Inc. Figures
Figure 1-3
Home Heaters Chart of Accounts
Asset Accounts Equity Accounts Cash Common Stock
Accounts Receivable Retained earnings
Allowance for bad debts Dividends
Inventory Sales
Land Cost of goods sold
Building Bad debt expense
Accumulated depreciation, building Depreciation expense
Equipment Interest expense
Accumulated depreciation, equipment Other operating expenses
Leased equipment Rent expense
Accumulated depreciation, leased equipment Provision for income taxes
Liability Accounts
Accounts Payable
Interest Payable
Note Payable
Lease Payable
11
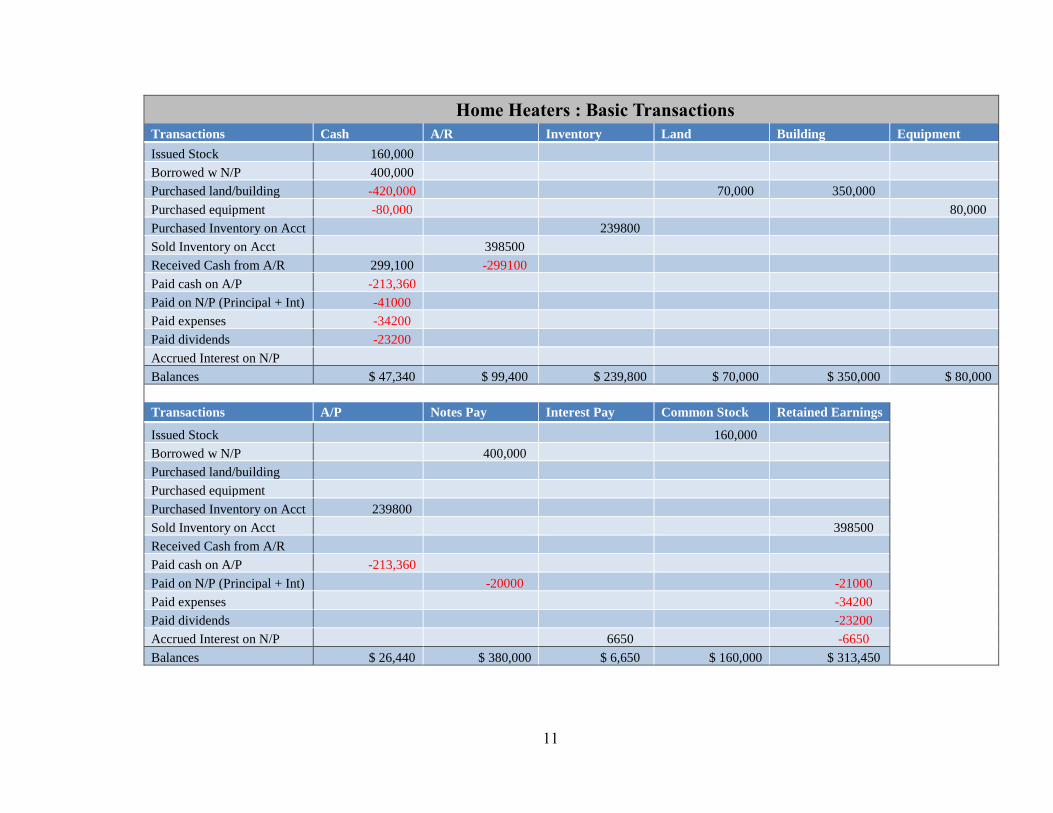
Home Heaters : Basic Transactions
Transactions Cash A/R Inventory Land Building Equipment
Issued Stock 160,000
Borrowed w N/P 400,000
Purchased land/building -420,000 70,000 350,000
Purchased equipment -80,000 80,000
Purchased Inventory on Acct 239800
Sold Inventory on Acct 398500
Received Cash from A/R 299,100 -299100
Paid cash on A/P -213,360
Paid on N/P (Principal + Int) -41000
Paid expenses -34200
Paid dividends -23200
Accrued Interest on N/P
Balances $ 47,340 $ 99,400 $ 239,800 $ 70,000 $ 350,000 $ 80,000
Transactions A/P Notes Pay Interest Pay Common Stock Retained Earnings
Issued Stock 160,000
Borrowed w N/P 400,000
Purchased land/building
Purchased equipment
Purchased Inventory on Acct 239800
Sold Inventory on Acct 398500
Received Cash from A/R
Paid cash on A/P -213,360
Paid on N/P (Principal + Int) -20000 -21000
Paid expenses -34200
Paid dividends -23200
Accrued Interest on N/P 6650 -6650
Balances $ 26,440 $ 380,000 $ 6,650 $ 160,000 $ 313,450
12
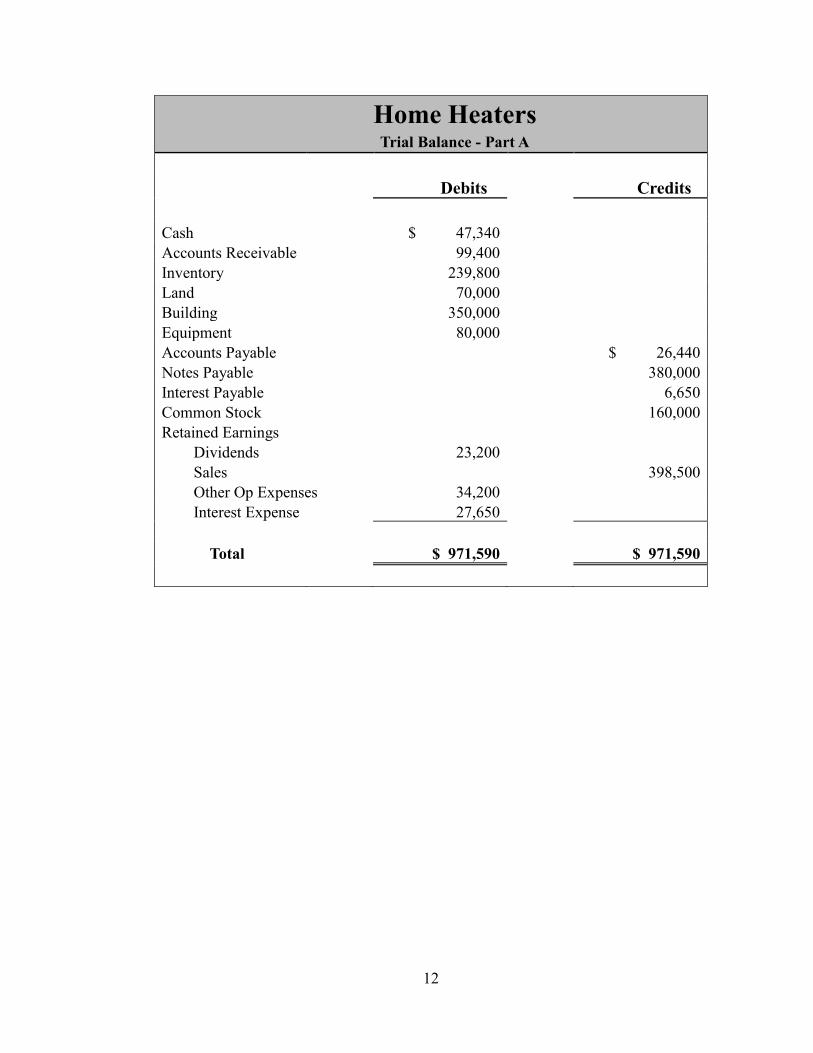
Home Heaters Trial Balance - Part A
Debits Credits
Cash $ 47,340
Accounts Receivable 99,400
Inventory 239,800
Land 70,000
Building 350,000
Equipment 80,000
Accounts Payable $ 26,440
Notes Payable 380,000
Interest Payable 6,650
Common Stock 160,000
Retained Earnings
Dividends 23,200
Sales 398,500
Other Op Expenses 34,200
Interest Expense 27,650
Total $ 971,590 $ 971,590
13
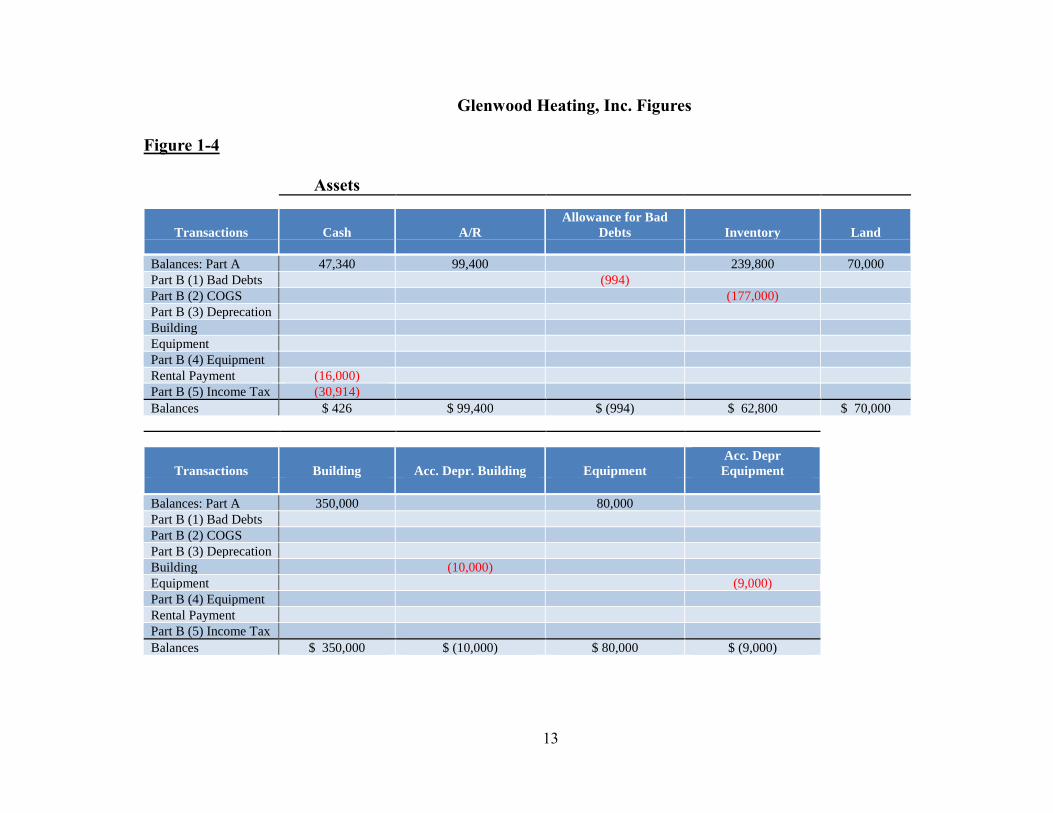
Glenwood Heating, Inc. Figures
Figure 1-4
Assets
Transactions Cash A/R
Allowance for Bad
Debts Inventory Land
Balances: Part A 47,340 99,400 239,800 70,000
Part B (1) Bad Debts (994) Part B (2) COGS (177,000) Part B (3) Deprecation Building Equipment Part B (4) Equipment Rental Payment (16,000) Part B (5) Income Tax (30,914) Balances $ 426 $ 99,400 $ (994) $ 62,800 $ 70,000
Transactions Building Acc. Depr. Building Equipment
Acc. Depr
Equipment
Balances: Part A 350,000 80,000 Part B (1) Bad Debts Part B (2) COGS Part B (3) Deprecation Building (10,000) Equipment (9,000) Part B (4) Equipment Rental Payment Part B (5) Income Tax Balances $ 350,000 $ (10,000) $ 80,000 $ (9,000)
14
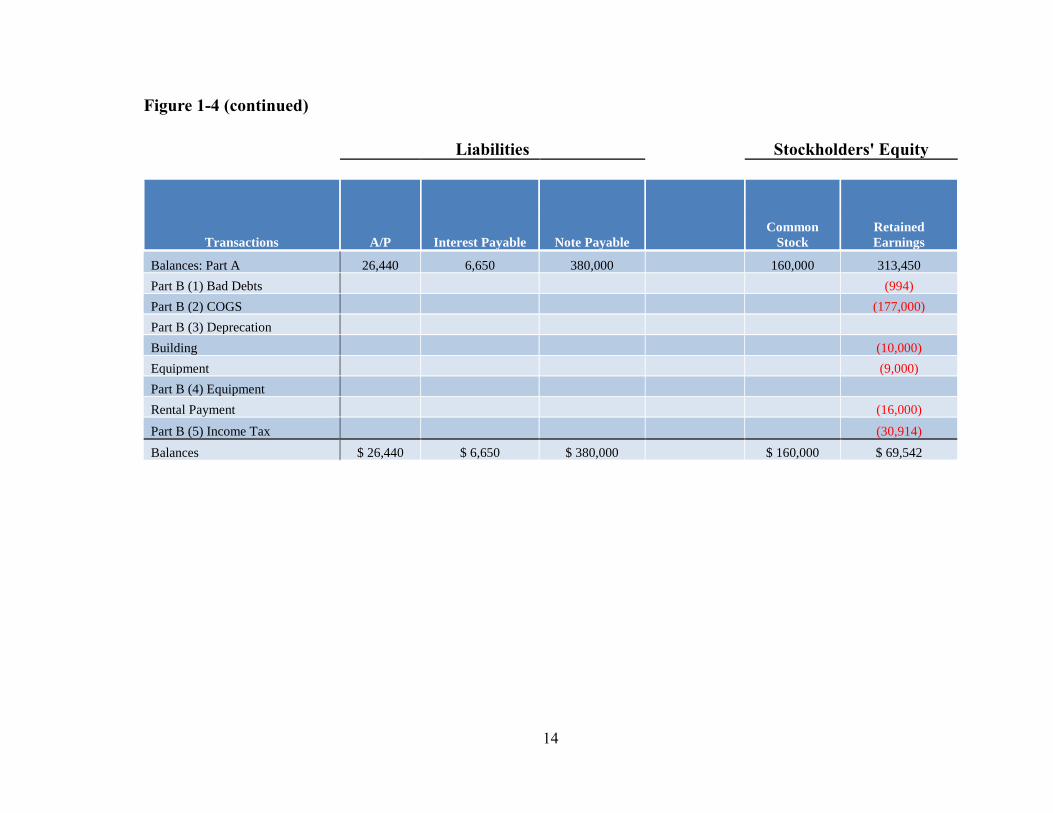
Figure 1-4 (continued)
Liabilities Stockholders' Equity
Transactions A/P Interest Payable Note Payable
Common
Stock
Retained
Earnings
Balances: Part A 26,440 6,650 380,000 160,000 313,450
Part B (1) Bad Debts (994)
Part B (2) COGS (177,000)
Part B (3) Deprecation
Building (10,000)
Equipment (9,000)
Part B (4) Equipment
Rental Payment (16,000)
Part B (5) Income Tax (30,914)
Balances $ 26,440 $ 6,650 $ 380,000 $ 160,000 $ 69,542
15
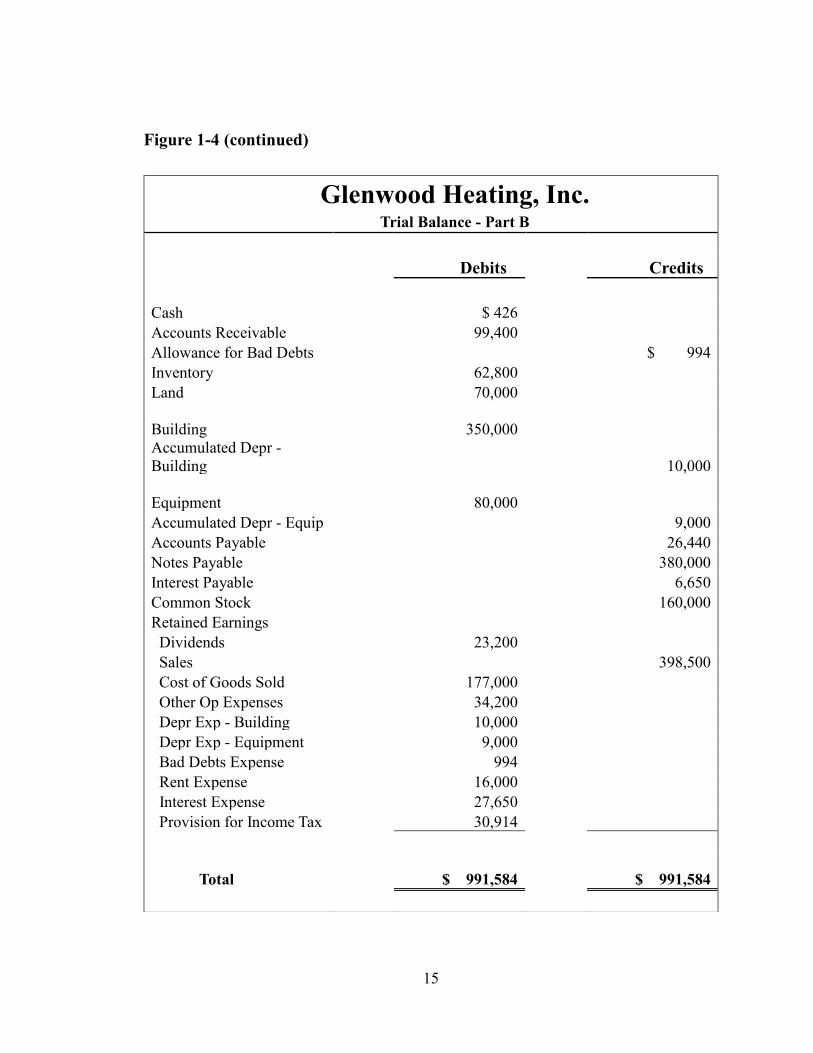
Figure 1-4 (continued)
Glenwood Heating, Inc. Trial Balance - Part B
Debits Credits
Cash $ 426
Accounts Receivable 99,400 Allowance for Bad Debts $ 994
Inventory 62,800
Land 70,000
Building
350,000
Accumulated Depr -
Building 10,000
Equipment
80,000
Accumulated Depr - Equip 9,000
Accounts Payable 26,440
Notes Payable 380,000
Interest Payable 6,650
Common Stock 160,000
Retained Earnings
Dividends 23,200
Sales 398,500
Cost of Goods Sold 177,000
Other Op Expenses 34,200
Depr Exp - Building 10,000
Depr Exp - Equipment 9,000
Bad Debts Expense 994
Rent Expense 16,000
Interest Expense 27,650
Provision for Income Tax 30,914
Total
$ 991,584
$ 991,584
16
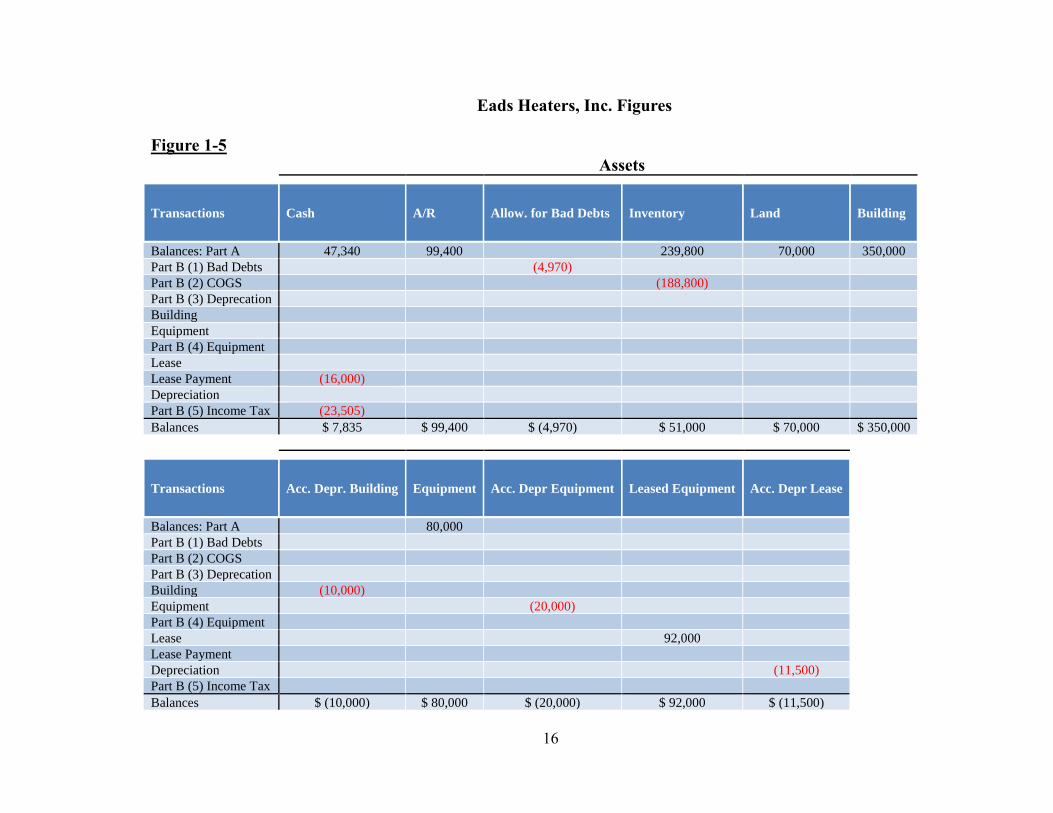
Eads Heaters, Inc. Figures
Figure 1-5
Assets
Transactions Cash A/R Allow. for Bad Debts Inventory Land Building
Balances: Part A 47,340 99,400 239,800 70,000 350,000
Part B (1) Bad Debts (4,970) Part B (2) COGS (188,800) Part B (3) Deprecation Building Equipment Part B (4) Equipment Lease Lease Payment (16,000) Depreciation Part B (5) Income Tax (23,505) Balances $ 7,835 $ 99,400 $ (4,970) $ 51,000 $ 70,000 $ 350,000
Transactions Acc. Depr. Building Equipment Acc. Depr Equipment Leased Equipment Acc. Depr Lease
Balances: Part A 80,000 Part B (1) Bad Debts Part B (2) COGS Part B (3) Deprecation Building (10,000) Equipment (20,000) Part B (4) Equipment Lease 92,000 Lease Payment Depreciation (11,500)
Part B (5) Income Tax Balances $ (10,000) $ 80,000 $ (20,000) $ 92,000 $ (11,500)
17
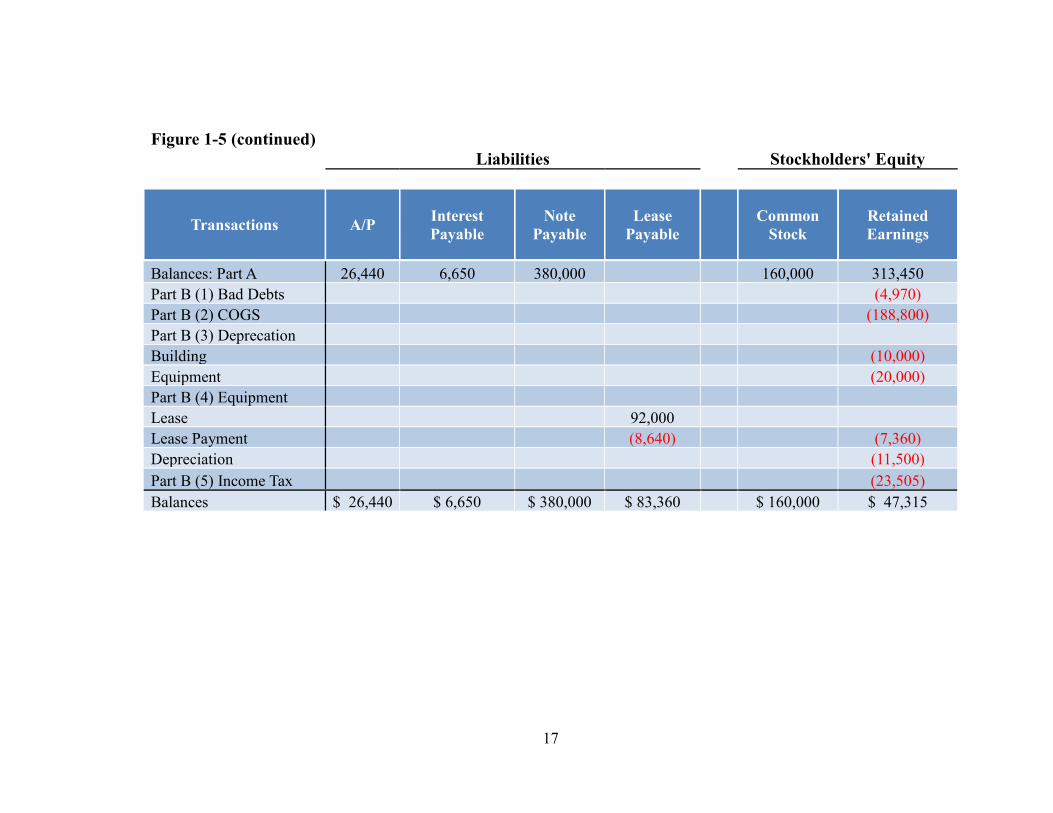
Figure 1-5 (continued)
Liabilities Stockholders' Equity
Transactions A/P Interest
Payable
Note
Payable
Lease
Payable Common
Stock
Retained
Earnings
Balances: Part A 26,440 6,650 380,000 160,000 313,450
Part B (1) Bad Debts (4,970)
Part B (2) COGS (188,800)
Part B (3) Deprecation Building (10,000)
Equipment (20,000)
Part B (4) Equipment Lease 92,000 Lease Payment (8,640) (7,360)
Depreciation (11,500)
Part B (5) Income Tax (23,505)
Balances $ 26,440 $ 6,650 $ 380,000 $ 83,360 $ 160,000 $ 47,315
18
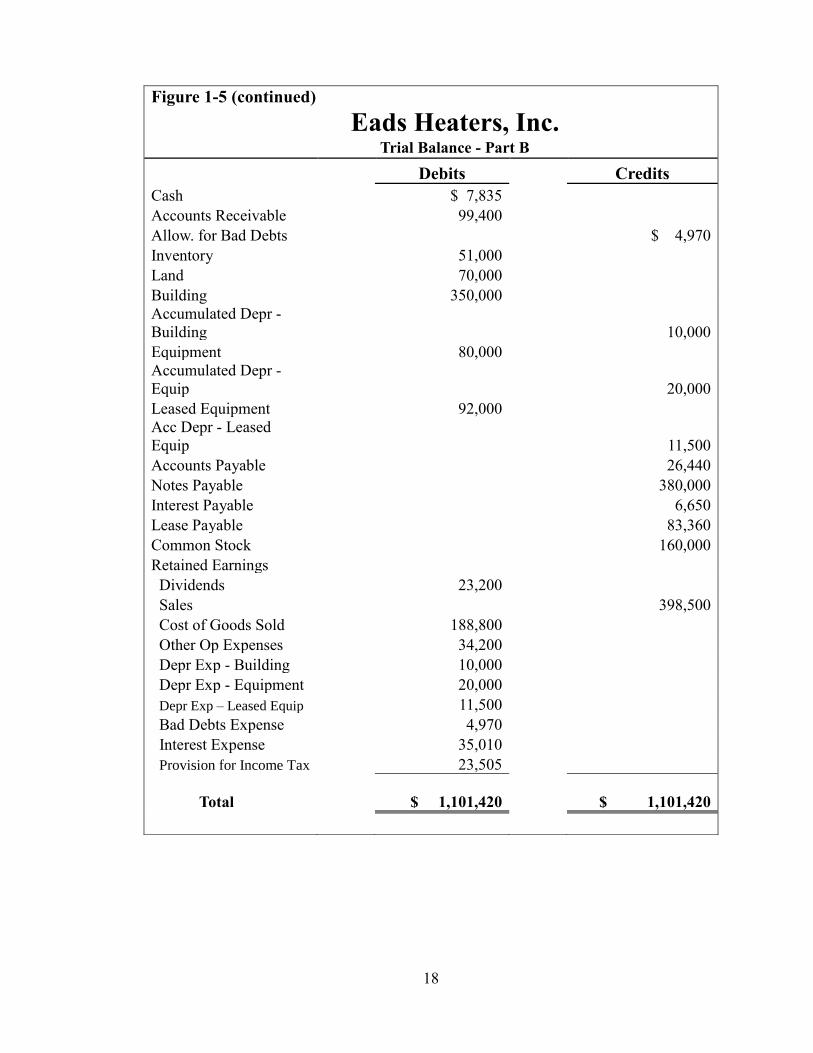
Figure 1-5 (continued)
Eads Heaters, Inc. Trial Balance - Part B
Debits Credits
Cash $ 7,835
Accounts Receivable 99,400 Allow. for Bad Debts $ 4,970
Inventory 51,000
Land 70,000
Building 350,000
Accumulated Depr -
Building
10,000
Equipment 80,000 Accumulated Depr -
Equip 20,000
Leased Equipment 92,000
Acc Depr - Leased
Equip 11,500
Accounts Payable 26,440
Notes Payable 380,000
Interest Payable 6,650
Lease Payable 83,360
Common Stock 160,000
Retained Earnings Dividends 23,200 Sales 398,500
Cost of Goods Sold 188,800
Other Op Expenses 34,200
Depr Exp - Building 10,000
Depr Exp - Equipment 20,000
Depr Exp – Leased Equip 11,500
Bad Debts Expense 4,970
Interest Expense 35,010
Provision for Income Tax 23,505
Total
$ 1,101,420
$ 1,101,420
19
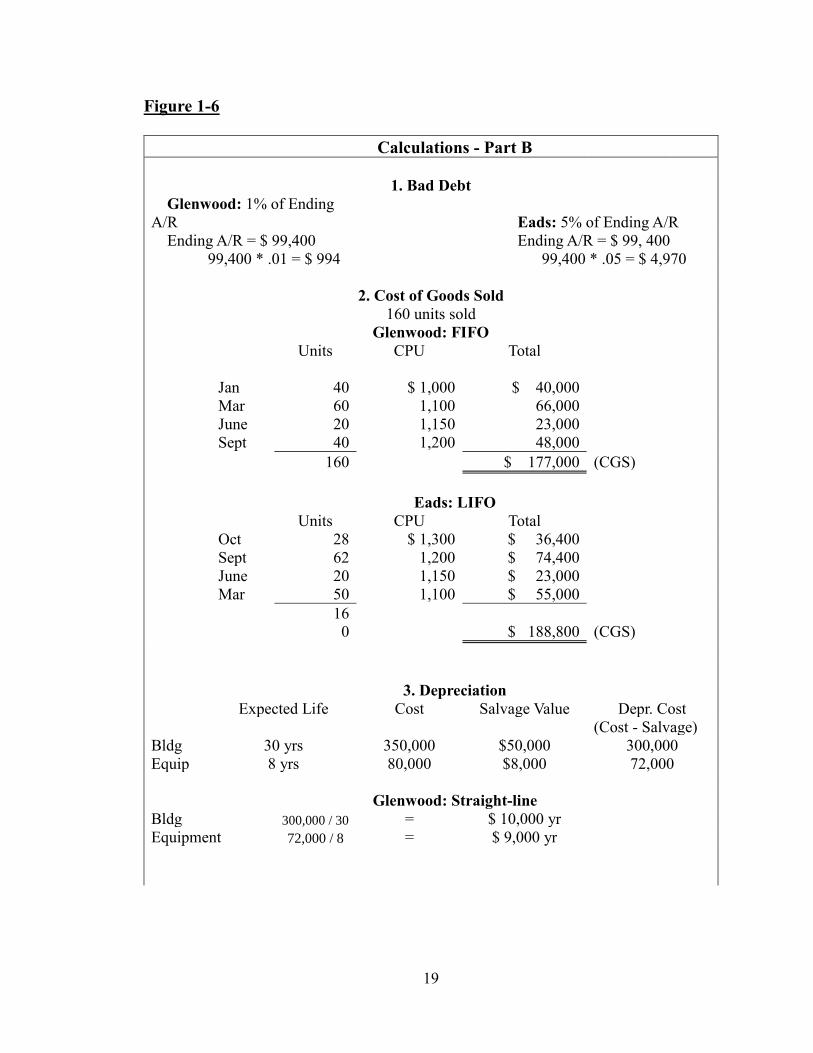
Figure 1-6
Calculations - Part B
1. Bad Debt
Glenwood: 1% of Ending
A/R Eads: 5% of Ending A/R
Ending A/R = $ 99,400 Ending A/R = $ 99, 400
99,400 * .01 = $ 994 99,400 * .05 = $ 4,970
2. Cost of Goods Sold
160 units sold
Glenwood: FIFO
Units CPU Total
Jan 40
$ 1,000
$ 40,000
Mar 60 1,100 66,000
June 20 1,150 23,000
Sept 40 1,200 48,000
160 $ 177,000 (CGS)
Eads: LIFO
Units CPU Total
Oct 28 $ 1,300 $ 36,400
Sept 62 1,200 $ 74,400
June 20 1,150 $ 23,000
Mar 50 1,100 $ 55,000
16
0 $ 188,800 (CGS)
3. Depreciation
Expected Life Cost Salvage Value Depr. Cost
(Cost - Salvage)
Bldg 30 yrs 350,000 $50,000 300,000
Equip 8 yrs 80,000 $8,000 72,000
Glenwood: Straight-line
Bldg 300,000 / 30 = $ 10,000 yr
Equipment 72,000 / 8 = $ 9,000 yr
20
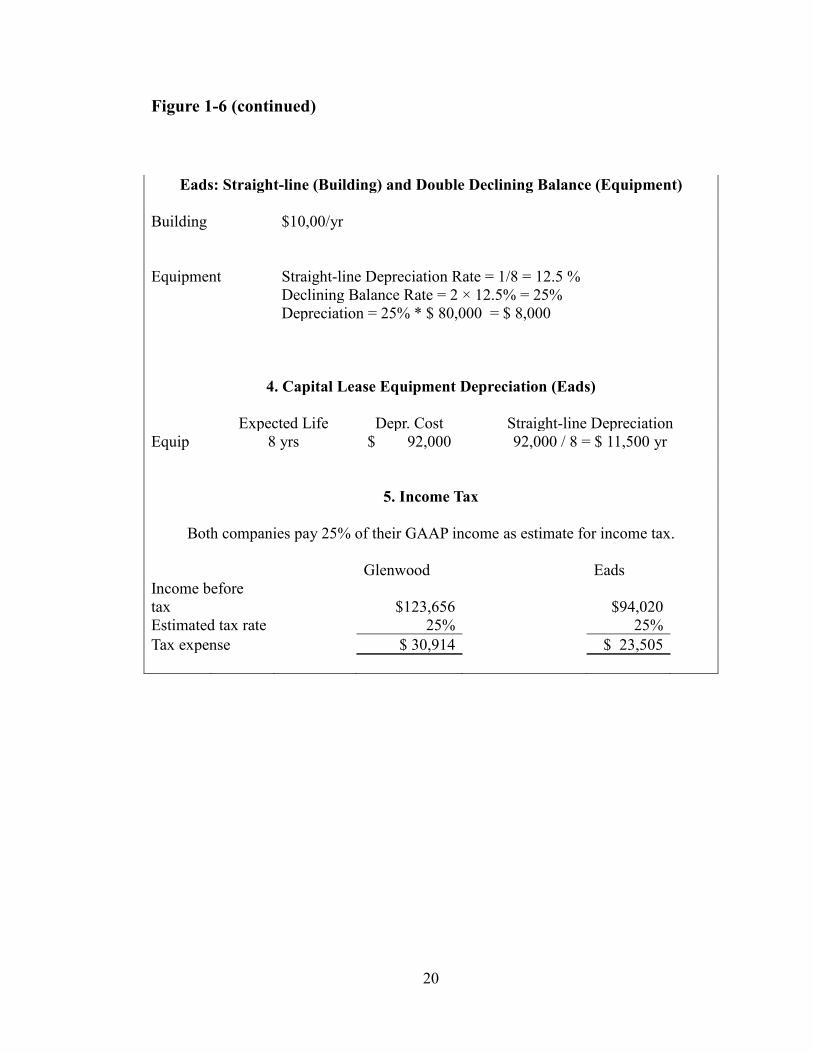
Figure 1-6 (continued)
Eads: Straight-line (Building) and Double Declining Balance (Equipment)
Building $10,00/yr
Equipment Straight-line Depreciation Rate = 1/8 = 12.5 %
Declining Balance Rate = 2 × 12.5% = 25%
Depreciation = 25% * $ 80,000 = $ 8,000
4. Capital Lease Equipment Depreciation (Eads)
Expected Life Depr. Cost Straight-line Depreciation
Equip 8 yrs $ 92,000 92,000 / 8 = $ 11,500 yr
5. Income Tax
Both companies pay 25% of their GAAP income as estimate for income tax.
Glenwood Eads
Income before
tax $123,656 $94,020
Estimated tax rate 25% 25%
Tax expense $ 30,914 $ 23,505
21
Case Study 2: Molson Coors Brewing Company
Profitability and Earnings Persistence
September 20, 2017
I. Executive Summary
In this scenario, Molson Coors Brewing Company was formed from the merger
between Adolph Coors Company and Molson Inc. in February 2005. The probable cause
of this horizontal market extension, meaning the two former companies were in the same
industry and sold the same products but with different markets (U.S. and Canada), was to
add value and please shareholders. The Molson Coors brands satisfy a variety of
consumer tastes and preferences in their largest markets of Canada, the United States, and
the United Kingdom. At year-end of 2013, Molson Coors released their financial
statements, comparing the past three years on the income statement and comprehensive
income statement and the past two years on the balance sheet, along with their
corresponding notes. The notes report their basis of presentation and summary of
significant accounting policies. Examples include revenue recognition, cost of goods
sold, special items, and income taxes. This scenario illustrates the determination of
expected future profitability and earnings persistence using data from a company’s
financial statements. A substantial portion of the case focuses on items that are unusual
and/or infrequent or nonrecurring, such as the “Special items, net,” and items listed under
comprehensive income.
From this case, I have learned and improved my knowledge of general concepts about
the income statement and the specific line items reported on the financial statements,
such as comprehensive income and special items. Some of the general concepts include
GAAP reasoning of classified income statements and usage of measurements of
23
persistent income. For the specific line items, the depth of my knowledge on
comprehensive income and a company’s special items has increased. Specifically, this
scenario has expressed the specific activities that are separated into unusual and/or
infrequent items into “Special items, net” and the comprehensive income. This scenario
has taught me the importance of classification on a company’s future profitability
expectancy and earnings persistence.
24
II. Concepts
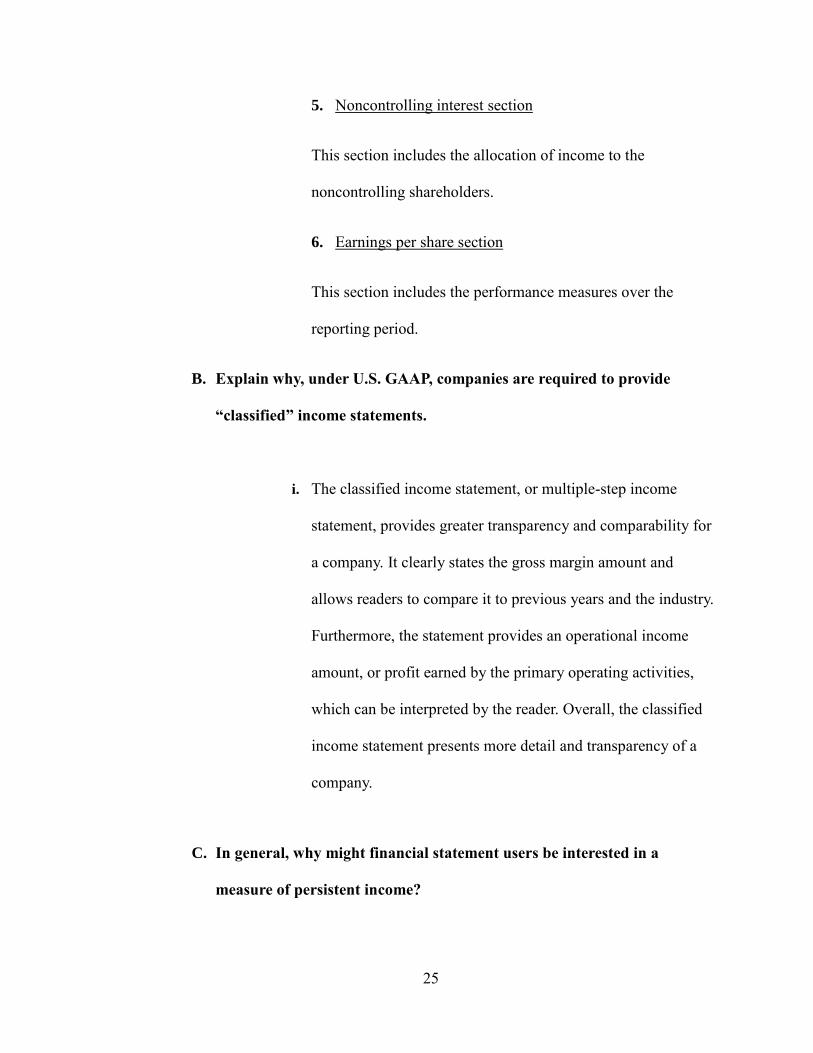
A. What are the major classifications on an income statement?
The income statement shows the revenues, expenses, and profits, along with the
various classifications for revenues and expenses. The main classifications
include:
1. Operating section
This section includes important amounts such as the gross
revenue and cost of goods sold to arrive at the gross margin. It
also includes important expenses resulting from operations
such as rent, supplies, and utilities.
2. Non-operating section
This section includes other revenues, gains, expenses, and
losses resulting from secondary activities of the company.
3. Income tax section
This section includes the total of federal and state taxes levied
on income.
4. Discontinued operations section
This section includes the material gains and losses resulting
from the disposition of a section of the business.
25
5. Noncontrolling interest section
This section includes the allocation of income to the
noncontrolling shareholders.
6. Earnings per share section
This section includes the performance measures over the
reporting period.
B. Explain why, under U.S. GAAP, companies are required to provide
“classified” income statements.
i. The classified income statement, or multiple-step income
statement, provides greater transparency and comparability for
a company. It clearly states the gross margin amount and
allows readers to compare it to previous years and the industry.
Furthermore, the statement provides an operational income
amount, or profit earned by the primary operating activities,
which can be interpreted by the reader. Overall, the classified
income statement presents more detail and transparency of a
company.
C. In general, why might financial statement users be interested in a
measure of persistent income?
26
i. By understanding that a persistent income exists on the
financial statement, users can be more certain in the
comparability of their financial analyses of a company over
previous years. In addition, the users are better able to predict
future incomes and expectations for a company.
D. Define comprehensive income and discuss how it differs from net income.
i. Comprehensive income is a combination of net income/net loss
and other comprehensive income, which includes amounts such
as unrealized gains/losses on investments and retirement plans
and foreign currency transaction adjustments among other
income amounts. Essentially this amount contains all of the
revenues, expenses, gains, and losses that changed
stockholders’ equity over a period of time. Comprehensive
income includes net income and provides a clearer view of the
financial reports.
27
III. Process
A. The income statement reports “Sales” and “Net sales.” What is the
difference? Why does Molson Coors report these two items
separately?
i. Generally, in most companies, sales are the total of all sales
transactions without deductions from the amount, while net
sales are sales minus sales returns and allowances and sales
discounts. However, in the case of Molson Coors, the sales
refer to the revenue from beer and other malt beverages
before the deduction of excise taxes. Excise taxes are
indirect taxes levied on a product that is included in the
price of the product. In this case, the government has
imposed an excise tax on Molson Coors’ beer shipments.
After deducting the total of the excise taxes, net sales
remain. By keeping these two amounts separate, users are
able to analyze the effects of the taxes on sales using a
trend analysis.
B. Consider the income statement item “Special items, net” and
information in Notes 1 and 8.
28
i. In general, what types of items does Molson Coors
include in this line item?
1. The special items line item includes charges
incurred or benefits realized that are not believed to
be indicative of the core operations. Examples
include: infrequent or unusual items, impairment or
asset abandonment-related losses, restructuring
charges and other atypical employee-related costs,
or fees on termination of significant operating
agreements and gains (losses) on disposal of
investments.
ii. Explain why the company reports these on a separate
line item rather than including them with another
expense item. Molson Coors classifies these special items
as operating expenses. Do you concur with this
classification? Explain.
1. They are allowed to report the special items as a
separate line item because of the FASB’s
Accounting Standard Update 2015-01 (Subtopic
225-20). This ASU allows unusual or infrequently
29
occurring items to be reported as a separate
component on the income statement. The Special
Items of Molson Coors includes these unusual or
infrequently occurring items, as well as, other items
caused from unusual events. I concur with their
classification as long as the items are not reported
year after year.
C. Consider the income statement item “Other income (expense), net”
and the information in Note 6. What is the distinction between “Other
income (expense), net” which is classified a non-operating expense,
and “Special items, net” which Molson Coors classifies as operating
expenses?
a. The “Other income (expense), net” line item refers solely to the
gains and losses resulting from activities not directly related to
their operations of brewing and selling beer. Examples include:
gains and losses on foreign exchange and sales of non-operating
assets. “Other income (expense), net” is classified as a non-
operating expense because it is not directly related to their
operations; however, the “Special items, net” is related to their
operations, but it is not indicative of their core operations because
they include unusual or infrequently occurring items.
30
D. Refer to the statement of comprehensive income.
i. What is the amount of comprehensive income in 2013?
How does this amount compare to net income in 2013?
1. The comprehensive income attributable to Molson
Coors is $760.2 million in 2013. The
comprehensive income is $187.7 million greater
than the income including non-controlling interests
in 2013; net income is $572.5 million in 2013.
ii. What accounts for the difference between net income
and comprehensive income in 2013? In your own words,
how are the items included in Molson Coors’
comprehensive income related?
1. As described in the aforementioned definitions,
comprehensive includes net income and changes to
owner equity like gains and losses on derivative
instruments and pensions, etc. In Molson Coors’
case, they have reported a foreign currency
translation adjustment loss of $207.7 million, an
unrealized gain on derivative instruments of $35.5
million, and other items normally included under
31
comprehensive income on their Consolidated
Statements of Comprehensive Income at year-end
of 2013. All of the items included in their
comprehensive income reflect the change in the
equity; they all affect stockholder’s equity.
E. Consider the information on income taxes, in Note 7.
a. What is Molson Coors’ effective tax rate in 2013?
i. Effective tax rate = Income Tax Expense / Pre-tax income
Pre-tax income = $654.5 million
Income Tax Expense = $84.0 million
Effective tax rate = $84.0 M / $654.5 M
Effective tax rate = 12.8%

32
Case Study 3: Pearson, PLC
Accounts Receivable
October 4, 2017
33
I. Executive Summary
In this scenario, Pearson plc, an international company based in London, England, has
business operations in education, business information, and consumer publishing. Being
an international company, Pearson operates in more than 60 countries with sales of £5.6
billion in 2009. They have released their 2009 financial statements and footnote excerpts
for 2009, comparing the past two years’ financial information (2008 and 2009). Along
with being an international company based in the U.K., Pearson prepares its financial
statements in accordance to the International Financial Reporting Standards, or IFRS.
Their footnote excerpts include information on revenue recognition, dividends, leases,
and some asset and liability information. Essentially, this case exemplifies the accounts
receivables, transactions, and contra accounts within a corporation, along with differences
in financial reporting with non-U.S. based companies, i.e. IFRS. In addition, the case
illustrates Pearson’s reporting of the reconciliation of contra accounts (provision for bad
and doubtful debts) and trade receivables.
This case study has given me insight into how a company reports estimated
allowances for doubtful accounts and sales returns and allowances, as well as the
difference in U.S. GAAP and IFRS reporting. The exercises provided more experience in
reporting through journal entries and seeing the effects through T-accounts. More
specifically, I learned more about the common approaches for estimating the allowances,
and that in the U.S. at least, the percentage-of-sales approach is inappropriate. This
scenario has expanded my understanding of the fundamentals of the allowance for

34
doubtful accounts and the sales returns and allowances/the allowance for sales returns
and allowances accounts.
35
II. Concepts
A. What is an account receivable? What other names does this asset go by?
i. The exact definition of an accounts receivable is an oral promise of
the purchaser to pay for goods and services sold. They are short-
term extensions of credit, essentially. Another name for accounts
receivable is a trade receivable or just receivable.
B. How do accounts receivable differ from notes receivable?
i. As in the aforementioned definition, accounts receivable are short-
term credit extensions arising from sales; whereas, notes
receivables are written promises to pay certain sums of money and
arise from sales, financing, or other transactions (can be short-term
or long-term).
C. What is a contra account? What two contra accounts are associated with
Pearson’s trade receivables (see Note 22)? What types of activities are
captured in each of these contra accounts? Describe factors that managers
might consider when deciding how to estimate the balance in each of these
contra accounts.
36
i. A contra account decreases its related asset, liability, or owners’
equity balance sheet account. The two specific contra accounts
associated with Pearson are provision for bad and doubtful debts
(Allowance for doubtful accounts) and provision for sales returns
(Allowance for sales returns and allowances). The main activities
captured in the provision for bad and doubtful debts are the
estimations of bad debt expense and the eventual write-offs for the
bad and doubtful debts. As for the provision for sales returns, the
main activities captured are estimations for sales returns and
allowances, and the actual sales returns. Managers at Pearson
review historic payment profiles and receivable balances in order
to review its bad debt provision. Some factors to consider when
estimating future bad debts include past estimations and their
accuracy, customer payment history, and possibly even
environmental conditions.
D. Two commonly used approaches for estimating uncollectible accounts
receivable are the percentage-of-sales procedure and the aging-of-accounts
procedure. Briefly describe these two approaches. What information do
managers need to determine the activity and final account balance under
each approach? Which of the two approaches do you think results in a more
accurate estimate of net accounts receivable?
37
i. The percentage-of-sales procedure bases the amount of bad debt
expense as a portion, or percentage, of sales, either total or credit
sales. Using previous years’ data, a company can reasonably estimate
what percentage of the sales will not be collected. In the U.S., this
method is not appropriate as it may not provide a representationally
faithful estimate of net realizable value. The second procedure, aging-
of-accounts, bases estimates on historical loss rates using past
experience to the various age categories. In other words, the longer
the balance remains unpaid, the higher the percentage estimated to be
uncollectible will be. Under the percentage-of-sales approach,
managers need to know the beginning uncollectible account balance,
the total amount of sales and percentage to be used, and the amount of
write-offs during the year. Under the aging-of-accounts approach,
managers need to know the beginning uncollectible account balance,
the ages of accounts receivables and percentages used by the
company (based on historical loss rates), and the write-offs during the
year. As the percentage-of-sales approach focuses on the income
statement and may provide a better “matching” of sales to bad debts,
it is less likely to be a faithful representation estimate of net realizable
value; therefore, in this case, the aging-of-accounts approach would
result in a more accurate estimate of net accounts receivable.
38
E. If Pearson anticipates that some accounts will be uncollectible, why did the
company extend credit to those customers in the first place? Discuss the risks
that managers must consider with respect to accounts receivable.
i. A company must always realize a factor of risk when extending
credit, even with reliable customers. Pearson does not know the
future, but they can reasonably estimate based on past experience. In
addition, the company will not likely know which customers will fail
to pay, unless past experience reports otherwise. In the case of a
repeated failure, Pearson may extend less credit or not at all.
Managers factor these considerations in when extending credit and
creating accounts receivables (past credit extensions, credit-ratings,
and market conditions). The risks associated with accounts receivable
branch off from bad debts. The inability to collect these accounts
receivable can affect income and even the overall standing of a
company.
39
III. Process
A. Note 22 reports the balance in Pearson’s provision for bad and
doubtful debts (for trade receivables) and reports the account activity
(“movements”) during the year ended December 31, 2009. Note that
Pearson refers to the trade receivables contra account as a
“provision.” Under U.S. GAAP, the receivables contra account is
typically referred to as an “allowance” while the term provision is
used to describe the current-period income statement charge for
uncollectible accounts (also known as bad debt expense).
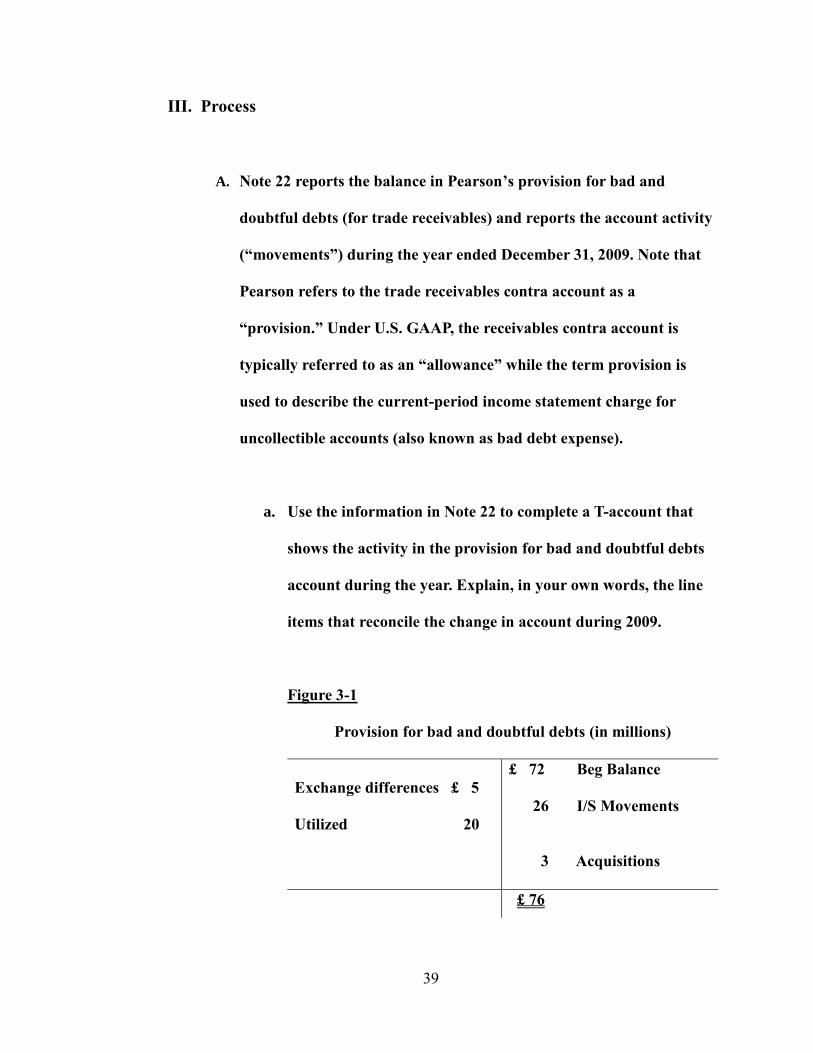
a. Use the information in Note 22 to complete a T-account that
shows the activity in the provision for bad and doubtful debts
account during the year. Explain, in your own words, the line
items that reconcile the change in account during 2009.
Figure 3-1
Provision for bad and doubtful debts (in millions)
Exchange differences £ 5
Utilized 20
£ 72 Beg Balance
26 I/S Movements
3 Acquisitions
£ 76
40
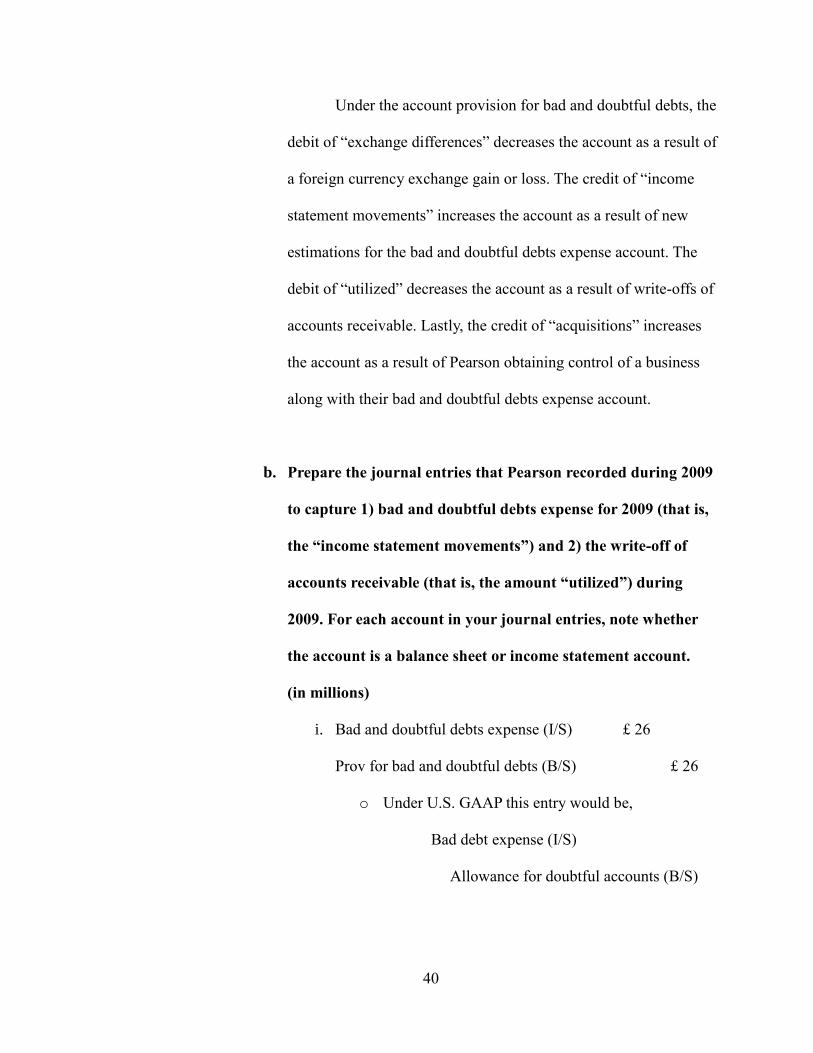
Under the account provision for bad and doubtful debts, the
debit of “exchange differences” decreases the account as a result of
a foreign currency exchange gain or loss. The credit of “income
statement movements” increases the account as a result of new
estimations for the bad and doubtful debts expense account. The
debit of “utilized” decreases the account as a result of write-offs of
accounts receivable. Lastly, the credit of “acquisitions” increases
the account as a result of Pearson obtaining control of a business
along with their bad and doubtful debts expense account.
b. Prepare the journal entries that Pearson recorded during 2009
to capture 1) bad and doubtful debts expense for 2009 (that is,
the “income statement movements”) and 2) the write-off of
accounts receivable (that is, the amount “utilized”) during
2009. For each account in your journal entries, note whether
the account is a balance sheet or income statement account.
(in millions)
i. Bad and doubtful debts expense (I/S) £ 26
Prov for bad and doubtful debts (B/S) £ 26
o Under U.S. GAAP this entry would be,
Bad debt expense (I/S)
Allowance for doubtful accounts (B/S)
41
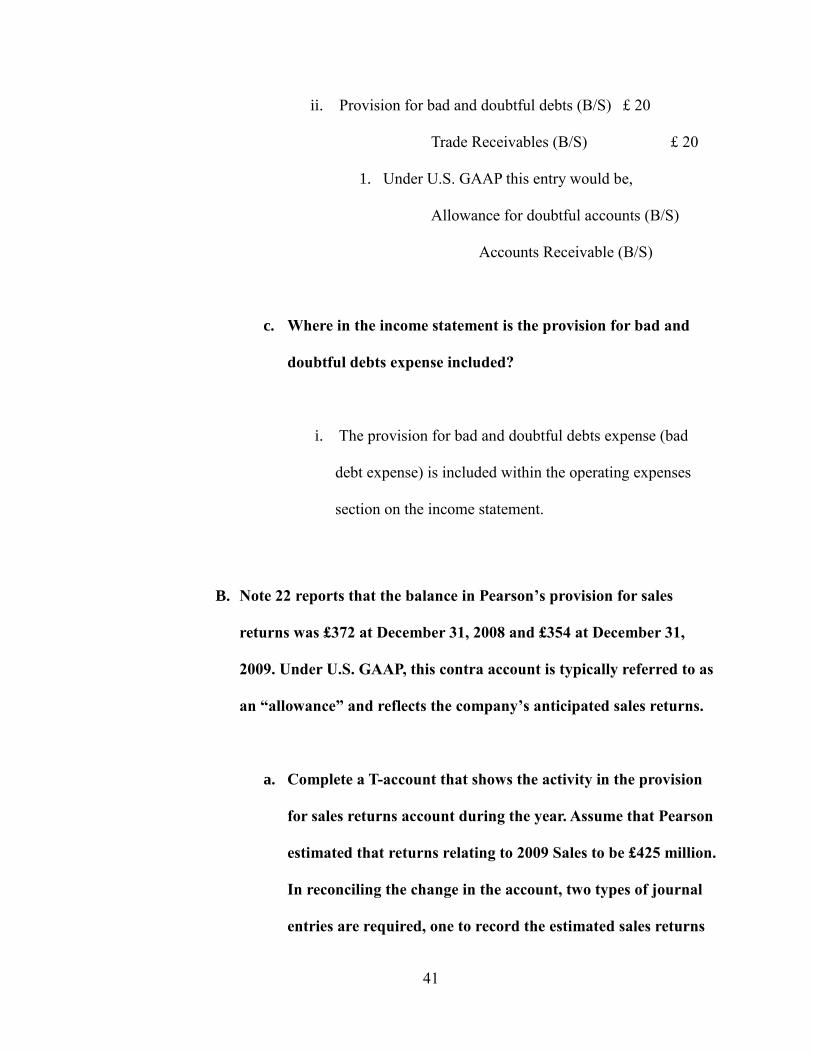
ii. Provision for bad and doubtful debts (B/S) £ 20
Trade Receivables (B/S) £ 20
1. Under U.S. GAAP this entry would be,
Allowance for doubtful accounts (B/S)
Accounts Receivable (B/S)
c. Where in the income statement is the provision for bad and
doubtful debts expense included?
i. The provision for bad and doubtful debts expense (bad
debt expense) is included within the operating expenses
section on the income statement.
B. Note 22 reports that the balance in Pearson’s provision for sales
returns was £372 at December 31, 2008 and £354 at December 31,
2009. Under U.S. GAAP, this contra account is typically referred to as
an “allowance” and reflects the company’s anticipated sales returns.
a. Complete a T-account that shows the activity in the provision
for sales returns account during the year. Assume that Pearson
estimated that returns relating to 2009 Sales to be £425 million.
In reconciling the change in the account, two types of journal
entries are required, one to record the estimated sales returns
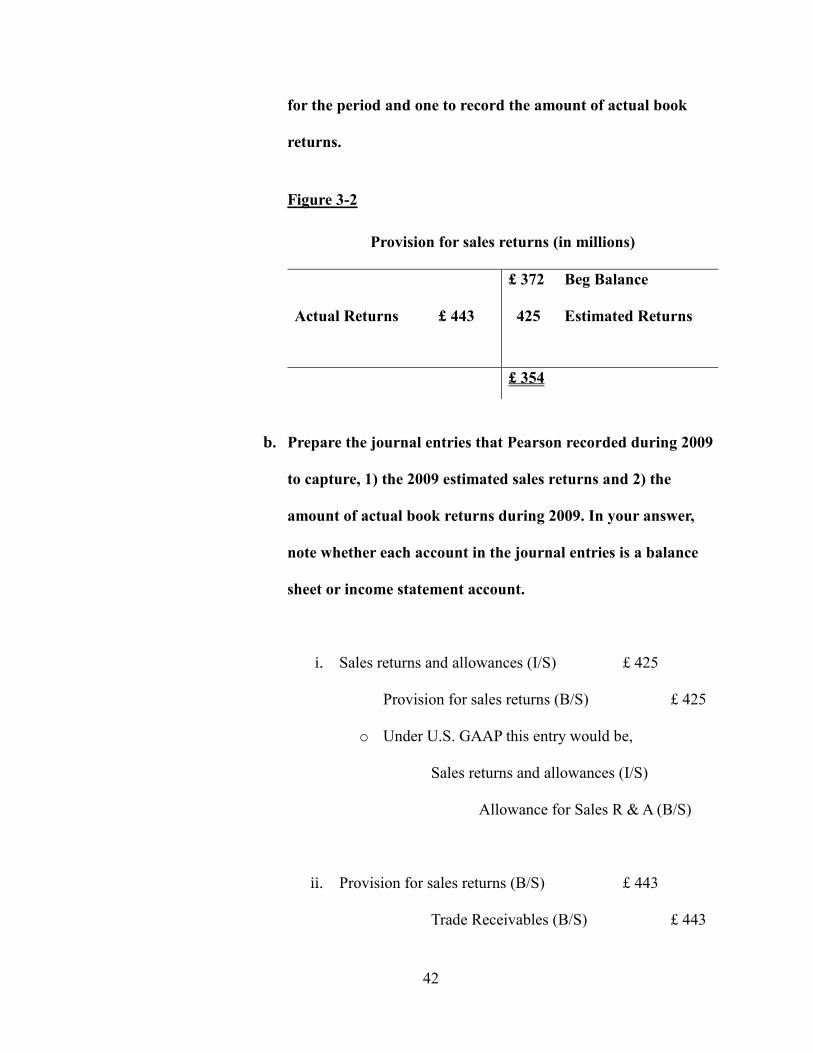
42
for the period and one to record the amount of actual book
returns.
Figure 3-2
Provision for sales returns (in millions)
Actual Returns £ 443
£ 372 Beg Balance
425 Estimated Returns
£ 354
b. Prepare the journal entries that Pearson recorded during 2009
to capture, 1) the 2009 estimated sales returns and 2) the
amount of actual book returns during 2009. In your answer,
note whether each account in the journal entries is a balance
sheet or income statement account.
i. Sales returns and allowances (I/S) £ 425
Provision for sales returns (B/S) £ 425
o Under U.S. GAAP this entry would be,
Sales returns and allowances (I/S)
Allowance for Sales R & A (B/S)
ii. Provision for sales returns (B/S) £ 443
Trade Receivables (B/S) £ 443
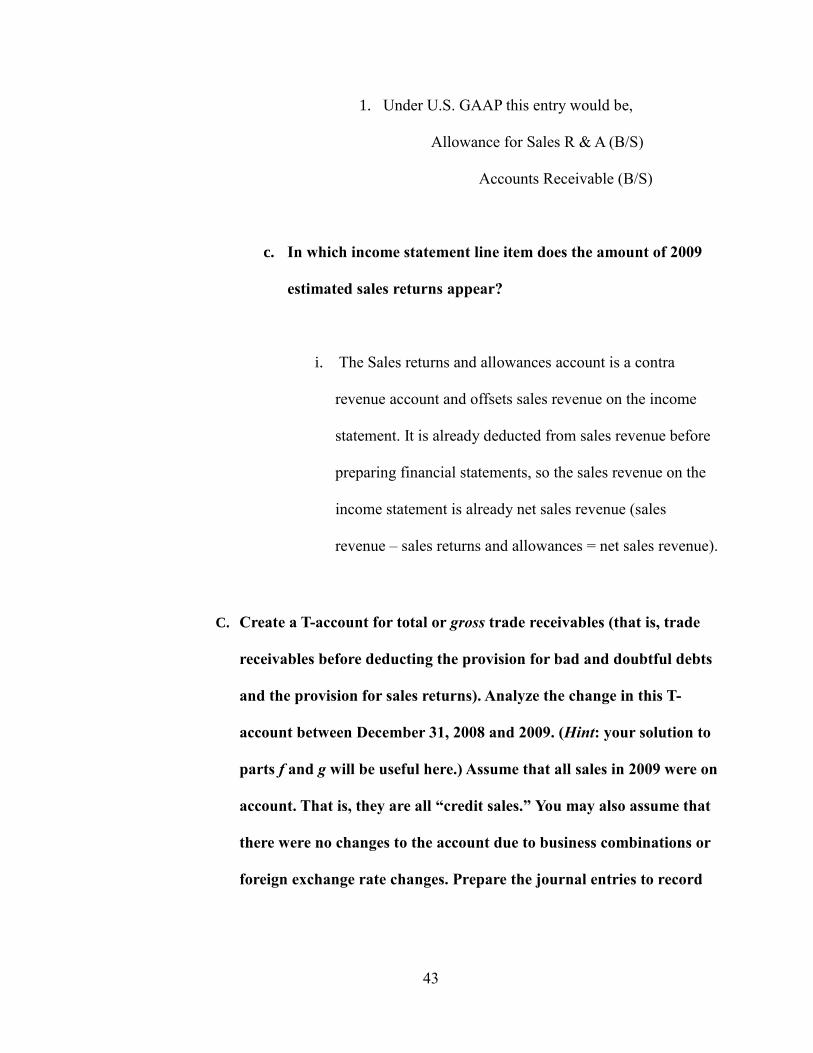
43
1. Under U.S. GAAP this entry would be,
Allowance for Sales R & A (B/S)
Accounts Receivable (B/S)
c. In which income statement line item does the amount of 2009
estimated sales returns appear?
i. The Sales returns and allowances account is a contra
revenue account and offsets sales revenue on the income
statement. It is already deducted from sales revenue before
preparing financial statements, so the sales revenue on the
income statement is already net sales revenue (sales
revenue – sales returns and allowances = net sales revenue).
C. Create a T-account for total or gross trade receivables (that is, trade
receivables before deducting the provision for bad and doubtful debts
and the provision for sales returns). Analyze the change in this T-
account between December 31, 2008 and 2009. (Hint: your solution to
parts f and g will be useful here.) Assume that all sales in 2009 were on
account. That is, they are all “credit sales.” You may also assume that
there were no changes to the account due to business combinations or
foreign exchange rate changes. Prepare the journal entries to record
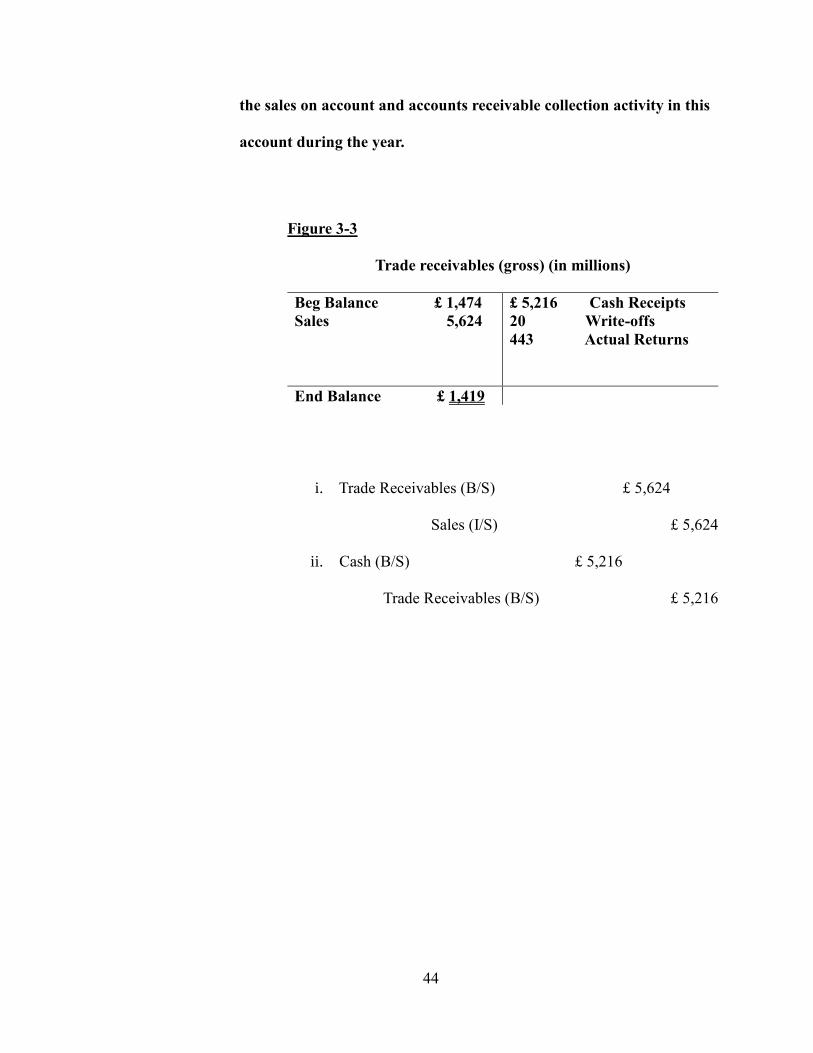
44
the sales on account and accounts receivable collection activity in this
account during the year.
Figure 3-3
Trade receivables (gross) (in millions)
Beg Balance £ 1,474
Sales 5,624
£ 5,216 Cash Receipts
20 Write-offs
443 Actual Returns
End Balance £ 1,419
i. Trade Receivables (B/S) £ 5,624
Sales (I/S) £ 5,624
ii. Cash (B/S) £ 5,216
Trade Receivables (B/S) £ 5,216
45
Case Study 4: Palfinger AG
Property, Plant, & Equipment
November 8, 2017
46
I. Executive Summary
In this scenario, Palfinger AG, an international company based in Bergheim, Austria,
conducts business with the construction, transport, agriculture and forestry, recycling, and
haulage industries. As a manufacturing company, Palfinger produces large-scale solutions
including hydraulic lifting, loading, and handling. As a non-U.S. company, it reports
financial statements in accordance with International Financial Reporting Standards
(IFRS). They have released their 2006 and 2007 financial statements as well as footnote
excerpts for 2007, comparing the past two years’ financial information (2006 and 2007).
Their footnote excerpts include information focused on property, plant and equipment as
well as all of the accumulated depreciation and impairments. This case delves into the
multitude of property, plant and equipment a manufacturing company might have and
how all of it is reported on the financial statements and corresponding notes. In addition,
the case guides the user in understanding how to interpret and calculate different
property, plant and equipment values with the given information.
This case study has given me insight into how a manufacturing company reports its
property, plant and equipment in the financial statements and notes, as well as the
difference in U.S. GAAP and IFRS reporting. The exercises provided me with greater
experience in calculating net book values using different depreciation methods and gains
and losses on disposals of assets. More specifically, I learned about the income statement
impacts of depreciation methods and how manufacturing companies report different
transactions affecting property, plant, and equipment in the notes. This scenario has

47
granted me with a greater understanding of items affecting property, plant and equipment
(depreciation, additions, disposals), as well as property, plant and equipment in general.
48
II. Concepts
A. Based on the description of Palfinger above, what sort of property and
equipment do you think the company has?
i. Obviously as a large manufacturing company, Palfinger AG has
buildings, warehouses, land, and different types of equipment for
manufacturing and for their offices. More specifically, their
equipment would include some types of assembly lines, lifts, and
production machinery. They may also have office equipment, but
in comparison with the production equipment, it wouldn’t be as
material. Most of these would be housed in factories and
warehouses.
B. The 2007 balance sheet shows property, plant, and equipment of €149,990.
What does this number represent?
i. The number represents the value of Palfinger’s property, plant, and
equipment. This includes the costs of land and buildings, plant and
machinery, other plant fixtures, fittings, and equipment,
prepayments and assets under construction, and undeveloped land.
C. What types of equipment does Palfinger report in notes to the financial
statements?
49
i. Palfinger reports machinery and other plant, fixtures, fittings, and
equipment in its notes. These might further be divided into
equipment that they own, equipment that they lease, and
equipment bought with government grants. The types are not
explicitly stated, but they might include delivery equipment, office
equipment, factory equipment, and similar fixed assets.
D. In the notes, Palfinger reports “Prepayments and assets under construction.”
What does this subaccount represent? Why does this account have no
accumulated depreciation? Explain the reclassification of €14,958 in this
account during 2007.
i. Under the International Financial Reporting Standards (IFRS),
Palfinger reports its own assets being constructed as “Prepayments
and assets under construction.” However, under the U.S. Generally
Accepted Accounting Principles (GAAP), this subaccount is called
“Self-constructed assets.” This subaccount represents the cost of the
aforementioned construction of a company’s own assets. The costs
would include the materials, direct labor, and possibly overhead
assigned to the construction process. There would not be any
accumulated depreciation yet because these assets are not yet
available for use, or in operations. The reclassification amount
represents the assets that were under construction but were finished
50
during the year. These reclassifications are then dispersed into the
other property, plant, and equipment accounts.
E. How does Palfinger depreciate its property and equipment? Does this policy
seem reasonable? Explain the trade-offs management makes in choosing a
depreciation policy.
i. Palfinger depreciates its property and equipment using the straight-
line depreciation method. Assuming that their asset’s economic
usefulness is the same each year and that the maintenance and repairs
expense is consistent year-to-year, the straight-line depreciation
method would be reasonable, especially for its simplicity. Palfinger
has estimated the economic useful life of the different types of their
assets, satisfying the first assumption. When management must
choose a depreciation policy, they must consider the effects of the
expenses on income. Essentially, the trade-off is time-based on when
a company should recognize those expenses.
F. Palfinger routinely opts to perform major renovations and value-enhancing
modifications to equipment and buildings rather than buy new assets. How does
Palfinger treat these expenditures? What is the alternative accounting
treatment?
51
i. Based on Palfinger’s notes to its financial statements, replacement
investments and value-enhancing investments are capitalized and
depreciated over either the new or the original useful life. The
alternative accounting treatment that could be used would be to
expense them as revenue expenditures (expenses) rather than capital
expenditures (assets). The important guideline is to use a consistent
application of either the capital or expense policy.
52
III. Process
• All figures below are in € thousands.
A. Use the information in the financial statement notes to analyze the
activity in the “Property, plant, and equipment” and “Accumulated
depreciation and impairment” accounts for 2007. Determine the
following amounts:
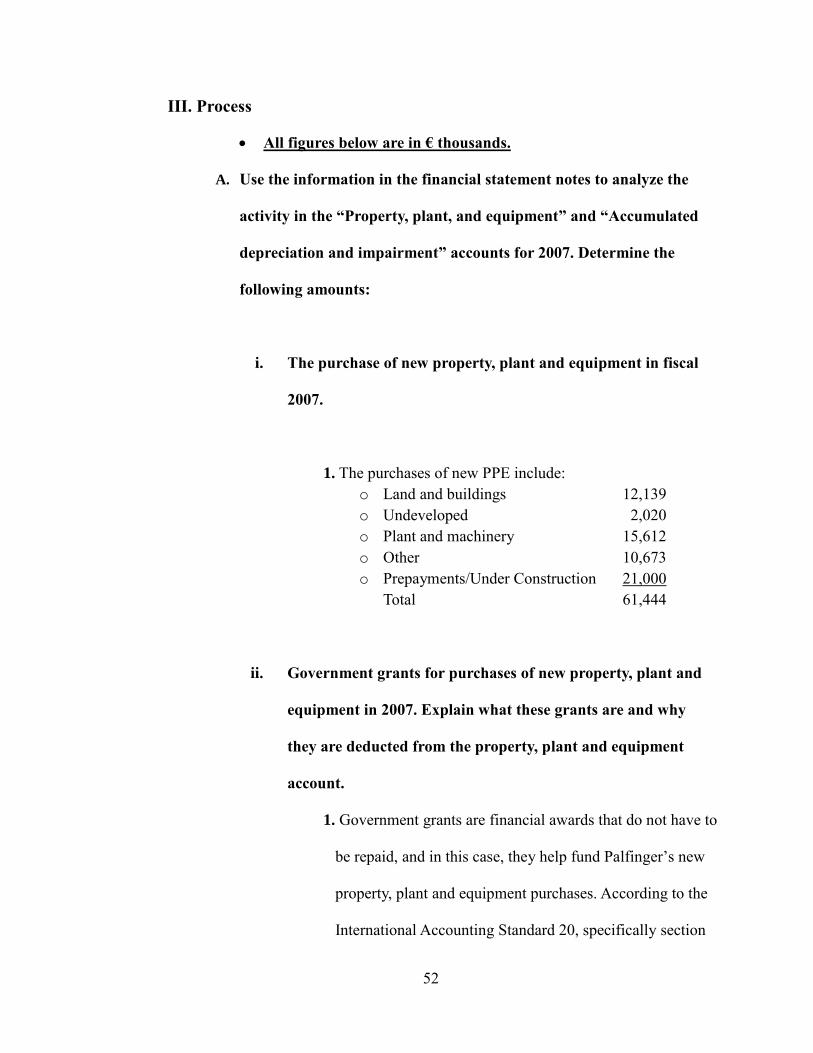
i. The purchase of new property, plant and equipment in fiscal
2007.
1. The purchases of new PPE include:
o Land and buildings 12,139
o Undeveloped 2,020
o Plant and machinery 15,612
o Other 10,673
o Prepayments/Under Construction 21,000
Total 61,444
ii. Government grants for purchases of new property, plant and
equipment in 2007. Explain what these grants are and why
they are deducted from the property, plant and equipment
account.
1. Government grants are financial awards that do not have to
be repaid, and in this case, they help fund Palfinger’s new
property, plant and equipment purchases. According to the
International Accounting Standard 20, specifically section
53
IAS 20.24, government grants can be accounted for in one
of two ways:
o As deferred income
o By deducting the grant from the asset’s carrying
amount
As stated in Palfinger’s notes, government grants are
presented as reductions of the acquisition and/or
manufacturing costs, representative of the second
aforementioned treatment.
iii. Depreciation expense for fiscal 2007.
1. The depreciation expense for 2007 consists of:
o Land and buildings 2,826
o Plant and machinery 6,869
o Other 2,862
Total 12,557
iv. The net book value of property, plant, and equipment that
Palfinger disposed of in fiscal 2007.
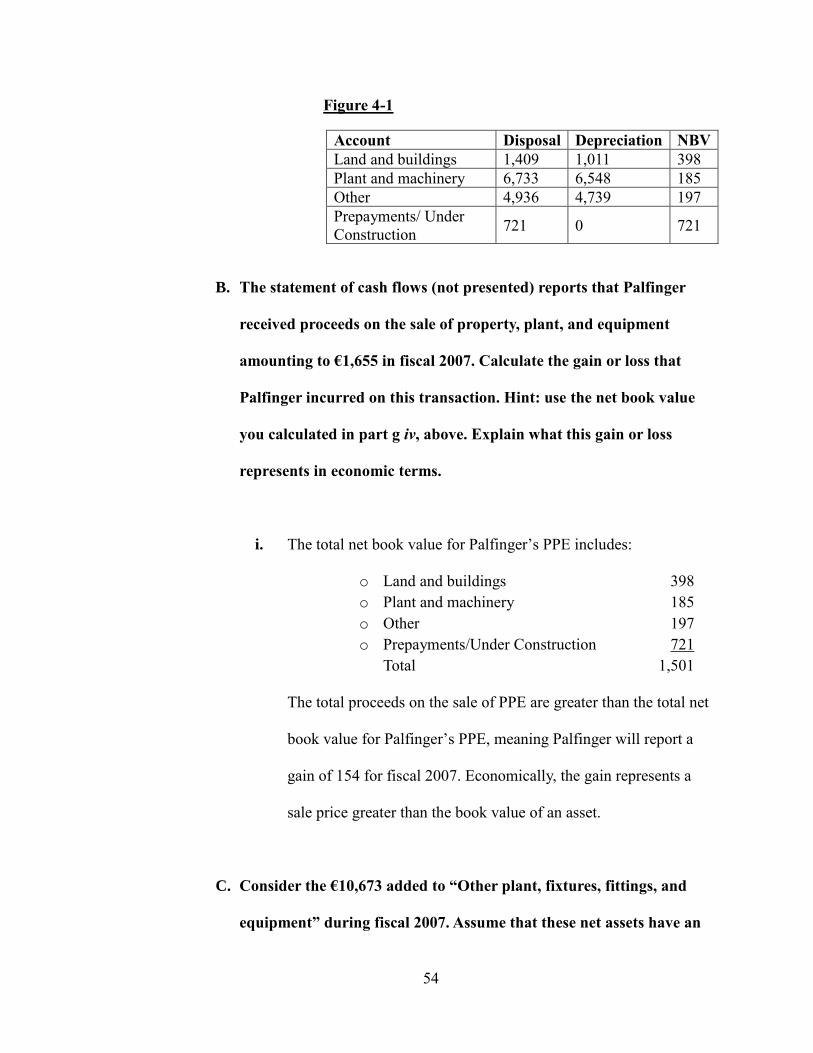
1. The net book value of PPE disposals for 2007 consists of:
54
Figure 4-1
Account Disposal Depreciation NBV
Land and buildings 1,409 1,011 398
Plant and machinery 6,733 6,548 185
Other 4,936 4,739 197
Prepayments/ Under
Construction 721 0 721
B. The statement of cash flows (not presented) reports that Palfinger
received proceeds on the sale of property, plant, and equipment
amounting to €1,655 in fiscal 2007. Calculate the gain or loss that
Palfinger incurred on this transaction. Hint: use the net book value
you calculated in part g iv, above. Explain what this gain or loss
represents in economic terms.
i. The total net book value for Palfinger’s PPE includes:
o Land and buildings 398
o Plant and machinery 185
o Other 197
o Prepayments/Under Construction 721
Total 1,501
The total proceeds on the sale of PPE are greater than the total net
book value for Palfinger’s PPE, meaning Palfinger will report a
gain of 154 for fiscal 2007. Economically, the gain represents a
sale price greater than the book value of an asset.
C. Consider the €10,673 added to “Other plant, fixtures, fittings, and
equipment” during fiscal 2007. Assume that these net assets have an
55
expected useful life of five years and a salvage value of €1,273.
Prepare a table showing the depreciation expense and net book value
of this equipment over its expected life assuming that Palfinger
recorded a full year of depreciation in 2007 and the company uses:
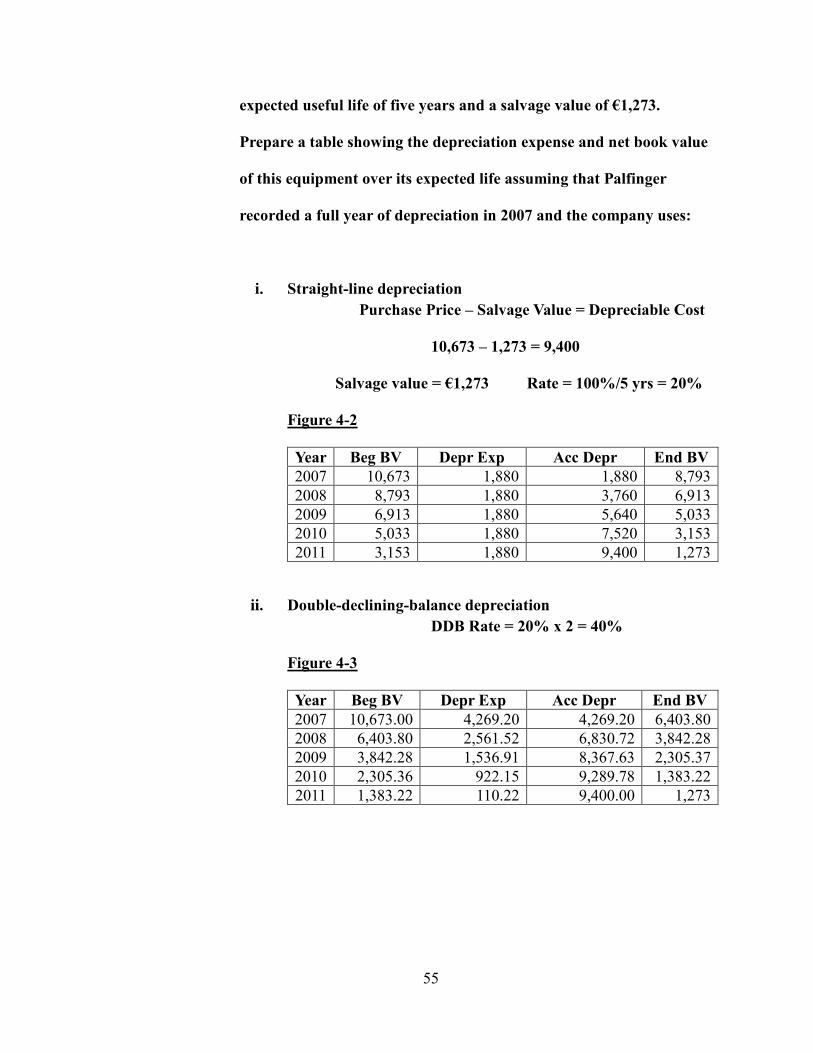
i. Straight-line depreciation
Purchase Price – Salvage Value = Depreciable Cost
10,673 – 1,273 = 9,400
Salvage value = €1,273 Rate = 100%/5 yrs = 20%
Figure 4-2
Year Beg BV Depr Exp Acc Depr End BV
2007 10,673 1,880 1,880 8,793
2008 8,793 1,880 3,760 6,913
2009 6,913 1,880 5,640 5,033
2010 5,033 1,880 7,520 3,153
2011 3,153 1,880 9,400 1,273
ii. Double-declining-balance depreciation
DDB Rate = 20% x 2 = 40%
Figure 4-3
Year Beg BV Depr Exp Acc Depr End BV
2007 10,673.00 4,269.20 4,269.20 6,403.80
2008 6,403.80 2,561.52 6,830.72 3,842.28
2009 3,842.28 1,536.91 8,367.63 2,305.37
2010 2,305.36 922.15 9,289.78 1,383.22
2011 1,383.22 110.22 9,400.00 1,273
56
D. Assume that the equipment from part i. was sold on the first day of
fiscal 2008 for proceeds of €7,500. Assume that Palfinger’s accounting
policy is to take no depreciation in the year of sale.
i. Calculate any gain or loss on this transaction assuming that the
company used straight-line depreciation. What is the total
income statement impact of the equipment for the two years
that Palfinger owned it? Consider the gain or loss on disposal
as well as the total depreciation recorded on the equipment (i.e.
the amount from part i. i.).
1. With a net book value at the end of 2007 of €8,793 and a
sale price of €7,500, Palfinger would recognize a loss of
€1,293* in 2008. The loss along with the depreciation
expense in 2007 of €1,880 would amount to € (3,173) **.
This amount reflects the total income statement impact over
the two year period using straight-line depreciation.
* 7,500 – 8,793 = € (1,293)
** (1,293) + (1,880) = € (3,173)
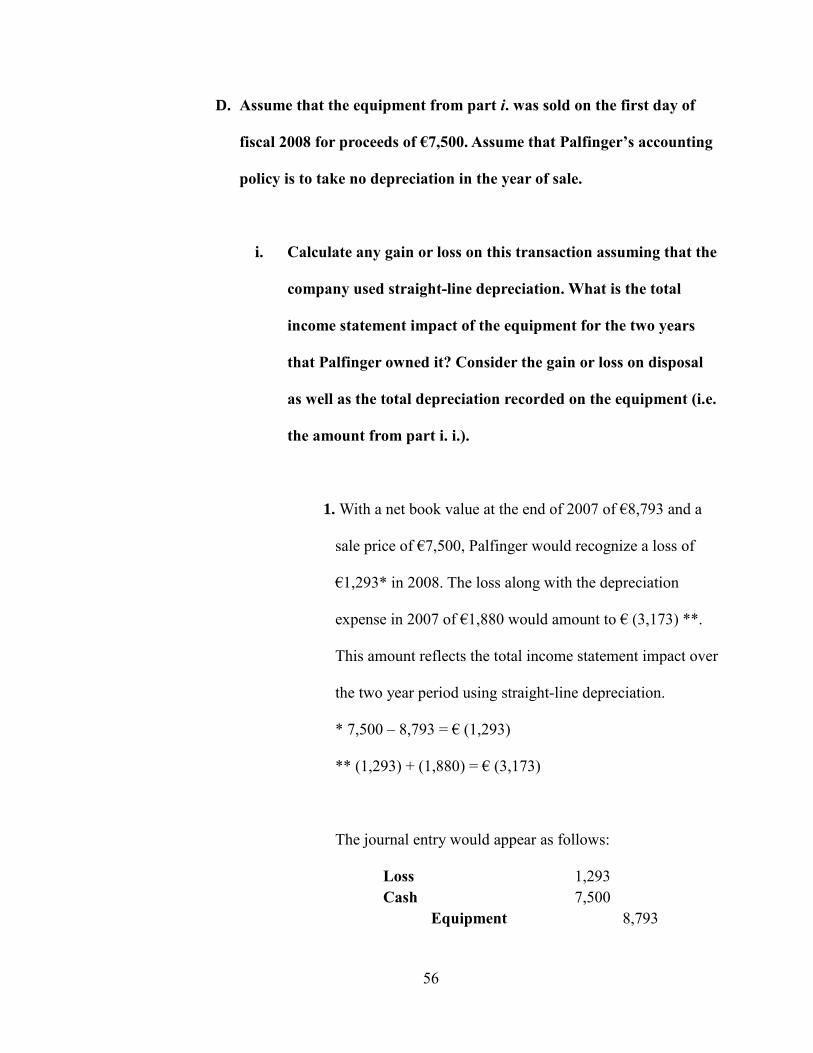
The journal entry would appear as follows:
Loss 1,293
Cash 7,500
Equipment 8,793
57
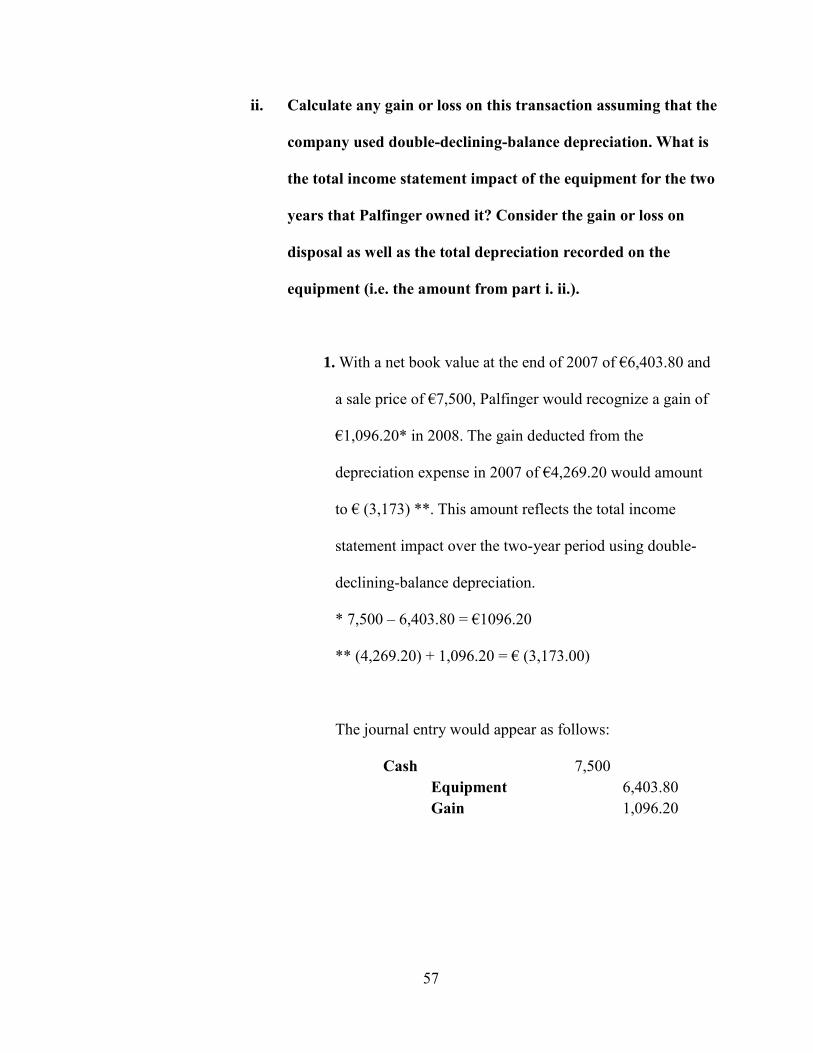
ii. Calculate any gain or loss on this transaction assuming that the
company used double-declining-balance depreciation. What is
the total income statement impact of the equipment for the two
years that Palfinger owned it? Consider the gain or loss on
disposal as well as the total depreciation recorded on the
equipment (i.e. the amount from part i. ii.).
1. With a net book value at the end of 2007 of €6,403.80 and
a sale price of €7,500, Palfinger would recognize a gain of
€1,096.20* in 2008. The gain deducted from the
depreciation expense in 2007 of €4,269.20 would amount
to € (3,173) **. This amount reflects the total income
statement impact over the two-year period using double-
declining-balance depreciation.
* 7,500 – 6,403.80 = €1096.20
** (4,269.20) + 1,096.20 = € (3,173.00)
The journal entry would appear as follows:
Cash 7,500
Equipment 6,403.80
Gain 1,096.20
58
iii. Compare the total two-year income statement impact of the
equipment under the two depreciation policies. Comment on
the difference.
1. Both of the two-year income statement impacts were the
same at the end of the second year. The difference lies in
when the depreciation expense and gain/loss affect the
income statement: first year or second year; as well as,
recognizing a gain or a loss when disposing of the assets.
This concept is important to consider when managers are
deciding on which depreciation method to use.
59
Case Study 5: Volvo Group
Research & Development Costs
November 15, 2017
60
I. Executive Summary
In this scenario, Volvo Group, an international company based in Torslanda, Sweden,
supplies commercial vehicles throughout roughly 180 countries. The company produces
trucks, buses, construction equipment, engines, and drive systems in addition to aircraft
engine components. Along with this production, Volvo Group invests heavily in research
and development activities in order to achieve technological breakthroughs in
environmental safety areas. These expenditures are focused on meeting future emission
and other regulations globally. As a non-U.S. company, it reports financial statements in
accordance with International Financial Reporting Standards (IFRS). This case has
provided their 2009 financial statements, footnote excerpts detailing depreciation and
amortization for intangible assets, an excerpt from IAS 38, as well as, an eleven-year
summary in accordance with Swedish GAAP and IFRS. The scenario expresses the way a
manufacturing company reports and treats research and development (R&D) costs on
financial statements. In addition, the case details how R&D costs are calculated and
amortized over periods.
This case study has given me insight into how a manufacturing company reports its
research and development costs in the financial statements and notes, as well as the
difference in U.S. GAAP and IFRS reporting. The exercises provided me with greater
experience in calculating net product and software development costs and proportions of
R&D costs incurred capitalized and in relation to net sales. More specifically, I learned
about how to interpret different areas of R&D on financial statements and how different
companies relate in R&D spending. This scenario has expanded my knowledge of how to

61
treat R&D costs (amortizing and reporting) and how different standards (U.S. GAAP and
IFRS) affect financial statements.
62
II. Concepts
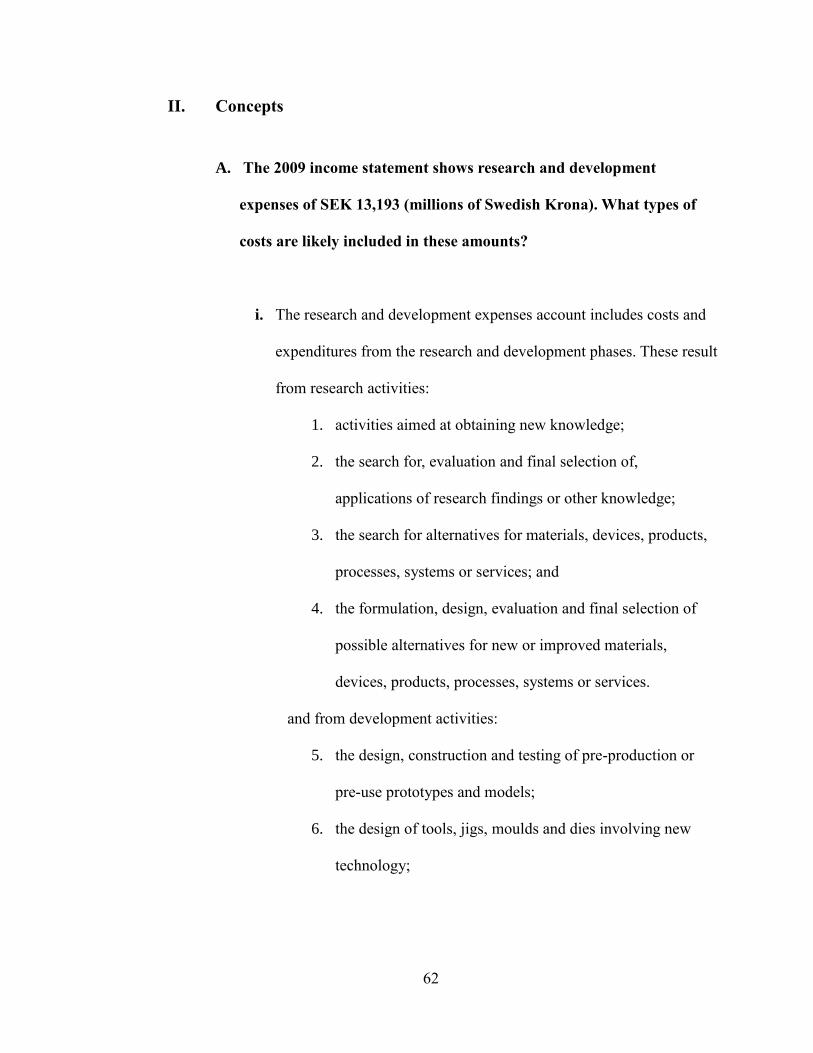
A. The 2009 income statement shows research and development
expenses of SEK 13,193 (millions of Swedish Krona). What types of
costs are likely included in these amounts?
i. The research and development expenses account includes costs and
expenditures from the research and development phases. These result
from research activities:
1. activities aimed at obtaining new knowledge;
2. the search for, evaluation and final selection of,
applications of research findings or other knowledge;
3. the search for alternatives for materials, devices, products,
processes, systems or services; and
4. the formulation, design, evaluation and final selection of
possible alternatives for new or improved materials,
devices, products, processes, systems or services.
and from development activities:
5. the design, construction and testing of pre-production or
pre-use prototypes and models;
6. the design of tools, jigs, moulds and dies involving new
technology;
63
7. the design, construction and operation of a pilot plant that
is not of a scale economically feasible for commercial
production; and
8. the design, construction and testing of a chosen alternative
for new or improved materials, devices, products,
processes, systems or services
B. Volvo Group follows IAS 38 – Intangible Assets, to account for its
research and development expenditures (see IAS 38 excerpts at the
end of this case). As such, the company capitalizes certain R&D costs
and expenses others. What factors does Volvo Group consider as it
decides which R&D costs to capitalize and which to expense?
i. When considering research and development costs, Volvo Group
must specify the generation of an asset in a research phase and a
development phase. Any expenditures on research or on the
research phase should be recognized as an expense when incurred;
on the other hand, any expenditures on development or on the
development phase can either be expensed or capitalized. The
determining factor in the development phase is whether or not the
intangible asset will generate probable future economic benefits.
64
C. The R&D costs that Volvo Group capitalizes each period (labeled
Product and software development costs) are amortized in subsequent
periods, similar to other capital assets such as property and
equipment. Notes to Volvo’s financial statements disclose that
capitalized product and software development costs are amortized
over three to eight years. What factors would the company consider in
determining the amortization period for particular costs?
i. In the case of depreciation/amortization of assets, Volvo uses the
straight-line depreciation method to assign costs to different long-
term assets. The company estimates the useful lives, or
depreciation/amortization periods, by considering expected future
benefits received from the assets and by considering other industry
standards for periods of intangibles.
D. Under U.S. GAAP, companies must expense all R&D costs. In your
opinion, which accounting principle (IFRS or U.S. GAAP) provides
financial statements that better reflect costs and benefits of periodic
R&D spending?
i. In my opinion, International Financial Reporting Standards provide a
better reflection of the costs and benefits on the R&D spending.
Without having to expense all of the costs, this accounting principle
gives a more representational view of the benefits from the R&D

65
spending. Since US GAAP does not take into account the benefits
from R&D, it provides a very conservative view for this spending.
66
III. Process
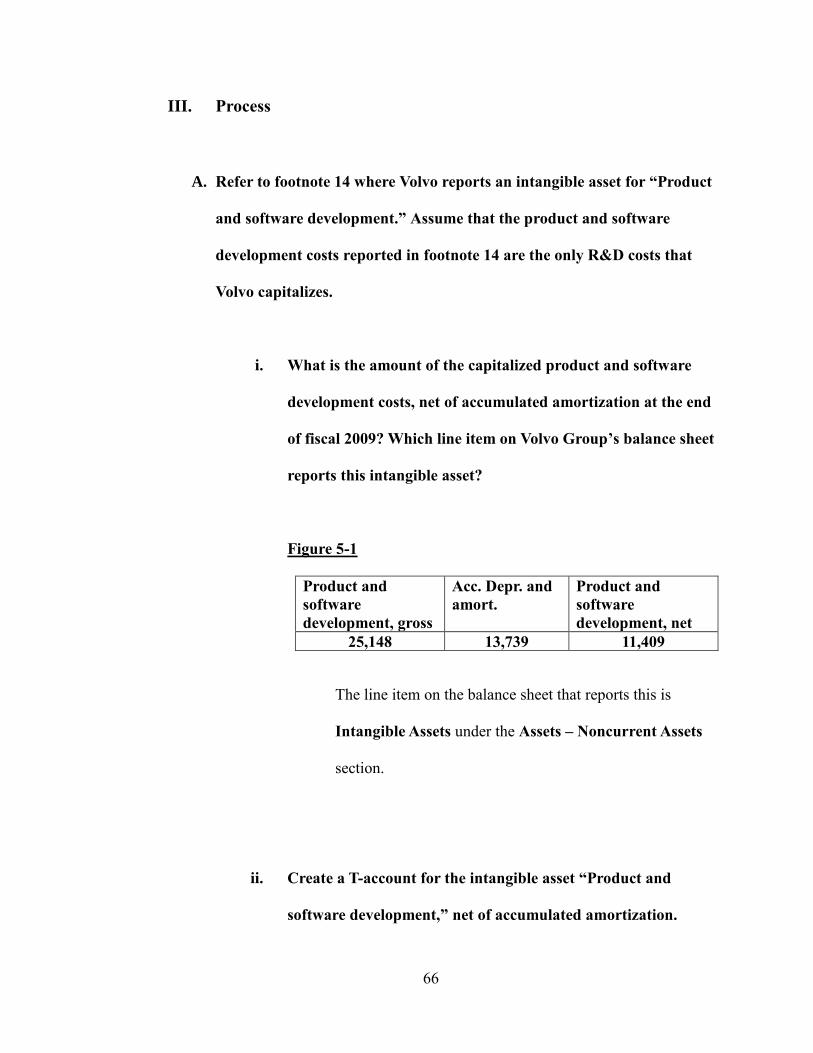
A. Refer to footnote 14 where Volvo reports an intangible asset for “Product
and software development.” Assume that the product and software
development costs reported in footnote 14 are the only R&D costs that
Volvo capitalizes.
i. What is the amount of the capitalized product and software
development costs, net of accumulated amortization at the end
of fiscal 2009? Which line item on Volvo Group’s balance sheet
reports this intangible asset?
Figure 5-1
Product and
software
development, gross
Acc. Depr. and
amort.
Product and
software
development, net
25,148 13,739 11,409
The line item on the balance sheet that reports this is
Intangible Assets under the Assets – Noncurrent Assets
section.
ii. Create a T-account for the intangible asset “Product and
software development,” net of accumulated amortization.
67
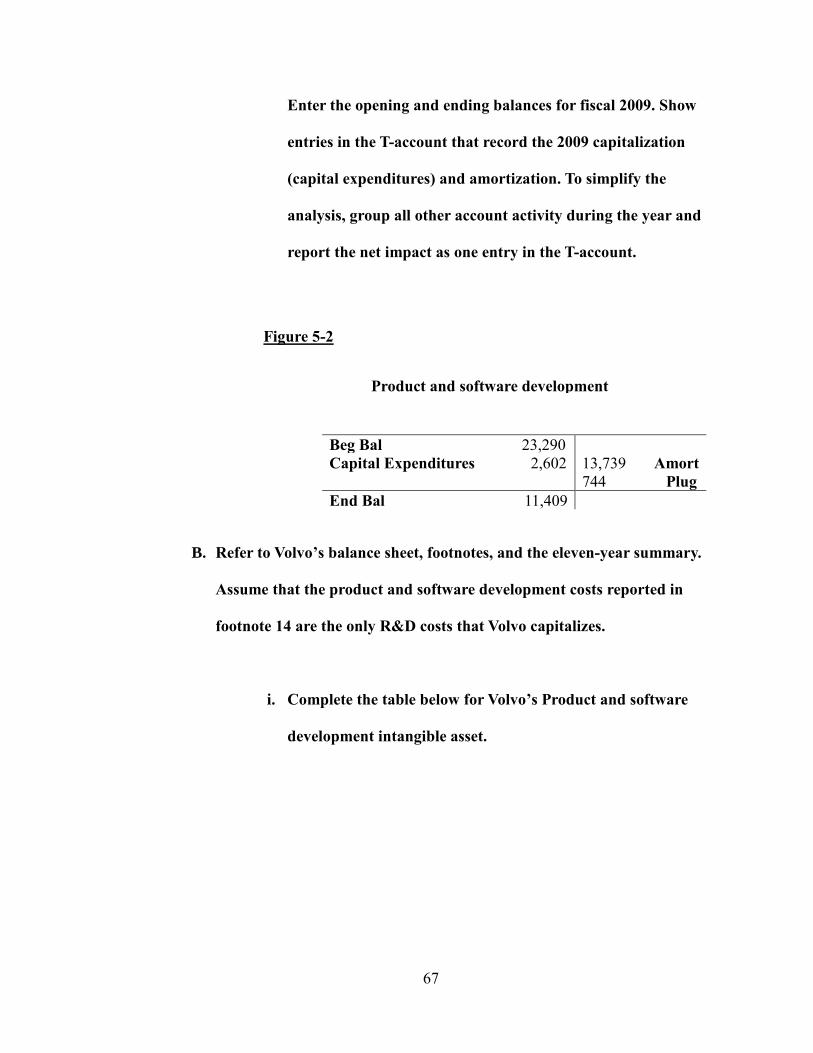
Enter the opening and ending balances for fiscal 2009. Show
entries in the T-account that record the 2009 capitalization
(capital expenditures) and amortization. To simplify the
analysis, group all other account activity during the year and
report the net impact as one entry in the T-account.
Figure 5-2
Beg Bal 23,290
Capital Expenditures 2,602 13,739 Amort
744 Plug
End Bal 11,409
B. Refer to Volvo’s balance sheet, footnotes, and the eleven-year summary.
Assume that the product and software development costs reported in
footnote 14 are the only R&D costs that Volvo capitalizes.
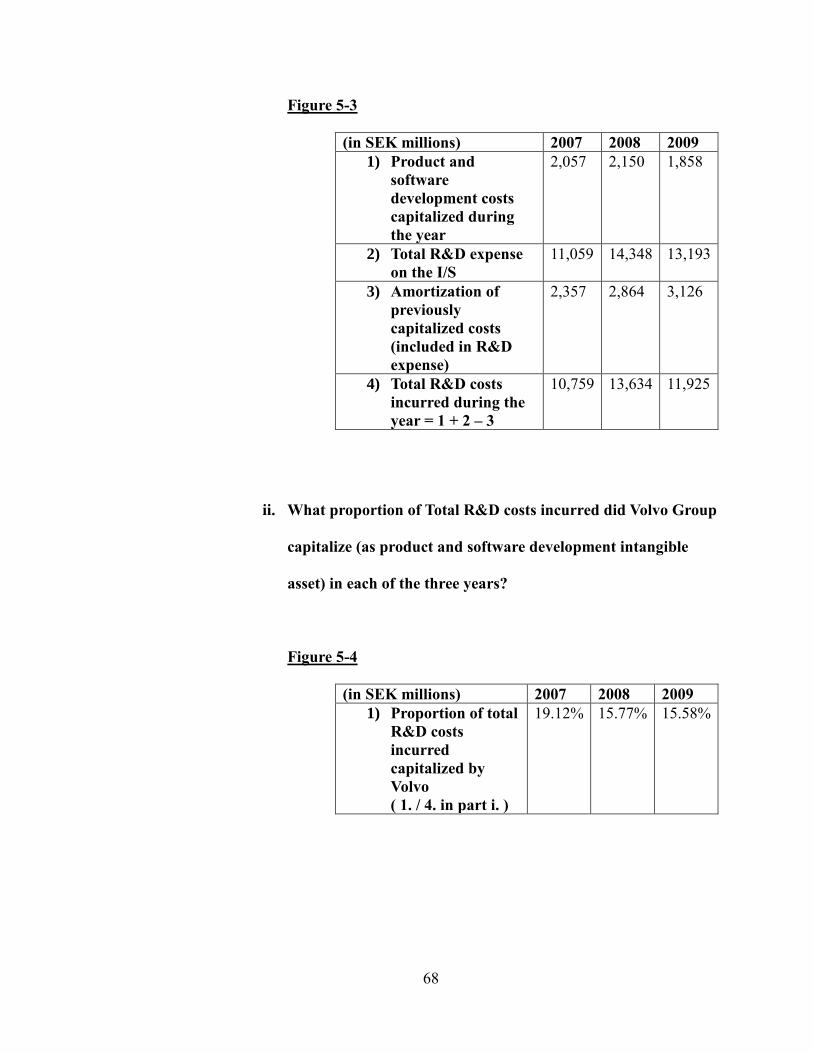
i. Complete the table below for Volvo’s Product and software
development intangible asset.
Product and software development
68
Figure 5-3
(in SEK millions) 2007 2008 2009
1) Product and
software
development costs
capitalized during
the year
2,057 2,150 1,858
2) Total R&D expense
on the I/S
11,059 14,348 13,193
3) Amortization of
previously
capitalized costs
(included in R&D
expense)
2,357 2,864 3,126
4) Total R&D costs
incurred during the
year = 1 + 2 – 3
10,759 13,634 11,925
ii. What proportion of Total R&D costs incurred did Volvo Group
capitalize (as product and software development intangible
asset) in each of the three years?
Figure 5-4
(in SEK millions) 2007 2008 2009
1) Proportion of total
R&D costs
incurred
capitalized by
Volvo
( 1. / 4. in part i. )
19.12% 15.77% 15.58%
69
IV. Analysis
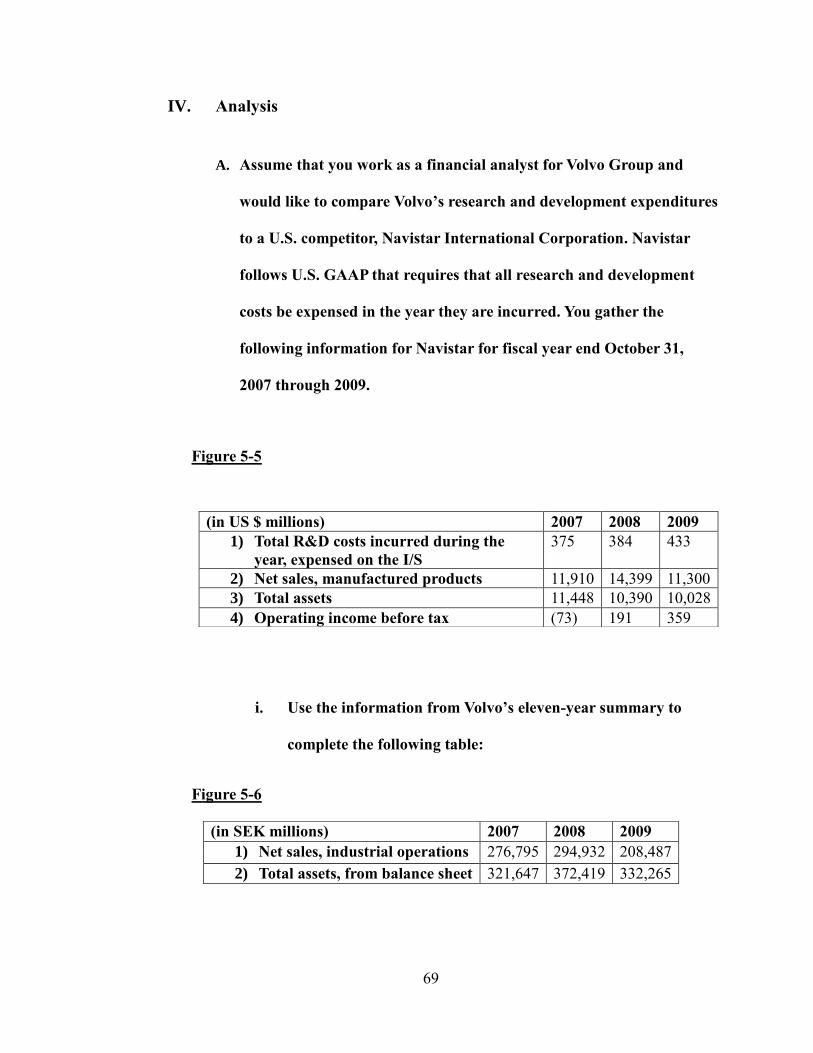
A. Assume that you work as a financial analyst for Volvo Group and
would like to compare Volvo’s research and development expenditures
to a U.S. competitor, Navistar International Corporation. Navistar
follows U.S. GAAP that requires that all research and development
costs be expensed in the year they are incurred. You gather the
following information for Navistar for fiscal year end October 31,
2007 through 2009.
Figure 5-5
i. Use the information from Volvo’s eleven-year summary to
complete the following table:
Figure 5-6
(in US $ millions) 2007 2008 2009
1) Total R&D costs incurred during the
year, expensed on the I/S
375 384 433
2) Net sales, manufactured products 11,910 14,399 11,300
3) Total assets 11,448 10,390 10,028
4) Operating income before tax (73) 191 359
(in SEK millions) 2007 2008 2009
1) Net sales, industrial operations 276,795 294,932 208,487
2) Total assets, from balance sheet 321,647 372,419 332,265
70
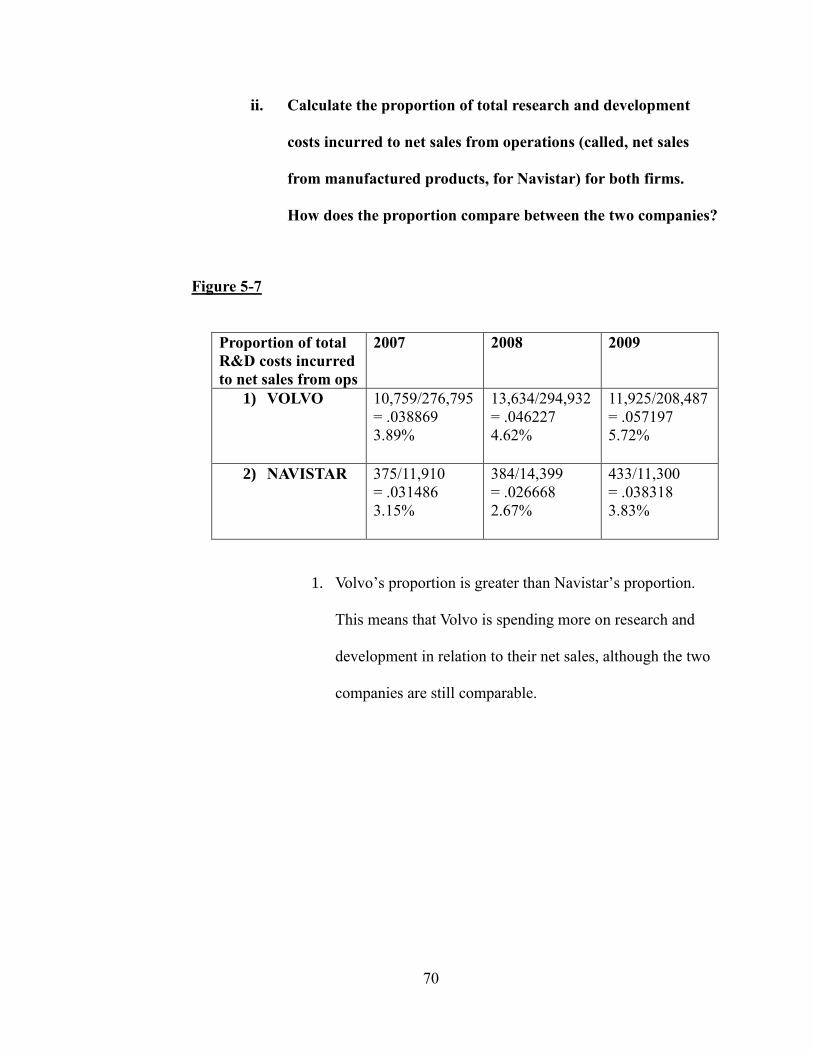
ii. Calculate the proportion of total research and development
costs incurred to net sales from operations (called, net sales
from manufactured products, for Navistar) for both firms.
How does the proportion compare between the two companies?
Figure 5-7
Proportion of total
R&D costs incurred
to net sales from ops
2007 2008 2009
1) VOLVO 10,759/276,795
= .038869
3.89%
13,634/294,932
= .046227
4.62%
11,925/208,487
= .057197
5.72%
2) NAVISTAR 375/11,910
= .031486
3.15%
384/14,399
= .026668
2.67%
433/11,300
= .038318
3.83%
1. Volvo’s proportion is greater than Navistar’s proportion.
This means that Volvo is spending more on research and
development in relation to their net sales, although the two
companies are still comparable.
71
Case Study 6: Google Fusion Tables
Data Analytics
January 31, 2018
72
I. Executive Summary
In this case study, each of us were given a new software tool to conduct research on
and learn about how it functions and can be used in different areas. The tool or service I
was assigned was the Google Fusion Tables, or simply Fusion Tables. This application
was first launched in 2009 and became a feature of Google Docs in 2011. The main
purpose of this tool is the ability to host, share, manage, and publish data online. More
specifically, this application allows users to combine separate stores of data in one
meaningful representation. With this representation, users can easily manipulate and view
the data for their desired purpose to make better decisions. Essentially, the Fusion Tables
work hand-in-hand with the Google Maps software to generate maps of the users’ inputs.
These maps can be further detailed by including other data from spreadsheets, like
financials or survey information to name a few. In order to take advantage of all of the
possible features of the Fusion Tables, users must have an adept knowledge of
spreadsheet formatting, data manipulation, and practice with the Fusion Tables. The
software service has an abundance of features with data manipulation and
representations, but only practice and learning will allow users to take advantage of them.
Google Fusion Tables can be implemented in many different areas including auditing, tax
planning, financial statement analysis, valuation, and advisory. This service is a very
beneficial tool for those people with large amounts of data that have a desire or need to
graphically view it. The case has granted me with newfound knowledge on one of today’s
popular software services. Now I might even dabble with Fusion Tables in the near future
to see what more I can uncover about this exciting application.
73
II. Concepts
A. Identify the history and purpose of this tool and describe, in general, how it
is used to make business decisions. Be specific about what kind of technology
platform it uses, etc. and other resources that need to be in place to fully
utilize the functionality of the tool?
i. The Google Fusion Tables web service was first launched in June
2009. Scientific papers were written in 2010 to further describe the
service, and finally, in 2011, Fusion Tables became a default
feature of Google Docs termed “Tables (beta)”.1 The application
enables hosting, sharing, management, and publishing of data
online. Essentially, this tool allows for the visualization of data
stored in separate tables to be merged into one meaningful,
graphical data representation. Furthermore, this tool allows
organizations to make better business decisions by allowing for
easier visualization of data and greater collaboration with internal
and external users of a workplace for instance. Executives can
more easily view and interpret these graphical representations
rather than separate spreadsheets or more complex tables in order
to decide how to move forward.2
1 https://en.wikipedia.org/wiki/Google_Fusion_Tables 2 https://www.techopedia.com/definition/26624/google-fusion-tables
74
1. Google Fusion Tables uses a cloud Software as a Service
(SaaS) as a platform. This means that a third-party provider
(Google) is able to hose applications and make them
available to customers over the Internet.3 Obviously, this
means resources such as computers with Internet access,
and on the provider’s side, cloud storage capabilities must
be available.
B. What special skills are needed to use this tool to aid in business decision
making. How might a student like yourself gain those skills?
i. In order to make the most of this tool, the user must first know
how to operate the application of which they want to merge using
the Google Fusion Tables. For instance, if a user wanted to fuse
spreadsheets in the table, a proficient understanding of Microsoft
Excel or another spreadsheet program would be a must. Other
tabular data files that could be uploaded include CSV and KML,
which are file types that store tabular database or spreadsheets and
geographic data respectively. Users must know how to create these
3 http://searchcloudcomputing.techtarget.com/definition/Software-as-a-Service
75
files and how to format data in the respective programs in order for
the Google Fusion Tables to correctly visualize what is preferred.
After uploading the correct files and allowing the web service to
generate a representation, business decisions would be relatively
simple to make based on it.
C. How, specifically, would you use the tool in the following business settings?
Create at least three specific scenarios for each category in which the tool
would lead to more efficiency and/or better effectiveness. Be sure to describe
what kinds of data your tool would use for each scenario.
Generate a paragraph for each scenario.
i. Auditing – ensuring existence or materiality of assets/liabilities
1. One scenario in which Google Fusion Tables could be used
in the area of auditing exists for large manufacturing
companies. For instance, the company will have stores of
inventory in different locations around the country or
globe. If an auditor used the company’s financial
information and location data together in the Fusion tables,
they would be able to more effectively visualize the
separate operations and asset materiality within each sector.
2. A second scenario in which the Fusion Tables could be
used exists with any company in general. An auditor could
76
use a company’s customer/supplier/creditor data in order to
generate a linking, or relationship, visualization that could
assist with understanding a company’s position. Further
financial data could be added to create transactional data
between the separate entities as well. With this relationship
model, the company’s information could be viewed and
cross-analyzed to determine validity of financial reporting.
3. A third scenario in which the Fusion Tables could be
applied in the area of auditing exists with a more simple
type of effectiveness. One of the best uses of the Fusion
Tables is the ability to merge separate sets of data from
different users to create one simple graphic representation.
This has an abundant amount of uses even in auditing. For
instance, an auditor could compare financial data over time
uses the timeline or bar graph features. Of course many
applications are able to create tables such as these;
however, the Google Fusion Tables is able to create more
complex tables with multiple sources of data that are easy
to comprehend.
ii. Tax Planning – minimize legal worldwide tax payment, across
countries or states
77
1. One great example of how the Google Fusion Tables could
be implemented in the area of tax planning exists with
world-wide companies. One tool in the tables allows users
to generate a map with a company’s operations’ locations
and financial or tax information overlaid on it. This would
allow them to make decisions on where to continue or
expand operations for instance to have a lower tax
payment. If one country had much lower tax payments on
income or on goods, the company could decide to expand
in that country instead of one with much higher taxes.
2. A second example of using the Google Fusion Tables in the
area of tax planning is a continuation or adaptation of the
first example. With the map in mind, users could
manipulate the visualization to show a heat map. This type
of representation reveals which areas have the highest or
lowest conditions that the users set. If a tax professional
wanted to view which sectors around the globe had the
highest tax expenses for instance, he or she could use heat
mapping to reveal “hot spots.” This information would help
to make more effective tax planning decisions.
3. A third example for using these Google Fusion Tables in
the area of tax planning strays away from the use of the
mapping representation. For this scenario, imagine a new
78
upcoming tax reform has created some upheaval in today’s
society. A company is unsure of how this reform might
affect operations in that country. By using the Google
Fusion Tables, a tax professional could assist the company
in making decisions on how to handle the possibility of the
tax reform. This would be done by generating graphs and
timelines to represent future possibilities for the company
using their financial data.
iii. Financial Statement Analysis/ Valuation / Advisory
1. One beneficial use of the Google Fusion Tables lies in the
analysis of financial statements. Depending on the size of
the company, financial statements could consist of lots of
information or just enough information. A good example of
the implementation of the Fusion Tables would be to use
the graphical visualizations to compare yearly or period-to-
period amounts for a company’s accounts. One tool that
could be used here would be bar graphs or even timelines.
Another example could be the use of relational
representations to help support the information in the
statements.
2. One great example for the use of the Google Fusion Tables
lies in the area of valuation. This means valuing the current
79
worth of an asset or a company. One method that could be
used to value an asset includes comparing it to similar
assets and evaluating cash flow potential. With the use of
calculated data and graphics, users could compare assets to
determine the value of them. This process could even be
done over time using timelines. Another example of using
the Fusion Tables for valuation exists by comparing
separate operating locations on a map. By using map data
and financial information about the operations, users could
see which areas are more valuable than others.
3. Many great examples exist for the use of the Google Fusion
Tables within the area of advisory. For instance, by creating
relational representations of customer relationship
management (CRM) or supply chain management (SCM)
systems, users could see how the process is functioning and
which areas they affect. By using historical data, timelines
could be used to show how effective the systems are or
perhaps even how risky they are if measurements are
available. Furthermore, location data could be used to
generate mapping visualizations to show details on the
growth of sectors and their eventual need for systems
implementation. These are just a few ways in which the

80
Google Fusion Tables could be implemented in different
areas to make processes more efficient and effective.
81
III. Investment
A. Write a few paragraphs to your future public accounting partner
explaining why your team should invest in the acquisition of and
training in this tool. Explain how the tool will impact the staffing and
scope of your future engagements.
i. The Google Fusion Tables application provides an exciting, new way
to collaborate and manage tabular data. This great tool delivers many
features that will benefit our future engagements:
1. Visualization/Integration
a. The primary use of the application is to visualize data
stored in the forms of graphical charts, maps, time
lines and plots, along with the ability to publish, share
and integrate them with individual users and websites.
This amazing software converts the data stored in the
various files into a meaningful graphical
representation that can be easily interpreted. Data
from multiple sources is integrated by performing
joins across tables that may belong to different users.
2. Management
a. As this service is hosted on the Google cloud
infrastructure, all the data across the shared users,
websites, and merged tables stays in the most updated
82
version. Also, users are able to keep the data private,
share it with a select set of collaborators, or make it
public and thus crawlable by search engines.
3. Collaboration
a. A significant benefit of the service and one of the
original designs for it resides in the ability to
collaborate with various users across the Internet.
Specifically, a discussion feature of Fusion Tables
permits users to conduct discussions of the data at
various levels, such as tables, rows, columns, and
cells. Users are able to share their data within the
tables to aid other user’s projects or efforts.
83
Case Study 7: Rite Aid Corporation
Long-Term Debt
February 14, 2018
84
I. Executive Summary
In this scenario, Rite Aid Corporation, the third largest retail pharmacy in the U.S.,
operates 4,780 stores in 31 states. The company has a large market share and boasts as
being number one in over half the markets in which it operates. In addition, 68% of total
sales in fiscal 2009 were accounted for by the filling of more than 300 million
prescriptions by Rite Aid pharmacists. Other merchandise is available at the pharmacies
including over-the-counter medication, household items, and even photo processing. The
company also carries 3,300 products under its private brand. As a U.S.-based company,
Rite Aid reports its financial statements in accordance with U.S. GAAP. They have
released their financial statements as well as footnote excerpts for the fiscal year ended
February 27, 2010. The focus of the statements and notes lies solely in the company’s
types of long-term debt. This includes secured and unsecured notes and bonds with a
variety of interest rates and conditions. This case highlights the importance of
understanding debt terminology and the steps in auditing a company’s financial
statements in order to find any possible errors or deviations. A majority of the following
case guides the user in locating or calculating principal amounts, interest rates, and
discount amortizations.
This case study has granted me with more knowledge and experience in handling
different types of long-term debt, including notes and bonds. The conceptual part of the
exercise reinforced my understanding of terminology such as “convertible” and
“guaranteed”. Although some of the information included in the notes relating to the
credit facility was technical, all of the notes and bonds terms were clearly reported and

85
understandable. The process part of the case allowed me to hone in my ability to calculate
effective interest rates, discount amortizations, and net book values. Another beneficial
exercise was having to build an amortization schedule for several years, allowing the user
to visual the lifetime of a note. This case study has enhanced my knowledge of different
types of long-term debt.
86
II. Concepts
A. Consider the various types of debt described in note 11, Indebtedness and
Credit Agreement.
i. Explain the difference between Rite Aid’s secured and
unsecured debt. Why does Rite Aid distinguish between these
two types of debt?
1. Before discussing the specific instances of Rite Aid’s debt,
the terms “secured” and “unsecured” must be defined. An
unsecured debt is one of which there is no collateral against
or no asset that backs up the loan or extension of credit. On
the other hand, a secured debt is one that has an asset to
back it up in case of defaults. This asset is also known as
collateral and can be seized and sold to repay the debt. For
Rite Aid, the secured debt is guaranteed by some of their
specific assets, while the unsecured debt is not backed up.
Companies, including Rite Aid, must distinguish between
the two types of debt in order to provide better information
to external users, such as creditors and investors.
87
ii. What does it mean for debt to be “guaranteed”? According to
note 11, who has provided the guarantee for some of Rite Aid’s
unsecured debt?
1. A guaranteed debt is a type of debt that is backed by a third
party in the event that payments could not be made or
should the borrower default. The third party would then pay
the debt on behalf of the borrower. In Rite Aid’s case, their
wholly-owned subsidiaries guarantee the obligations under
the senior secured credit facility and the senior secured
notes by a senior lien on inventory, accounts receivable,
and prescription files of the guarantors.
iii. What is meant by the terms “senior,” “fixed-rate,” and
“convertible”?
1. Senior: these types of securities take precedence over other
unsecured notes in the event of bankruptcy and must be
paid first if assets are liquidated.
2. Fixed-rate: a fixed-rate, or fixed interest rate, is one where
the interest rate does not fluctuate during the entire lifetime
or certain period of a loan. These are advantageous for
being able to predict future interest expenses.
88
3. Convertible: this type of debt is allowed to be converted
into equity at a certain time, instead of receiving a return of
principle plus interest.
iv. Speculate as to why Rite Aid has many different types of debt
with a range of interest rates.
1. I believe that in order to be able to effectively finance their
operations and assets, a company should diversify their
types of debt. For one, a company should not fully have
unsecured or secured debt but rather a mix of the two.
Additionally, with a variety of interest rates in different
areas, a company can capitalize on lower interest rates by
borrowing and then paying off those debts with higher
interests.
89
III. Process *All numbers in thousands unless otherwise stated*
A. Consider note 11, Indebtedness and Credit Agreement. How much total
debt does Rite Aid have at February 27, 2010? How much of this is due
within the coming fiscal year? Reconcile the total debt reported in note 11
with what Rite Aid reports on its balance sheet.
i. Based on the information in the note and the financial statements, Rite
Aid’s total debt amounts to $6,370,899. The current portion of this
debt amounts to $51,502. By taking the sum of “Long-term debt, less
current maturities” ($6,185,633), “Lease financing obligations, less
current maturities” ($133,764), and the current maturities ($51,502), a
user can find the total debt ($6,370,899).
B. Consider the 7.5% senior secured notes due March 2017.
i. What is the face value (i.e. the principal) of these notes?
How do you know?
1. The face value, or principal, for these notes must be
$500,000, because the value did not change between
2009 and 2010. They were issued at par since there was
no amortization or change in value.
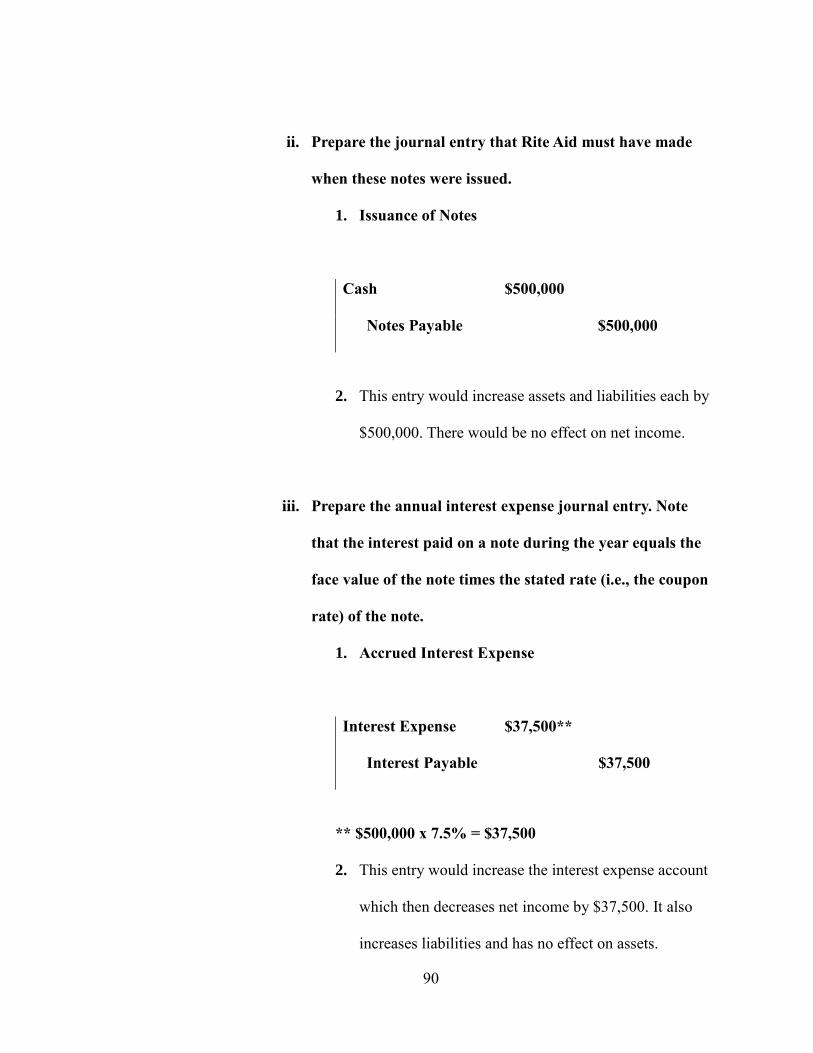
90
ii. Prepare the journal entry that Rite Aid must have made
when these notes were issued.
1. Issuance of Notes
Cash $500,000
Notes Payable $500,000
2. This entry would increase assets and liabilities each by
$500,000. There would be no effect on net income.
iii. Prepare the annual interest expense journal entry. Note
that the interest paid on a note during the year equals the
face value of the note times the stated rate (i.e., the coupon
rate) of the note.
1. Accrued Interest Expense
Interest Expense $37,500**
Interest Payable $37,500
** $500,000 x 7.5% = $37,500
2. This entry would increase the interest expense account
which then decreases net income by $37,500. It also
increases liabilities and has no effect on assets.
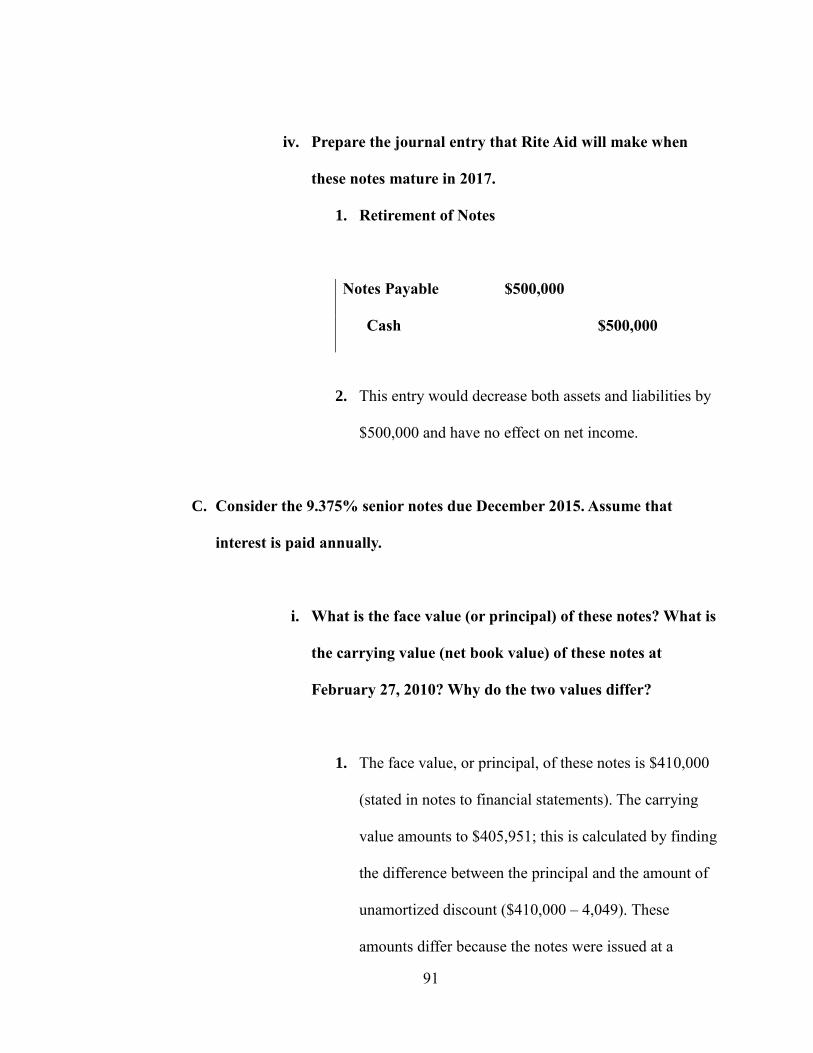
91
iv. Prepare the journal entry that Rite Aid will make when
these notes mature in 2017.
1. Retirement of Notes
Notes Payable $500,000
Cash $500,000
2. This entry would decrease both assets and liabilities by
$500,000 and have no effect on net income.
C. Consider the 9.375% senior notes due December 2015. Assume that
interest is paid annually.
i. What is the face value (or principal) of these notes? What is
the carrying value (net book value) of these notes at
February 27, 2010? Why do the two values differ?
1. The face value, or principal, of these notes is $410,000
(stated in notes to financial statements). The carrying
value amounts to $405,951; this is calculated by finding
the difference between the principal and the amount of
unamortized discount ($410,000 – 4,049). These
amounts differ because the notes were issued at a
92
discount, meaning below par. The discount will be
amortized over the life of the notes until the carrying
value reaches the par value.
ii. How much interest did Rite Aid pay on these notes during
the fiscal 2009?
1. Rite Aid paid approximately $38,438 in cash interest
payments during the fiscal 2009. In order to calculate
this amount, the principal is multiplied by the stated, or
coupon, rate ($410,000 x 9.375%). This would decrease
assets and equity both by $38,438.
iii. Determine the total amount of interest expense recorded by
Rite Aid on these notes for the year ended February 27,
2010. Note that there is a cash and a noncash portion to
interest expense on these notes because they were issued at
a discount. The noncash portion of the interest expense is
the amortization of the discount during the year (that is,
the amount by which the discount decreased during the
year).
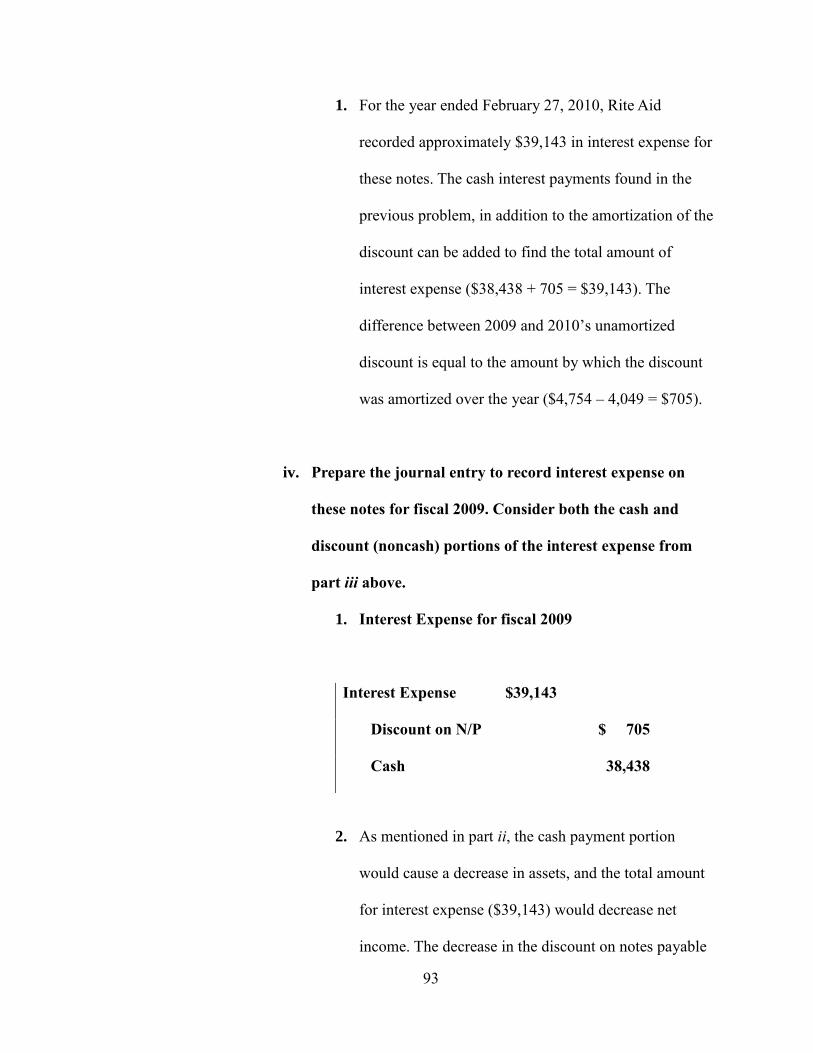
93
1. For the year ended February 27, 2010, Rite Aid
recorded approximately $39,143 in interest expense for
these notes. The cash interest payments found in the
previous problem, in addition to the amortization of the
discount can be added to find the total amount of
interest expense ($38,438 + 705 = $39,143). The
difference between 2009 and 2010’s unamortized
discount is equal to the amount by which the discount
was amortized over the year ($4,754 – 4,049 = $705).
iv. Prepare the journal entry to record interest expense on
these notes for fiscal 2009. Consider both the cash and
discount (noncash) portions of the interest expense from
part iii above.
1. Interest Expense for fiscal 2009
Interest Expense $39,143
Discount on N/P $ 705
Cash 38,438
2. As mentioned in part ii, the cash payment portion
would cause a decrease in assets, and the total amount
for interest expense ($39,143) would decrease net
income. The decrease in the discount on notes payable
94
actually increases liabilities because the notes payable
carrying value increases.
v. Compute the total rate of interest recorded for fiscal 2009
on these notes.
1. The total rate of interest for fiscal 2009 can be found by
solving for the effective interest rate. The effective
interest rate is the interest rate that is actually earned or
paid on a loan due to the result of compounding over a
given time period.4 In order to calculate this rate in this
specific situation, the total interest expense should be
divided by the carrying value in 2009 ($39,143 /
405,246). The resulting interest rate is 9.659% or
simply, 9.66%.
D. Consider the 9.75% notes due June 2016. Assume that Rite Aid issued
these notes on June 30, 2009 and that the company pays interest on June
30th of each year.
4 https://www.investopedia.com/terms/e/effectiveinterest.asp
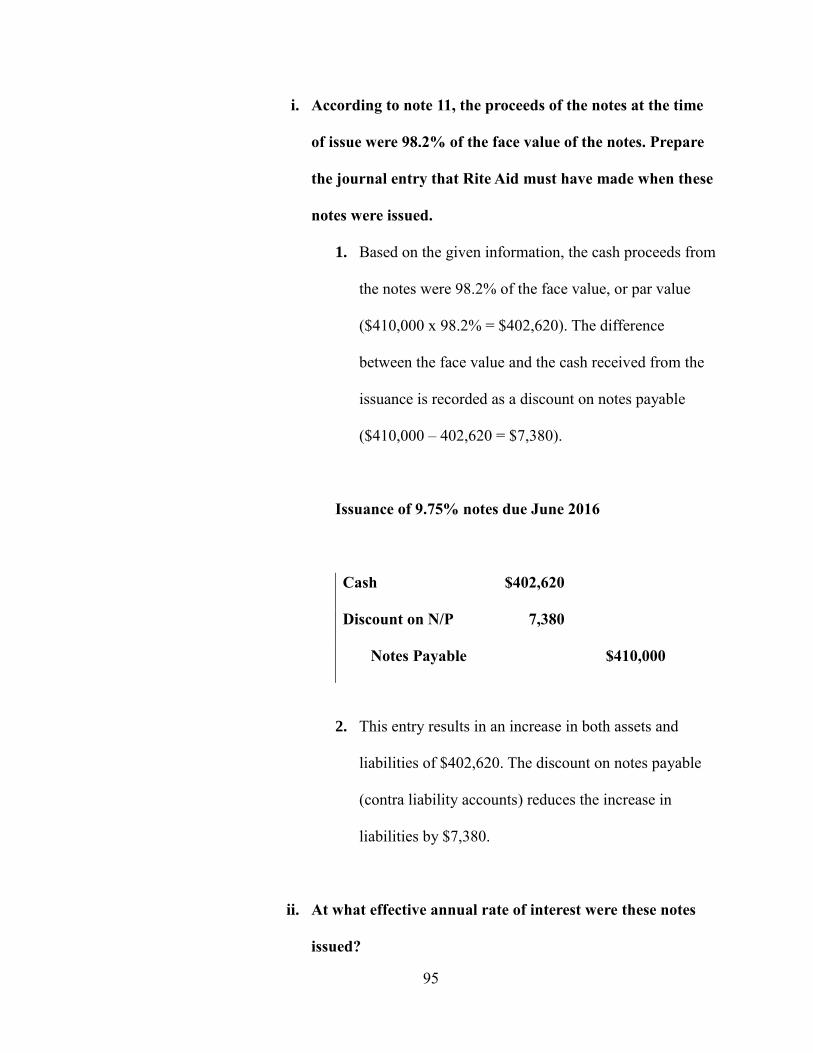
95
i. According to note 11, the proceeds of the notes at the time
of issue were 98.2% of the face value of the notes. Prepare
the journal entry that Rite Aid must have made when these
notes were issued.
1. Based on the given information, the cash proceeds from
the notes were 98.2% of the face value, or par value
($410,000 x 98.2% = $402,620). The difference
between the face value and the cash received from the
issuance is recorded as a discount on notes payable
($410,000 – 402,620 = $7,380).
Issuance of 9.75% notes due June 2016
Cash $402,620
Discount on N/P 7,380
Notes Payable $410,000
2. This entry results in an increase in both assets and
liabilities of $402,620. The discount on notes payable
(contra liability accounts) reduces the increase in
liabilities by $7,380.
ii. At what effective annual rate of interest were these notes
issued?
96
1. The effective annual rate of interest can be easily found
by either using Microsoft Excel or a financial
calculator. A user could solve using algebraic formulas
in order to find present value amounts for the single
sum and the ordinary annuity, however, this method is
less efficient and leaves room for errors. The best
methods will calculate the answer for the user, but I will
describe each of them in any case.
a. For the financial calculator, input “7” for N
(number of periods), “402,620” for PV (present
value), “-39,975” for PMT (annual interest
payment), “-410,000” for FV (future value), and
press CPT, I/Y. The result will be 10.1212%.
b. For Excel, the user must select a cell and use the
RATE function. The inputs will be “7” for nper
(number of periods), “-39,975” for pmt (annual
interest payments), “402,620” for the pv
(present value), and “-410,000” for the fv
(future value). There is no need to input
anything for the [type] or [guess] in the
function. The result will be 10.1212%.
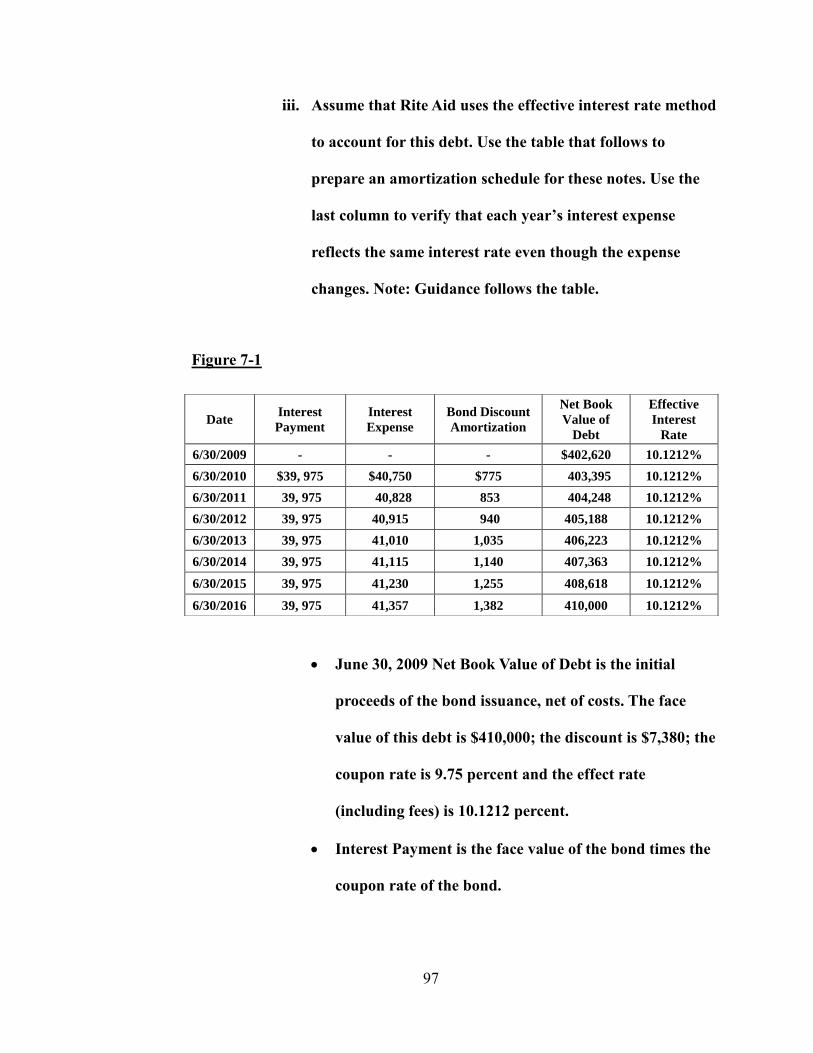
97
iii. Assume that Rite Aid uses the effective interest rate method
to account for this debt. Use the table that follows to
prepare an amortization schedule for these notes. Use the
last column to verify that each year’s interest expense
reflects the same interest rate even though the expense
changes. Note: Guidance follows the table.
Figure 7-1
• June 30, 2009 Net Book Value of Debt is the initial
proceeds of the bond issuance, net of costs. The face
value of this debt is $410,000; the discount is $7,380; the
coupon rate is 9.75 percent and the effect rate
(including fees) is 10.1212 percent.
• Interest Payment is the face value of the bond times the
coupon rate of the bond.
Date Interest
Payment
Interest
Expense
Bond Discount
Amortization
Net Book
Value of
Debt
Effective
Interest
Rate
6/30/2009 - - - $402,620 10.1212%
6/30/2010 $39, 975 $40,750 $775 403,395 10.1212%
6/30/2011 39, 975 40,828 853 404,248 10.1212%
6/30/2012 39, 975 40,915 940 405,188 10.1212%
6/30/2013 39, 975 41,010 1,035 406,223 10.1212%
6/30/2014 39, 975 41,115 1,140 407,363 10.1212%
6/30/2015 39, 975 41,230 1,255 408,618 10.1212%
6/30/2016 39, 975 41,357 1,382 410,000 10.1212%
98
• Interest Expense equals opening book value of the debt
times the effective interest rate.
o The difference between the interest payment and
the interest expense is the amortization of the
bond discount. This is equivalent to saying that
interest expense equals the interest paid plus the
amortization of the bond discount.
o Amortizing the discount increases the net book
value of the bond each year.
iv. Based on the above information, prepare the journal entry
that Rite Aid would have recorded February 27, 2010, to
accrue interest expense on these notes.
1. Interest Expense Accrual
Interest Expense $27,167**
Discount on N/P $ 517***
Interest Payable 26,650
** $402,620 x 10.1212% x 8/12
*** $775 x 8/12
Explanation: Because of the date the financial statements
were released, the interest expense and discount
99
amortization only accrued for eight months. In order to
calculate the correct amounts, you must multiply by 8/12.
This entry decreases net income and increases liabilities by
$27,167.
v. Based on your answer to part iv., what would be the net
book value of the notes at February 27, 2010?
1. Based on the aforementioned calculations, the net book
value of the notes should be $403,137; however, the
financial statement notes say that the net book value is
$403,308. The difference in these amounts is due to the
fact that Rite Aid uses the straight-line method in their
calculations. The former amount is more accurate than
the amount stated in the notes to the financial
statements, but Rite Aid most likely has to remain
consistent in their records by using the straight-line
method.
100
Case Study 8: Merck & Co., Inc.
Shareholders’ Equity
February 23, 2018
101
I. Executive Summary
In this scenario, Merck & Co, Inc., a global research-driven pharmaceutical company,
creates a multitude of products to improve human and animal health. The company is
headquartered in New Jersey, employing almost 60,000 people worldwide with about
20% of them engaged in research activities. Merck’s shares are also listed on the New
York and Philadelphia Stock Exchanges As a U.S.-based company, Merck & Co reports
its financial statements in accordance with U.S. GAAP. They have released their financial
statements as well as footnote excerpts for the fiscal years ended December 31, 2005-
2007. The main focus of the case, financial statements, and notes is the stockholders’
equity. This includes share information, as well as, dividend information. This case
highlights the importance of understanding how to analyze a company’s financial
statements to calculate share information and related ratios. A majority of the following
case guides the user in locating, calculating, and expressing the aforementioned
information on shares, dividends, and ratios.
This case study has enhanced my understanding of the issuance of share, share
buybacks, dividends and the related ratios. The conceptual aspect of the case took me
step-by-step through the financial statements to find share information and reasons for
dividends and share buybacks. Furthermore, the process section of the case delved a little
deeper into dividend journal entries and treasury stock transactions of Merck. The
analysis question honed in on locating or calculating amounts and ratios using the
financial statements and then analyzing the results. By comparing year-to-year
calculations, I was able to process the underlying implications of dividend and income

102
changes. This case has improved my knowledge in understanding treasury stocks
specifically. I haven’t understood the definition nor effects of treasury stock until
recently, so I appreciate working through this case study.
103
II. Concepts
A. Consider Merck’s common shares.
i. How many common shares is Merck authorized to issue?
1. Merck’s balance sheet states that it is authorized to issue
5,400,000,000 shares.
ii. How many common shares has Merck actually issued at
December 31, 2007?
1. Merck’s balance sheet states that it has issued
2,983,508,675 shares at December 31, 2007.
iii. Reconcile the number of shares issued at December 31, 2007, to
the dollar value of common stock reported on the balance
sheet.
1. For the aforementioned number of shares issued, Merck
reports around $29.8 million worth on the balance sheet.
iv. How many common shares are held in treasury at December
31, 2007?
104
1. Merck’s balance sheet states that 811,005,791 shares are
held in treasury as of December 31, 2007.
v. How many common shares are outstanding at December 31,
2007?
1. To find the amount of shares outstanding, subtract the
amount of shares held in treasury from the amount of
shares issued:
2,983,508,675 – 811,005,791 = 2,172,502,884 shares
outstanding
vi. At December 31, 2007, Merck’s stock price closed at $57.61 per
share. Calculate the total market capitalization of Merck on
that day.
1. To calculate the total market capitalization, multiply the
amount of shares outstanding by the market price per share:
2,172,502,884 x $57.61 = $125,157,891,100
B. Why do companies pay dividends on their common or ordinary
shares? What normally happens to a company’s share price when
dividends are paid?
105
i. Essentially, dividends are paid to common stock shareholders as a
return on their initial investment, or purchasing of the shares.
Depending on the situation and investor speculation, the stock
prices could fall or rise when a company declares and pays
dividends. For example, if a company pays a lower dividend than
expected, the stock price may fall as investors imagine the root
causes of the drop. On the other hand, if a company pays a higher
dividend than expected, the stock price may rise as investors
believe that the company experienced more growth.
C. In general, why do companies repurchase their own shares?
i. A company may repurchase their own shares for many different
reasons. One reason might be that the company believes that the
stock is more valuable than the market shows. They would buy the
stock in hopes that the outstanding share prices would rise in the
near future. Another reason might be to alleviate dilution created
by employee stock option plans (ESOP), which also could improve
financial ratios.
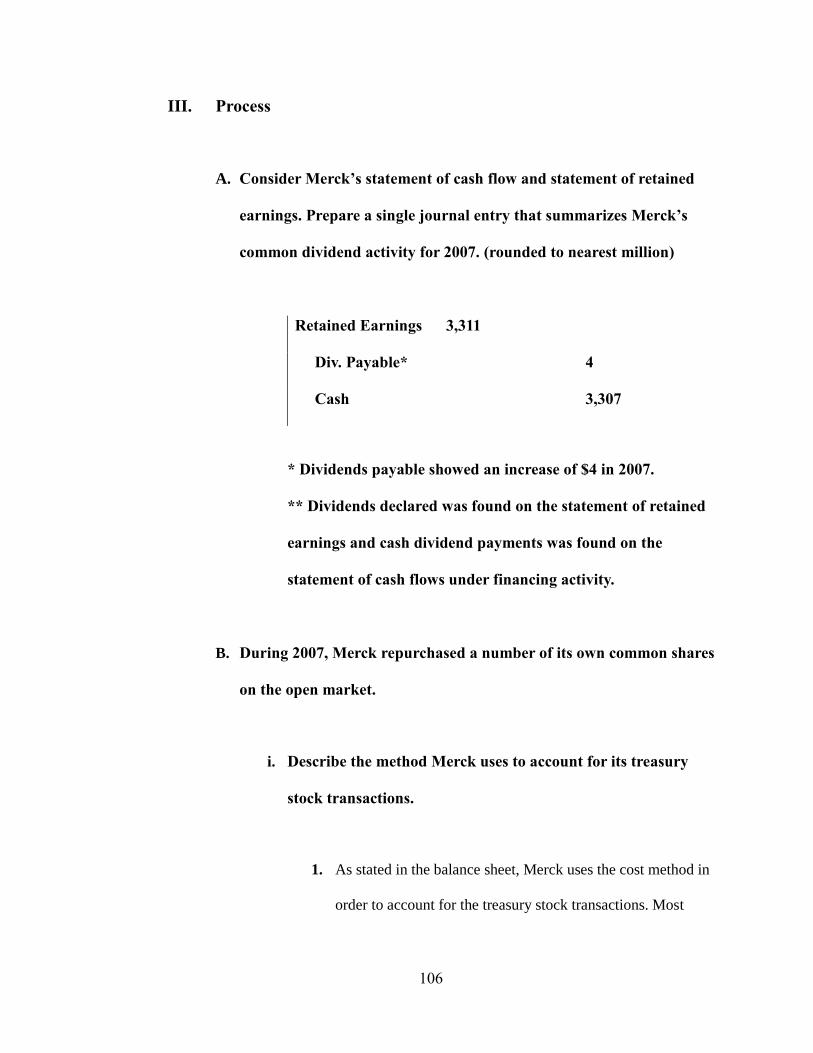
106
III. Process
A. Consider Merck’s statement of cash flow and statement of retained
earnings. Prepare a single journal entry that summarizes Merck’s
common dividend activity for 2007. (rounded to nearest million)
Retained Earnings 3,311
Div. Payable* 4
Cash 3,307
* Dividends payable showed an increase of $4 in 2007.
** Dividends declared was found on the statement of retained
earnings and cash dividend payments was found on the
statement of cash flows under financing activity.
B. During 2007, Merck repurchased a number of its own common shares
on the open market.
i. Describe the method Merck uses to account for its treasury
stock transactions.
1. As stated in the balance sheet, Merck uses the cost method in
order to account for the treasury stock transactions. Most
107
companies use this method to report treasury stock at the
market price at the time of repurchasing.
ii. Refer to note 11 to Merck’s financial statements. How many
shares did Merck repurchase on the open market during 2007?
1. Based on the note 11, Merck repurchased 26.5 million
shares in 2007.
iii. How much did Merck pay, in total and per share, on average,
to buy back its stock during 2007? What type of cash flow does
this represent?
1. Also stated in note 11, Merck paid a total amount of
$1,429.7 million to repurchase stock in 2007. By dividing
this total amount by the aforementioned number of shares
repurchased, the cost per share of $53.95 can be calculated.
iv. Why doesn’t Merck disclose its treasury stock as an asset?
1. An asset is defined as a resource with economic value that
an individual, corporation or country owns or controls with

108
the expectation that it will provide future benefit.5 Treasury
stock is not classified as an asset because it represents a
decrease in equity and gains and losses cannot be
recognized from the transaction.
5 https://www.investopedia.com/terms/a/asset.asp
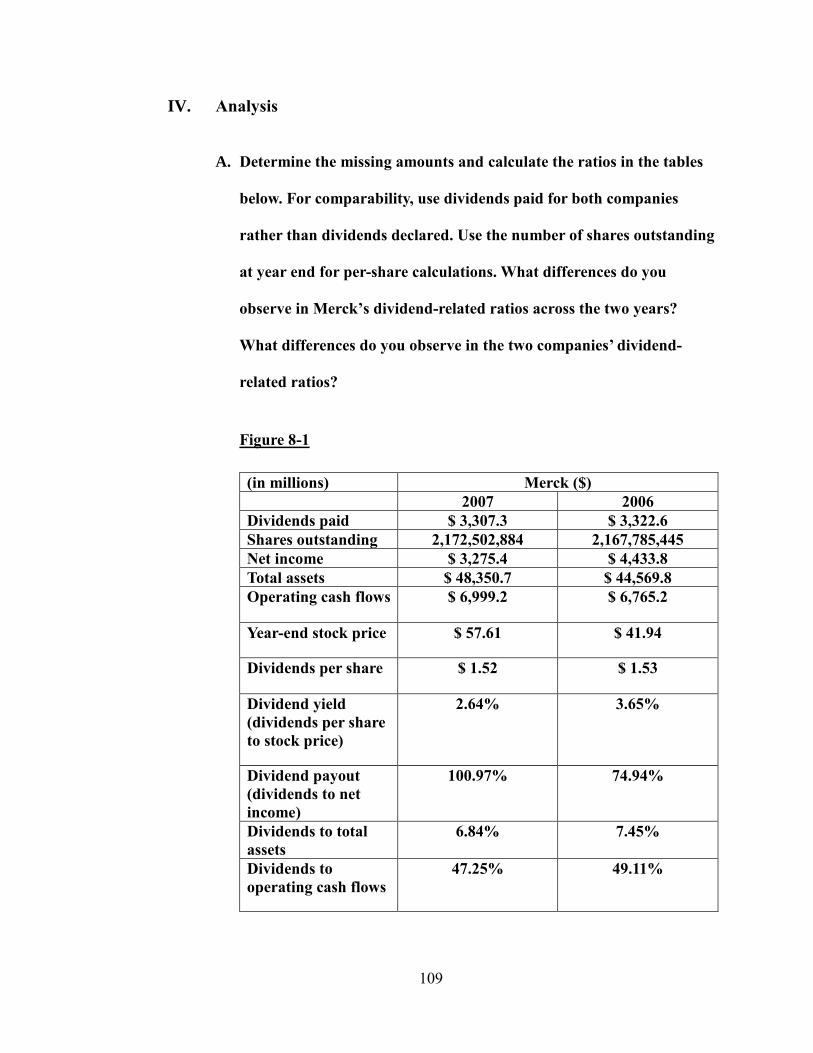
109
IV. Analysis
A. Determine the missing amounts and calculate the ratios in the tables
below. For comparability, use dividends paid for both companies
rather than dividends declared. Use the number of shares outstanding
at year end for per-share calculations. What differences do you
observe in Merck’s dividend-related ratios across the two years?
What differences do you observe in the two companies’ dividend-
related ratios?
Figure 8-1
(in millions) Merck ($)
2007 2006
Dividends paid $ 3,307.3 $ 3,322.6
Shares outstanding 2,172,502,884 2,167,785,445
Net income $ 3,275.4 $ 4,433.8
Total assets $ 48,350.7 $ 44,569.8
Operating cash flows $ 6,999.2 $ 6,765.2
Year-end stock price $ 57.61 $ 41.94
Dividends per share $ 1.52 $ 1.53
Dividend yield
(dividends per share
to stock price)
2.64% 3.65%
Dividend payout
(dividends to net
income)
100.97% 74.94%
Dividends to total
assets
6.84% 7.45%
Dividends to
operating cash flows
47.25% 49.11%
110
i. Merck’s dividend-related ratios were overall quite similar between
2006 and 2007. A slight decrease in the amount of dividends paid
affected the dividends to operating cash flows and dividends to
total assets ratios to decrease. The dividends yield decreased by
about one percent because of the decrease in dividends per share.
Lastly, a large increase in the dividend payout was caused by a
heavy decline in net income and a light decrease in dividends paid.
111
Case Study 9: State Street Corporation
Marketable Securities
April 4, 2018
112
I. Executive Summary
In this scenario, State Street Corporation, a major financial holding company,
operates two lines of business: Investment Servicing and Investment Management. The
company is headquartered in Boston, MA, and traces its beginnings to the founding of the
Union Bank in 1792. It operates mainly through its principal banking subsidiary, State
Street Bank and Trust, with a focus on serving institutional investors. The company offers
several products or services including securities finance, brokerage and other trading
services, deposit and short-term investment facilities, risk and investment research and
investment management. As a U.S.-based company, State Street Corporation reports its
financial statements in accordance with U.S. GAAP. They have released their financial
statements as well as footnote excerpts for the fiscal year ended December 31, 2012. Also
included on their financial statements are 2010 and 2011 amounts for yearly
comparability. The main purpose of this case focuses on the reporting of the different
types of marketable securities. The three key types include held-to-maturity, available-
for-sale, and trading securities. This case highlights the importance of understanding how
a company reports these different security classifications on their financial statements and
how to trace the amounts through the notes and statements. Most of the case guides the
user in locating, calculating, preparing journal entries for the aforementioned information
and amounts.
This case study has granted me with a greater understanding of the reporting of
security investments and the journal entries required to adjust them. The conceptual
aspect of the case allowed me to distinguish the types of classifications for investment

113
securities based on intent. The process aspect took me through journal entries to adjust
securities to fair value and to find unrealized or realized gains and losses. Overall, this
case study has improved my knowledge in understanding the various types of marketable
securities.
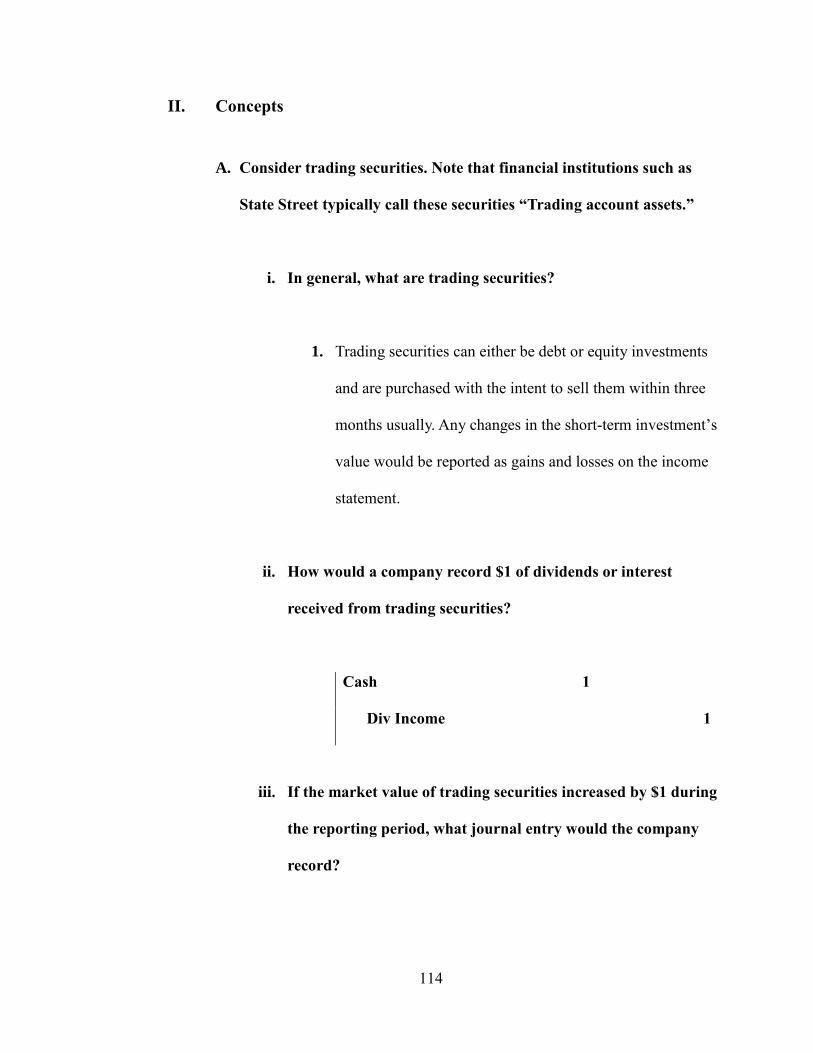
114
II. Concepts
A. Consider trading securities. Note that financial institutions such as
State Street typically call these securities “Trading account assets.”
i. In general, what are trading securities?
1. Trading securities can either be debt or equity investments
and are purchased with the intent to sell them within three
months usually. Any changes in the short-term investment’s
value would be reported as gains and losses on the income
statement.
ii. How would a company record $1 of dividends or interest
received from trading securities?
Cash 1
Div Income 1
iii. If the market value of trading securities increased by $1 during
the reporting period, what journal entry would the company
record?
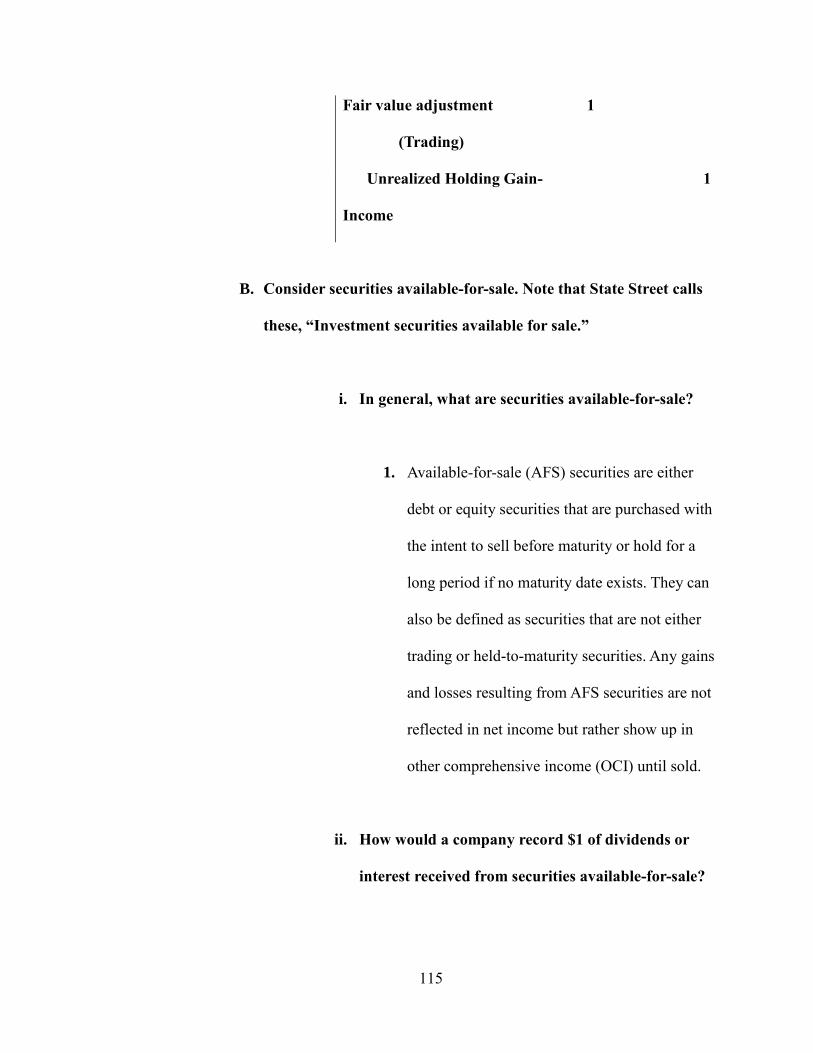
115
Fair value adjustment
(Trading)
1
Unrealized Holding Gain-
Income
1
B. Consider securities available-for-sale. Note that State Street calls
these, “Investment securities available for sale.”
i. In general, what are securities available-for-sale?
1. Available-for-sale (AFS) securities are either
debt or equity securities that are purchased with
the intent to sell before maturity or hold for a
long period if no maturity date exists. They can
also be defined as securities that are not either
trading or held-to-maturity securities. Any gains
and losses resulting from AFS securities are not
reflected in net income but rather show up in
other comprehensive income (OCI) until sold.
ii. How would a company record $1 of dividends or
interest received from securities available-for-sale?
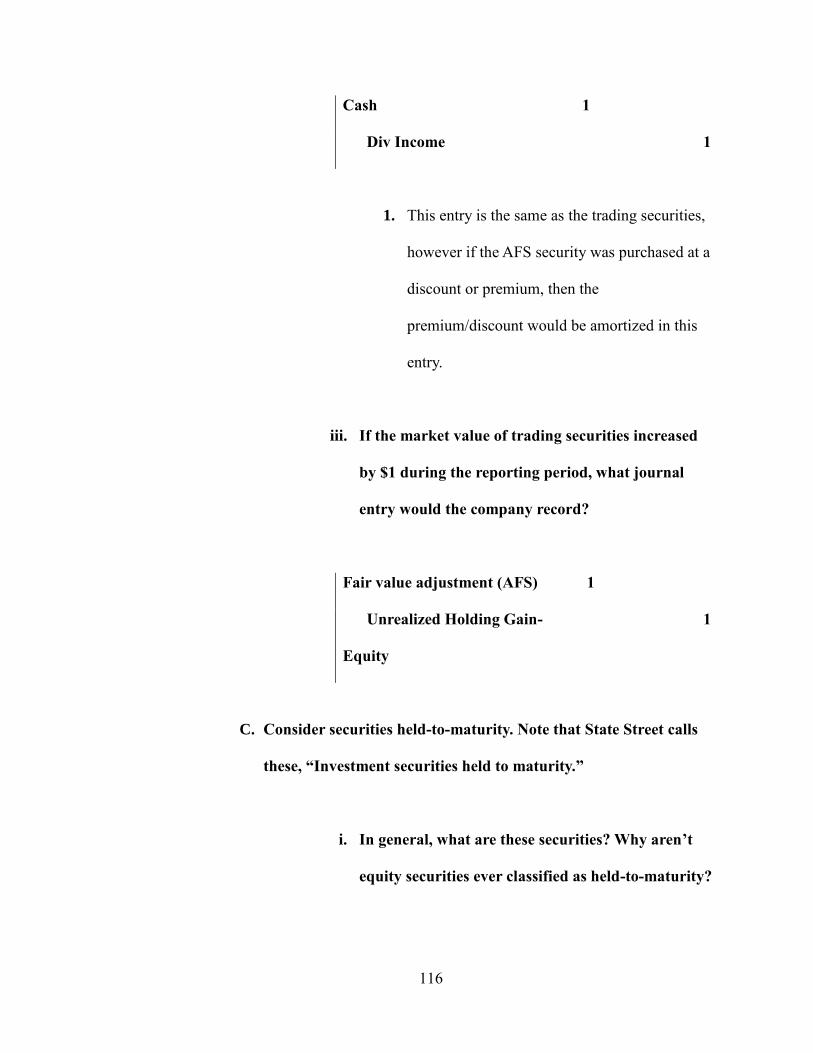
116
Cash 1
Div Income 1
1. This entry is the same as the trading securities,
however if the AFS security was purchased at a
discount or premium, then the
premium/discount would be amortized in this
entry.
iii. If the market value of trading securities increased
by $1 during the reporting period, what journal
entry would the company record?
Fair value adjustment (AFS) 1
Unrealized Holding Gain-
Equity
1
C. Consider securities held-to-maturity. Note that State Street calls
these, “Investment securities held to maturity.”
i. In general, what are these securities? Why aren’t
equity securities ever classified as held-to-maturity?
117
1. Held-to-maturity securities are only debt
investments and are purchased with the intent of
holding the investment to its maturity date. They
are reported at amortized cost and therefore, any
changes in its fair value are not reported on the
financial statements.
ii. If the market value of securities held-to-maturity
increased by $1 during the reporting period, what
journal entry would the company record?
1. No journal entry is required because you do not
adjust held-to-maturity securities to fair value.
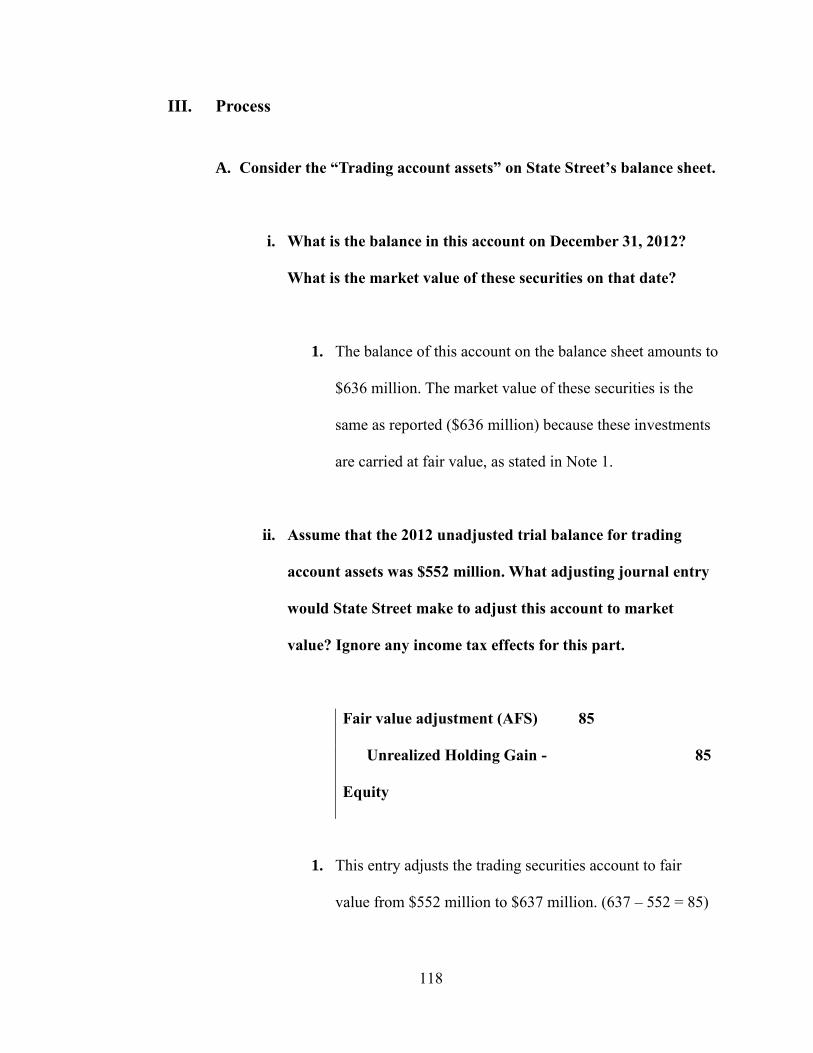
118
III. Process
A. Consider the “Trading account assets” on State Street’s balance sheet.
i. What is the balance in this account on December 31, 2012?
What is the market value of these securities on that date?
1. The balance of this account on the balance sheet amounts to
$636 million. The market value of these securities is the
same as reported ($636 million) because these investments
are carried at fair value, as stated in Note 1.
ii. Assume that the 2012 unadjusted trial balance for trading
account assets was $552 million. What adjusting journal entry
would State Street make to adjust this account to market
value? Ignore any income tax effects for this part.
Fair value adjustment (AFS) 85
Unrealized Holding Gain -
Equity
85
1. This entry adjusts the trading securities account to fair
value from $552 million to $637 million. (637 – 552 = 85)
119
B. Consider the balance sheet account “Investment securities held to
maturity” and the related disclosures in Note 4.
i. What is the 2012 year-end balance in this account?
1. The balance reported on the balance sheet amounts to $11,379
million. This is the amortized cost value of the HTM
securities.
ii. What is the market value of State Street’s investment securities
held to maturity?
1. The balance sheet reveals that the fair value of these HTM
securities amounts to $11,661 million at December 31,
2012.
iii. What is the amortized cost of these securities? What does
“amortized cost” represent? How does amortized cost compare
to the original cost of the securities?
1. As reported on the balance sheet and in Note 4 to the
financial statements, the amortized cost value of these
securities is $11,379 million. Amortized cost represents the
original cost of the security or asset, plus or minus
120
adjustments for purchase discounts or premiums associated
with the purchase of the security or asset. The amortized
cost could be either lower or higher than the original cost
depending on whether the security was purchased at a
discount or premium.
iv. What does the difference between the market value and the
amortized cost represent? What does the difference suggest
about how the average market rate of interest on held-to-
maturity securities has changed since the purchase of the
securities held by State Street?
1. The difference in the market value and amortized costs only
means that the securities are valued higher than what is
reported in the financial statements. This most likely
suggests that the average market rate of interest on HTM
securities has decreased since these securities were
purchased. If market rates decrease, then the fair market
value of a previously purchased security usually increases.
C. Consider the balance sheet account “Investment securities available
for sale” and the related disclosures in Note 4.
121
i. What is the 2012 year-end balance in this account? What does
this balance represent?
1. The balance sheet reports $109,682 million in the “Investment
securities available for sale” account. This balance represents
the fair value of the AFS securities held by State Street, as
stated in Note 1.
ii. What is the amount of net unrealized gains or losses on the
available-for-sale securities held by State Street at December 31,
2012? Be sure to note whether the amount is a net gain or loss.
1. The net unrealized gain on the AFS securities amounts to a
$1,119 million net gain. This is calculated by finding the
difference between the unrealized gains of $2,001 million and
the unrealized losses of $882 million reported in Note 4.
(2,001 – 882 = $1,119 million)
iii. What was the amount of net realized gains (losses) from sales of
available-for-sale securities for 2012? How would this amount
impact State Street’s statements of income and cash flows for
2012?
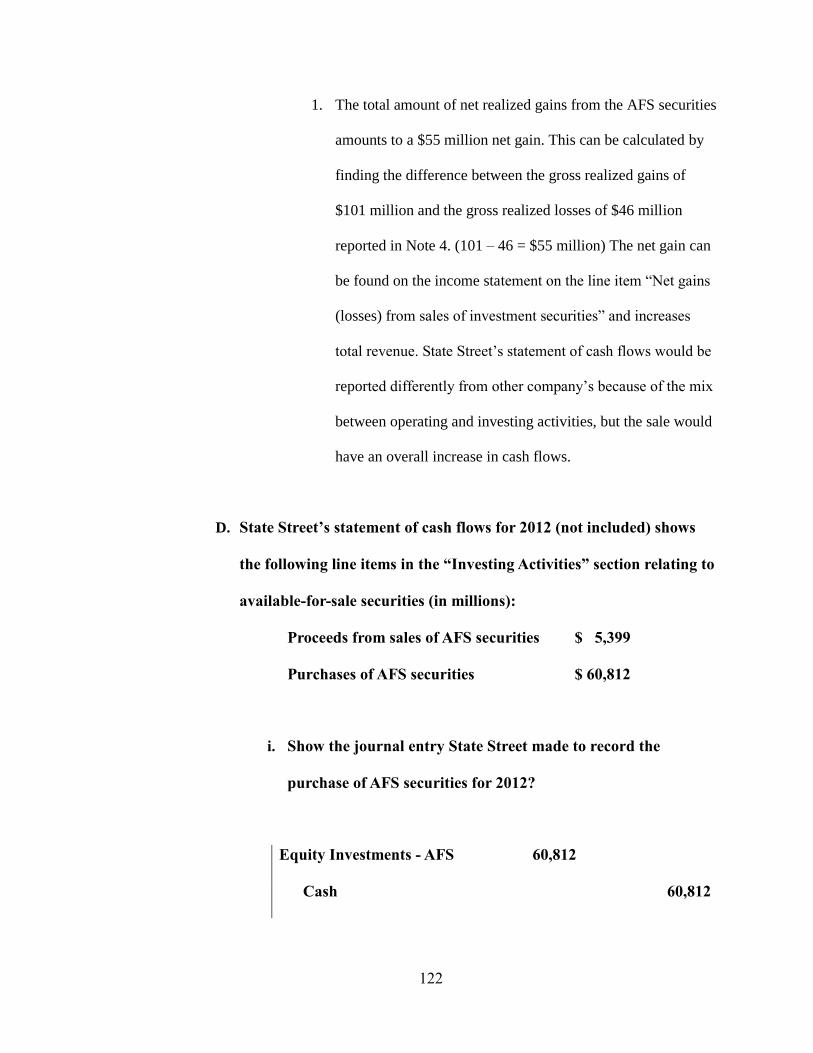
122
1. The total amount of net realized gains from the AFS securities
amounts to a $55 million net gain. This can be calculated by
finding the difference between the gross realized gains of
$101 million and the gross realized losses of $46 million
reported in Note 4. (101 – 46 = $55 million) The net gain can
be found on the income statement on the line item “Net gains
(losses) from sales of investment securities” and increases
total revenue. State Street’s statement of cash flows would be
reported differently from other company’s because of the mix
between operating and investing activities, but the sale would
have an overall increase in cash flows.
D. State Street’s statement of cash flows for 2012 (not included) shows
the following line items in the “Investing Activities” section relating to
available-for-sale securities (in millions):
Proceeds from sales of AFS securities $ 5,399
Purchases of AFS securities $ 60,812
i. Show the journal entry State Street made to record the
purchase of AFS securities for 2012?
Equity Investments - AFS 60,812
Cash 60,812
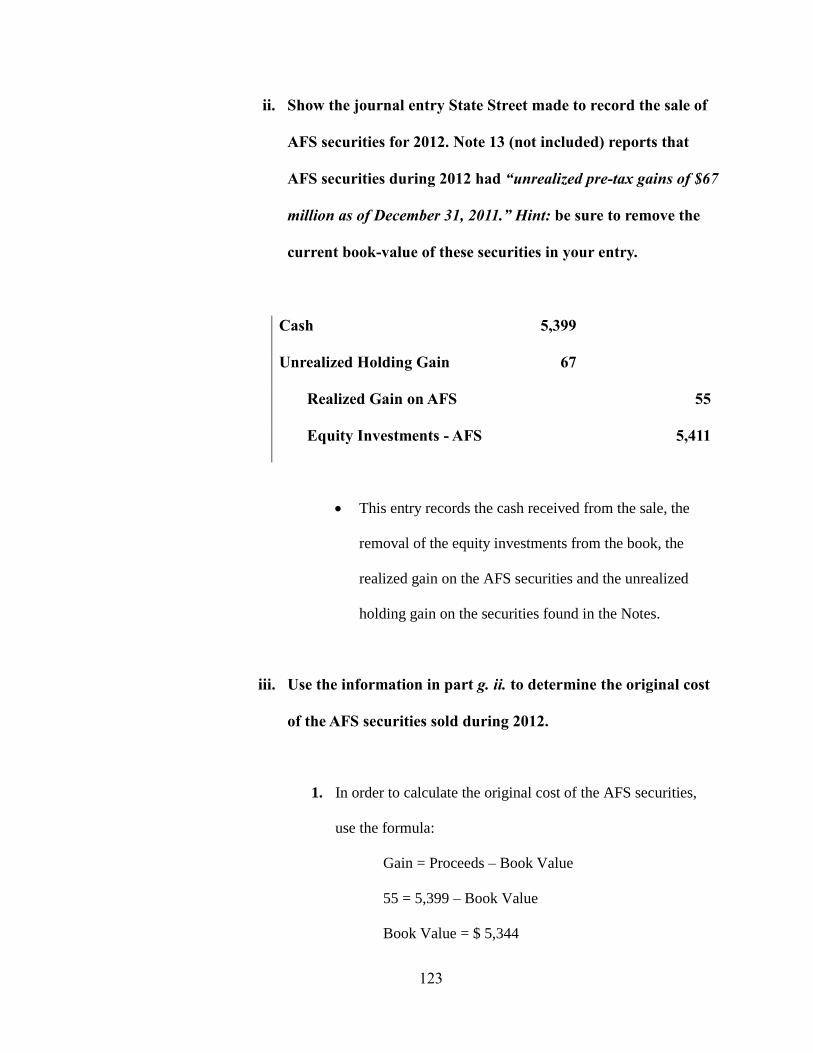
123
ii. Show the journal entry State Street made to record the sale of
AFS securities for 2012. Note 13 (not included) reports that
AFS securities during 2012 had “unrealized pre-tax gains of $67
million as of December 31, 2011.” Hint: be sure to remove the
current book-value of these securities in your entry.
Cash 5,399
Unrealized Holding Gain 67
Realized Gain on AFS 55
Equity Investments - AFS 5,411
• This entry records the cash received from the sale, the
removal of the equity investments from the book, the
realized gain on the AFS securities and the unrealized
holding gain on the securities found in the Notes.
iii. Use the information in part g. ii. to determine the original cost
of the AFS securities sold during 2012.
1. In order to calculate the original cost of the AFS securities,
use the formula:
Gain = Proceeds – Book Value
55 = 5,399 – Book Value
Book Value = $ 5,344

124
• The original book value amounts to $ 5,344 million.
125
Case Study 10: ZAGG, Inc.
Deferred Income Taxes
April 2, 2018
126
I. Executive Summary
In this scenario, ZAGG (“Zealous About Great Gadgets”) Inc., a market leader in
mobile device accessories, manufactures various accessories for tablets, smartphones, and
other mobile devices. The company actually began in 2005, designing plastic shields for
wristwatches. Its patented invisibleSHIELD film protects smart phone and tablet screens
across the globe. Some other product ZAGG manufactures include mobile keyboards,
cases, and portable power. In 2011, the company acquired iFrogs, a digital audio
accessories manufacturer, to broaden their product line and distribution area. Currently,
ZAGG’s stocks are traded on the NASDAQ. As a U.S.-based company, ZAGG reports its
financial statements in accordance with U.S. GAAP. They have released their financial
statements as well as footnote excerpts for the fiscal year ended December 31, 2012. Also
included on their financial statements are prior year amounts, specifically 2011, for
comparability. The main purpose of this case focuses on the reporting and understanding
of deferred income taxes. The deferred income taxes arrived at two possible outcomes:
deferred tax liabilities and deferred tax assets. The case guides users to understand the
concepts and to locate and calculate them in financial statements and provided footnote
excerpts. In addition to the case, I was required to refer to the FASB’s Accounting
Standards Codification, specifically ASC 740 – Income Taxes, to answer a few of the
given questions.
This case study has enhanced my understanding of the concepts behind deferred
income taxes and how they are reported on the financial statements. The conceptual
aspect of the case allowed me to understand how and why interest tax expense may differ

127
from income taxes payable, along with defining key terminology. The process aspect
required creating journal entries to record these aforementioned deferred income taxes
amounts and to locate amounts on the statements. Overall, the case study and FASB ASC
740 enriched my knowledge of deferred income taxes.
128
II. Concepts
A. Describe what is meant by the term book income? Which number in
ZAGG’s statement of operation captures this notion for fiscal 2012?
Describe how a company’s book income differs from its taxable
income.
i. Book income is really just the pre-tax income reported on the
financial statements of a taxable entity in accordance with U.S.
GAAP. This amount is basically all of a company’s revenues less
their expenses, before taxes. It differs from the taxable income
because of the accounting standards (GAAP). On Zagg’s
Statement of Operations, this number can be found on the line item
“Income before provision for income taxes” which is $23,898
million in 2012. The company’s book income differs from its
taxable income due to the differing standards set forth by the IRS
and U.S. GAAP for reporting income.
B. In your own words, define the following terms:
i. Permanent tax differences (also provide an example)
129
1. Permanent differences are transactions that are reported
differently for financial and tax purposes. They are
disallowed on a company’s tax return, and the difference
will never be eliminated. One major example includes
municipal bond interest, which is reported as income for
financial reporting purposes but in not recognized as
taxable income. The IRS has a desire for companies to
invest in government entities, so these bonds are not taxed.
ii. Temporary tax differences (also provide an example)
1. Temporary tax differences, on the other hand, are timing
differences arising from events where revenues or expenses
are recognized in one period for taxes but a different period
for financial reporting purposes. This means that the
recognition of said revenues or expenses differs between
book and tax purposes. These differences reverses over
time, which is why they are “temporary.” One major
example includes prepaid rent income. For tax purposes,
this amount is taxable in the period received, but under
accrual accounting, this amount should not be recognized
until it is earned, which will occur in future periods.
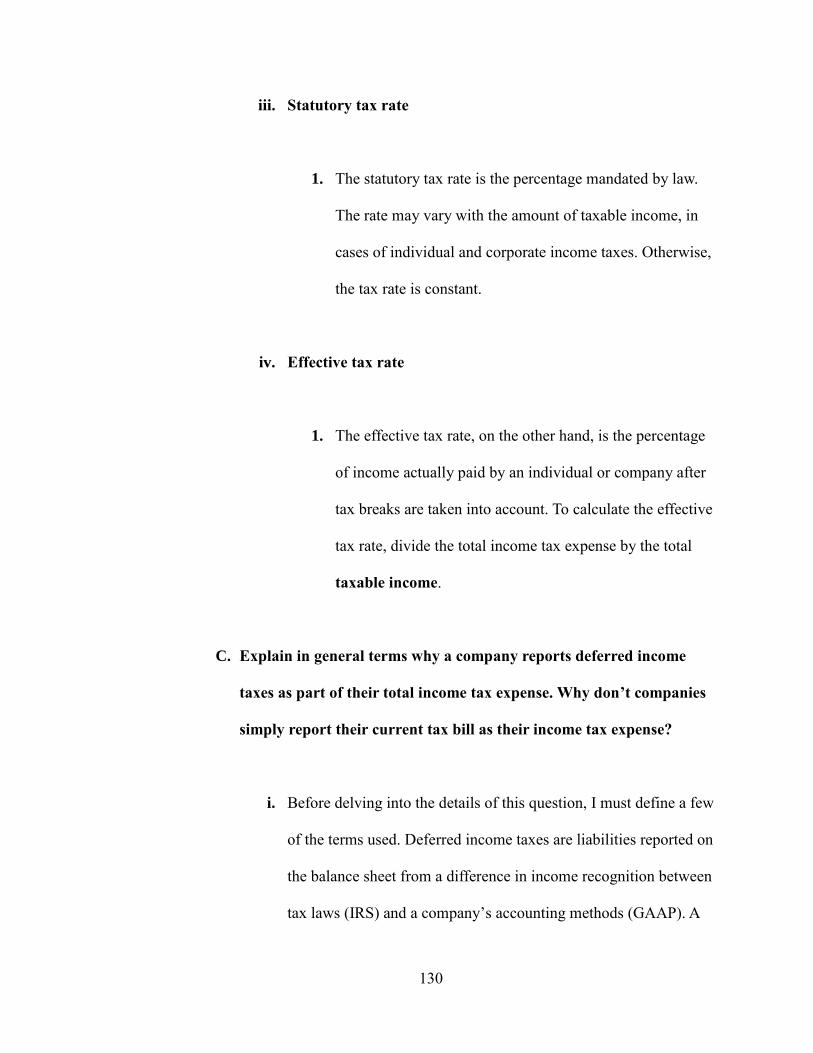
130
iii. Statutory tax rate
1. The statutory tax rate is the percentage mandated by law.
The rate may vary with the amount of taxable income, in
cases of individual and corporate income taxes. Otherwise,
the tax rate is constant.
iv. Effective tax rate
1. The effective tax rate, on the other hand, is the percentage
of income actually paid by an individual or company after
tax breaks are taken into account. To calculate the effective
tax rate, divide the total income tax expense by the total
taxable income.
C. Explain in general terms why a company reports deferred income
taxes as part of their total income tax expense. Why don’t companies
simply report their current tax bill as their income tax expense?
i. Before delving into the details of this question, I must define a few
of the terms used. Deferred income taxes are liabilities reported on
the balance sheet from a difference in income recognition between
tax laws (IRS) and a company’s accounting methods (GAAP). A
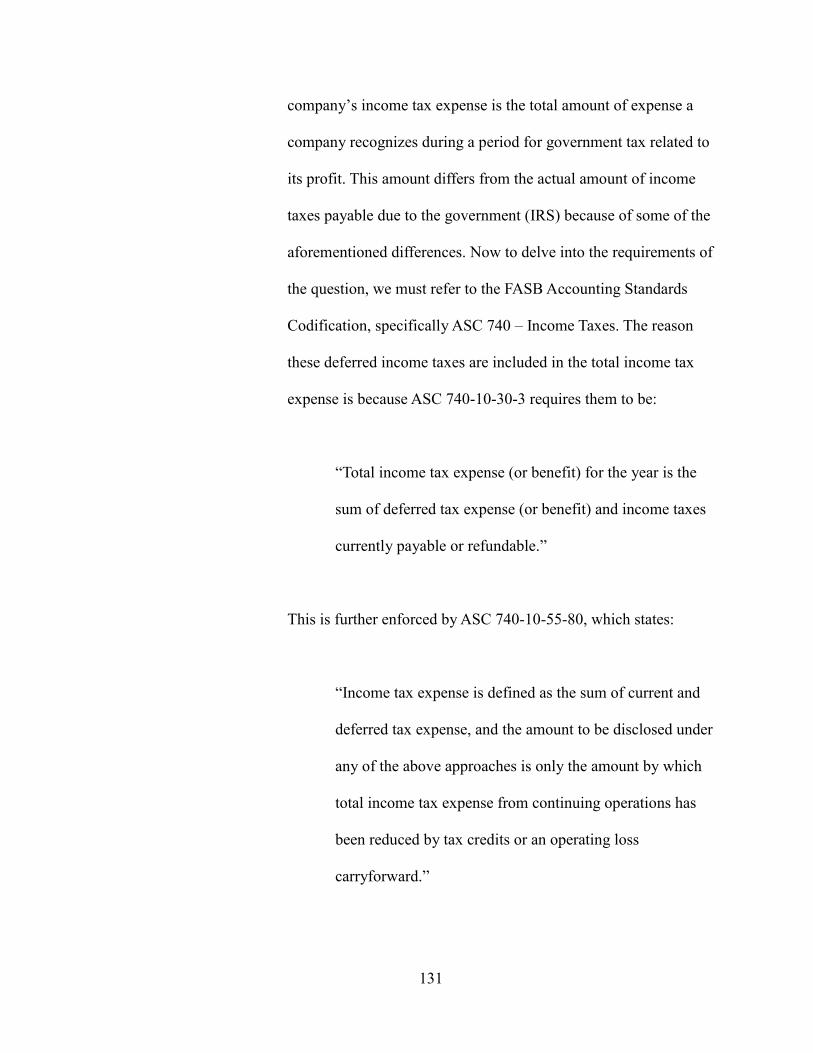
131
company’s income tax expense is the total amount of expense a
company recognizes during a period for government tax related to
its profit. This amount differs from the actual amount of income
taxes payable due to the government (IRS) because of some of the
aforementioned differences. Now to delve into the requirements of
the question, we must refer to the FASB Accounting Standards
Codification, specifically ASC 740 – Income Taxes. The reason
these deferred income taxes are included in the total income tax
expense is because ASC 740-10-30-3 requires them to be:
“Total income tax expense (or benefit) for the year is the
sum of deferred tax expense (or benefit) and income taxes
currently payable or refundable.”
This is further enforced by ASC 740-10-55-80, which states:
“Income tax expense is defined as the sum of current and
deferred tax expense, and the amount to be disclosed under
any of the above approaches is only the amount by which
total income tax expense from continuing operations has
been reduced by tax credits or an operating loss
carryforward.”
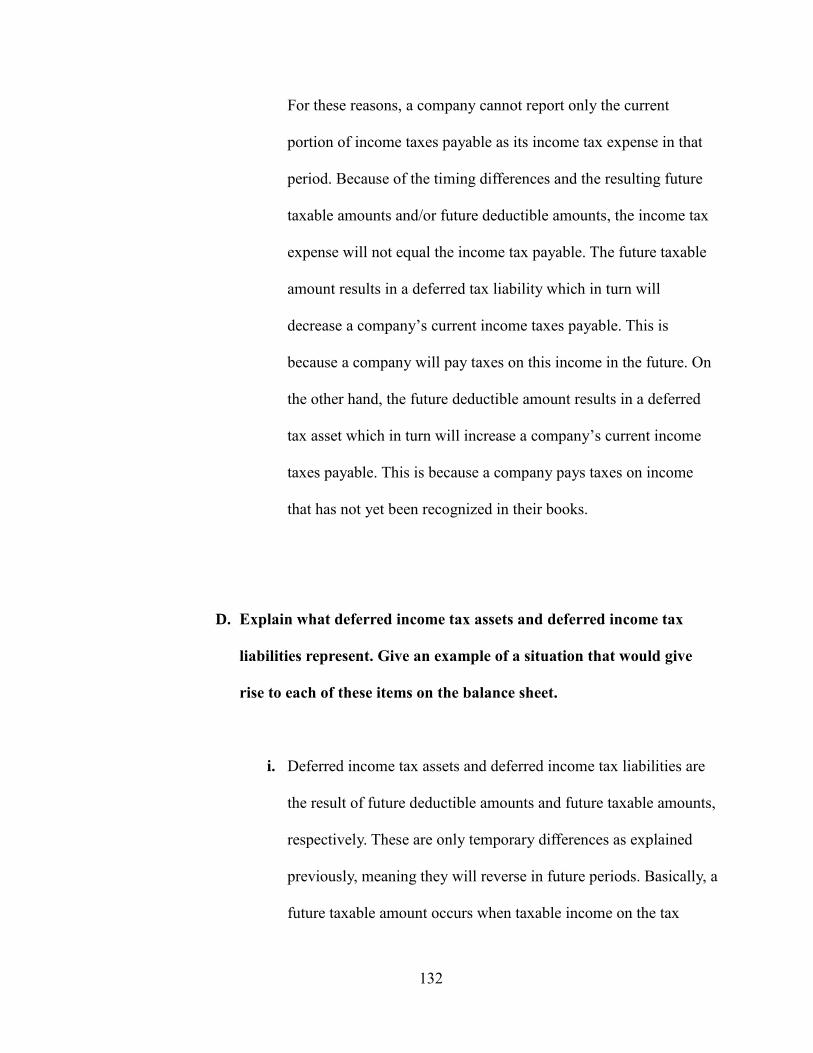
132
For these reasons, a company cannot report only the current
portion of income taxes payable as its income tax expense in that
period. Because of the timing differences and the resulting future
taxable amounts and/or future deductible amounts, the income tax
expense will not equal the income tax payable. The future taxable
amount results in a deferred tax liability which in turn will
decrease a company’s current income taxes payable. This is
because a company will pay taxes on this income in the future. On
the other hand, the future deductible amount results in a deferred
tax asset which in turn will increase a company’s current income
taxes payable. This is because a company pays taxes on income
that has not yet been recognized in their books.
D. Explain what deferred income tax assets and deferred income tax
liabilities represent. Give an example of a situation that would give
rise to each of these items on the balance sheet.
i. Deferred income tax assets and deferred income tax liabilities are
the result of future deductible amounts and future taxable amounts,
respectively. These are only temporary differences as explained
previously, meaning they will reverse in future periods. Basically, a
future taxable amount occurs when taxable income on the tax
133
return is less than pretax financial income on the income statement.
A deferred income tax liability decreases a company’s current
portion of income taxes payable because taxes will be paid on this
income in future periods. The most prevalent reason for this
difference is the use of different depreciation methods for financial
reporting and tax purposes.
On the other hand, a future deductible amount occurs when taxable
income on the tax return is greater than pretax financial income on
the income statement. A deferred income tax asset increases a
company’s current portion on income taxes payable because taxes
are paid in advance on income that has not yet been recognized.
These taxes will be returned to the company in the form of a tax
relief. A common form of a deferred tax asset is when a company
has a loss carryover. A loss carryover simply occurs when a
company incurs a loss in one year and is able to use that loss to
reduce taxable income in future years. As such, this loss can be
utilized as an asset. Both deferred tax liabilities and deferred tax
assets are calculated by multiplying the respective cumulative
temporary differences by the enacted tax rate.
Furthermore, the FASB’s Accounting Standards Codification
provides more definition and details to the meaning and
134
representation of deferred tax assets and liabilities. For example,
ASC 740-10-05-7 states:
“Deferred tax assets and liabilities represent the future
effects on income taxes that result from temporary
differences and carryforwards that exist at the end of a
period. Deferred tax assets and liabilities are measured
using enacted tax rates and provisions of the enacted tax
law and are not discounted to reflect the time-value of
money.
This section reinforces the explanation given previously and adds
additional information such as how the DTA’s and DTL’s are not
discounted to present value to reflect the time-value of money.
E. Explain what a deferred income tax valuation allowance is and when
it should be recorded.
i. A deferred income tax valuation allowance account is a balance
sheet item that reduces the value of a company’s deferred tax
assets. This valuation account will only apply to deferred tax assets
and not deferred tax liabilities because of conservative accounting.
The valuation account should be recorded when there is more than
a 50% probability that a company will not realize a portion of the

135
asset. This account is especially needed if a company normally
allows carryforwards to expire unused or if they expect future
losses.
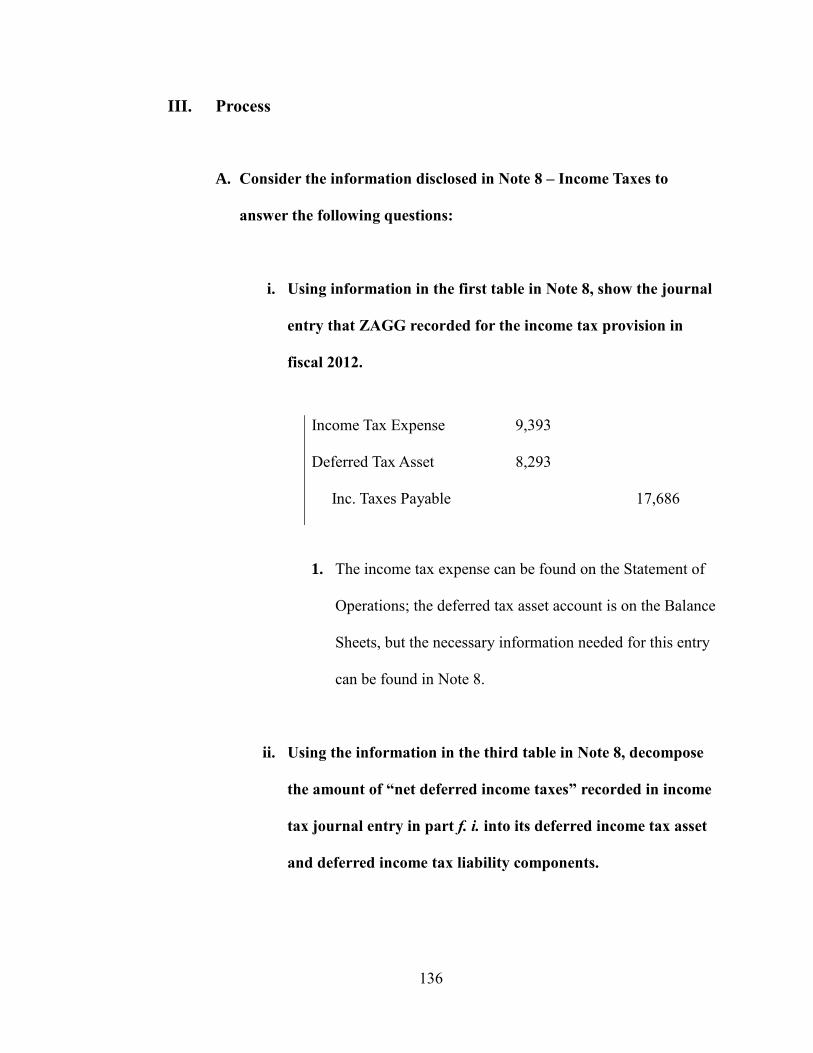
136
III. Process
A. Consider the information disclosed in Note 8 – Income Taxes to
answer the following questions:
i. Using information in the first table in Note 8, show the journal
entry that ZAGG recorded for the income tax provision in
fiscal 2012.
1. The income tax expense can be found on the Statement of
Operations; the deferred tax asset account is on the Balance
Sheets, but the necessary information needed for this entry
can be found in Note 8.
ii. Using the information in the third table in Note 8, decompose
the amount of “net deferred income taxes” recorded in income
tax journal entry in part f. i. into its deferred income tax asset
and deferred income tax liability components.
Income Tax Expense
Deferred Tax Asset
Inc. Taxes Payable
9,393
8,293
17,686
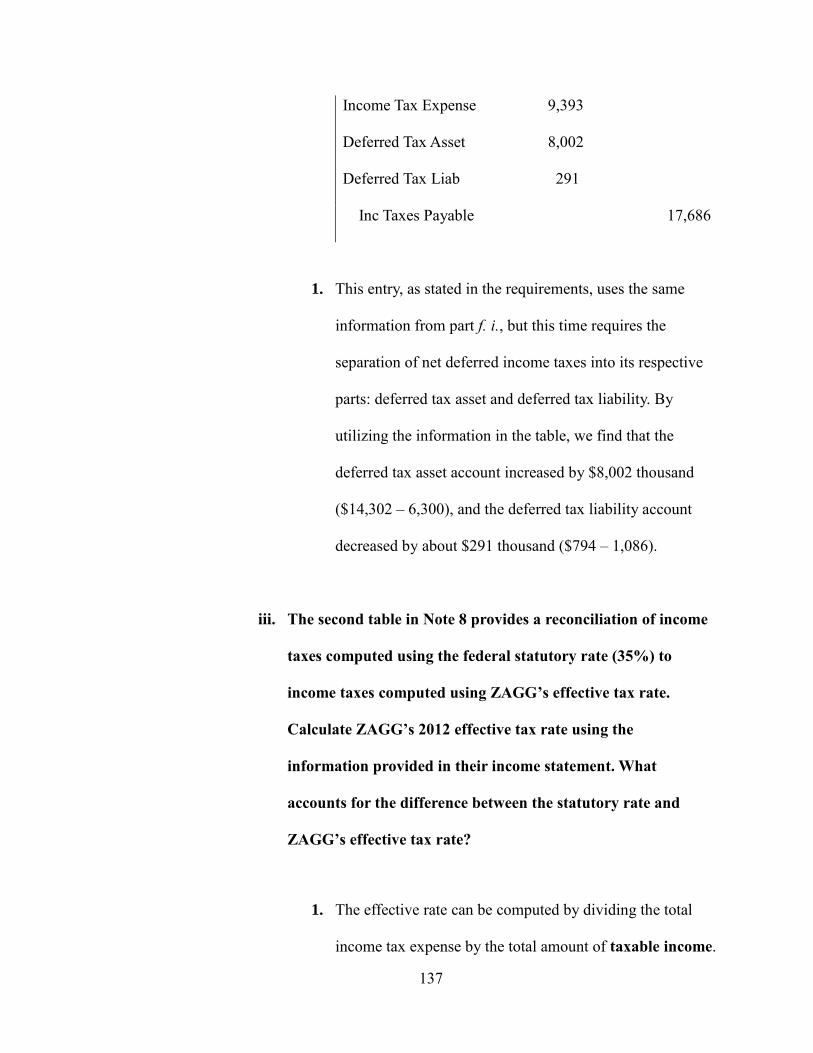
137
Income Tax Expense
Deferred Tax Asset
Deferred Tax Liab
9,393
8,002
291
Inc Taxes Payable 17,686
1. This entry, as stated in the requirements, uses the same
information from part f. i., but this time requires the
separation of net deferred income taxes into its respective
parts: deferred tax asset and deferred tax liability. By
utilizing the information in the table, we find that the
deferred tax asset account increased by $8,002 thousand
($14,302 – 6,300), and the deferred tax liability account
decreased by about $291 thousand ($794 – 1,086).
iii. The second table in Note 8 provides a reconciliation of income
taxes computed using the federal statutory rate (35%) to
income taxes computed using ZAGG’s effective tax rate.
Calculate ZAGG’s 2012 effective tax rate using the
information provided in their income statement. What
accounts for the difference between the statutory rate and
ZAGG’s effective tax rate?
1. The effective rate can be computed by dividing the total
income tax expense by the total amount of taxable income.
138
The effective tax rate should be lower than the statutory
rate because of various tax breaks. For this reason, I believe
that rather than dividing the income tax expense by the
pretax financial income, we must find ZAGG’s taxable
income. A company’s taxable income can be found from
pretax financial income and deferred tax assets (DTA) and
liabilities (DTL). By adding the net DTA’s to the pretax
financial income, we find that ZAGG’s taxable income is
$37,406 ($23,898 + 13,508 = $37,406). We add the net
DTA’s because these are the result of future deductible
amounts, meaning ZAGG’s currently has to pay taxes on
these even though they are not reported in financial income.
By dividing the total income tax expense by the total
taxable income, we find the effective tax rate to be 25.11%
(9,393/37,406 = .251109). The difference arises from
various deductions and credits, like the deferred tax assets.
iv. According to the third table in Note 8 – Income Taxes, ZAGG
had a net deferred income tax asset balance of $13,508,000 at
December 31, 2012. Explain where this amount appears on
ZAGG’s balance sheet.
139
1. The total net amount of deferred tax assets is calculated by
deducting deferred tax liabilities from deferred tax assets.
By scanning over the balance sheet, you might find that this
number is not apparently on it; however, by taking the sum
of the current deferred income tax assets and the long-term
deferred income tax assets, you will arrive at $13,508
thousand ($6,912 + 6,596 = $13,508).
140
Case Study 11: Apple Inc.
Revenue Recognition
May 2, 2018
141
I. Executive Summary
In this scenario, we dive into the “fruit company.” Apple Inc., a name known world-
wide, designs, manufacturers, and markets personal computers, smartphones, and
portable music and video players. In addition to their physical products, the company also
sells a variety of software, services, peripherals, and networking solutions. Apple utilizes
various distribution channels in order to deliver its products and services including retail
stores, online stores, a direct sales force, and third-party wholesalers and resellers. As a
U.S.-based company, Apple Inc. reports its financial statements in accordance with U.S.
GAAP. They have released their financial statements as well as footnote excerpts for the
fiscal year ended December 31, 2010, in this case study. Also included on their financial
statements are prior year amounts, specifically 2008 and 2009, for comparability. The
main purpose of this case focuses on the recognition and reporting of revenue. Apple Inc.
recognizes revenue in different ways depending on the products or services and details of
the contract with the customer. In addition to the case, I was required to refer to the
FASB’s Accounting Standards Codification, specifically ASC 606 – Revenues from
Contracts with Customers, to answer a few of the given questions.
This case study has expanded my knowledge of revenue recognition in certain
areas, as well as further enforcing my understanding of the concepts behind general
revenue recognition. By utilizing the FASB’s Accounting Standards Codification (ASC),
I was able to obtain information directly from the source, so to speak. As a detail-oriented
individual, I enjoy seeing how specific the FASB details each situation. The conceptual
aspect of the case furthered my understanding of revenue recognition and how

142
companies, like Apple Inc., follow these criteria. The process aspect dove deeper into
Apple’s revenue recognition for specific products and situations. Overall, the case study
and FASB ASC 606 enriched my knowledge of revenue recognition.
143
II. Concepts
A. In your own words, define “revenues.” Explain how revenues are
different from “gains.”
i. Revenues can simply be defined as earnings from the sales of good
or services to customers. These earnings usually arise from the
ordinary day-to-day operations of a company. Revenues do not
necessarily mean an inflow of cash however, because companies
can recognize them before receiving cash (explained later). Gains,
on the other hand, arise from activities other than the main
operations of a company such as selling long-term assets or
investments. The main difference here is whether the actual
gain/asset arises from normal operations or peripheral operations.
B. Describe what it means for a business to “recognize” revenues. What
specific accounts and financial statements are affected by the process of
revenue recognition? Describe revenue recognition based on the new
revenue recognition standard from the FASB’s ASC 606.
i. When companies recognize revenue, they are recording a certain
amount of revenue that has been “earned” in that reporting period
for their financial statements. The FASB’s Accounting Standards
144
Codification (ASC) 606 describes the process of revenue
recognition in more detail. ASC 606-10-05-4 states:
“An entity recognizes revenue in accordance with that core
principle by applying the following steps:
Step 1: Identify the contract(s) with a customer…
Step 2: Identify the performance obligations in the
contract…
Step 3: Determine the transaction price…
Step 4: Allocate the transaction price to the performance
obligations in the contract…
Step 5: Recognize revenue when (or as) the entity satisfies
a performance obligation…”
The section describes each step in further detail but these are the
general steps to recognize revenue. Furthermore, revenue
recognition affects several different accounts ranging from any
revenue account (sales revenue for example) to cash and
receivables (accounts receivable for example). These accounts
affect different financial statements like the income statement and
balance sheet, respectively. After flowing into net income, the
revenues then affect retained earnings, which in turn, affect the
statement of retained earnings.
145
C. Refer to the Revenue Recognition discussion in Note 1. In general, when
does Apple recognize revenue? Explain Apple’s four revenue
recognition criteria. Do they appear to be aligned with the revenue
recognition criteria you described in part b, above?
i. According to Apple’s most recent 10-K, the company recognizes
revenue when “persuasive evidence of an arrangement exists,
delivery has occurred, the sales price is fixed or determinable, and
collection is probable.” For online sales, however, Apple defers the
revenue until the product has been received by the customer
because the company retains risk on the loss during transit.
Basically, Apple’s revenue recognition steps are as follows:
Step 1: Identify evidence of an arrangement with customer.
Step 2: Ensure delivery of goods or services.
Step 3: Determine if sales price is fixed or at least
determinable.
Step 4: Determine if collection is probable.
As far as the comparison between the FASB’s revenue recognition
criteria and Apple’s criteria, they have a few similarities like the
evidence of an arrangement/contract and ensuring certain
146
performance obligations are met. Apple’s steps actually resemble
FASB’s ASC 605 (985-Software) rather than FASB’s ASC 606.
D. What are multiple-element contracts and why do they pose revenue
recognition problems for companies?
i. A multiple-element contract is essentially a contract or
arrangement between a vendor and a customer that contains
multiple deliverables. A main example of this is a company like
Apple (cell service or software companies) where contracts may
include deliverables such as a smartphone and software necessary
for the functionality of the device and service to said phone. These
types of contracts pose difficulties in relation to revenue
recognition because the deliverables could be over time or on a
certain date, and companies must determine how to recognize the
revenue between the deliverables. Guidance on the nature of this
issue can be found in the FASB’s ASC 985-605-25, for software
companies like Apple. In Note 1, Apple explains how they account
for revenue with these types of arrangements, and their methods
line up with those found in the aforementioned standard
(essentially allocation based on individual selling prices).
E. In general, what incentives do managers have to make self-serving
revenue recognition choices?
147
i. An issue found in virtually every corporation is the riskiness of
managerial decisions. Only companies that have a separation
between the owners (shareholders) and the managers inherit this
risk, such as Apple. There is different types of situations that give
rise to the risk, but for this case, I will solely focus on the revenue
aspect. When a company performs well and generates more
revenue, the managers are usually given the credit and are given
bonuses or rewards such as promotions or raises. This relationship
may influence managers to make poor decisions or to adjust
revenues to obtain greater bonuses in the current period at the
expense of the company’s future. Managers have the incentive to
recognize revenues that shouldn’t be recognized yet in order to
benefit themselves.
148
III. Process
A. Refer to Apple’s revenue recognition footnote. In particular, when does
the company recognize revenue for the following types of sales?
i. iTunes songs sold online.
1. Apple recognizes these revenues in accordance with
general revenue recognition accounting guidance. This
means that these revenues are accounted for with the
aforementioned steps from the FASB Accounting Standards
Codification. According to ASC 606-10-25-23:
“An entity shall recognize revenue when (or as) the
entity satisfies a performance obligation by
transferring a promised good or service (that is, an
asset) to a customer. An asset is transferred when
(or as) the customer obtains control of that asset.”
Once the online purchase has been processed, the song is
delivered to the customer almost instantly, so the
performance obligation can be seen as being met.
149
ii. Mac-branded accessories such as headphones, power adaptors,
and backpacks sold in the Apple stores. What if the accessories
are sold online?
1. Apple recognizes these revenues the same way as the
previous example (iTunes songs sold online), unless the
items are sold in a bundle upon purchase such as an iPhone,
charger, and headphone bundle. The company uses the
aforementioned steps in order to recognize these revenues
or a hierarchy to determine the selling price to allocate
revenues, respectively. However, if these accessories are
sold online and thus shipped to the customer, Apple defers
the revenue because the company retains a certain amount
of risk of loss on these sales during transit. Once the
customer receives the items, Apple will recognize the
revenue from the sale. According to ASC 606-10-55-82:
“An entity should determine when it has satisfied its
performance obligation to transfer a product by
evaluating when a customer obtains control of that
product (see paragraph 606-10-25-30). For some
contracts, control is transferred either when the
product is delivered to the customer’s site or when
150
the product is shipped, depending on the terms of
the contract (including delivery and shipping
terms).”
In order to recognize revenue, the company must complete
the performance obligation by transferring the good or
service (control) to the customer.
iii. iPods sold to third-party reseller in India.
1. The revenues from the sale of iPods can be recognized once
the products have been shipped and received by the
resellers in India, depending on the shipping terms. This
example directly relates to the previous citation of ASC
606-10-55-82 because the control of the product (iPods)
must be transferred to the customer/customer site.
iv. Revenue from gift cards
1. Apple recognizes revenues on gift card sales when
customers actually redeem them. The company defers
revenue from the purchase of the gift cards until
151
redemption by the customer. This correlates with ASC 606-
10-55-46, which states:
“In accordance with paragraph 606-10-45-2, upon
receipt of a prepayment from a customer, an entity
should recognize a contract liability in the amount
of the prepayment for its performance obligation to
transfer, or to stand ready to transfer, goods or
services in the future. An entity should derecognize
that contract liability (and recognize revenue)
when it transfers those goods or services and,
therefore, satisfies its performance obligation.”

152