Embed Size (px)
Citation preview
Application of a Pulsation Attenuation Network (PAN Filter) at a Flow Meter Station
________________________________________________________________________________________
2016 GMRC Gas Machinery Conference – Denver, CO – October 3‐5, 2016 _________________________________________________________________________________________________
W. Norm Shade, PE & John J. Bazaar, ACI Services, Inc. Glen F. Chatfield & Dale Wells, OPTIMUM Pumping Technology
Martin Maculo, Jack Phillips & Noah Dixon, Williams ABSTRACT GMRC research programs have explored PANTM technology and several papers have reported progress over the past decade. This led to Williams’ consideration of applying a pulsation attenuation network, called a PANTM Filter, to solve a problem at one of its meter stations. Previously, the meter station had included an existing pulsation bottle with an internal choke tube that was significantly undersize for current and future flow requirements. This caused excessive pressure losses between an upstream compressor station and the meter station, necessitating replacement of the existing pulsation bottle. The end user’s requirements for flow measurement accuracy, maximizing flow, and minimizing pressure losses and cost led to the selection and installation of a PAN Filter for pulsation control at the meter station in October 2015. A compressor station, located upstream of the meter station, operates fifteen slow‐speed reciprocating and three centrifugal compressors in various combinations that can create a wide range of pulsation frequencies in the line approaching the meter station. To characterize the pulsations, field measurements were taken immediately upstream of the flow meter station with various combinations of compressor speeds, unloading, flow rates, and number of units operating in parallel. Analytical simulations were then used to develop an optimized 4‐loop PAN Filter. After design, construction, and installation, dynamic pressure pulsations, static pressure drops in the PAN loops, and compliance with AGA‐3 %SRE specifications at one of the meter runs were measured at the station. The results of the field testing confirmed advantages over a bypassed condition with minimal pressure losses. This paper describes the design, analytical simulations, field testing, and results of the successful meter station PAN Filter system. INTRODUCTION Every company involved in the natural gas industry must deal with the issue of determining lost and unaccounted for natural gas (UAF). The Federal Energy Regulatory Commission Order 636, released in 1993, requires all pipeline companies to manage UAF. Lost and unaccounted for natural gas, particularly at pipeline custody transfer points, has become a focal point for both buyers and sellers. Large differences in gas flow between custody transfer points can lead to penalties due to accounting imbalances. One relatively large source of UAF natural gas is due to pulsation at metering stations1. This pulsation is caused by compressors, flow control valves, regulators and some piping configurations. In recent years, the Gas Machinery Research Council (GMRC) has funded various research projects to improve the accuracy of flow measurement. In summary, research shows that pulsation can create unacceptable levels of Square Root Error (%SRE) and that pulsation at the orifice meter is a major source of UAF, which can create large economic gain or loss for both the buyers and sellers along natural gas pipeline systems14. It follows that pulsation must be attenuated to very low levels to achieve the required level of orifice meter accuracy.
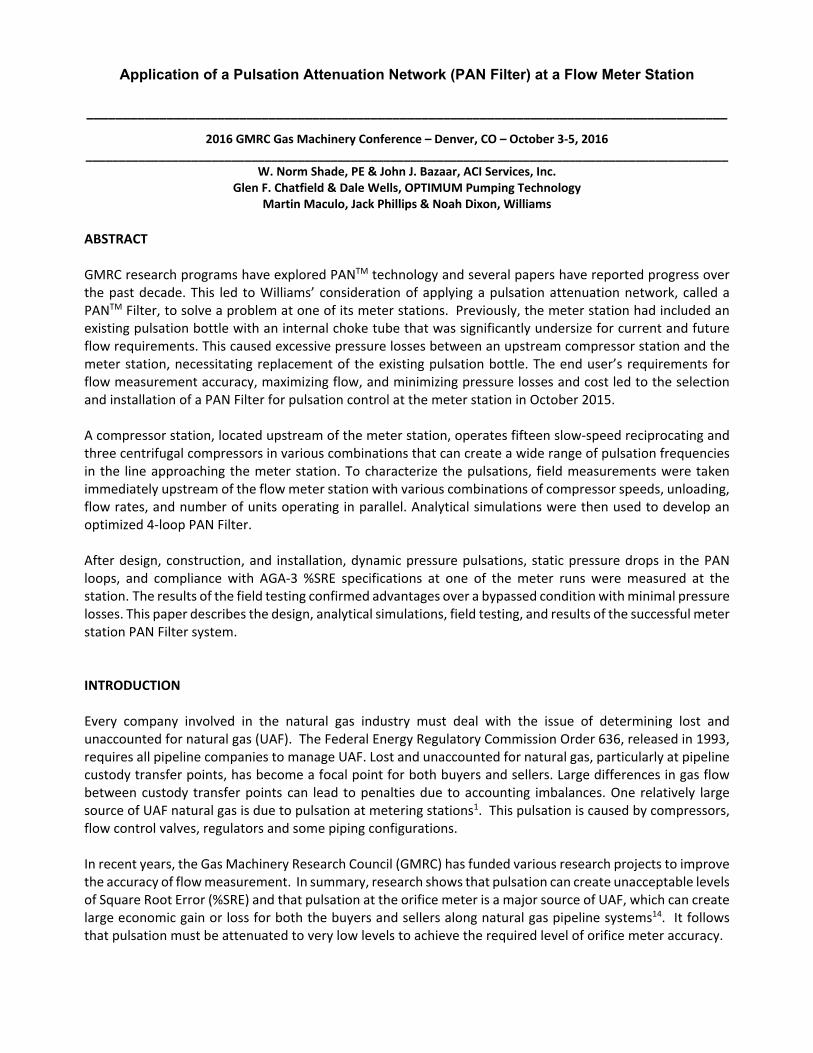
Traditionally, pulsation attenuation has been accomplished with pulsation control bottles which contain baffles that separate volumes with choke tubes, sometimes assisted by orifice plates. All of these elements are designed to dissipate pulsation energy with friction, and all of these elements waste compression horsepower. Inefficiency increases operating costs and reduces profits. So, reducing pulsation at metering stations with pulsation bottles can create significant, on‐going indirect costs. Sometimes the pressure loss can be so high that the seller may struggle to meet the buyer’s current and future needs. PROJECT BACKGROUND An existing Williams flow metering facility, shown in Figure 1, included three orifice meters and an upstream pulsation control bottle that was installed in 1968. The existing volume‐choke‐volume pulsation control bottle was approximately 33 ft. long with 12 in. 600 lb. flanges on either end. The internal choke tube diameter was 5.75 in. The meter station is supplied by a 12 in. diameter header that operated at pressures between 450 and 800 psig. After many years of system expansion, at high flow conditions, pressure losses through the bottle exceeded 200 psig, which required extra compression horsepower and fuel use. But most importantly, it limited the system’s ability to meet downstream customer peak flow
Figure 1: Williams Meter Station
requirements, which were over the station limit of 240 MMSCFD due to the high pulsation bottle losses. The meter station is located approximately two miles downstream of a compressor station that has fifteen large Cooper‐Bessemer integral engine compressors that run at speeds from 235 to 250 rpm, a Solar Centaur driven centrifugal compressor that runs at 10,000 to 15,500 rpm, and two motor driven centrifugal compressors that run from 5,800 to 7,300 rpm. The reciprocating compressors have clearance pockets and unloaders, which makes for a very large number of equipment combinations and load settings that can be operated simultaneously. One of Williams’ requirements was to bring the pressure drop down to an acceptable level, while keeping pulsations at the flow meters within the limits specified in AGA Report No. 3, Orifice Metering of Natural Gas and Other Related Hydrocarbon Fluids, Part 3, Natural Gas Applications, Part 2, Specification and Installation Requirements, Section 2.6.42. The feed to the metering station would be increased to a 16 in. diameter header, with flow ranging from 12 to 315 MMSCFD. A design pressure rating of 860 psig was specified, with normal operating pressures ranging from 550 to 710 psig, and with the potential for 450 to 800 psig. The design pressure drop of the pulsation control system was specified to be less than 15 psi at 315 MMSCFD and less than 10 psi at 245 MMSCFD for any pressure condition. Williams investigated several alternatives to achieve these requirements, which included upgrading the station with ultrasonic flow meters, a replacement pulsation bottle upstream of the meter station, and a PAN Filter. The ultrasonic flow meters were cost prohibitive, requiring a substantial capital investment to upgrade the entire meter station. An adequately sized volume‐choke‐volume system would involve a very large bottle
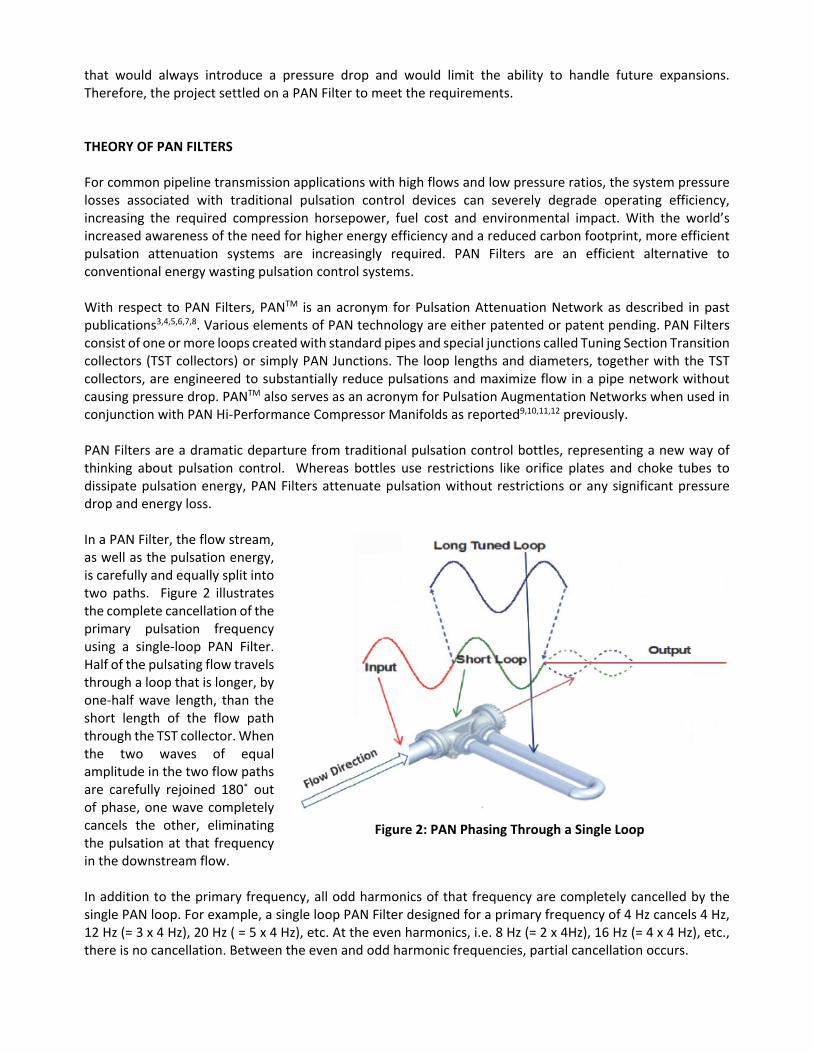
that would always introduce a pressure drop and would limit the ability to handle future expansions. Therefore, the project settled on a PAN Filter to meet the requirements. THEORY OF PAN FILTERS For common pipeline transmission applications with high flows and low pressure ratios, the system pressure losses associated with traditional pulsation control devices can severely degrade operating efficiency, increasing the required compression horsepower, fuel cost and environmental impact. With the world’s increased awareness of the need for higher energy efficiency and a reduced carbon footprint, more efficient pulsation attenuation systems are increasingly required. PAN Filters are an efficient alternative to conventional energy wasting pulsation control systems. With respect to PAN Filters, PANTM is an acronym for Pulsation Attenuation Network as described in past publications3,4,5,6,7,8. Various elements of PAN technology are either patented or patent pending. PAN Filters consist of one or more loops created with standard pipes and special junctions called Tuning Section Transition collectors (TST collectors) or simply PAN Junctions. The loop lengths and diameters, together with the TST collectors, are engineered to substantially reduce pulsations and maximize flow in a pipe network without causing pressure drop. PANTM also serves as an acronym for Pulsation Augmentation Networks when used in conjunction with PAN Hi‐Performance Compressor Manifolds as reported9,10,11,12 previously. PAN Filters are a dramatic departure from traditional pulsation control bottles, representing a new way of thinking about pulsation control. Whereas bottles use restrictions like orifice plates and choke tubes to dissipate pulsation energy, PAN Filters attenuate pulsation without restrictions or any significant pressure drop and energy loss. In a PAN Filter, the flow stream, as well as the pulsation energy, is carefully and equally split into two paths. Figure 2 illustrates the complete cancellation of the primary pulsation frequency using a single‐loop PAN Filter. Half of the pulsating flow travels through a loop that is longer, by one‐half wave length, than the short length of the flow path through the TST collector. When the two waves of equal amplitude in the two flow paths are carefully rejoined 180˚ out of phase, one wave completely cancels the other, eliminating the pulsation at that frequency in the downstream flow.
Figure 2: PAN Phasing Through a Single Loop
In addition to the primary frequency, all odd harmonics of that frequency are completely cancelled by the single PAN loop. For example, a single loop PAN Filter designed for a primary frequency of 4 Hz cancels 4 Hz, 12 Hz (= 3 x 4 Hz), 20 Hz ( = 5 x 4 Hz), etc. At the even harmonics, i.e. 8 Hz (= 2 x 4Hz), 16 Hz (= 4 x 4 Hz), etc., there is no cancellation. Between the even and odd harmonic frequencies, partial cancellation occurs.

Additional loops can be added in series to produce broad bands of pulsation attenuation that fill in the cancellation gaps between the odd and even orders of the primary frequency. Two or more loops may be necessary for applications with variable speed compressors, varying gas compositions and temperatures, varying flow velocities, and flow streams with complex pulsation signatures. The graph in Figure 3 shows the broad band of pulsation cancellation that can be achieved with a 4‐Loop PAN Filter, which was the design that is the subject of this paper. These loops were designed to cancel 4, 8, 16, and 32 Hz. The PAN Filter completely cancels pulsations at frequencies of 4 Hz and all 14 harmonics of 4 Hz up to 60 Hz (i.e., 15 x 4 Hz). In addition, it is notable that all frequencies from 11 Hz to 53 Hz are attenuated by more than 90%, and a minimum of 78% cancellation extends over an even broader range from about 3 Hz to 61 Hz.
Figure 3: % Pulsation Attenuation (Cancellation) of the 4‐Loop PAN
The patent‐pending TST collectors or PAN junctions, an example cross‐section of which is shown in Figure 4, are the key elements that enable the PAN Filter to efficiently cancel pulsations. The internal flow paths are aerodynamically designed to avoid flow separation and turbulence that would cause pressure drop. Internal geometry splits the incoming flow stream into two equal paths and then rejoins the two streams without deceleration, acceleration, or section changes that would cause pressure wave reflections that could change and interfere with the pulsation cancellation. Simple pipe tees are not adequate or effective for pulsation cancellation systems. The TST collectors are designed using 3‐D CAD models, fully analyzed with finite element stress analysis, cast from ASTM A395
Figure 4: TST Collectors or PAN Junctions
ductile iron material (the same as commonly used in compressor cylinders), machined for connection to standard pipe flanges and mounting pads, hydrostatically tested at 150% of design MAWP, serialized, nameplated, and painted.
While the pressure losses of conventional bottles and pulsation damping orifice plates can be significant, as much as 25% of line pressure in extreme cases that have been documented13, pressure losses in PAN Filter systems are nearly zero, even in the highest transmission line flow cases.
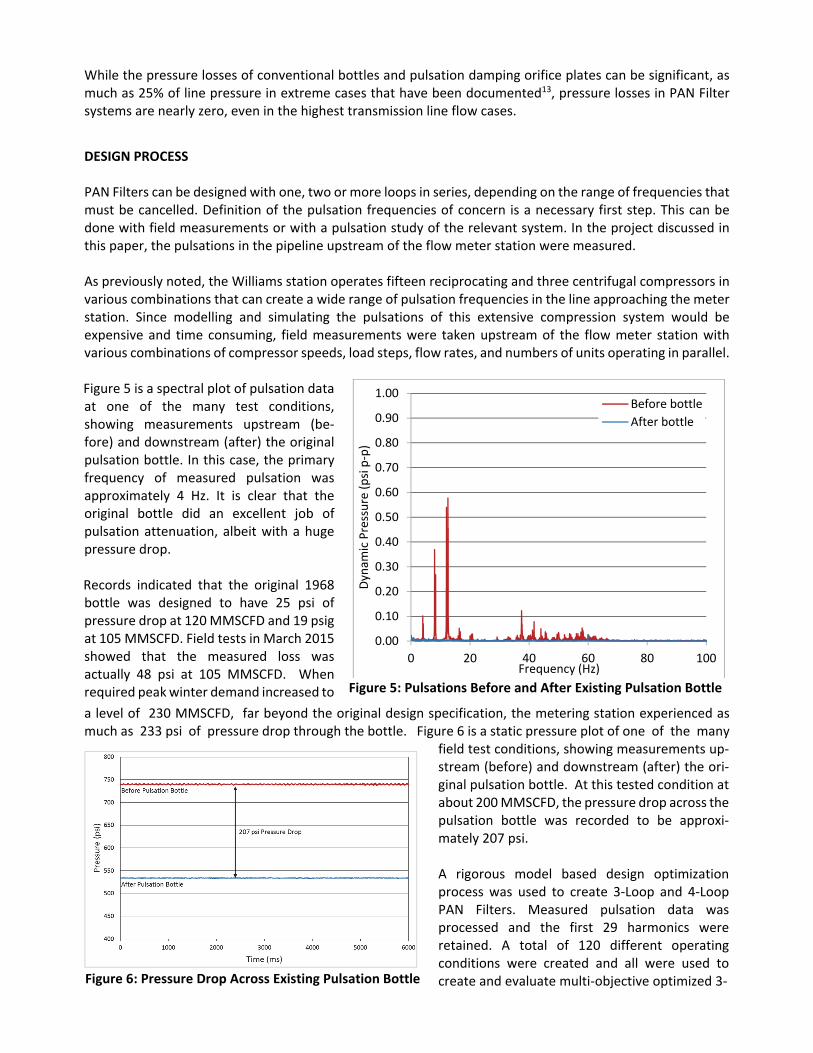
DESIGN PROCESS PAN Filters can be designed with one, two or more loops in series, depending on the range of frequencies that must be cancelled. Definition of the pulsation frequencies of concern is a necessary first step. This can be done with field measurements or with a pulsation study of the relevant system. In the project discussed in this paper, the pulsations in the pipeline upstream of the flow meter station were measured. As previously noted, the Williams station operates fifteen reciprocating and three centrifugal compressors in various combinations that can create a wide range of pulsation frequencies in the line approaching the meter station. Since modelling and simulating the pulsations of this extensive compression system would be expensive and time consuming, field measurements were taken upstream of the flow meter station with various combinations of compressor speeds, load steps, flow rates, and numbers of units operating in parallel. Figure 5 is a spectral plot of pulsation data at one of the many test conditions, showing measurements upstream (be‐fore) and downstream (after) the original pulsation bottle. In this case, the primary frequency of measured pulsation was approximately 4 Hz. It is clear that the original bottle did an excellent job of pulsation attenuation, albeit with a huge pressure drop. Records indicated that the original 1968 bottle was designed to have 25 psi of pressure drop at 120 MMSCFD and 19 psig at 105 MMSCFD. Field tests in March 2015 showed that the measured loss was actually 48 psi at 105 MMSCFD. When required peak winter demand increased to
Figure 5: Pulsations Before and After Existing Pulsation Bottle
a level of 230 MMSCFD, far beyond the original design specification, the metering station experienced as much as 233 psi of pressure drop through the bottle. Figure 6 is a static pressure plot of one of the many
Figure 6: Pressure Drop Across Existing Pulsation Bottle
field test conditions, showing measurements up‐stream (before) and downstream (after) the ori‐ginal pulsation bottle. At this tested condition at about 200 MMSCFD, the pressure drop across the pulsation bottle was recorded to be approxi‐mately 207 psi. A rigorous model based design optimization process was used to create 3‐Loop and 4‐Loop PAN Filters. Measured pulsation data was processed and the first 29 harmonics were retained. A total of 120 different operating conditions were created and all were used to create and evaluate multi‐objective optimized 3‐
0.00
0.10
0.20
0.30
0.40
0.50
0.60
0.70
0.80
0.90
1.00
0 20 40 60 80 100
Dynam
ic Pressure (psi p‐p)
Frequency (Hz)
Before bottle
After bottle
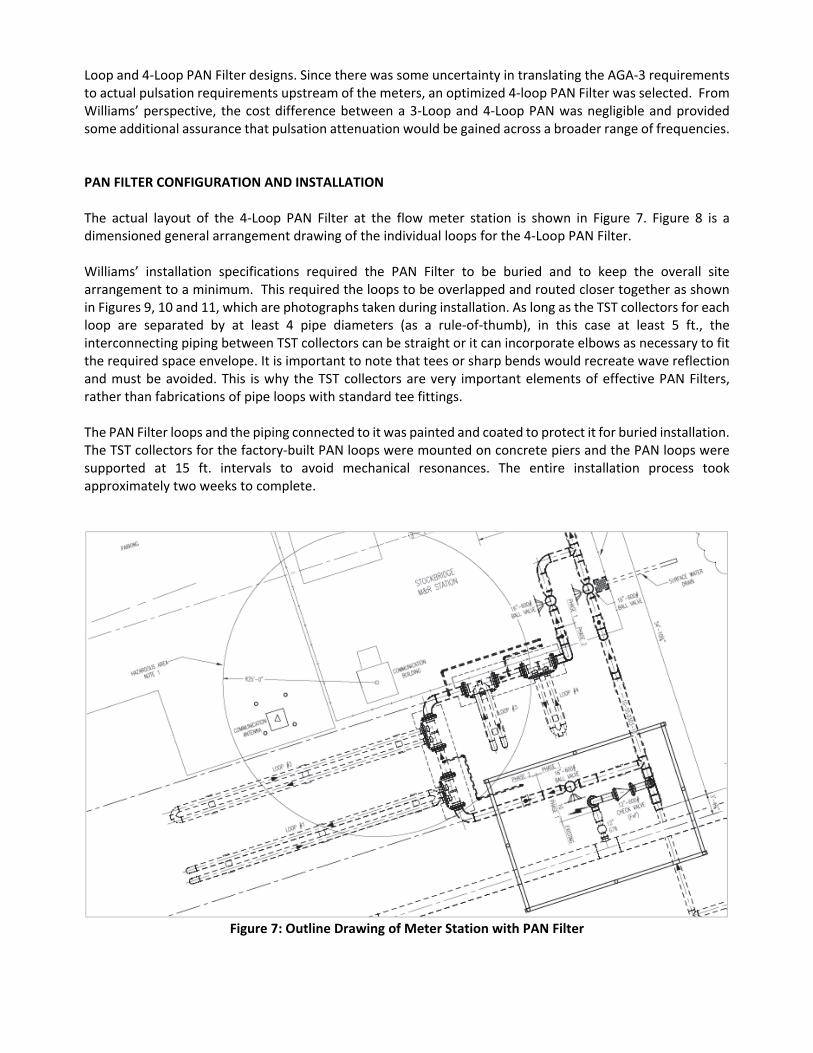
Loop and 4‐Loop PAN Filter designs. Since there was some uncertainty in translating the AGA‐3 requirements to actual pulsation requirements upstream of the meters, an optimized 4‐loop PAN Filter was selected. From Williams’ perspective, the cost difference between a 3‐Loop and 4‐Loop PAN was negligible and provided some additional assurance that pulsation attenuation would be gained across a broader range of frequencies. PAN FILTER CONFIGURATION AND INSTALLATION The actual layout of the 4‐Loop PAN Filter at the flow meter station is shown in Figure 7. Figure 8 is a dimensioned general arrangement drawing of the individual loops for the 4‐Loop PAN Filter. Williams’ installation specifications required the PAN Filter to be buried and to keep the overall site arrangement to a minimum. This required the loops to be overlapped and routed closer together as shown in Figures 9, 10 and 11, which are photographs taken during installation. As long as the TST collectors for each loop are separated by at least 4 pipe diameters (as a rule‐of‐thumb), in this case at least 5 ft., the interconnecting piping between TST collectors can be straight or it can incorporate elbows as necessary to fit the required space envelope. It is important to note that tees or sharp bends would recreate wave reflection and must be avoided. This is why the TST collectors are very important elements of effective PAN Filters, rather than fabrications of pipe loops with standard tee fittings. The PAN Filter loops and the piping connected to it was painted and coated to protect it for buried installation. The TST collectors for the factory‐built PAN loops were mounted on concrete piers and the PAN loops were supported at 15 ft. intervals to avoid mechanical resonances. The entire installation process took approximately two weeks to complete.
Figure 7: Outline Drawing of Meter Station with PAN Filter

Figure 8: General Arrangement Drawing of 4‐Loop PAN Filter
Figure 9: Overall View of 4‐Loop PAN Filter as Installed Upstream of Flow Meter Station

Figure 10: Close‐Up of First [right] and Second [left]
PAN Filter Loops as Installed Figure 11: Close‐Up of Third [rear] and Fourth [front]
PAN Filter Loops as Installed FIELD TEST RESULTS & DISCUSSION After design, construction, and installation it was necessary to perform validation testing of the PAN by measuring dynamic pressure pulsations, static pressure losses in the PAN loops, and compliance with AGA‐3 RMS and %SRE specifications at one of the meter runs.
Figure 12: Diagram Showing Bypass Valves and Locations of Measurement Taps
The AGA‐3 standard for orifice meter flow measurement (ref. 2) limits the maximum allowable pulsation level to 10% root mean square (RMS) variation in the ΔP. RMS is a statistical measure of the magnitude of the variation in the ΔP, which corresponds to a maximum permissible %SRE (square root averaging error) of approximately 0.125% of reading. Validation of the PAN Filter was designed into the project scope and included some additional valves that would otherwise not be required. Two valves were installed, one upstream of the first TST collector and one downstream of the last TST collector in order to block‐in the PAN Filter and bypass it entirely. The diagram in Figure 12 shows the “Bypass Valve” locations. Test results with the bypass open are noted as the “bypassed configuration”. In order to test the PAN Filter, the two Bypass Valves were opened and the Ball Valve in the header was closed in order to force the gas through the PAN Filter. These test results are noted as the “PAN” configuration. This assured measurements could be made for both configurations (Bypassed and PAN) to validate the effectiveness of the PAN Filter. For each configuration, dynamic and static pressure measurements were taken at six taps. As shown in Figure 12, Taps 2, 3 and 4 were installed between adjacent TST collectors, Tap 1 one was installed upstream of the first TST collector, Tap 5 was after the final TST collector, and Tap 6 was located on the meter station header. To verify compliance with AGA‐3 %SRE specifications, a differential pressure (DP) transducer was installed at Meter 1. Meter runs 2 and 3 are setup with automatic valves, and a manual valve is installed on Meter 1. In normal operation, Meter 1 is always left open and the other two meter runs open up automatically as station flows approach 100 MMSCFD (Meter 2 opens) and 200 MMSCFD (Meter 3 opens). This limits any single meter measurement to ~100 MMSCFD. Therefore, the focus of measuring AGA‐3 %SRE and dynamic pressure is more important between flows of 10 MMSCFD and 100 MMSCFD while overall DP across the entire PAN filter is important for flows over 100 MMSCFD. Additionally, station flows are typically less than 100 MMSCFD approximately 85% of the time throughout the year. This further emphasizes the importance of minimizing measurement error at the lower flows, as it can have a dramatic effect on UAF gas. The test conditions involved various flows and combinations of units operating for the two configurations (PAN and Bypassed). These conditions are summarized below:
Flows of approximately 20, 100, 240 and 315+ MMSCFD
Minimum reciprocating compressor speed, maximum speed, various intermediate speeds, various units on/off, centrifugal compressor on/off, and various compressor load step conditions
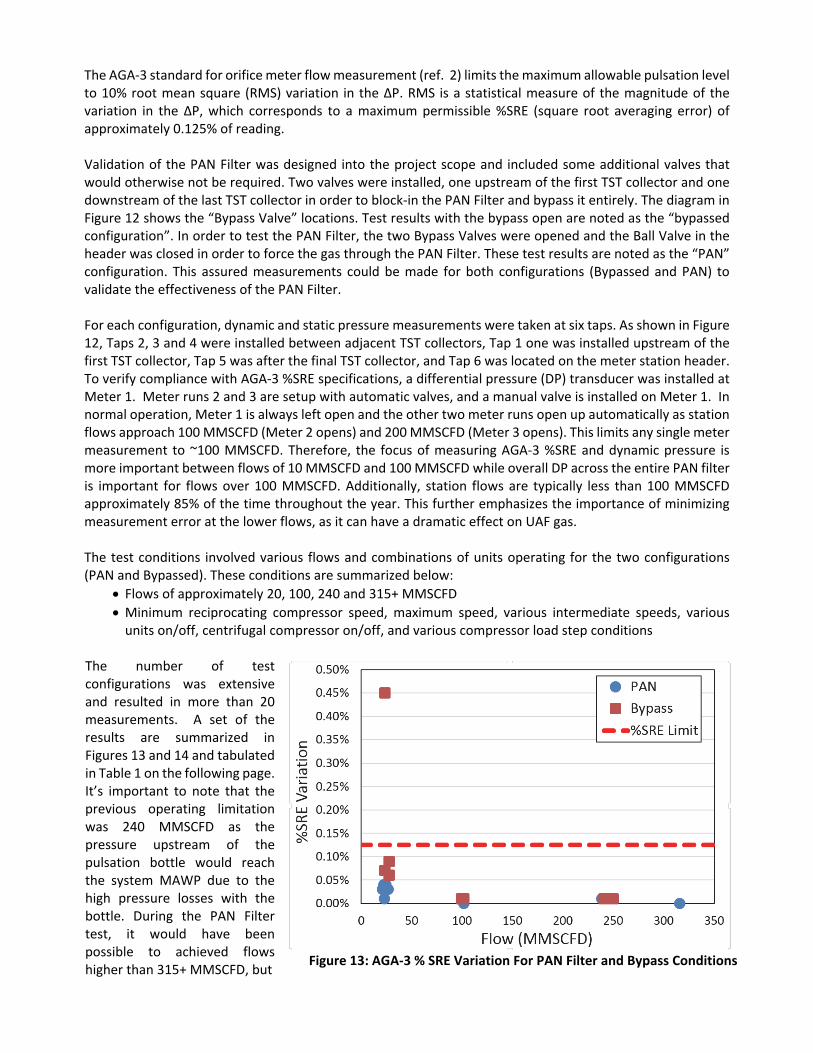
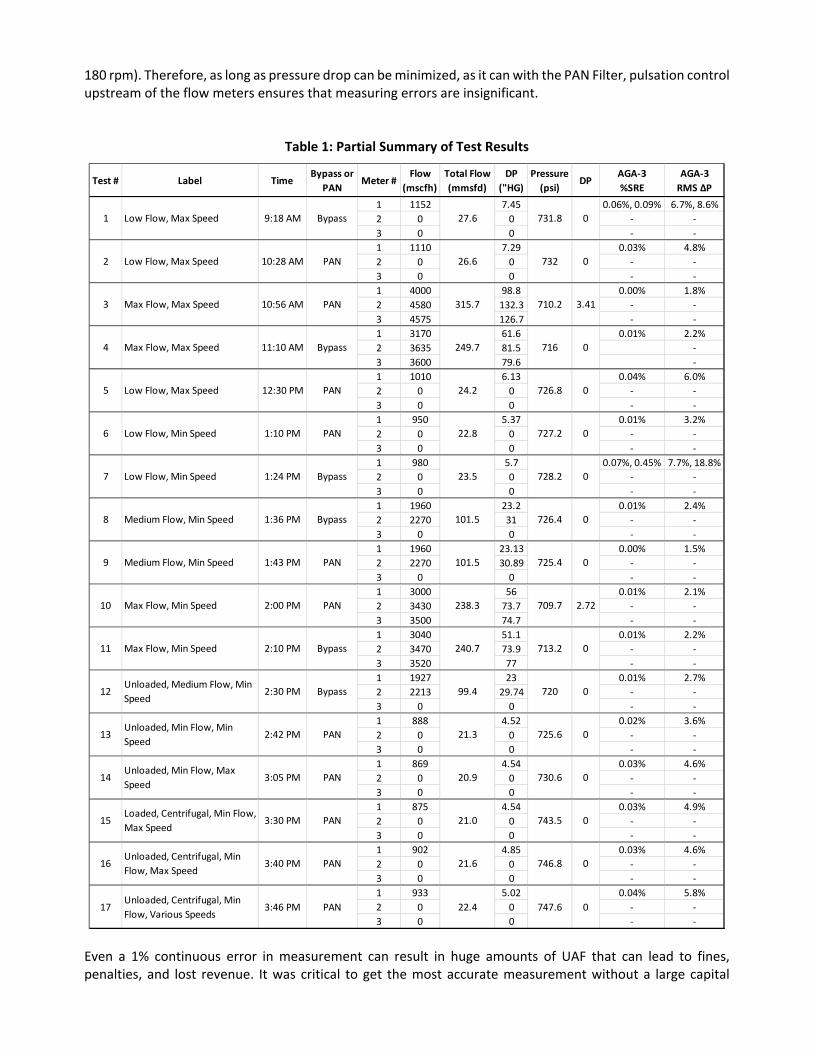
The number of test configurations was extensive and resulted in more than 20 measurements. A set of the results are summarized in Figures 13 and 14 and tabulated in Table 1 on the following page. It’s important to note that the previous operating limitation was 240 MMSCFD as the pressure upstream of the pulsation bottle would reach the system MAWP due to the high pressure losses with the bottle. During the PAN Filter test, it would have been possible to achieved flows higher than 315+ MMSCFD, but
Figure 13: AGA‐3 % SRE Variation For PAN Filter and Bypass Conditions
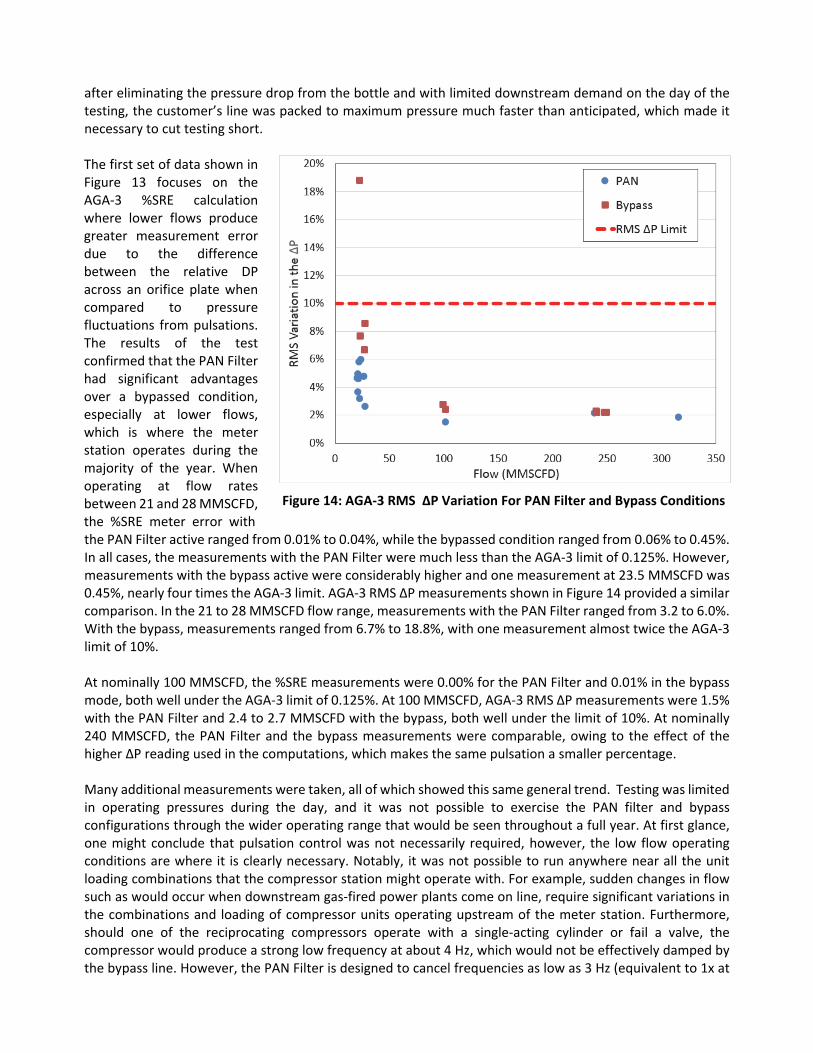
after eliminating the pressure drop from the bottle and with limited downstream demand on the day of the testing, the customer’s line was packed to maximum pressure much faster than anticipated, which made it necessary to cut testing short. The first set of data shown in Figure 13 focuses on the AGA‐3 %SRE calculation where lower flows produce greater measurement error due to the difference between the relative DP across an orifice plate when compared to pressure fluctuations from pulsations. The results of the test confirmed that the PAN Filter had significant advantages over a bypassed condition, especially at lower flows, which is where the meter station operates during the majority of the year. When operating at flow rates between 21 and 28 MMSCFD, the %SRE meter error with
Figure 14: AGA‐3 RMS ΔP Variation For PAN Filter and Bypass Conditions
the PAN Filter active ranged from 0.01% to 0.04%, while the bypassed condition ranged from 0.06% to 0.45%. In all cases, the measurements with the PAN Filter were much less than the AGA‐3 limit of 0.125%. However, measurements with the bypass active were considerably higher and one measurement at 23.5 MMSCFD was 0.45%, nearly four times the AGA‐3 limit. AGA‐3 RMS ΔP measurements shown in Figure 14 provided a similar comparison. In the 21 to 28 MMSCFD flow range, measurements with the PAN Filter ranged from 3.2 to 6.0%. With the bypass, measurements ranged from 6.7% to 18.8%, with one measurement almost twice the AGA‐3 limit of 10%. At nominally 100 MMSCFD, the %SRE measurements were 0.00% for the PAN Filter and 0.01% in the bypass mode, both well under the AGA‐3 limit of 0.125%. At 100 MMSCFD, AGA‐3 RMS ΔP measurements were 1.5% with the PAN Filter and 2.4 to 2.7 MMSCFD with the bypass, both well under the limit of 10%. At nominally 240 MMSCFD, the PAN Filter and the bypass measurements were comparable, owing to the effect of the higher ΔP reading used in the computations, which makes the same pulsation a smaller percentage. Many additional measurements were taken, all of which showed this same general trend. Testing was limited in operating pressures during the day, and it was not possible to exercise the PAN filter and bypass configurations through the wider operating range that would be seen throughout a full year. At first glance, one might conclude that pulsation control was not necessarily required, however, the low flow operating conditions are where it is clearly necessary. Notably, it was not possible to run anywhere near all the unit loading combinations that the compressor station might operate with. For example, sudden changes in flow such as would occur when downstream gas‐fired power plants come on line, require significant variations in the combinations and loading of compressor units operating upstream of the meter station. Furthermore, should one of the reciprocating compressors operate with a single‐acting cylinder or fail a valve, the compressor would produce a strong low frequency at about 4 Hz, which would not be effectively damped by the bypass line. However, the PAN Filter is designed to cancel frequencies as low as 3 Hz (equivalent to 1x at
180 rpm). Therefore, as long as pressure drop can be minimized, as it can with the PAN Filter, pulsation control upstream of the flow meters ensures that measuring errors are insignificant.
Table 1: Partial Summary of Test Results
Even a 1% continuous error in measurement can result in huge amounts of UAF that can lead to fines, penalties, and lost revenue. It was critical to get the most accurate measurement without a large capital
Test # Label TimeBypass or
PANMeter #
Flow
(mscfh)
Total Flow
(mmsfd)
DP
("HG)
Pressure
(psi)DP
AGA‐3
%SRE
AGA‐3
RMS ΔP
1 1152 7.45 0.06%, 0.09% 6.7%, 8.6%
2 0 0 ‐ ‐
3 0 0 ‐ ‐
1 1110 7.29 0.03% 4.8%
2 0 0 ‐ ‐
3 0 0 ‐ ‐
1 4000 98.8 0.00% 1.8%
2 4580 132.3 ‐ ‐
3 4575 126.7 ‐ ‐
1 3170 61.6 0.01% 2.2%
2 3635 81.5 ‐
3 3600 79.6 ‐
1 1010 6.13 0.04% 6.0%
2 0 0 ‐ ‐
3 0 0 ‐ ‐
1 950 5.37 0.01% 3.2%
2 0 0 ‐ ‐
3 0 0 ‐ ‐
1 980 5.7 0.07%, 0.45% 7.7%, 18.8%
2 0 0 ‐ ‐
3 0 0 ‐ ‐
1 1960 23.2 0.01% 2.4%
2 2270 31 ‐ ‐
3 0 0 ‐ ‐
1 1960 23.13 0.00% 1.5%
2 2270 30.89 ‐ ‐
3 0 0 ‐ ‐
1 3000 56 0.01% 2.1%
2 3430 73.7 ‐ ‐
3 3500 74.7 ‐ ‐
1 3040 51.1 0.01% 2.2%
2 3470 73.9 ‐ ‐
3 3520 77 ‐ ‐
1 1927 23 0.01% 2.7%
2 2213 29.74 ‐ ‐
3 0 0 ‐ ‐
1 888 4.52 0.02% 3.6%
2 0 0 ‐ ‐
3 0 0 ‐ ‐
1 869 4.54 0.03% 4.6%
2 0 0 ‐ ‐
3 0 0 ‐ ‐
1 875 4.54 0.03% 4.9%
2 0 0 ‐ ‐
3 0 0 ‐ ‐
1 902 4.85 0.03% 4.6%
2 0 0 ‐ ‐
3 0 0 ‐ ‐
1 933 5.02 0.04% 5.8%
2 0 0 ‐ ‐
3 0 0 ‐ ‐
730.6
743.5
746.8
747.6
9 Medium Flow, Min Speed 1:43 PM PAN 101.5 725.4
16Unloaded, Centrifugal, Min
Flow, Max Speed3:40 PM PAN 21.6
17Unloaded, Centrifugal, Min
Flow, Various Speeds3:46 PM PAN 22.4
14Unloaded, Min Flow, Max
Speed3:05 PM PAN
728.2
726.4
709.7
713.2
720
725.6
731.8
732
710.2
716
726.8
727.2
11 Max Flow, Min Speed 2:10 PM Bypass 240.7
20.9
15Loaded, Centrifugal, Min Flow,
Max Speed3:30 PM PAN 21.0
12Unloaded, Medium Flow, Min
Speed2:30 PM Bypass 99.4
13Unloaded, Min Flow, Min
Speed2:42 PM PAN 21.3
23.5
8 Medium Flow, Min Speed 1:36 PM Bypass 101.5
10 Max Flow, Min Speed 2:00 PM PAN 238.3
7 Low Flow, Min Speed 1:24 PM Bypass
1:10 PM PAN
27.6
26.6
315.7
249.7
24.2
22.8
5 Low Flow, Max Speed 12:30 PM PAN
6 Low Flow, Min Speed
3 Max Flow, Max Speed 10:56 AM PAN
4 Max Flow, Max Speed 11:10 AM Bypass
1 Low Flow, Max Speed 0
0
3.41
0
9:18 AM Bypass
2 Low Flow, Max Speed 10:28 AM PAN
0
0
0
0
0
0
0
0
0
2.72
0
0
0

investment to modify the existing meter station. For instance, assuming an arbitrary transmission cost of $500/MMSCF, a 1 % measurement error at 30 MMSCFD represents $54,750 per year. At 100 MMSCFD, a 1% error represents $182,250 per year. The previously installed pulsation bottle caused an excessive waste of compression horsepower due to pressure drops across it. Measurements across all four PAN Filter loops showed negligible pressure losses of 3.4 psi (0.5% of line pressure) at 315 MMSCFD and 2.7 psi (0.4% of line pressure) at 238 MMSCFD, between Taps 1 and 5. These are well under the project specifications of 15 and 10 psi, respectively. Pressure losses at 100 MMSCFD and 30 MMSCFD were well within the error limits of the measurement devices. This was a major improvement over the losses that were measured from the original pulsation bottle (233 psi ΔP at 240 MMSCFD). In this particular instance, Williams saw at minimum an increase of at least 75 MMSFCD in maximum deliverable capacity to its customer, just by reducing the static pressure losses upstream of the flow metering station. With an arbitrary transmission charge of $500/MMSCF, this resulted in a minimum of $37,500 per day in new revenue generating capacity when operating at peak flows. For comparison, a new pulsation bottle would be designed to meet API 618 (7.9.4.2.5.3.1) pressure drops which can approach 1% to 2% of line pressure. With station discharge pressures approaching 800 psig, this equates to 8 to 16 psi for a well‐designed pulsation bottle. Not only are these well above the PAN Filter pressure drops, it is unlikely that a single bottle design could provide adequate pulsation control at the low flows without causing excessive pressure drop at high flow conditions. Conversely, a single bottle designed to have low pressure drops at the high flow conditions, would probably not provide adequate pulsation control at the low flow operating conditions. The PAN Filter had very low pressure drop and good pulsation control at both high and low flow conditions as discussed below. For each test condition, dynamic pressure measurements were taken before the PAN Filter, between each loop, and after the PAN Filter at each available tap location. Unfortunately, these taps were long, some in excess of 20 to 30 ft. as a result of the PAN Filter being buried underground. This kind of piping arrangement intro‐duces a quarter wave stub resonance, which will depend on the speed of sound, length of pipe, and compressor pulsations. Attempts were made to identify the quarter wave stub resonance at each Tap by taking data with and without a 2 ft. extension. For some taps, it was successful; however, for other conditions, where there was more broad‐band noise, it was not
Figure 15: Example of PAN Filter Pulsation Cancellation
successful. Nevertheless, across all operating conditions, with the PAN Filter active, the measurements show a consistent reduction in overall pulsation levels. At Tap 6, which is the meter header and is also the closest point to the main‐line pipe (no quarter wave stub resonance), measurements showed very little dynamic pressure pulsation for every PAN Filter test condition, which was consistent with the AGA‐3 %SRE measurement. An example of the dynamic pressure measurement is shown in Figure 15. For the range of flows and tested compressor operating conditions, the dynamic pressure before the PAN Filter ranged from 8.3 to 2.8 psi p‐p (1.1 to 0.4% of line pressure). After the PAN Filter, into the meter, dynamic pressure
Channel Location Average Min Max Pulsation
1 Before PAN 730.2 725.8 734.1 8.3
6 After PAN 724.6 723.7 725.5 1.8
measurements ranged from 1.8 to 0.6 psi p‐p (0.2 to 0.08% of line pressure), an average reduction of about 90%. CONCLUSIONS AND RECOMMENDATIONS Pulsating flow, that is, the periodic variation in flow velocity and pressure, can adversely affect flow measurement devices. Flow meter types vary, and the error mechanism(s) for each can differ. Some, such as the orifice flow meter, are sensitive to ΔP pulsation amplitudes, while others, such as the turbine flow meter, are sensitive to velocity modulation amplitude and frequency content. The most reliable way to avoid flow measurement errors related to pulsating or unsteady flow is to minimize or, preferably, to eliminate pulsations at the flow meter (ref. 13). Unfortunately, pulsations can be generated by a number of pipeline sources including from reciprocating compressors, flow past piping branch connections, and flow stream blockages, such as valves, pressure regulators, and thermowells. Once created, pulsations can be amplified by acoustic responses throughout the piping system. A properly designed acoustic filter has been shown to be a reliable means for attenuating pulsations past the filter, while causing minimal pressure drop. Accordingly, a number of conclusions and recommendations can be made from the design and evaluation of a PAN Filter for controlling pulsations at a flow metering station, as described in this paper. 1. The PAN Filter was very effective in reducing pulsations over the full range of flows from 21 to 316
MMSCFD that was tested. Comparison of pulsation measurements upstream and downstream of the PAN Filter showed an average pulsation reduction of 90%. This was as good, if not better, than the original overly restrictive pulsation bottle that the PAN Filter replaced.
2. Pressure drop across the PAN Filter was only 0.4 to 0.5% of line pressure, which is equivalent to the wall friction loss in the system piping. The actual measured pressure drops were well under the specified requirement. The measured pressure drop of 2.7 psi (at 238 MMSCFD) was 73% less than the specified limit of 10 psi at 245 MMSCFD. The measured pressure drop of 3.4 psi (at 316 MMSCFD) was 77% less than the specified limit of 15 psi at 315 MMSCFD.
3. With the PAN Filter active over the wide range of flows tested, the maximum measured %SRE at the flow
meter was 0.044%, much less than the AGA‐3 limit of 0.125%. The maximum measured root mean square (RMS) variation in the ΔP at the flow meter was less than 6%, also well under the AGA‐3 limit of 10%. Errors above the limit are known to cause flow measurement errors. A flow measurement error of even 1% is unacceptable, as over the life of the meter station, it can represent tens of thousands of dollars in lost revenue.
4. Based on the test results, Williams achieved a minimum increase of at least 75 MMSFCD in deliverable
capacity to its customer, by reducing the static pressure losses upstream of the flow metering station. With an arbitrary transmission charge of $500/MMSCF, this resulted in a minimum of $37,500 per day in new revenue generating capacity at peak flows. In addition, the reduced pressure drop associated with pulsation control at the meter station will result in a significant savings in the required compression horsepower and associated fuel cost, especially at the high flow operating conditions.
5. PAN Filters are recommended for applications where pulsations must be controlled over a wide range of
flows with minimal pressure drop. In addition to the flow meter application presented in this paper, the PAN Filter technology is applicable for reducing pulsations in pipeline headers before and after reciprocating compressors. Based on recent investigations, it also holds promise for eliminating premature surge in centrifugal compressor pipeline boosters exposed to line pulsations.
ACKNOWLEDGEMENTS The authors express their sincere thanks to Williams station management and operations personnel, along with Williams engineering, for their vote of confidence in PAN Filter technology, for their cooperation in the testing and evaluation phases of the project, and for their collaboration in preparation of this technical paper. REFERENCES 1. Parker Hannifin Corporation, Lost & Unaccounted Natural Gas, The Effect and Control of Pulsation in
Natural Gas Measurement, Bulletin PGI‐LUNG 01/2015‐DDP, 2015. 2. American Gas Association and American Petroleum Institute; AGA Report No. 3, Orifice Metering of
Natural Gas and Other Related Hydrocarbon Fluids, Part 3, Natural Gas Applications, 2003. 3. Brahler, C.; Chatfield, G.; Crandall, J; and Shade, W.; An Investigation of the Application of Finite
Amplitude Wave Simulation with a New Technology for Controlling reciprocating Compressor Pulsations, 2007 GMRC Gas Machinery Conference.
4. Chatfield, G.; Crandall, J.; Shade, W.; and Wells, D.; Demonstration of Efficient Compressor Control Using Tuned Loop Networks, 2008 GMRC Gas Machinery Conference.
5. Chatfield, G. and Shade, W.; New Technology for the Efficient Cancellation of Compressor Pulsations, GMC Journal, February 2009.
6. Bazaar, J.; Chatfield, G.; Crandall, J.; Shade, W. and Wells, D.; Efficient Bottle‐Less Compressor Pulsation Control – Experimental Test Results, 2009 GMRC Gas Machinery Conference.
7. Shade, W.; Efficient Bottle‐Less Compressor Pulsation Control, GMC Today, October 2009. 8. Chatfield, G. and Shade, W.; Thinking Outside the Bottle: Attenuate Pulsation and Eliminate 90% of All
Pressure Losses, GM Journal, May 2011. 9. Chatfield, G. and Shade, W.; Thinking Outside the Bottle: The Use of Performance Augmentation
Networks to Increase Compressor Efficiency, 2011 GMRC Gas Machinery Conference. 10. Arjmands, M., Bazaar, J., Chatfield, G., Eberle, K., Schubring, S., Shade, W., and Wells, D., Design and Field
Test of a Full Scale Performance Augmentation Network (PAN), 2014 GMRC Gas Machinery Conference. 11. Gas Machinery Research Council; Final Report Executive Summary, Rev. 3, Reciprocating Compressor
Performance Augmentation Network (PAN) Technology Full‐Scale Field Test Results – Short Course, 2015 GMRC Gas Machinery Conference.
12. Gas Machinery Research Council; Reciprocating Compressor Performance Augmentation Network (PAN) Technology Full‐Scale Field Test Results – Short Course Presentation Slides, 2015 GMRC Gas Machinery Conference.
13. Harris, R. and Raymer, R., The Value ($$) of Compressor Efficiency, 2006 GMC Short Course, Oklahoma City, OK, October 5, 2006.
14. Durke, R.; Bowles, E. and McKee, R., Effects and Control of Pulsation in Gas Measurement, Southwest Research Institute.