Embed Size (px)
Citation preview
lable at ScienceDirect
Journal of Environmental Management 199 (2017) 181e191
Contents lists avai
Journal of Environmental Management
journal homepage: www.elsevier .com/locate/ jenvman
Research article
Application of a life cycle assessment to compare environmentalperformance in coal mine tailings management
Joni Safaat Adiansyah a, c, *, Nawshad Haque b, Michele Rosano a, Wahidul Biswas a
a School of Civil and Mechanical Engineering, Sustainable Engineering Group, Curtin University, Perth, Australiab CSIRO Minerals Resources, Private Bag 10, Clayton South, VIC, 3169, Australiac Department of Mining Engineering, Universitas Muhammadiyah Mataram, West Nusa Tenggara, Indonesia
a r t i c l e i n f o
Article history:Received 18 October 2016Received in revised form1 February 2017Accepted 16 May 2017
Keywords:Life cycle assessmentThickened tailingsTailings pasteBelt filter pressEnvironmental impactsLand use
* Corresponding author. Sustainable Engineering Gogy Park, Bentley, Australia.
E-mail address: [email protected] (J.
http://dx.doi.org/10.1016/j.jenvman.2017.05.0500301-4797/© 2017 Elsevier Ltd. All rights reserved.
a b s t r a c t
This study compares coal mine tailings management strategies using life cycle assessment (LCA) andland-use area metrics methods. Hybrid methods (the Australian indicator set and the ReCiPe method)were used to assess the environmental impacts of tailings management strategies. Several strategieswere considered: belt filter press (OPT 1), tailings paste (OPT 2), thickened tailings (OPT 3), and variationsof OPT 1 using combinations of technology improvement and renewable energy sources (OPT 1AeD).Electrical energy was found to contribute more than 90% of the environmental impacts. The magnitudeof land-use impacts associated with OPT 3 (thickened tailings) were 2.3 and 1.55 times higher than OPT 1(tailings cake) and OPT 2 (tailings paste) respectively, while OPT 1B (tailings belt filter press withtechnology improvement and solar energy) and 1D (tailings belt press filter with technology improve-ment and wind energy) had the lowest ratio of environmental impact to land-use. Further analysis of aneconomic cost model and reuse opportunities is required to aid decision making on sustainable tailingsmanagement and industrial symbiosis.
© 2017 Elsevier Ltd. All rights reserved.
1. Introduction
Coal is utilized in many countries worldwide as a fossil fuel.Globally, the utilization of coal is 3.4 and 3.8 times higher than useof oil and natural gas, respectively (Osborne and Gupta, 2013). Intotal, coal supplied 29% of the world's primary energy in 2013(Thomas, 2013). As illustrated in Table 1, the significant contribu-tion of coal is at least in part due to its widespread geological dis-tribution and to the large reserves, estimated to be around 860billion tonnes.
These numbers indicate that coal-based industries have animportant contribution to make to a country's development, notonly in developed but also in developing countries. In Australia, forexample, more than 64% of electricity generated comes from coal,21.3% from natural gas, 7.2% from hydropower, and 4.4% fromwindpower (World Nuclear Association, 2013). In another example,Indonesia, a developing country, aims to generate 35,000 MW ofelectricity over the next five years, with coal-fired power plants
roup, 6 Sarich Way, Technol-
S. Adiansyah).
contributing 55% of the total power generated (Perusahaan ListrikNegara, 2015). The demand for coal, currently led by the BRIC(Brazil, Russia, India, and China) economies, is predicted byOsborne and Gupta (2013) predicted to increase more than 50%between 2013 and 2030. Coal processing is needed to producesaleable coal to meet market demand, as run-of-mine (ROM) con-tains both coal and gangue mineral impurities. These processes,which include comminution, classification, concentration, anddewatering, take place in a coal handling and preparation plant(CHPP). An inevitable outcome of this processing is the productionof tailings.
Coal tailings, also referred to as fine coal rejects, are producedfrom fine coal processing. The classification of fine coal is based onparticle size in the range 0.15 mme1.0 mm. Fine coal processingrepresents about 10e20% of the CHPP feed (Honaker et al., 2013;Kumar et al., 2014). This fine coal processing generates around30% rejectmaterial, consisting of both coarse rejects and fine rejects(tailings). This means that 0.6e1.2 million tonnes per annum(Mtpa) of tailings are generated by coal mine sites with 20 Mtpa ofROM. Failure to manage tailings effectively can increase miningoperation cost and result in severe environmental damage andhuman health consequences (Adiansyah et al., 2015; Kossoff et al.,
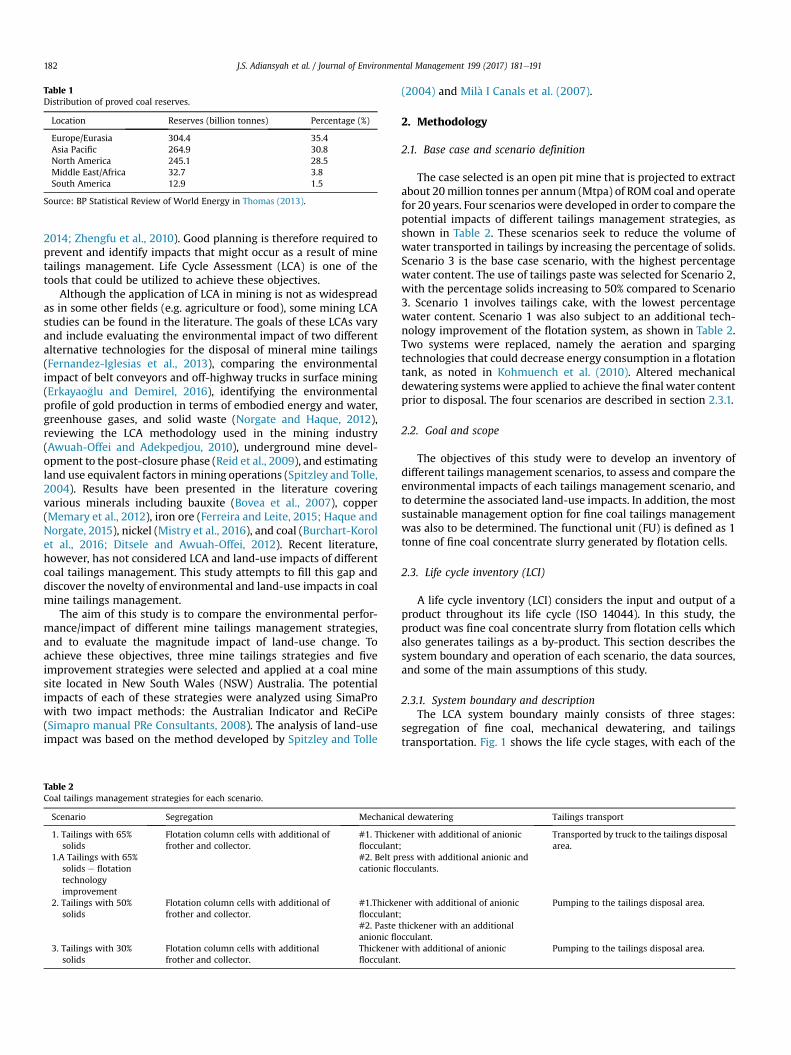
Table 1Distribution of proved coal reserves.
Location Reserves (billion tonnes) Percentage (%)
Europe/Eurasia 304.4 35.4Asia Pacific 264.9 30.8North America 245.1 28.5Middle East/Africa 32.7 3.8South America 12.9 1.5
Source: BP Statistical Review of World Energy in Thomas (2013).
J.S. Adiansyah et al. / Journal of Environmental Management 199 (2017) 181e191182
2014; Zhengfu et al., 2010). Good planning is therefore required toprevent and identify impacts that might occur as a result of minetailings management. Life Cycle Assessment (LCA) is one of thetools that could be utilized to achieve these objectives.
Although the application of LCA in mining is not as widespreadas in some other fields (e.g. agriculture or food), some mining LCAstudies can be found in the literature. The goals of these LCAs varyand include evaluating the environmental impact of two differentalternative technologies for the disposal of mineral mine tailings(Fernandez-Iglesias et al., 2013), comparing the environmentalimpact of belt conveyors and off-highway trucks in surface mining(Erkayao�glu and Demirel, 2016), identifying the environmentalprofile of gold production in terms of embodied energy and water,greenhouse gases, and solid waste (Norgate and Haque, 2012),reviewing the LCA methodology used in the mining industry(Awuah-Offei and Adekpedjou, 2010), underground mine devel-opment to the post-closure phase (Reid et al., 2009), and estimatingland use equivalent factors in mining operations (Spitzley and Tolle,2004). Results have been presented in the literature coveringvarious minerals including bauxite (Bovea et al., 2007), copper(Memary et al., 2012), iron ore (Ferreira and Leite, 2015; Haque andNorgate, 2015), nickel (Mistry et al., 2016), and coal (Burchart-Korolet al., 2016; Ditsele and Awuah-Offei, 2012). Recent literature,however, has not considered LCA and land-use impacts of differentcoal tailings management. This study attempts to fill this gap anddiscover the novelty of environmental and land-use impacts in coalmine tailings management.
The aim of this study is to compare the environmental perfor-mance/impact of different mine tailings management strategies,and to evaluate the magnitude impact of land-use change. Toachieve these objectives, three mine tailings strategies and fiveimprovement strategies were selected and applied at a coal minesite located in New South Wales (NSW) Australia. The potentialimpacts of each of these strategies were analyzed using SimaProwith two impact methods: the Australian Indicator and ReCiPe(Simapro manual PRe Consultants, 2008). The analysis of land-useimpact was based on the method developed by Spitzley and Tolle
Table 2Coal tailings management strategies for each scenario.
Scenario Segregation Mechanic
1. Tailings with 65%solids
Flotation column cells with additional offrother and collector.
#1. Thickeflocculant#2. Belt pcationic fl
1.A Tailings with 65%solids e flotationtechnologyimprovement
2. Tailings with 50%solids
Flotation column cells with additional offrother and collector.
#1.Thickeflocculant#2. Pasteanionic flo
3. Tailings with 30%solids
Flotation column cells with additionalfrother and collector.
Thickenerflocculant
(2004) and Mil�a I Canals et al. (2007).
2. Methodology
2.1. Base case and scenario definition
The case selected is an open pit mine that is projected to extractabout 20million tonnes per annum (Mtpa) of ROM coal and operatefor 20 years. Four scenarios were developed in order to compare thepotential impacts of different tailings management strategies, asshown in Table 2. These scenarios seek to reduce the volume ofwater transported in tailings by increasing the percentage of solids.Scenario 3 is the base case scenario, with the highest percentagewater content. The use of tailings paste was selected for Scenario 2,with the percentage solids increasing to 50% compared to Scenario3. Scenario 1 involves tailings cake, with the lowest percentagewater content. Scenario 1 was also subject to an additional tech-nology improvement of the flotation system, as shown in Table 2.Two systems were replaced, namely the aeration and spargingtechnologies that could decrease energy consumption in a flotationtank, as noted in Kohmuench et al. (2010). Altered mechanicaldewatering systems were applied to achieve the final water contentprior to disposal. The four scenarios are described in section 2.3.1.
2.2. Goal and scope
The objectives of this study were to develop an inventory ofdifferent tailings management scenarios, to assess and compare theenvironmental impacts of each tailings management scenario, andto determine the associated land-use impacts. In addition, the mostsustainable management option for fine coal tailings managementwas also to be determined. The functional unit (FU) is defined as 1tonne of fine coal concentrate slurry generated by flotation cells.
2.3. Life cycle inventory (LCI)
A life cycle inventory (LCI) considers the input and output of aproduct throughout its life cycle (ISO 14044). In this study, theproduct was fine coal concentrate slurry from flotation cells whichalso generates tailings as a by-product. This section describes thesystem boundary and operation of each scenario, the data sources,and some of the main assumptions of this study.
2.3.1. System boundary and descriptionThe LCA system boundary mainly consists of three stages:
segregation of fine coal, mechanical dewatering, and tailingstransportation. Fig. 1 shows the life cycle stages, with each of the
al dewatering Tailings transport
ner with additional of anionic;ress with additional anionic andocculants.
Transported by truck to the tailings disposalarea.
ner with additional of anionic;thickener with an additionalcculant.
Pumping to the tailings disposal area.
with additional of anionic.
Pumping to the tailings disposal area.
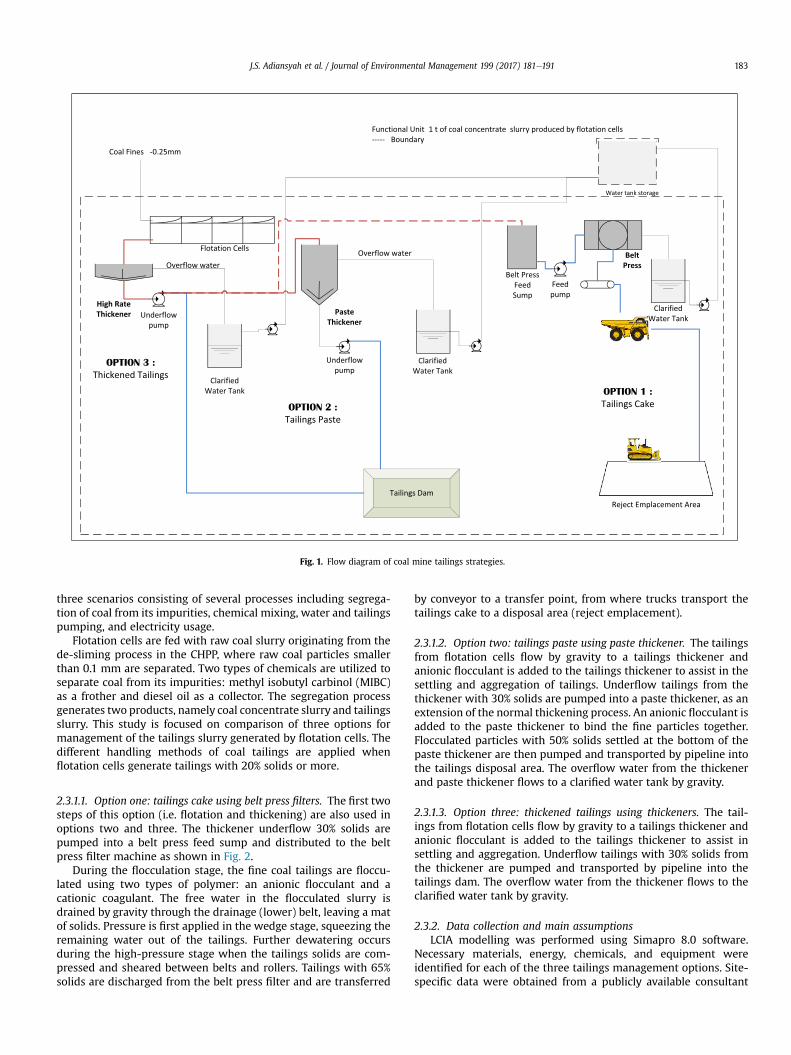
Fig. 1. Flow diagram of coal mine tailings strategies.
J.S. Adiansyah et al. / Journal of Environmental Management 199 (2017) 181e191 183
three scenarios consisting of several processes including segrega-tion of coal from its impurities, chemical mixing, water and tailingspumping, and electricity usage.
Flotation cells are fed with raw coal slurry originating from thede-sliming process in the CHPP, where raw coal particles smallerthan 0.1 mm are separated. Two types of chemicals are utilized toseparate coal from its impurities: methyl isobutyl carbinol (MIBC)as a frother and diesel oil as a collector. The segregation processgenerates two products, namely coal concentrate slurry and tailingsslurry. This study is focused on comparison of three options formanagement of the tailings slurry generated by flotation cells. Thedifferent handling methods of coal tailings are applied whenflotation cells generate tailings with 20% solids or more.
2.3.1.1. Option one: tailings cake using belt press filters. The first twosteps of this option (i.e. flotation and thickening) are also used inoptions two and three. The thickener underflow 30% solids arepumped into a belt press feed sump and distributed to the beltpress filter machine as shown in Fig. 2.
During the flocculation stage, the fine coal tailings are floccu-lated using two types of polymer: an anionic flocculant and acationic coagulant. The free water in the flocculated slurry isdrained by gravity through the drainage (lower) belt, leaving a matof solids. Pressure is first applied in the wedge stage, squeezing theremaining water out of the tailings. Further dewatering occursduring the high-pressure stage when the tailings solids are com-pressed and sheared between belts and rollers. Tailings with 65%solids are discharged from the belt press filter and are transferred
by conveyor to a transfer point, from where trucks transport thetailings cake to a disposal area (reject emplacement).
2.3.1.2. Option two: tailings paste using paste thickener. The tailingsfrom flotation cells flow by gravity to a tailings thickener andanionic flocculant is added to the tailings thickener to assist in thesettling and aggregation of tailings. Underflow tailings from thethickener with 30% solids are pumped into a paste thickener, as anextension of the normal thickening process. An anionic flocculant isadded to the paste thickener to bind the fine particles together.Flocculated particles with 50% solids settled at the bottom of thepaste thickener are then pumped and transported by pipeline intothe tailings disposal area. The overflow water from the thickenerand paste thickener flows to a clarified water tank by gravity.
2.3.1.3. Option three: thickened tailings using thickeners. The tail-ings from flotation cells flow by gravity to a tailings thickener andanionic flocculant is added to the tailings thickener to assist insettling and aggregation. Underflow tailings with 30% solids fromthe thickener are pumped and transported by pipeline into thetailings dam. The overflow water from the thickener flows to theclarified water tank by gravity.
2.3.2. Data collection and main assumptionsLCIA modelling was performed using Simapro 8.0 software.
Necessary materials, energy, chemicals, and equipment wereidentified for each of the three tailings management options. Site-specific data were obtained from a publicly available consultant
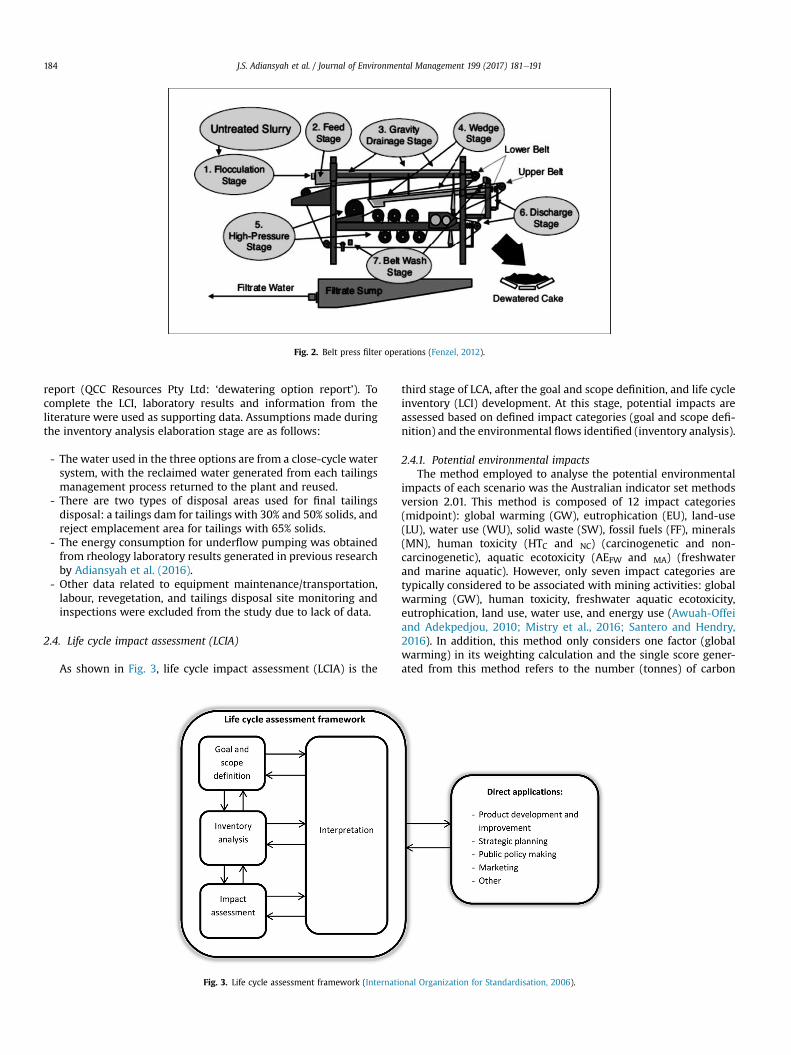
Fig. 2. Belt press filter operations (Fenzel, 2012).
J.S. Adiansyah et al. / Journal of Environmental Management 199 (2017) 181e191184
report (QCC Resources Pty Ltd: ‘dewatering option report’). Tocomplete the LCI, laboratory results and information from theliterature were used as supporting data. Assumptions made duringthe inventory analysis elaboration stage are as follows:
- The water used in the three options are from a close-cycle watersystem, with the reclaimed water generated from each tailingsmanagement process returned to the plant and reused.
- There are two types of disposal areas used for final tailingsdisposal: a tailings dam for tailings with 30% and 50% solids, andreject emplacement area for tailings with 65% solids.
- The energy consumption for underflow pumping was obtainedfrom rheology laboratory results generated in previous researchby Adiansyah et al. (2016).
- Other data related to equipment maintenance/transportation,labour, revegetation, and tailings disposal site monitoring andinspections were excluded from the study due to lack of data.
2.4. Life cycle impact assessment (LCIA)
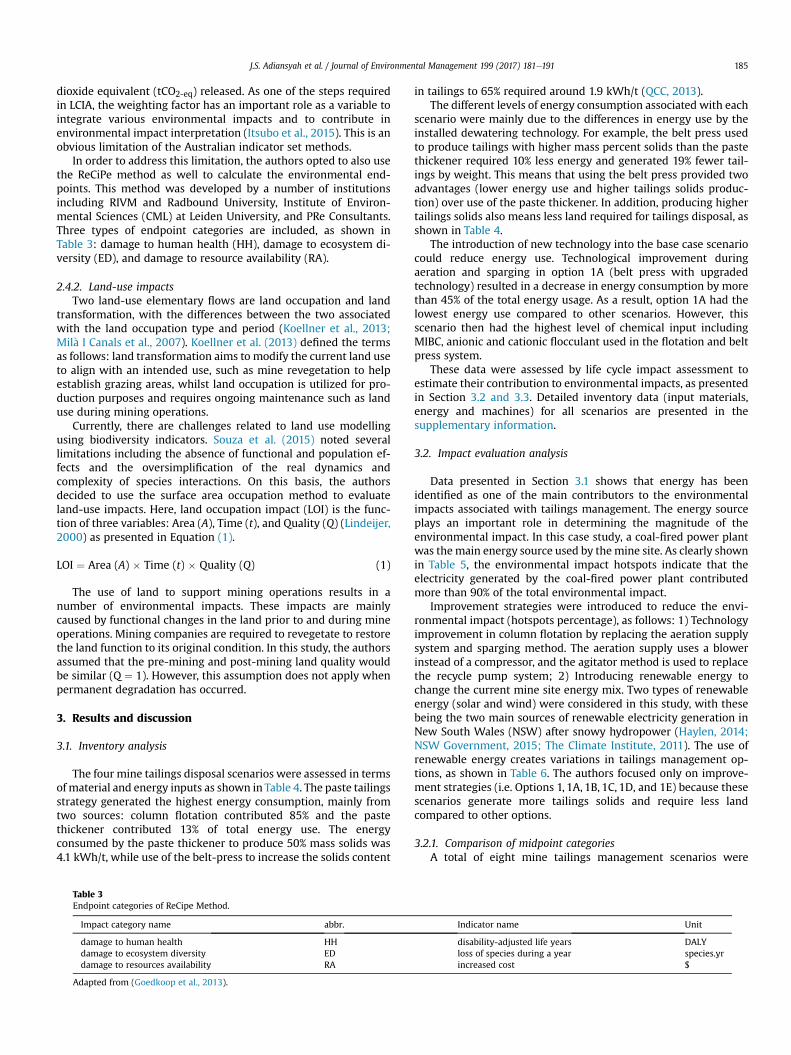
As shown in Fig. 3, life cycle impact assessment (LCIA) is the
Fig. 3. Life cycle assessment framework (Internati
third stage of LCA, after the goal and scope definition, and life cycleinventory (LCI) development. At this stage, potential impacts areassessed based on defined impact categories (goal and scope defi-nition) and the environmental flows identified (inventory analysis).
2.4.1. Potential environmental impactsThe method employed to analyse the potential environmental
impacts of each scenario was the Australian indicator set methodsversion 2.01. This method is composed of 12 impact categories(midpoint): global warming (GW), eutrophication (EU), land-use(LU), water use (WU), solid waste (SW), fossil fuels (FF), minerals(MN), human toxicity (HTC and NC) (carcinogenetic and non-carcinogenetic), aquatic ecotoxicity (AEFW and MA) (freshwaterand marine aquatic). However, only seven impact categories aretypically considered to be associated with mining activities: globalwarming (GW), human toxicity, freshwater aquatic ecotoxicity,eutrophication, land use, water use, and energy use (Awuah-Offeiand Adekpedjou, 2010; Mistry et al., 2016; Santero and Hendry,2016). In addition, this method only considers one factor (globalwarming) in its weighting calculation and the single score gener-ated from this method refers to the number (tonnes) of carbon
onal Organization for Standardisation, 2006).
J.S. Adiansyah et al. / Journal of Environmental Management 199 (2017) 181e191 185
dioxide equivalent (tCO2-eq) released. As one of the steps requiredin LCIA, the weighting factor has an important role as a variable tointegrate various environmental impacts and to contribute inenvironmental impact interpretation (Itsubo et al., 2015). This is anobvious limitation of the Australian indicator set methods.
In order to address this limitation, the authors opted to also usethe ReCiPe method as well to calculate the environmental end-points. This method was developed by a number of institutionsincluding RIVM and Radbound University, Institute of Environ-mental Sciences (CML) at Leiden University, and PRe Consultants.Three types of endpoint categories are included, as shown inTable 3: damage to human health (HH), damage to ecosystem di-versity (ED), and damage to resource availability (RA).
2.4.2. Land-use impactsTwo land-use elementary flows are land occupation and land
transformation, with the differences between the two associatedwith the land occupation type and period (Koellner et al., 2013;Mil�a I Canals et al., 2007). Koellner et al. (2013) defined the termsas follows: land transformation aims to modify the current land useto align with an intended use, such as mine revegetation to helpestablish grazing areas, whilst land occupation is utilized for pro-duction purposes and requires ongoing maintenance such as landuse during mining operations.
Currently, there are challenges related to land use modellingusing biodiversity indicators. Souza et al. (2015) noted severallimitations including the absence of functional and population ef-fects and the oversimplification of the real dynamics andcomplexity of species interactions. On this basis, the authorsdecided to use the surface area occupation method to evaluateland-use impacts. Here, land occupation impact (LOI) is the func-tion of three variables: Area (A), Time (t), and Quality (Q) (Lindeijer,2000) as presented in Equation (1).
LOI ¼ Area (A) � Time (t) � Quality (Q) (1)
The use of land to support mining operations results in anumber of environmental impacts. These impacts are mainlycaused by functional changes in the land prior to and during mineoperations. Mining companies are required to revegetate to restorethe land function to its original condition. In this study, the authorsassumed that the pre-mining and post-mining land quality wouldbe similar (Q ¼ 1). However, this assumption does not apply whenpermanent degradation has occurred.
3. Results and discussion
3.1. Inventory analysis
The four mine tailings disposal scenarios were assessed in termsofmaterial and energy inputs as shown in Table 4. The paste tailingsstrategy generated the highest energy consumption, mainly fromtwo sources: column flotation contributed 85% and the pastethickener contributed 13% of total energy use. The energyconsumed by the paste thickener to produce 50% mass solids was4.1 kWh/t, while use of the belt-press to increase the solids content
Table 3Endpoint categories of ReCipe Method.
Impact category name abbr.
damage to human health HHdamage to ecosystem diversity EDdamage to resources availability RA
Adapted from (Goedkoop et al., 2013).
in tailings to 65% required around 1.9 kWh/t (QCC, 2013).The different levels of energy consumption associated with each
scenario were mainly due to the differences in energy use by theinstalled dewatering technology. For example, the belt press usedto produce tailings with higher mass percent solids than the pastethickener required 10% less energy and generated 19% fewer tail-ings by weight. This means that using the belt press provided twoadvantages (lower energy use and higher tailings solids produc-tion) over use of the paste thickener. In addition, producing highertailings solids also means less land required for tailings disposal, asshown in Table 4.
The introduction of new technology into the base case scenariocould reduce energy use. Technological improvement duringaeration and sparging in option 1A (belt press with upgradedtechnology) resulted in a decrease in energy consumption by morethan 45% of the total energy usage. As a result, option 1A had thelowest energy use compared to other scenarios. However, thisscenario then had the highest level of chemical input includingMIBC, anionic and cationic flocculant used in the flotation and beltpress system.
These data were assessed by life cycle impact assessment toestimate their contribution to environmental impacts, as presentedin Section 3.2 and 3.3. Detailed inventory data (input materials,energy and machines) for all scenarios are presented in thesupplementary information.
3.2. Impact evaluation analysis
Data presented in Section 3.1 shows that energy has beenidentified as one of the main contributors to the environmentalimpacts associated with tailings management. The energy sourceplays an important role in determining the magnitude of theenvironmental impact. In this case study, a coal-fired power plantwas themain energy source used by themine site. As clearly shownin Table 5, the environmental impact hotspots indicate that theelectricity generated by the coal-fired power plant contributedmore than 90% of the total environmental impact.
Improvement strategies were introduced to reduce the envi-ronmental impact (hotspots percentage), as follows: 1) Technologyimprovement in column flotation by replacing the aeration supplysystem and sparging method. The aeration supply uses a blowerinstead of a compressor, and the agitator method is used to replacethe recycle pump system; 2) Introducing renewable energy tochange the current mine site energy mix. Two types of renewableenergy (solar and wind) were considered in this study, with thesebeing the two main sources of renewable electricity generation inNew South Wales (NSW) after snowy hydropower (Haylen, 2014;NSW Government, 2015; The Climate Institute, 2011). The use ofrenewable energy creates variations in tailings management op-tions, as shown in Table 6. The authors focused only on improve-ment strategies (i.e. Options 1, 1A, 1B, 1C, 1D, and 1E) because thesescenarios generate more tailings solids and require less landcompared to other options.
3.2.1. Comparison of midpoint categoriesA total of eight mine tailings management scenarios were
Indicator name Unit
disability-adjusted life years DALYloss of species during a year species.yrincreased cost $
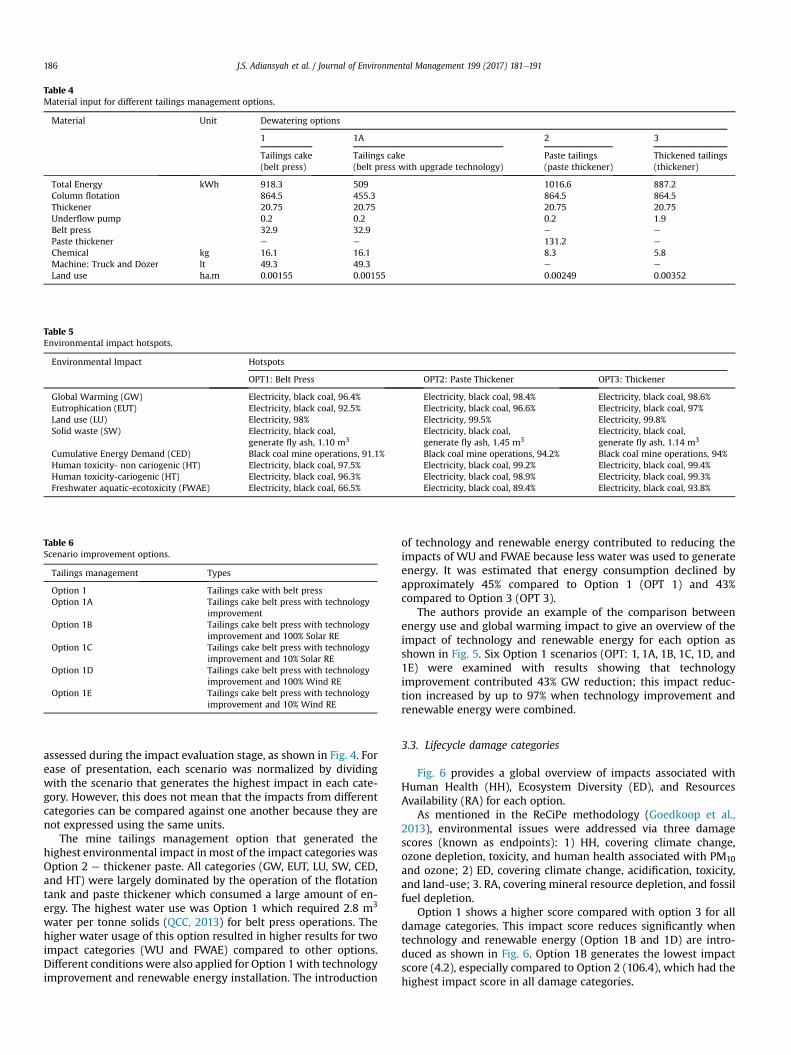
Table 4Material input for different tailings management options.
Material Unit Dewatering options
1 1A 2 3
Tailings cake(belt press)
Tailings cake(belt press with upgrade technology)
Paste tailings(paste thickener)
Thickened tailings(thickener)
Total Energy kWh 918.3 509 1016.6 887.2Column flotation 864.5 455.3 864.5 864.5Thickener 20.75 20.75 20.75 20.75Underflow pump 0.2 0.2 0.2 1.9Belt press 32.9 32.9 e e
Paste thickener e e 131.2 e
Chemical kg 16.1 16.1 8.3 5.8Machine: Truck and Dozer lt 49.3 49.3 e e
Land use ha.m 0.00155 0.00155 0.00249 0.00352
Table 5Environmental impact hotspots.
Environmental Impact Hotspots
OPT1: Belt Press OPT2: Paste Thickener OPT3: Thickener
Global Warming (GW) Electricity, black coal, 96.4% Electricity, black coal, 98.4% Electricity, black coal, 98.6%Eutrophication (EUT) Electricity, black coal, 92.5% Electricity, black coal, 96.6% Electricity, black coal, 97%Land use (LU) Electricity, 98% Electricity, 99.5% Electricity, 99.8%Solid waste (SW) Electricity, black coal,
generate fly ash, 1.10 m3Electricity, black coal,generate fly ash, 1.45 m3
Electricity, black coal,generate fly ash, 1.14 m3
Cumulative Energy Demand (CED) Black coal mine operations, 91.1% Black coal mine operations, 94.2% Black coal mine operations, 94%Human toxicity- non cariogenic (HT) Electricity, black coal, 97.5% Electricity, black coal, 99.2% Electricity, black coal, 99.4%Human toxicity-cariogenic (HT) Electricity, black coal, 96.3% Electricity, black coal, 98.9% Electricity, black coal, 99.3%Freshwater aquatic-ecotoxicity (FWAE) Electricity, black coal, 66.5% Electricity, black coal, 89.4% Electricity, black coal, 93.8%
Table 6Scenario improvement options.
Tailings management Types
Option 1 Tailings cake with belt pressOption 1A Tailings cake belt press with technology
improvementOption 1B Tailings cake belt press with technology
improvement and 100% Solar REOption 1C Tailings cake belt press with technology
improvement and 10% Solar REOption 1D Tailings cake belt press with technology
improvement and 100% Wind REOption 1E Tailings cake belt press with technology
improvement and 10% Wind RE
J.S. Adiansyah et al. / Journal of Environmental Management 199 (2017) 181e191186
assessed during the impact evaluation stage, as shown in Fig. 4. Forease of presentation, each scenario was normalized by dividingwith the scenario that generates the highest impact in each cate-gory. However, this does not mean that the impacts from differentcategories can be compared against one another because they arenot expressed using the same units.
The mine tailings management option that generated thehighest environmental impact in most of the impact categories wasOption 2 e thickener paste. All categories (GW, EUT, LU, SW, CED,and HT) were largely dominated by the operation of the flotationtank and paste thickener which consumed a large amount of en-ergy. The highest water use was Option 1 which required 2.8 m3
water per tonne solids (QCC, 2013) for belt press operations. Thehigher water usage of this option resulted in higher results for twoimpact categories (WU and FWAE) compared to other options.Different conditions were also applied for Option 1with technologyimprovement and renewable energy installation. The introduction
of technology and renewable energy contributed to reducing theimpacts of WU and FWAE because less water was used to generateenergy. It was estimated that energy consumption declined byapproximately 45% compared to Option 1 (OPT 1) and 43%compared to Option 3 (OPT 3).
The authors provide an example of the comparison betweenenergy use and global warming impact to give an overview of theimpact of technology and renewable energy for each option asshown in Fig. 5. Six Option 1 scenarios (OPT: 1, 1A, 1B, 1C, 1D, and1E) were examined with results showing that technologyimprovement contributed 43% GW reduction; this impact reduc-tion increased by up to 97% when technology improvement andrenewable energy were combined.
3.3. Lifecycle damage categories
Fig. 6 provides a global overview of impacts associated withHuman Health (HH), Ecosystem Diversity (ED), and ResourcesAvailability (RA) for each option.
As mentioned in the ReCiPe methodology (Goedkoop et al.,2013), environmental issues were addressed via three damagescores (known as endpoints): 1) HH, covering climate change,ozone depletion, toxicity, and human health associated with PM10
and ozone; 2) ED, covering climate change, acidification, toxicity,and land-use; 3. RA, covering mineral resource depletion, and fossilfuel depletion.
Option 1 shows a higher score compared with option 3 for alldamage categories. This impact score reduces significantly whentechnology and renewable energy (Option 1B and 1D) are intro-duced as shown in Fig. 6. Option 1B generates the lowest impactscore (4.2), especially compared to Option 2 (106.4), which had thehighest impact score in all damage categories.

Fig. 4. Environmental impacts e midpoint result.
Fig. 5. Global warming impact for each option.
J.S. Adiansyah et al. / Journal of Environmental Management 199 (2017) 181e191 187
3.4. Land use
Land use change associated with mining operations can lead tosubstantial impacts including wildlife habitat loss, contamination of
water and land, chemical contamination of surface and groundwater, and lowering of the water table (Mil�a I Canals et al., 2007;Miranda et al., 2003). Mining operators prepare a mine plan docu-ment, addressing management of land change to avoid or prevent
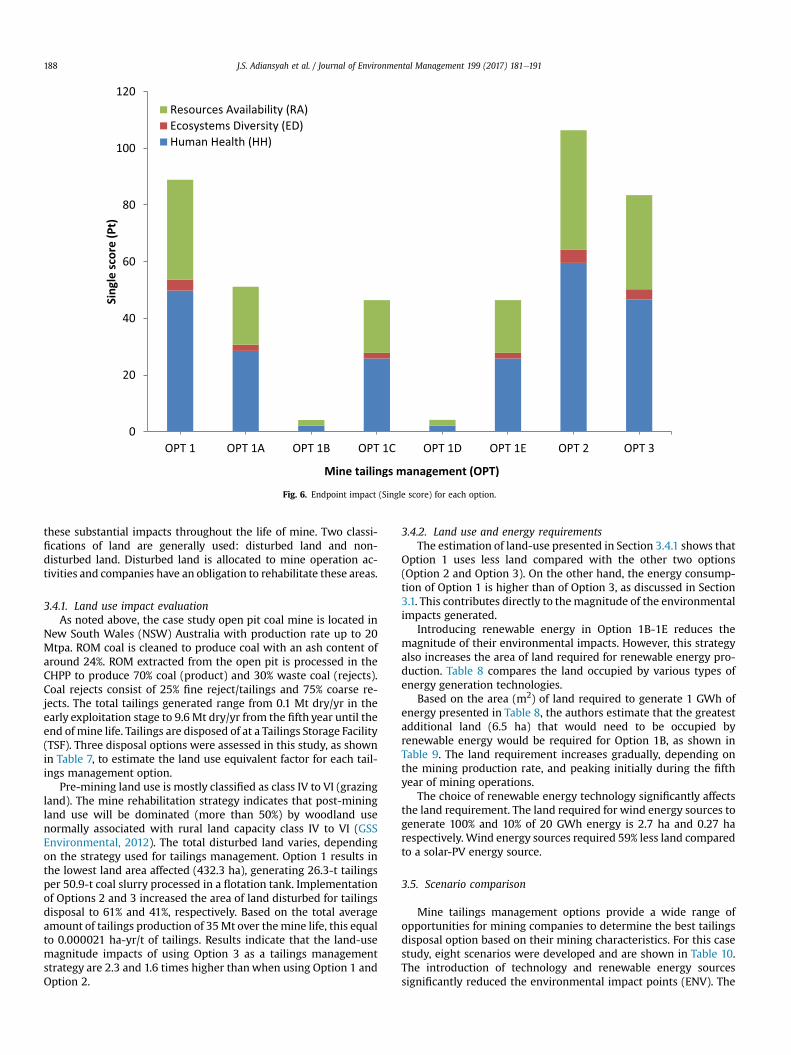
Fig. 6. Endpoint impact (Single score) for each option.
J.S. Adiansyah et al. / Journal of Environmental Management 199 (2017) 181e191188
these substantial impacts throughout the life of mine. Two classi-fications of land are generally used: disturbed land and non-disturbed land. Disturbed land is allocated to mine operation ac-tivities and companies have an obligation to rehabilitate these areas.
3.4.1. Land use impact evaluationAs noted above, the case study open pit coal mine is located in
New South Wales (NSW) Australia with production rate up to 20Mtpa. ROM coal is cleaned to produce coal with an ash content ofaround 24%. ROM extracted from the open pit is processed in theCHPP to produce 70% coal (product) and 30% waste coal (rejects).Coal rejects consist of 25% fine reject/tailings and 75% coarse re-jects. The total tailings generated range from 0.1 Mt dry/yr in theearly exploitation stage to 9.6 Mt dry/yr from the fifth year until theend ofmine life. Tailings are disposed of at a Tailings Storage Facility(TSF). Three disposal options were assessed in this study, as shownin Table 7, to estimate the land use equivalent factor for each tail-ings management option.
Pre-mining land use is mostly classified as class IV to VI (grazingland). The mine rehabilitation strategy indicates that post-miningland use will be dominated (more than 50%) by woodland usenormally associated with rural land capacity class IV to VI (GSSEnvironmental, 2012). The total disturbed land varies, dependingon the strategy used for tailings management. Option 1 results inthe lowest land area affected (432.3 ha), generating 26.3-t tailingsper 50.9-t coal slurry processed in a flotation tank. Implementationof Options 2 and 3 increased the area of land disturbed for tailingsdisposal to 61% and 41%, respectively. Based on the total averageamount of tailings production of 35Mt over themine life, this equalto 0.000021 ha-yr/t of tailings. Results indicate that the land-usemagnitude impacts of using Option 3 as a tailings managementstrategy are 2.3 and 1.6 times higher thanwhen using Option 1 andOption 2.
3.4.2. Land use and energy requirementsThe estimation of land-use presented in Section 3.4.1 shows that
Option 1 uses less land compared with the other two options(Option 2 and Option 3). On the other hand, the energy consump-tion of Option 1 is higher than of Option 3, as discussed in Section3.1. This contributes directly to the magnitude of the environmentalimpacts generated.
Introducing renewable energy in Option 1B-1E reduces themagnitude of their environmental impacts. However, this strategyalso increases the area of land required for renewable energy pro-duction. Table 8 compares the land occupied by various types ofenergy generation technologies.
Based on the area (m2) of land required to generate 1 GWh ofenergy presented in Table 8, the authors estimate that the greatestadditional land (6.5 ha) that would need to be occupied byrenewable energy would be required for Option 1B, as shown inTable 9. The land requirement increases gradually, depending onthe mining production rate, and peaking initially during the fifthyear of mining operations.
The choice of renewable energy technology significantly affectsthe land requirement. The land required for wind energy sources togenerate 100% and 10% of 20 GWh energy is 2.7 ha and 0.27 harespectively. Wind energy sources required 59% less land comparedto a solar-PV energy source.
3.5. Scenario comparison
Mine tailings management options provide a wide range ofopportunities for mining companies to determine the best tailingsdisposal option based on their mining characteristics. For this casestudy, eight scenarios were developed and are shown in Table 10.The introduction of technology and renewable energy sourcessignificantly reduced the environmental impact points (ENV). The
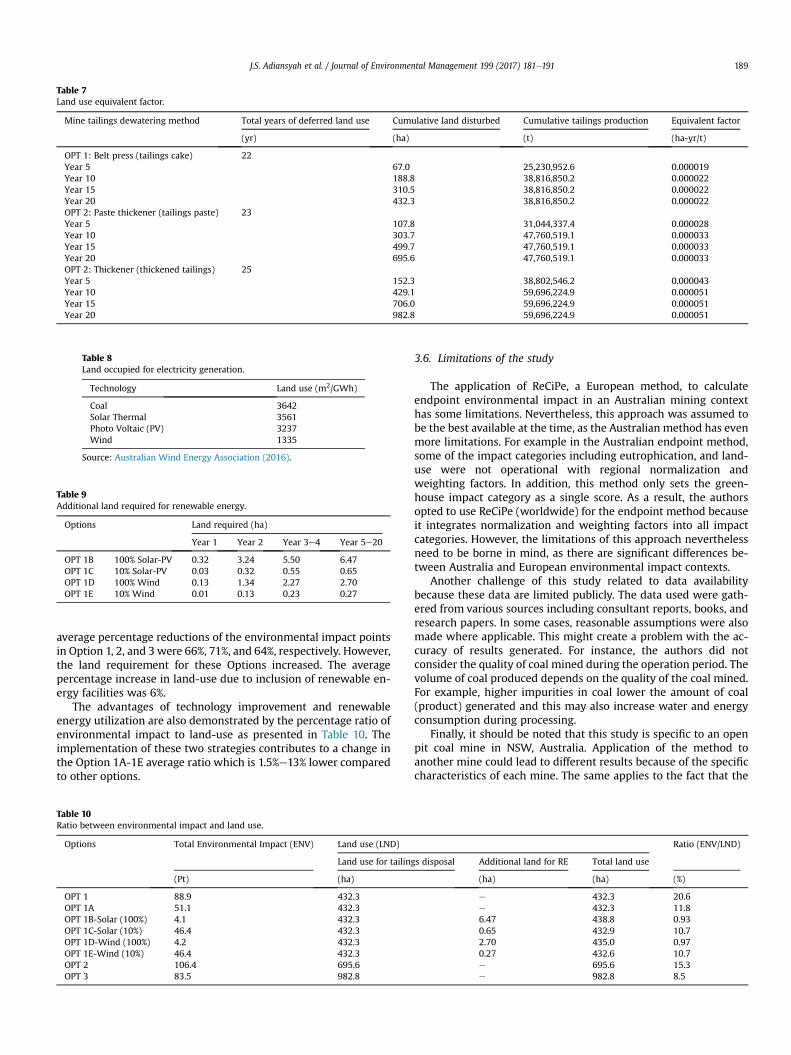
Table 7Land use equivalent factor.
Mine tailings dewatering method Total years of deferred land use Cumulative land disturbed Cumulative tailings production Equivalent factor
(yr) (ha) (t) (ha-yr/t)
OPT 1: Belt press (tailings cake) 22Year 5 67.0 25,230,952.6 0.000019Year 10 188.8 38,816,850.2 0.000022Year 15 310.5 38,816,850.2 0.000022Year 20 432.3 38,816,850.2 0.000022OPT 2: Paste thickener (tailings paste) 23Year 5 107.8 31,044,337.4 0.000028Year 10 303.7 47,760,519.1 0.000033Year 15 499.7 47,760,519.1 0.000033Year 20 695.6 47,760,519.1 0.000033OPT 2: Thickener (thickened tailings) 25Year 5 152.3 38,802,546.2 0.000043Year 10 429.1 59,696,224.9 0.000051Year 15 706.0 59,696,224.9 0.000051Year 20 982.8 59,696,224.9 0.000051
Table 8Land occupied for electricity generation.
Technology Land use (m2/GWh)
Coal 3642Solar Thermal 3561Photo Voltaic (PV) 3237Wind 1335
Source: Australian Wind Energy Association (2016).
Table 9Additional land required for renewable energy.
Options Land required (ha)
Year 1 Year 2 Year 3e4 Year 5e20
OPT 1B 100% Solar-PV 0.32 3.24 5.50 6.47OPT 1C 10% Solar-PV 0.03 0.32 0.55 0.65OPT 1D 100% Wind 0.13 1.34 2.27 2.70OPT 1E 10% Wind 0.01 0.13 0.23 0.27
J.S. Adiansyah et al. / Journal of Environmental Management 199 (2017) 181e191 189
average percentage reductions of the environmental impact pointsin Option 1, 2, and 3 were 66%, 71%, and 64%, respectively. However,the land requirement for these Options increased. The averagepercentage increase in land-use due to inclusion of renewable en-ergy facilities was 6%.
The advantages of technology improvement and renewableenergy utilization are also demonstrated by the percentage ratio ofenvironmental impact to land-use as presented in Table 10. Theimplementation of these two strategies contributes to a change inthe Option 1A-1E average ratio which is 1.5%e13% lower comparedto other options.
Table 10Ratio between environmental impact and land use.
Options Total Environmental Impact (ENV) Land use (LND)
Land use for tailing
(Pt) (ha)
OPT 1 88.9 432.3OPT 1A 51.1 432.3OPT 1B-Solar (100%) 4.1 432.3OPT 1C-Solar (10%) 46.4 432.3OPT 1D-Wind (100%) 4.2 432.3OPT 1E-Wind (10%) 46.4 432.3OPT 2 106.4 695.6OPT 3 83.5 982.8
3.6. Limitations of the study
The application of ReCiPe, a European method, to calculateendpoint environmental impact in an Australian mining contexthas some limitations. Nevertheless, this approach was assumed tobe the best available at the time, as the Australian method has evenmore limitations. For example in the Australian endpoint method,some of the impact categories including eutrophication, and land-use were not operational with regional normalization andweighting factors. In addition, this method only sets the green-house impact category as a single score. As a result, the authorsopted to use ReCiPe (worldwide) for the endpoint method becauseit integrates normalization and weighting factors into all impactcategories. However, the limitations of this approach neverthelessneed to be borne in mind, as there are significant differences be-tween Australia and European environmental impact contexts.
Another challenge of this study related to data availabilitybecause these data are limited publicly. The data used were gath-ered from various sources including consultant reports, books, andresearch papers. In some cases, reasonable assumptions were alsomade where applicable. This might create a problem with the ac-curacy of results generated. For instance, the authors did notconsider the quality of coal mined during the operation period. Thevolume of coal produced depends on the quality of the coal mined.For example, higher impurities in coal lower the amount of coal(product) generated and this may also increase water and energyconsumption during processing.
Finally, it should be noted that this study is specific to an openpit coal mine in NSW, Australia. Application of the method toanother mine could lead to different results because of the specificcharacteristics of each mine. The same applies to the fact that the
Ratio (ENV/LND)
s disposal Additional land for RE Total land use
(ha) (ha) (%)
e 432.3 20.6e 432.3 11.86.47 438.8 0.930.65 432.9 10.72.70 435.0 0.970.27 432.6 10.7e 695.6 15.3e 982.8 8.5
J.S. Adiansyah et al. / Journal of Environmental Management 199 (2017) 181e191190
electricity grid mix in NSW has a very high percentage of fossil fuelenergy (black coal) which might substantially increase impactsrelated to electricity production.
4. Conclusions
Coal mine tailings can be transported in various forms includingwet or dry. Wet methods usually involve use of a pipeline totransport tailings from CHPP to TSF. Dry methods, including beltpress methods, seek to reduce thewater content in tailings slurry toform tailings cake. Tailings cake generated by the belt press methodis then disposed of. Some coal mine sites implement a co-tailingsdisposal method, in which the tailings cake is disposed oftogether with coarse coal. Alternative disposal methods provide anopportunity for mine sites to select a method that is suited to theirsite characteristics. Environmental impacts and land-use variablescan be used as parameters to determine the feasibility of differenttailings disposal methods that increasing the sustainability per-formance of mining waste management.
The results of this study indicated that thickened tailings (Op-tion 3) generated the lowest environmental impact compared tothe belt press (Option 1) and paste thickener (Option 2) methods.However, in terms of land-use, Option 3 occupied the highest land,close to 1000 ha. This highest land-use makes this option as anunattractive proposition compared to the other two options (Op-tion 1 and Option 2). Two strategies (technology improvement andrenewable energy sources) were introduced into the belt pressoption that required the least area of land. These measures cansignificantly reduce the overall environmental impact. The twolowest ratios of environmental impacts to land-use were generatedby Option 1B (0.93%) and Option 1D (0.97%). Option 1D requires lessland (1.0%) than does Option 1B.
This study also indicates the importance of considering theenvironmental impact and land use aspects of coal mine sites priorto selecting a tailings disposal method. Further analysis of eco-nomic aspects and reuse opportunities is also required forcomprehensive discussion of sustainable tailings management andindustrial symbiosis.
Acknowledgements
The authors would like to thank Mr. Andreas Monch, ProjectManager Integrated Tailings Management (CSIRO), and Dr. AndrewChryss, Senior Research Engineer (CSIRO) for their contributions tothe comprehensive discussion on tailings management.
Appendix A. Supplementary data
Supplementary data related to this article can be found at http://dx.doi.org/10.1016/j.jenvman.2017.05.050.
References
Adiansyah, J.S., Rosano, M., Vink, S., Keir, G., 2015. A framework for a sustainableapproach to mine tailings management: disposal strategies. J. Clean. Prod. 108,1e13. http://dx.doi.org/10.1016/j.jclepro.2015.07.139.
Adiansyah, J.S., Rosano, M., Vink, S., Keir, G., Stokes, J.R., 2016. Synergising waterand energy requirements to improve sustainability performance in minetailings management. J. Clean. Prod. 133, 5e17. http://dx.doi.org/10.1016/j.jclepro.2016.05.100.
Australian Wind Energy Association, 2016. Fact Sheet 3: Wind Farming and theEnvironment.
Awuah-Offei, K., Adekpedjou, A., 2010. Application of life cycle assessment in themining industry. Int. J. Life Cycle Assess. 16, 82e89. http://dx.doi.org/10.1007/s11367-010-0246-6.
Bovea, M.-D., Saula, U., Ferrero, J.L., Giner, J., 2007. Cradle-to-Gate study of red clayfor use in the ceramic industry. Int. J. Life Cycle Assess. 12, 439e447. http://dx.doi.org/10.1065/lca2006.06.252.
Burchart-Korol, D., Fugiel, A., Czaplicka-Kolarz, K., Turek, M., 2016. Model of envi-ronmental life cycle assessment for coal mining operations. Sci. Total Environ.562, 61e72. http://dx.doi.org/10.1016/j.scitotenv.2016.03.202.
Ditsele, O., Awuah-Offei, K., 2012. Effect of mine characteristics on life cycle impactsof US surface coal mining. Int. J. Life Cycle Assess. 17, 287e294. http://dx.doi.org/10.1007/s11367-011-0354-y.
Erkayao�glu, M., Demirel, N., 2016. A comparative life cycle assessment of materialhandling systems for sustainable mining. J. Env. Manag. 174, 1e6.
Fenzel, M.S., 2012. Belt filter press in coal tailings dewatering - a comprehensiveeconomic, design, and process analysis. In: Klima, M.S., Arnold, B.J., Bethell, P.J.(Eds.), Challenges in Fine Coal: Processing, Dewatering, and Disposal. Society forMining, Metallurgy, and Exploration (SME).
Fernandez-Iglesias, A., Correa de Araujo, A., Andres, S., Xuan, W., Luina, R.,Alvares, V., 2013. Study of Environmental Feasibility of Paste and ThickenedTailings by Life-cycle Assessment. Paste 2013.
Ferreira, H., Leite,M.G.P., 2015. A Life Cycle Assessment (LCA) studyof ironoremining.J. Clean. Prod. 108, 1081e1091. http://dx.doi.org/10.1016/j.jclepro.2015.05.140.
Goedkoop, M., Heijungs, R., De Schryver, A., Struijs, J., van Zelm, R., 2013. ReCiPe2008. A LCIA method which comprises harmonised category indicators at themidpoint and the endpoint level. Charact. A Life Cycle Impact 133. http://www.lcia-recipe.net.
GSS Environmental, 2012. Mine Rehabilitation Strategy: Cobbora Coal Project(Report). GSS Environmental, Australia.
Haque, N., Norgate, T., 2015. Life cycle assessment of iron ore mining and pro-cessing, in: iron Ore: Mineralogy. In: Processing and Environmental Sustain-ability, pp. 615e630. http://dx.doi.org/10.1016/B978-1-78242-156-6.00020-4.
Haylen, A., 2014. Policies and Prospect for Renewable Energy in New South Wales.Honaker, R., Kohmuench, J., Luttrell, G., 2013. Cleaning of fine and ultrafine coal. In:
Osborne, D. (Ed.), The Coal Handbook: toward Cleaner Production. WoodheadPublishing, Oxford, Cambridge, Philadelphia, New Delhi.
International Organization for Standardisation, 2006. ISO 1440 EnvironmentalManagement-life Cycle Assessment-principles and Framework. London Br.Stand. Inst.
Itsubo, N., Murakami, K., Kuriyama, K., Yoshida, K., Tokimatsu, K., Inaba, A., 2015.Development of weighting factors for G20 countries???explore the differencein environmental awareness between developed and emerging countries. Int. J.Life Cycle Assess. http://dx.doi.org/10.1007/s11367-015-0881-z.
Koellner, T., Baan, L., Beck, T., Brand~ao, M., Civit, B., Margni, M., Mil�a i Canals, L.,Saad, R., De Souza, D.M., Müller-Wenk, R., 2013. UNEP-SETAC guideline onglobal land use impact assessment on biodiversity and ecosystem services inLCA. Int. J. Life Cycle Assess. 18, 1188e1202. http://dx.doi.org/10.1007/s11367-013-0579-z.
Kohmuench, J.N., Mankosa, M.J., Yan, E.S., 2010. Evaluation of the Stackcell Tech-nology for Coal Application. In: Honaker, R.Q. (Ed.). International Coal Prepa-ration Congress 2010, SME, Kentucky, USA.
Kossoff, D., Dubbin, W.E., Alfredsson, M., Edwards, S.J., Macklin, M.G., Hudson-Edwards, K.A., 2014. Mine tailings dams: characteristics, failure, environmentalimpacts, and remediation. Appl. Geochem. http://dx.doi.org/10.1016/j.apgeochem.2014.09.010.
Kumar, S., Bhattacharya, S., Mandre, N.R., Venugopal, R., 2014. Present challenges inthe performance of coal fines dewatering circuit. Int. J. Eng. Res. Sci. Technol. 3,172e179.
Lindeijer, E., 2000. Review of land use impact methodologies. J. Clean. Prod. 8,273e281. http://dx.doi.org/10.1016/S0959-6526(00)00024-X.
Memary, R., Giurco, D., Mudd, G., Mason, L., 2012. Life cycle assessment: a time-series analysis of copper. J. Clean. Prod. 33, 97e108. http://dx.doi.org/10.1016/j.jclepro.2012.04.025.
Mil�a I Canals, L., Bauer, C., Depestele, J., Dubreuil, A., Knuchel, R.F., 2007. Key ele-ments in a framework for land use impact assessment within LCA. Int. J. LifeCycle Assess. 12, 5e15. http://dx.doi.org/10.1065/lca2006.05.250.
Miranda, M., Burris, P., Bingcang, J.F., Shearman, P., Briones, J.O., La Vina, A.,Menard, S., Holmes, K., 2003. Mining and Critical Ecosystems: Mapping theRisks. WRI, Washington, DC.
Mistry, M., Gediga, J., Boonzaier, S., 2016. Life cycle assessment of nickel products.Int. J. Life Cycle Assess. http://dx.doi.org/10.1007/s11367-016-1085-x.
Norgate, T., Haque, N., 2012. Using life cycle assessment to evaluate some envi-ronmental impacts of gold production. J. Clean. Prod. 29e30, 53e63. http://dx.doi.org/10.1016/j.jclepro.2012.01.042.
NSW Government, 2015. NSW Renewable Energy Action Plan (Report). Departmentof Industry Skills and Regional Development, New South Wales, Australia.
Osborne, D.G., Gupta, S.K., 2013. Industrial uses of coal. In: Osborne, D. (Ed.), TheCoal Handbook: toward Cleaner Production. Woodhead Publishing, Oxford,Cambridge, Philadelphia, New Delhi.
Perusahaan Listrik Negara, 2015. 35.000 MW Untuk Indonesia.QCC, R., 2013. Appendix C: Dewatering Options Report - Comparison of Options for
Tailings Dewatering (Report). QCC Resources Pty Ltd, Australia.Reid, C., B�ecaert, V., Aubertin, M., Rosenbaum, R.K., Deschenes, L., 2009. Life cycle
assessment of mine tailings management in Canada. J. Clean. Prod. 17, 471e479.http://dx.doi.org/10.1016/j.jclepro.2008.08.014.
Santero, N., Hendry, J., 2016. Harmonization of LCA methodologies for the metal andmining industry. Int. J. Life Cycle Assess. 1e11. http://dx.doi.org/10.1007/s11367-015-1022-4.
Simapro manual PRe Consultants, 2008. Introduction to LCA with SimaPro 7. PR�eConsult.Netherlands.Version1e88.http://dx.doi.org/10.1016/j.soncn.2012.11.001.
Souza, D.M., Teixeira, R.F.M., Ostermann, O.P., 2015. Assessing biodiversity loss due

J.S. Adiansyah et al. / Journal of Environmental Management 199 (2017) 181e191 191
to land use with Life Cycle Assessment: are we there yet? Glob. Chang. Biol.http://dx.doi.org/10.1111/gcb.12709.
Spitzley, D., Tolle, D., 2004. Evaluating land-use impacts: selection of surface areametrics for life-cycle assessment of mining. J. Ind. Ecol. 8, 11e21. http://dx.doi.org/10.1162/1088198041269481.
The Climate Institute, 2011. Clean Energy New South Wales. WWW Document.http://www.climateinstitute.org.au/verve/_resources/cleanenergyjobssnapshot_newsouthwales.pdf.
Thomas, L.P., 2013. Coal resources and reserves. In: Osborne, D. (Ed.), The Coal
Handbook: toward Cleaner Production. Woodhead Publishing, Oxford, Cam-bridge, Philadelphia, New Delhi.
World Nuclear Association, 2013. Australia's Electricity. WWW Document. http://www.world-nuclear.org/info/Country-Profiles/Countries-A-F/Appendices/Australia-s-Electricity/.
Zhengfu, B., Hillary, I., John, L.D., Frank, O., Sue, S., 2010. Environmental issues fromcoal mining and their solutions. Min. Sci. Technol. 20, 215e223. http://dx.doi.org/10.1016/S1674-5264(09)60187-3.