Embed Size (px)
Citation preview
A P P L I C A T I O N N O T E
Key Features:
• in situ phenotyping of multiple sets of immune cells in FFPE tissue sections
• Enabled by:
• Multicolor IHC/IF (Opal™)
• Multispectral imaging (Mantra™ / Vectra®)
• Per-cell quantitation and phenotyping analysis (inForm®)
• TIBCO Spotfire® Analyst for Quantitative Pathology
• Automated simultaneous CD4, CD8 and CD20 quantification in epithelial and stromal compartments
Quantitative Pathology Solutions
Introduction
Cancer immunotherapy is rapidly changing the landscape of cancer treatment, with checkpoint inhibitors
such as those targeting CTLA-4 and PD-L1, activated T cell therapies and a range of other combinatorial approaches providing significantly longer benefits for patients compared to small molecule inhibitor and targeted therapy approaches1,2. However, response rates range from 15 – 30%, pointing to the need for the use of biomarkers for better stratification. “A more complete understanding of the cellular and molecular components of the tumor-immune system interaction is crucial to the development of rational and efficacious immunotherapies in the future3.” While quantifying the number of specific subsets of immune cells in blood is routine using multimarker flow cytometry, monitoring these same subsets of immune cells in solid tumors remains unobtainable with standard methods. Methods that involve decomposing the tumor and releasing the immune cells for flow cytometric analyses are difficult. Even when working properly with no biasing of the cell populations, these methods cannot reveal the contextual spatial relationships and the functional states of the immune cells within and around the tumor, which leading researchers today believe may contain vital information needed to predict response to specific immunotherapies.
Phenotyping Immune Cell Subsets in situ in FFPE Tissue Sections
2
Standard IHC methodologies can be used on tissue sections to visualize or quantitate one marker at a time, but standard methods cannot capture the complex, multimarker phenotypes needed to analyze the subsets of immune cells that are important in cancer immunology4. To address this issue, a novel multimarker staining, imaging, and quantitation methodology has been developed that allows complex phenotypes to be determined and immune cells to be enumerated and assessed for checkpoint expression, in situ in FFPE sections. The success of this application hinges on bringing together several methodologies.
Example: Helper T, Cytotoxic T and B Cell Panel
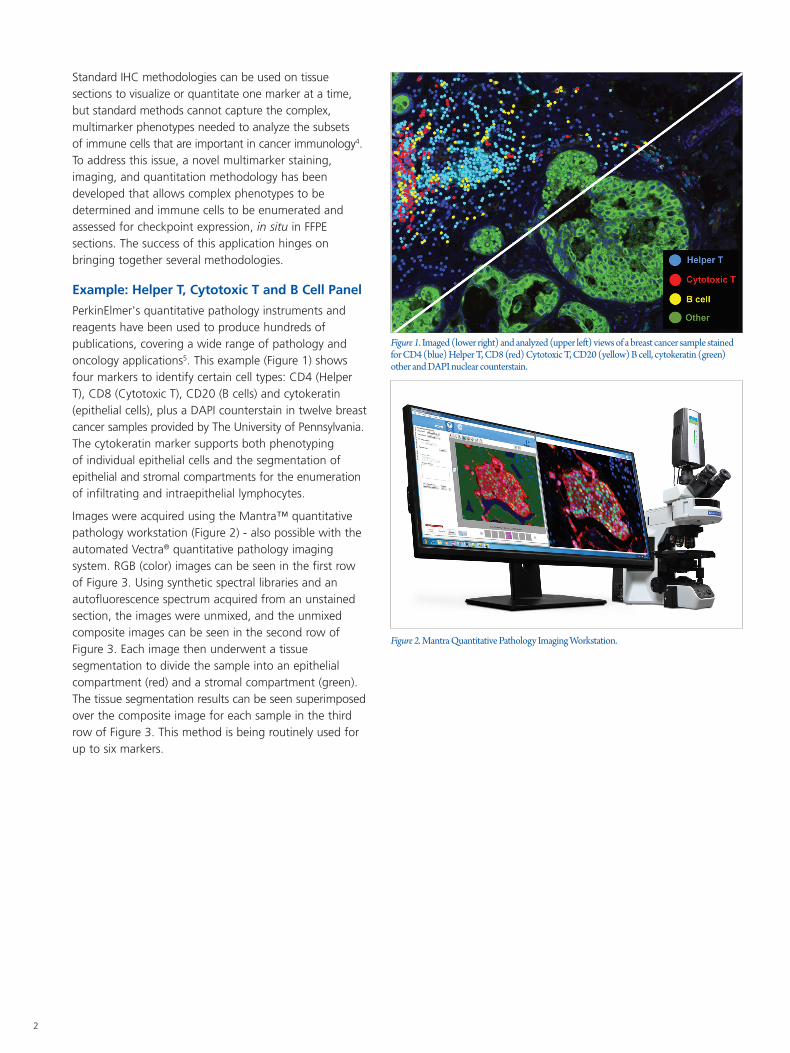
PerkinElmer's quantitative pathology instruments and reagents have been used to produce hundreds of publications, covering a wide range of pathology and oncology applications5. This example (Figure 1) shows four markers to identify certain cell types: CD4 (Helper T), CD8 (Cytotoxic T), CD20 (B cells) and cytokeratin (epithelial cells), plus a DAPI counterstain in twelve breast cancer samples provided by The University of Pennsylvania. The cytokeratin marker supports both phenotyping of individual epithelial cells and the segmentation of epithelial and stromal compartments for the enumeration of infiltrating and intraepithelial lymphocytes.
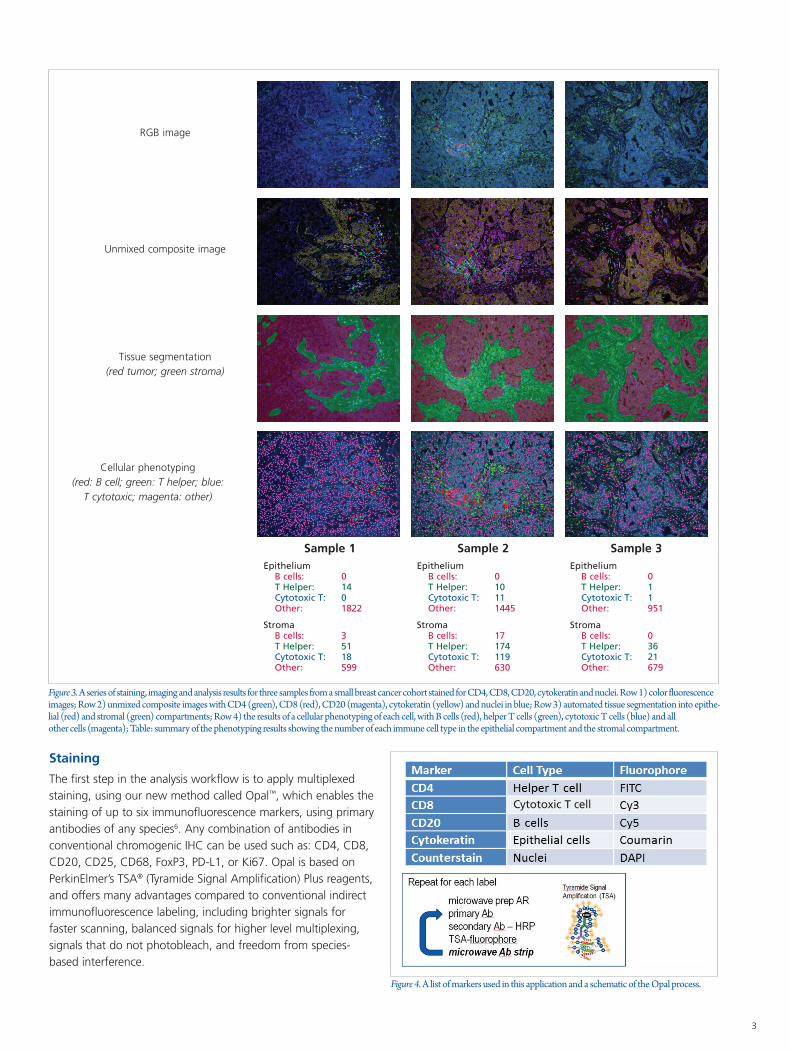
Images were acquired using the Mantra™ quantitative pathology workstation (Figure 2) - also possible with the automated Vectra® quantitative pathology imaging system. RGB (color) images can be seen in the first row of Figure 3. Using synthetic spectral libraries and an autofluorescence spectrum acquired from an unstained section, the images were unmixed, and the unmixed composite images can be seen in the second row of Figure 3. Each image then underwent a tissue segmentation to divide the sample into an epithelial compartment (red) and a stromal compartment (green). The tissue segmentation results can be seen superimposed over the composite image for each sample in the third row of Figure 3. This method is being routinely used for up to six markers.
Figure 1. Imaged (lower right) and analyzed (upper left) views of a breast cancer sample stained for CD4 (blue) Helper T, CD8 (red) Cytotoxic T, CD20 (yellow) B cell, cytokeratin (green) other and DAPI nuclear counterstain.
Figure 2. Mantra Quantitative Pathology Imaging Workstation.
3
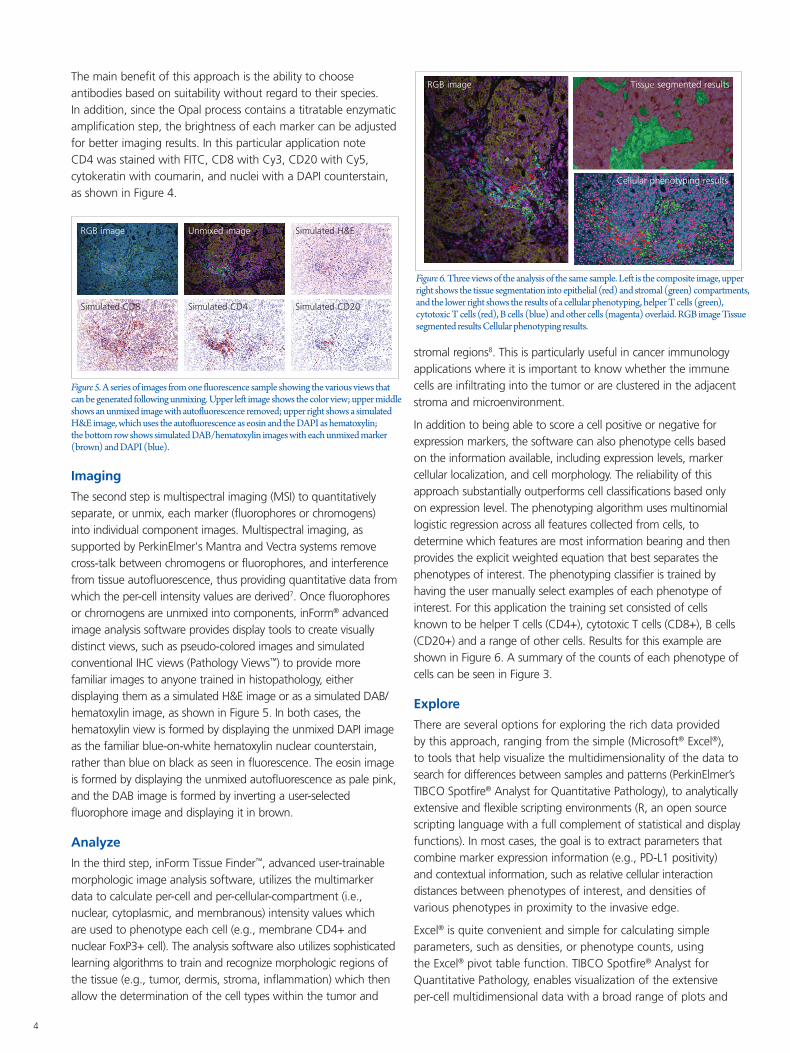
Figure 3. A series of staining, imaging and analysis results for three samples from a small breast cancer cohort stained for CD4, CD8, CD20, cytokeratin and nuclei. Row 1) color fluorescence images; Row 2) unmixed composite images with CD4 (green), CD8 (red), CD20 (magenta), cytokeratin (yellow) and nuclei in blue; Row 3) automated tissue segmentation into epithe-lial (red) and stromal (green) compartments; Row 4) the results of a cellular phenotyping of each cell, with B cells (red), helper T cells (green), cytotoxic T cells (blue) and all other cells (magenta); Table: summary of the phenotyping results showing the number of each immune cell type in the epithelial compartment and the stromal compartment.
Sample 1Epithelium B cells: 0 T Helper: 14 Cytotoxic T: 0 Other: 1822
Stroma B cells: 3 T Helper: 51 Cytotoxic T: 18 Other: 599
Sample 2Epithelium B cells: 0 T Helper: 10 Cytotoxic T: 11 Other: 1445
Stroma B cells: 17 T Helper: 174 Cytotoxic T: 119 Other: 630
Sample 3Epithelium B cells: 0 T Helper: 1 Cytotoxic T: 1 Other: 951
Stroma B cells: 0 T Helper: 36 Cytotoxic T: 21 Other: 679
RGB image
Unmixed composite image
Tissue segmentation (red tumor; green stroma)
Cellular phenotyping (red: B cell; green: T helper; blue:
T cytotoxic; magenta: other)
Staining
The first step in the analysis workflow is to apply multiplexed staining, using our new method called Opal™, which enables the staining of up to six immunofluorescence markers, using primary antibodies of any species6. Any combination of antibodies in conventional chromogenic IHC can be used such as: CD4, CD8, CD20, CD25, CD68, FoxP3, PD-L1, or Ki67. Opal is based on PerkinElmer’s TSA® (Tyramide Signal Amplification) Plus reagents, and offers many advantages compared to conventional indirect immunofluorescence labeling, including brighter signals for faster scanning, balanced signals for higher level multiplexing, signals that do not photobleach, and freedom from species-based interference. Figure 4. A list of markers used in this application and a schematic of the Opal process.
Cytotoxic T cell
4
Figure 5. A series of images from one fluorescence sample showing the various views that can be generated following unmixing. Upper left image shows the color view; upper middle shows an unmixed image with autofluorescence removed; upper right shows a simulated H&E image, which uses the autofluorescence as eosin and the DAPI as hematoxylin; the bottom row shows simulated DAB/hematoxylin images with each unmixed marker (brown) and DAPI (blue).
The main benefit of this approach is the ability to choose antibodies based on suitability without regard to their species. In addition, since the Opal process contains a titratable enzymatic amplification step, the brightness of each marker can be adjusted for better imaging results. In this particular application note CD4 was stained with FITC, CD8 with Cy3, CD20 with Cy5, cytokeratin with coumarin, and nuclei with a DAPI counterstain, as shown in Figure 4.
RGB image
Simulated CD8
Unmixed image
Simulated CD4
Simulated H&E
Simulated CD20
Imaging
The second step is multispectral imaging (MSI) to quantitatively separate, or unmix, each marker (fluorophores or chromogens) into individual component images. Multispectral imaging, as supported by PerkinElmer's Mantra and Vectra systems remove cross-talk between chromogens or fluorophores, and interference from tissue autofluorescence, thus providing quantitative data from which the per-cell intensity values are derived7. Once fluorophores or chromogens are unmixed into components, inForm® advanced image analysis software provides display tools to create visually distinct views, such as pseudo-colored images and simulated conventional IHC views (Pathology Views™) to provide more familiar images to anyone trained in histopathology, either displaying them as a simulated H&E image or as a simulated DAB/hematoxylin image, as shown in Figure 5. In both cases, the hematoxylin view is formed by displaying the unmixed DAPI image as the familiar blue-on-white hematoxylin nuclear counterstain, rather than blue on black as seen in fluorescence. The eosin image is formed by displaying the unmixed autofluorescence as pale pink, and the DAB image is formed by inverting a user-selected fluorophore image and displaying it in brown.
Analyze
In the third step, inForm Tissue Finder™, advanced user-trainable morphologic image analysis software, utilizes the multimarker data to calculate per-cell and per-cellular-compartment (i.e., nuclear, cytoplasmic, and membranous) intensity values which are used to phenotype each cell (e.g., membrane CD4+ and nuclear FoxP3+ cell). The analysis software also utilizes sophisticated learning algorithms to train and recognize morphologic regions of the tissue (e.g., tumor, dermis, stroma, inflammation) which then allow the determination of the cell types within the tumor and
Figure 6. Three views of the analysis of the same sample. Left is the composite image, upper right shows the tissue segmentation into epithelial (red) and stromal (green) compartments, and the lower right shows the results of a cellular phenotyping, helper T cells (green), cytotoxic T cells (red), B cells (blue) and other cells (magenta) overlaid. RGB image Tissue segmented results Cellular phenotyping results.
RGB image Tissue segmented results
Cellular phenotyping results
stromal regions8. This is particularly useful in cancer immunology applications where it is important to know whether the immune cells are infiltrating into the tumor or are clustered in the adjacent stroma and microenvironment.
In addition to being able to score a cell positive or negative for expression markers, the software can also phenotype cells based on the information available, including expression levels, marker cellular localization, and cell morphology. The reliability of this approach substantially outperforms cell classifications based only on expression level. The phenotyping algorithm uses multinomial logistic regression across all features collected from cells, to determine which features are most information bearing and then provides the explicit weighted equation that best separates the phenotypes of interest. The phenotyping classifier is trained by having the user manually select examples of each phenotype of interest. For this application the training set consisted of cells known to be helper T cells (CD4+), cytotoxic T cells (CD8+), B cells (CD20+) and a range of other cells. Results for this example are shown in Figure 6. A summary of the counts of each phenotype of cells can be seen in Figure 3.
Explore
There are several options for exploring the rich data provided by this approach, ranging from the simple (Microsoft® Excel®), to tools that help visualize the multidimensionality of the data to search for differences between samples and patterns (PerkinElmer’s TIBCO Spotfire® Analyst for Quantitative Pathology), to analytically extensive and flexible scripting environments (R, an open source scripting language with a full complement of statistical and display functions). In most cases, the goal is to extract parameters that combine marker expression information (e.g., PD-L1 positivity) and contextual information, such as relative cellular interaction distances between phenotypes of interest, and densities of various phenotypes in proximity to the invasive edge.
Excel® is quite convenient and simple for calculating simple parameters, such as densities, or phenotype counts, using the Excel® pivot table function. TIBCO Spotfire® Analyst for Quantitative Pathology, enables visualization of the extensive per-cell multidimensional data with a broad range of plots and
5
charts, and importantly enables side-by-side viewing of imagery and associated data, across multiple samples loaded into the workspace, and its easy-to-use data exploration tools let you quickly get answers to your initial questions – and also give you the intuitive, highly interactive means to discover unknown patterns in your data.
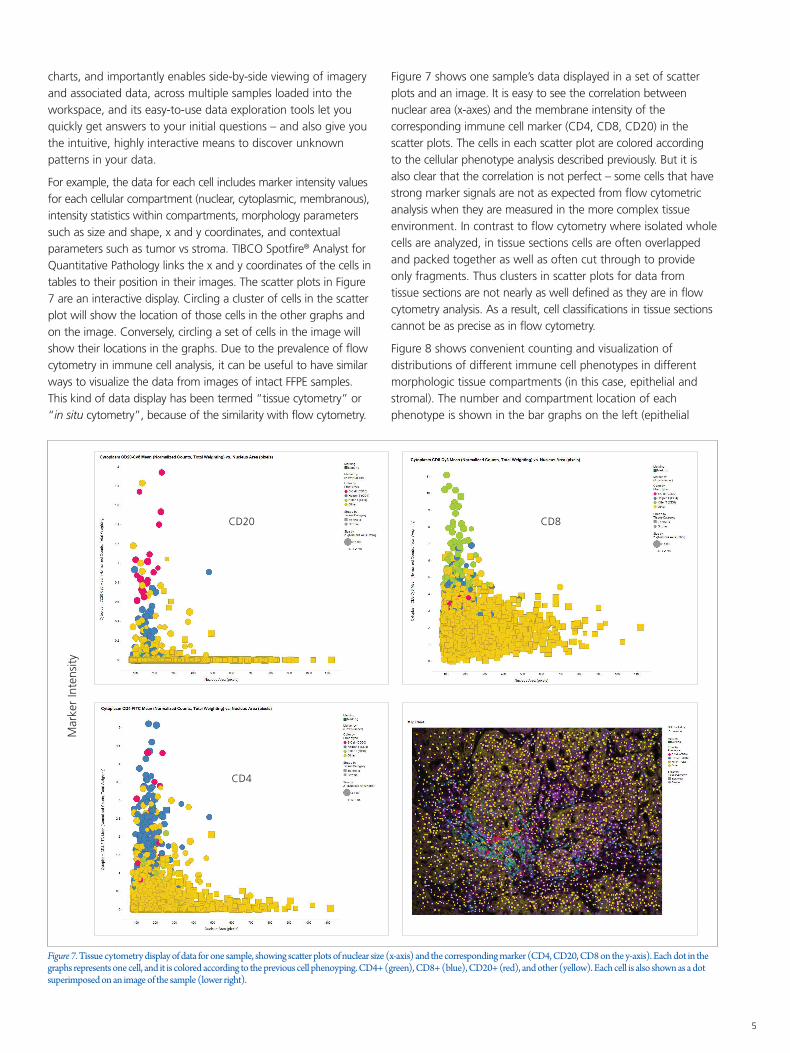
For example, the data for each cell includes marker intensity values for each cellular compartment (nuclear, cytoplasmic, membranous), intensity statistics within compartments, morphology parameters such as size and shape, x and y coordinates, and contextual parameters such as tumor vs stroma. TIBCO Spotfire® Analyst for Quantitative Pathology links the x and y coordinates of the cells in tables to their position in their images. The scatter plots in Figure 7 are an interactive display. Circling a cluster of cells in the scatter plot will show the location of those cells in the other graphs and on the image. Conversely, circling a set of cells in the image will show their locations in the graphs. Due to the prevalence of flow cytometry in immune cell analysis, it can be useful to have similar ways to visualize the data from images of intact FFPE samples. This kind of data display has been termed “tissue cytometry” or “in situ cytometry”, because of the similarity with flow cytometry.
Figure 7 shows one sample’s data displayed in a set of scatter plots and an image. It is easy to see the correlation between nuclear area (x-axes) and the membrane intensity of the corresponding immune cell marker (CD4, CD8, CD20) in the scatter plots. The cells in each scatter plot are colored according to the cellular phenotype analysis described previously. But it is also clear that the correlation is not perfect – some cells that have strong marker signals are not as expected from flow cytometric analysis when they are measured in the more complex tissue environment. In contrast to flow cytometry where isolated whole cells are analyzed, in tissue sections cells are often overlapped and packed together as well as often cut through to provide only fragments. Thus clusters in scatter plots for data from tissue sections are not nearly as well defined as they are in flow cytometry analysis. As a result, cell classifications in tissue sections cannot be as precise as in flow cytometry.
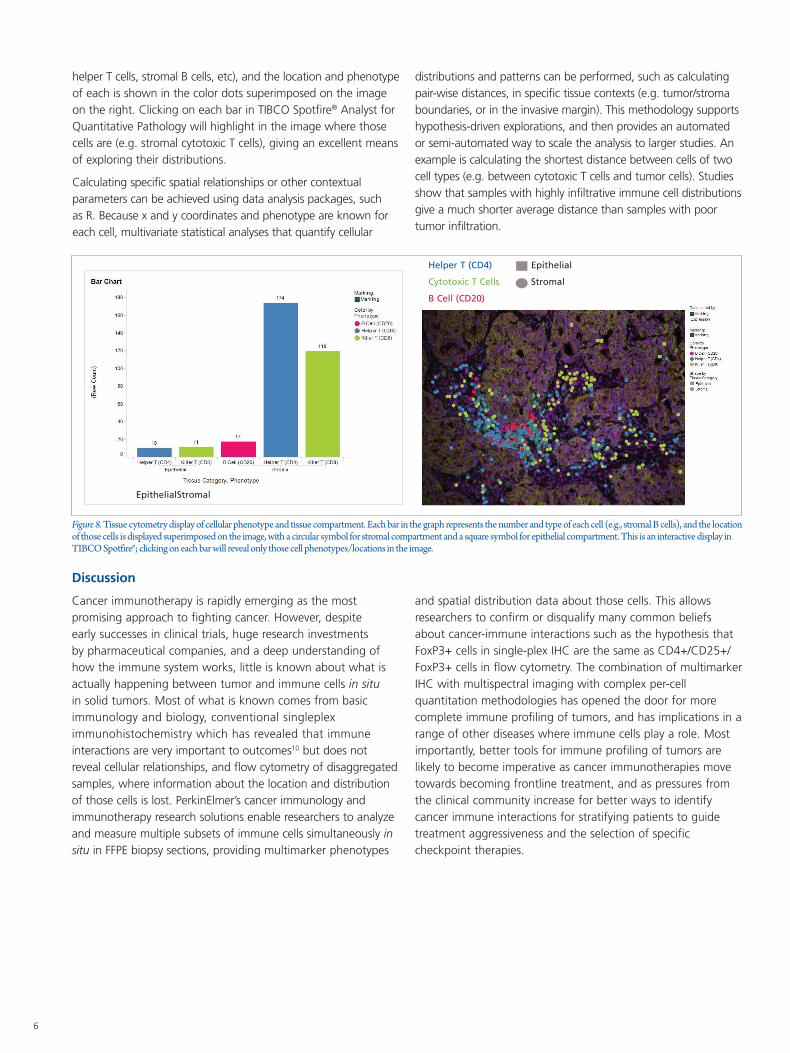
Figure 8 shows convenient counting and visualization of distributions of different immune cell phenotypes in different morphologic tissue compartments (in this case, epithelial and stromal). The number and compartment location of each phenotype is shown in the bar graphs on the left (epithelial
Figure 7. Tissue cytometry display of data for one sample, showing scatter plots of nuclear size (x-axis) and the corresponding marker (CD4, CD20, CD8 on the y-axis). Each dot in the graphs represents one cell, and it is colored according to the previous cell phenoyping. CD4+ (green), CD8+ (blue), CD20+ (red), and other (yellow). Each cell is also shown as a dot superimposed on an image of the sample (lower right).
CD20
CD4
CD8
Mar
ker
Inte
nsity
6
Figure 8. Tissue cytometry display of cellular phenotype and tissue compartment. Each bar in the graph represents the number and type of each cell (e.g., stromal B cells), and the location of those cells is displayed superimposed on the image, with a circular symbol for stromal compartment and a square symbol for epithelial compartment. This is an interactive display in TIBCO Spotfire®; clicking on each bar will reveal only those cell phenotypes/locations in the image.
Helper T (CD4)
Cytotoxic T Cells
B Cell (CD20)
Epithelial
Stromal
EpithelialStromal
Discussion
Cancer immunotherapy is rapidly emerging as the most promising approach to fighting cancer. However, despite early successes in clinical trials, huge research investments by pharmaceutical companies, and a deep understanding of how the immune system works, little is known about what is actually happening between tumor and immune cells in situ in solid tumors. Most of what is known comes from basic immunology and biology, conventional singleplex immunohistochemistry which has revealed that immune interactions are very important to outcomes10 but does not reveal cellular relationships, and flow cytometry of disaggregated samples, where information about the location and distribution of those cells is lost. PerkinElmer’s cancer immunology and immunotherapy research solutions enable researchers to analyze and measure multiple subsets of immune cells simultaneously in situ in FFPE biopsy sections, providing multimarker phenotypes
and spatial distribution data about those cells. This allows researchers to confirm or disqualify many common beliefs about cancer-immune interactions such as the hypothesis that FoxP3+ cells in single-plex IHC are the same as CD4+/CD25+/FoxP3+ cells in flow cytometry. The combination of multimarker IHC with multispectral imaging with complex per-cell quantitation methodologies has opened the door for more complete immune profiling of tumors, and has implications in a range of other diseases where immune cells play a role. Most importantly, better tools for immune profiling of tumors are likely to become imperative as cancer immunotherapies move towards becoming frontline treatment, and as pressures from the clinical community increase for better ways to identify cancer immune interactions for stratifying patients to guide treatment aggressiveness and the selection of specific checkpoint therapies.
helper T cells, stromal B cells, etc), and the location and phenotype of each is shown in the color dots superimposed on the image on the right. Clicking on each bar in TIBCO Spotfire® Analyst for Quantitative Pathology will highlight in the image where those cells are (e.g. stromal cytotoxic T cells), giving an excellent means of exploring their distributions.
Calculating specific spatial relationships or other contextual parameters can be achieved using data analysis packages, such as R. Because x and y coordinates and phenotype are known for each cell, multivariate statistical analyses that quantify cellular
distributions and patterns can be performed, such as calculating pair-wise distances, in specific tissue contexts (e.g. tumor/stroma boundaries, or in the invasive margin). This methodology supports hypothesis-driven explorations, and then provides an automated or semi-automated way to scale the analysis to larger studies. An example is calculating the shortest distance between cells of two cell types (e.g. between cytotoxic T cells and tumor cells). Studies show that samples with highly infiltrative immune cell distributions give a much shorter average distance than samples with poor tumor infiltration.
For a complete listing of our global offices, visit www.perkinelmer.com/ContactUs
Copyright ©2015, PerkinElmer, Inc. All rights reserved. PerkinElmer® is a registered trademark of PerkinElmer, Inc. All other trademarks are the property of their respective owners. 011977_01 PKI
PerkinElmer, Inc. 940 Winter Street Waltham, MA 02451 USA P: (800) 762-4000 or (+1) 203-925-4602www.perkinelmer.com
References
1. Naidoo, J; Page, DB; Wolchok, JD “Immune modulation for cancer therapy” British Journal of Cancer (2014), 1–6
2. Jensen, M. C. and Riddell, S. R. Immunological Reviews (2014), Design and implementation of adoptive therapy with chimeric antigen receptor-modified T cells. Immunological Reviews, 257: 127–144. doi: 10.1111/imr.12139
3. Harris and Drake Journal for ImmunoTherapy of Cancer (2013), 1:12
4. Nielsen JS, Sahota RA, Milne K, et al. CD20+ tumor-infiltrating lymphocytes have an atypical CD27−memory phenotype and together with CD8+ T cells promote favorable prognosis in ovarian cancer. Clin Cancer Res. (2013), 18:3281-3292
5. Mansfield, Multispectral Imaging: A Review of Its Technical Aspects and Applications in Anatomic Pathology. J. Vet. Pathol., (2014) Jan 15;51(1):185-210.
6. Stack et al, Multiplexed immunohistochemistry, imaging, and quantitation: A review, with an assessment of Tyramide Signal Amplification, multispectral imaging and multiplex analysis. Methods, (2014), 70:46-58.
7. Mansfield JR, Hoyt C, Levenson RM. Visualization of microscopy-based spectral imaging data from multi-label tissue sections. Curr Prot Mol Biol. (2008), 84:14.19.1–14.19.15.
8. Rose, et al, J Pathol Informatics, (2013), 4(suppl): S4.
9. Rose CJ, Naidoo K, Clay V, Linton K, Radford JA, Byers RJ. A statistical framework for analyzing hypothesized interactions between cells imaged using multispectral microscopy and multiple immunohistochemical markers. J Pathol Inform (2013), 4:4
10. Galon, et al, Towards the introduction of the ‘Immunoscore’ in the classification of malignant tumours. J. Pathol., (2014) 232: 199–209
For research use only. Not for use in diagnostic procedures.