Embed Size (px)
Citation preview

Application Note Monitoring strategy – Diagnosing gearbox damage

Application Note | Monitoring strategy – Diagnosing gearbox damage 2
Application Note Monitoring strategy – Diagnosing gearbox damage ABSTRACT This application note demonstrates the importance of a systematic approach to the task of gearbox vibration analysis, in addition to the other essential requirements such a modern vibration analyser, specialised training on the part of the technician and having access to detailed information about the gearbox internal construction.
Diagnosing a fault in a 3-stage gearbox
therefore required urgent attention on the part of the production and maintenance departments. Initial examination Because of the drastic increase in the BCU value, it was suspected that a rolling-element bearing was badly damaged. The gearbox was stopped and after examination of the main rolling-element bearings using an endoscope no damage was evident at the bearings’ components. The decision was taken to conduct a detailed vibration analysis with the running gearbox to try to determine the source of the sudden increase in BCU value.
Figure 1. Partial view of the gearbox internal construction.
Technical data of the gearbox: • Drive motor speed: 1,160 rpm
(rotational frequency 19.2 Hz) • No. of pinion gear teeth: 20
(rotational frequency 19.2 Hz) • No. of counter gear teeth: 13
(rotational frequency 3.4 Hz) Background to the case The gearbox had been permanently monitored for vibration by a dual-channel vibration monitoring system using accelerometers mounted at the outside casing. This device monitors the overall (broad-band) vibration value in the frequency
Possible faults Calculation Fault frequency (Hz)
Input drive shaft unbalance - 19.2 Output drive shaft unbalance - 3.4 Tooth-mesh frequency 19.2 · 20 384 2nd harmonic of tooth-mesh 384 · 2 768 3rd harmonic of tooth-mesh 384 · 3 1,152 Defective input gear - Sidebands of 19.2 Defective output gear - Sidebands of 3.4 Table 1. Possible fault frequencies (rolling-element bearing frequencies were not included).
range 10 – 1,000 Hz in terms of vibration velocity RMS and in addition the bearing condition value in units of BCU (bearing condition units). The highest overall vibration velocity value measured by the accelerometers was unchanged at approximately 1.5 mm/s. This value is within the recommended value for zone A of ISO 10816 part 3 and did therefore not exceed any of the limits set in the dual-channel monitoring device. However the monitored BCU value has suddenly increased from the normal value of 0.8 BCU to a value that fluctuated between 10 and 20 BCU. This value initiated the BCU alarm relay in the monitor and

3
Calculations were first done, using technical information from the gearbox supplier, to determine the possible vibration frequencies that would be generated by faults in the gearbox. The following table shows the results of the calculations. Vibration analysis of the gearbox In carrying out a vibration analysis at a gearbox such as this, it is normally sufficient to analyse the signal from only one of the mounted accelerometers since the casing of the gearbox is usually sufficiently rigid to transmits both accelerometer signals with adequate fidelity and no significant loss of information. A second spectrum in terms of vibration acceleration was acquired to determine the
Figure 2. Spectrum and resultant Cepstrum in terms of vibration velocity.
Figure 3. Spectrum and Cepstrum in terms of vibration acceleration.
Application Note | Monitoring strategy – Diagnosing gearbox damage
comparative vibration value in acceleration units and the
Cepstrum was also post-processed. This is a sensible step due to the fact that acceleration forces in gearboxes are sometimes higher than vibration velocity forces. However this spectrum produced no additional information than shown by the vibration velocity spectrum and was thus also not useful to definitively diagnose the source of the fault. Because of this the decision was made to acquire two special type of envelope spectra which are specifically designed for the analysis and diagnosis of faults in rolling-element bearings, although the initial visual examination of the bearings had revealed no damage. In the early stages of rolling-element bearing damage, it may happen that the BCU value shows a sharp increase even though there is no visible damage to the bearing components. This is due to

4
the extreme sensitivity of the BCU measurement to initial damage in rolling-element bearings in spite of sometimes no damage being visible in the very early stages. The initial BCS envelope spectrum – which is based upon the BCU value – and its resultant Cepstrum, showed clear evidence of regular impacts taking place in the gearbox. The sideband cursor, centred at the 378 Hz tooth-mesh frequency of the input gear in the envelope spectrum in Figure 4, shows the regular impact activity modulating the 378 Hz signal with a 19.187 Hz signal. Note that the tooth-mesh was slightly off the calculated frequency of 384 Hz. This is obviously due to small changes to the input speed of the gearbox.
Figure 4. BCS envelope spectrum showing clear sideband activity around approximately 378 Hz.
Figure 5. SED envelope spectrum confirming the result of the BCS envelope spectrum.
Application Note | Monitoring strategy – Diagnosing gearbox damage
To confirm this information a second type of envelope spectrum
was acquired known as an SED (selective envelope detection). This type of envelope spectrum differs only in that the filter frequency range for the measurement is adjustable whereas in the case of the BCS envelope spectrum the high-frequency bandpass filter has a fixed frequency range. The results, as shown in Figure 5, are almost identical to the BCS envelope spectrum. At the time of the measurement the input speed of the gearbox had again changed slightly, evident by the tooth-mesh frequency at 381 Hz, and the sideband activity is clearly shown at a frequency of approximately 18.97 Hz either side of the tooth-mesh frequency.
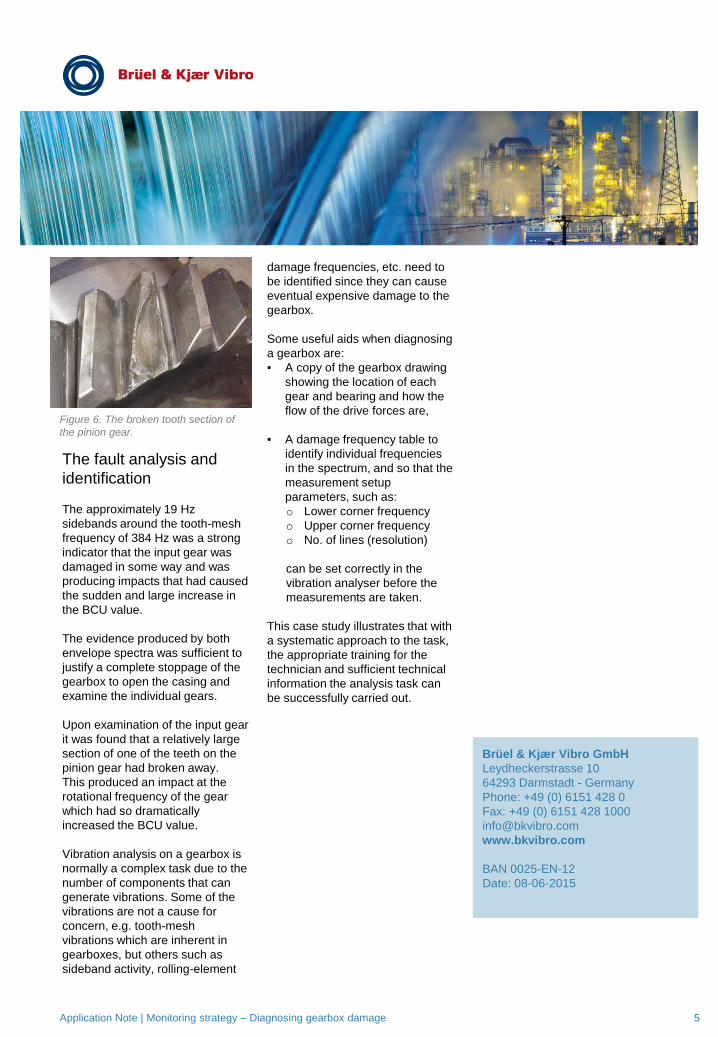
The fault analysis and identification The approximately 19 Hz sidebands around the tooth-mesh frequency of 384 Hz was a strong indicator that the input gear was damaged in some way and was producing impacts that had caused the sudden and large increase in the BCU value. The evidence produced by both envelope spectra was sufficient to justify a complete stoppage of the gearbox to open the casing and examine the individual gears. Upon examination of the input gear it was found that a relatively large section of one of the teeth on the pinion gear had broken away. This produced an impact at the rotational frequency of the gear which had so dramatically increased the BCU value. Vibration analysis on a gearbox is normally a complex task due to the number of components that can generate vibrations. Some of the vibrations are not a cause for concern, e.g. tooth-mesh vibrations which are inherent in gearboxes, but others such as sideband activity, rolling-element
Figure 6. The broken tooth section of the pinion gear.
damage frequencies, etc. need to be identified since they can cause eventual expensive damage to the gearbox. Some useful aids when diagnosing a gearbox are: • A copy of the gearbox drawing
showing the location of each gear and bearing and how the flow of the drive forces are,
• A damage frequency table to
identify individual frequencies in the spectrum, and so that the measurement setup parameters, such as: o Lower corner frequency o Upper corner frequency o No. of lines (resolution) can be set correctly in the vibration analyser before the measurements are taken.
This case study illustrates that with a systematic approach to the task, the appropriate training for the technician and sufficient technical information the analysis task can be successfully carried out.
Brüel & Kjær Vibro GmbH Leydheckerstrasse 10 64293 Darmstadt - Germany Phone: +49 (0) 6151 428 0 Fax: +49 (0) 6151 428 1000 [email protected] www.bkvibro.com BAN 0025-EN-12 Date: 08-06-2015
Application Note | Monitoring strategy – Diagnosing gearbox damage 5
![Planetary Gearboxes Catalogue 150220 - Andantex · PDF fileQuality 6f24 DIN 3962 / 63 / 67 fp [mm] Adjacent pitch error 0.006 Function Package with gearbox, rack and pinion from Güdel](https://img.pdfslide.us/doc/110x75/5aa885ea7f8b9a7c188bb589/planetary-gearboxes-catalogue-150220-andantex-6f24-din-3962-63-67-fp-mm.jpg)