Embed Size (px)
Citation preview
BioPharma CompassTM is a fully automated solution for the rapid characterization of biopharmaceutical products such as proteins, peptides, RNA and DNA (Figure 1). This push button solution assists non-specialist operators to generate high quality, accurate data for automatic comparison with laboratory reference standards. Automated, visual reports are then generated for each sample and important information regarding a products purity and identity can be observed at a glance. In this application note we will apply the BioPharma Compass workflow to the QC characterization of three proteins including; intact IgG 1, digested transferrin and digested bovine serum albumin.
Introduction
By 2014, it is expected that the top six best selling drugs will be biotech products. These figures illustrate the importance that biotech products will play in the future of the pharmaceutical industry [1]. The characterization of biopharmaceutical compounds is a pre-requisite for obtaining a drug license, but characterization is also essential at each stage of the biopharma pipeline, such as development optimization, stability testing, impurity detection and QC batch to batch comparison.Characterization of biopharmaceuticals, particularly proteins, is challenging in comparison with their small
Application Note # ET-20
BioPharma Compass: A fully Automated Solution for Characterization and QC of Intact and Digested Proteins
molecule counterparts due to the high molecular weight and heterogeneous nature of the proteins. Subtle changes in the manufacturing process can introduce unexpected and unwanted modifications to the protein product. Characterization of protein therapeutics and comparison with reference standards is therefore required and usually includes accurate analysis of the intact protein mass followed by complete amino acid sequence coverage, usually obtained by digestion of the protein by an enzyme (Figure 2). These two complimentary workflows ensure that the correct product has been produced, with the correct modifications and detects any unexpected impurities which may affect the efficacy or safety of the protein drug. LC-MS technologies which combine ultra high resolution LC chromatography (U-HPLC) with ultra high resolution electrospray mass spectrometry (UHR-TOF-MS) are perfectly established techniques for protein characterization, providing information about identity, sequence confirmation and impurities in a high throughput fashion [2-4]. In this application note we will demonstrate our BioPharma Compass QC workflow in combination with two industry leading platforms, the Dionex UltiMate 3000 UHPLC system and the maXis UHR-TOF.
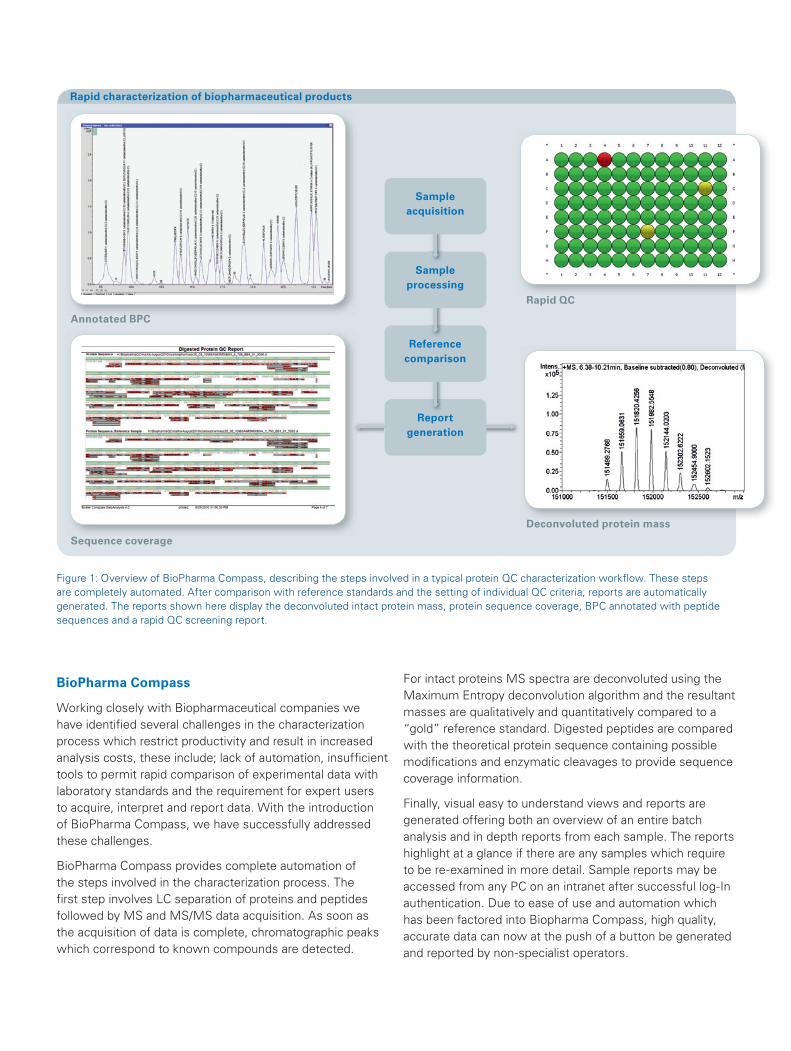
Rapid characterization of biopharmaceutical products
Reportgeneration
Referencecomparison
BioPharma Compass
Working closely with Biopharmaceutical companies we have identified several challenges in the characterization process which restrict productivity and result in increased analysis costs, these include; lack of automation, insufficient tools to permit rapid comparison of experimental data with laboratory standards and the requirement for expert users to acquire, interpret and report data. With the introduction of BioPharma Compass, we have successfully addressed these challenges.
BioPharma Compass provides complete automation of the steps involved in the characterization process. The first step involves LC separation of proteins and peptides followed by MS and MS/MS data acquisition. As soon as the acquisition of data is complete, chromatographic peaks which correspond to known compounds are detected.
For intact proteins MS spectra are deconvoluted using the Maximum Entropy deconvolution algorithm and the resultant masses are qualitatively and quantitatively compared to a “gold” reference standard. Digested peptides are compared with the theoretical protein sequence containing possible modifications and enzymatic cleavages to provide sequence coverage information.
Finally, visual easy to understand views and reports are generated offering both an overview of an entire batch analysis and in depth reports from each sample. The reports highlight at a glance if there are any samples which require to be re-examined in more detail. Sample reports may be accessed from any PC on an intranet after successful log-In authentication. Due to ease of use and automation which has been factored into Biopharma Compass, high quality, accurate data can now at the push of a button be generated and reported by non-specialist operators.
Figure 1: Overview of BioPharma Compass, describing the steps involved in a typical protein QC characterization workflow. These steps are completely automated. After comparison with reference standards and the setting of individual QC criteria, reports are automatically generated. The reports shown here display the deconvoluted intact protein mass, protein sequence coverage, BPC annotated with peptide sequences and a rapid QC screening report.
Sampleprocessing
Annotated BPC
Rapid QC
Sequence coverage
Deconvoluted protein mass
Sampleacquisition
QC results
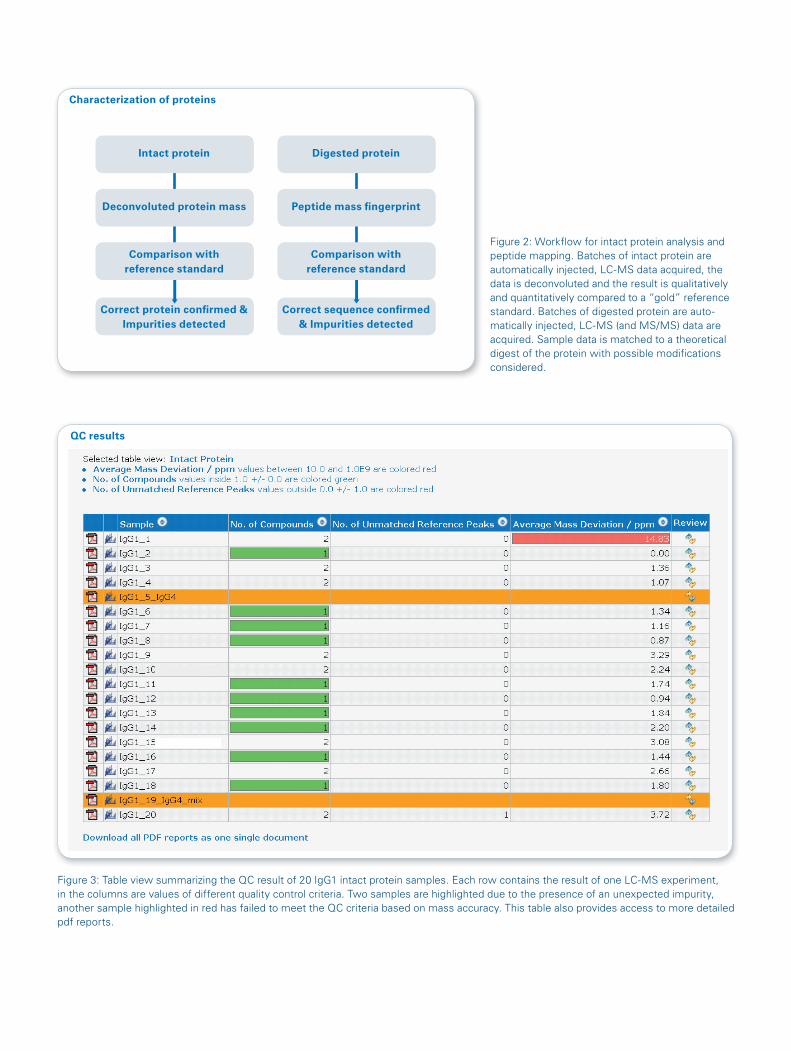
Figure 2: Workflow for intact protein analysis and peptide mapping. Batches of intact protein are automatically injected, LC-MS data acquired, the data is deconvoluted and the result is qualitatively and quantitatively compared to a “gold” reference standard. Batches of digested protein are auto-matically injected, LC-MS (and MS/MS) data are acquired. Sample data is matched to a theoretical digest of the protein with possible modifications considered.
Figure 3: Table view summarizing the QC result of 20 IgG1 intact protein samples. Each row contains the result of one LC-MS experiment, in the columns are values of different quality control criteria. Two samples are highlighted due to the presence of an unexpected impurity, another sample highlighted in red has failed to meet the QC criteria based on mass accuracy. This table also provides access to more detailed pdf reports.
Characterization of proteins
Intact protein
Deconvoluted protein mass
Correct protein confi rmed & Impurities detected
Correct sequence confi rmed & Impurities detected
Comparison with reference standard
Digested protein
Peptide mass fi ngerprint
Comparison with reference standard
UHPLC Dionex RSLC
Analytical ColumnDionex Acclaim RS LC120 C18 column, 2.2 μm, 2.1 x 100 mm
Column Oven 40°C
Flow Rate 300 μl/min
Solvent A 0.1% formic acid in H2O
Solvent B 0.1% formic acid in ACN/H2O 90:10
Results
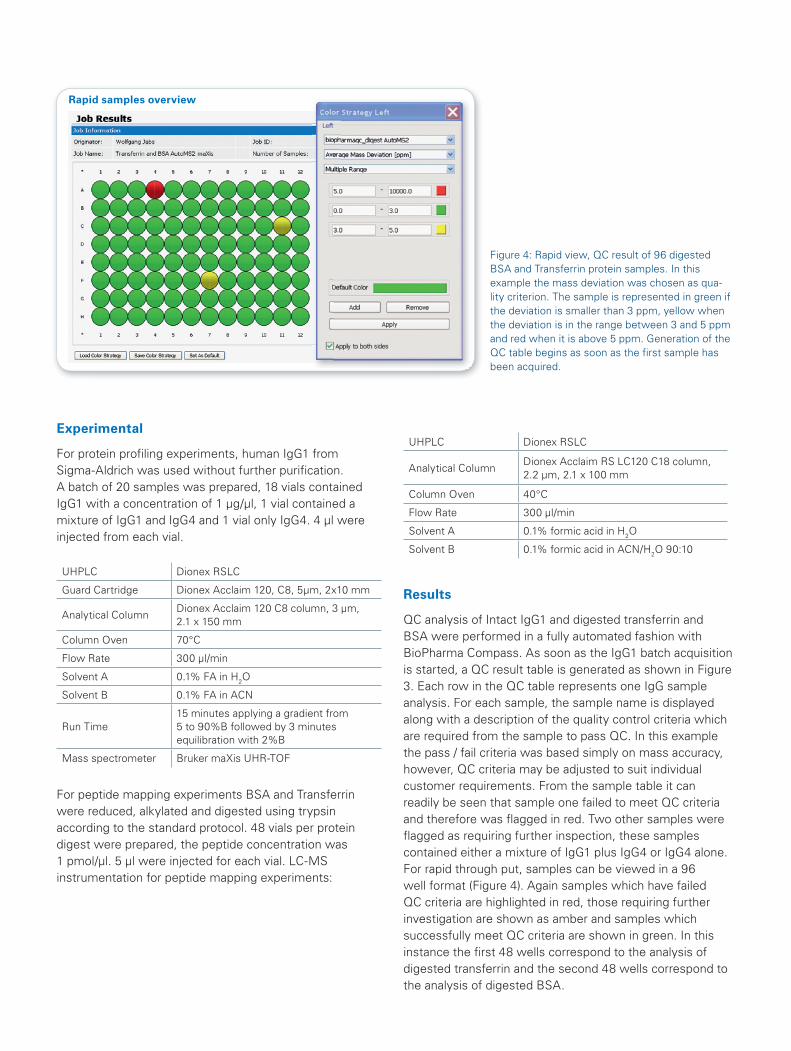
QC analysis of Intact IgG1 and digested transferrin and BSA were performed in a fully automated fashion with BioPharma Compass. As soon as the IgG1 batch acquisition is started, a QC result table is generated as shown in Figure 3. Each row in the QC table represents one IgG sample analysis. For each sample, the sample name is displayed along with a description of the quality control criteria which are required from the sample to pass QC. In this example the pass / fail criteria was based simply on mass accuracy, however, QC criteria may be adjusted to suit individual customer requirements. From the sample table it can readily be seen that sample one failed to meet QC criteria and therefore was flagged in red. Two other samples were flagged as requiring further inspection, these samples contained either a mixture of IgG1 plus IgG4 or IgG4 alone.For rapid through put, samples can be viewed in a 96 well format (Figure 4). Again samples which have failed QC criteria are highlighted in red, those requiring further investigation are shown as amber and samples which successfully meet QC criteria are shown in green. In this instance the first 48 wells correspond to the analysis of digested transferrin and the second 48 wells correspond to the analysis of digested BSA.
Experimental
For protein profiling experiments, human IgG1 from Sigma-Aldrich was used without further purification. A batch of 20 samples was prepared, 18 vials contained IgG1 with a concentration of 1 µg/µl, 1 vial contained a mixture of IgG1 and IgG4 and 1 vial only IgG4. 4 µl were injected from each vial.
UHPLC Dionex RSLC
Guard Cartridge Dionex Acclaim 120, C8, 5µm, 2x10 mm
Analytical ColumnDionex Acclaim 120 C8 column, 3 µm, 2.1 x 150 mm
Column Oven 70°C
Flow Rate 300 µl/min
Solvent A 0.1% FA in H2O
Solvent B 0.1% FA in ACN
Run Time15 minutes applying a gradient from 5 to 90%B followed by 3 minutes equilibration with 2%B
Mass spectrometer Bruker maXis UHR-TOF
For peptide mapping experiments BSA and Transferrin were reduced, alkylated and digested using trypsin according to the standard protocol. 48 vials per protein digest were prepared, the peptide concentration was 1 pmol/µl. 5 µl were injected for each vial. LC-MS instrumentation for peptide mapping experiments:
Figure 4: Rapid view, QC result of 96 digested BSA and Transferrin protein samples. In this example the mass deviation was chosen as qua-lity criterion. The sample is represented in green if the deviation is smaller than 3 ppm, yellow when the deviation is in the range between 3 and 5 ppm and red when it is above 5 ppm. Generation of the QC table begins as soon as the first sample has been acquired.
Rapid samples overview
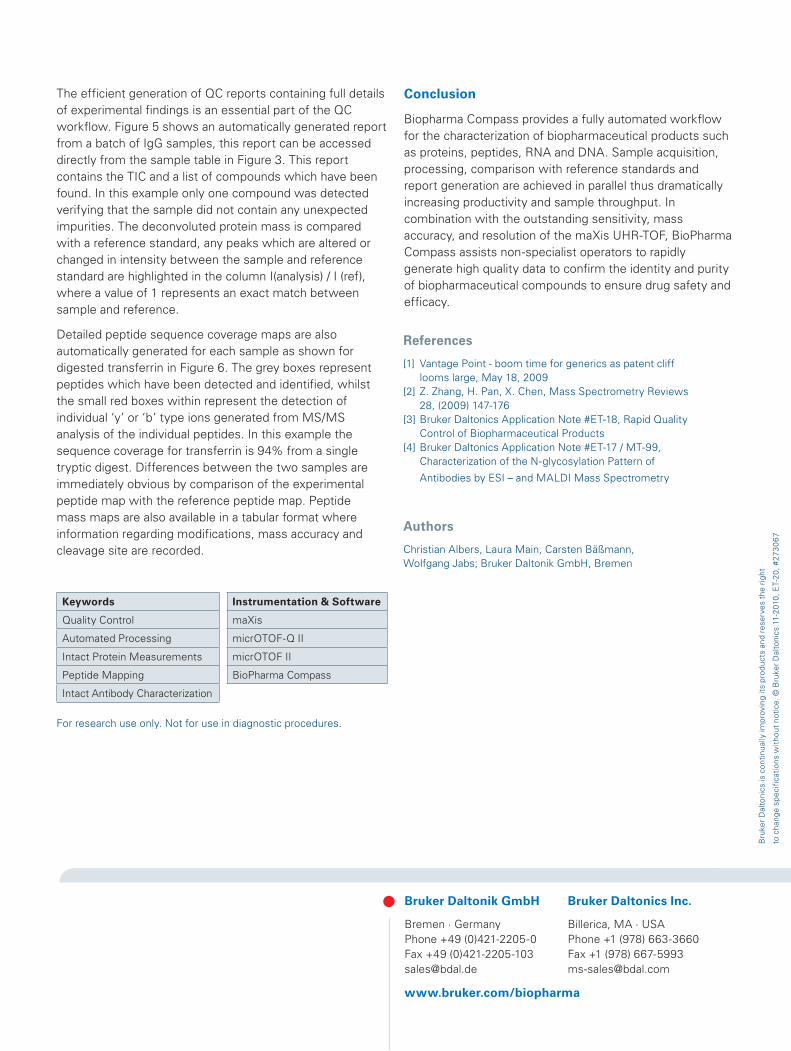
Peptide sequence coverage
Figure 6: Part of the pdf QC report for peptide mapping of digested Transferrin. The peptide maps of the sample and of reference standard are on the same page for easy comparison. The identified peptides are shown as grey boxes; the red boxes show the results of MS/MS data where individual ‘y’ and ‘b’ type ions have confirmed the presence of specific amino acids.
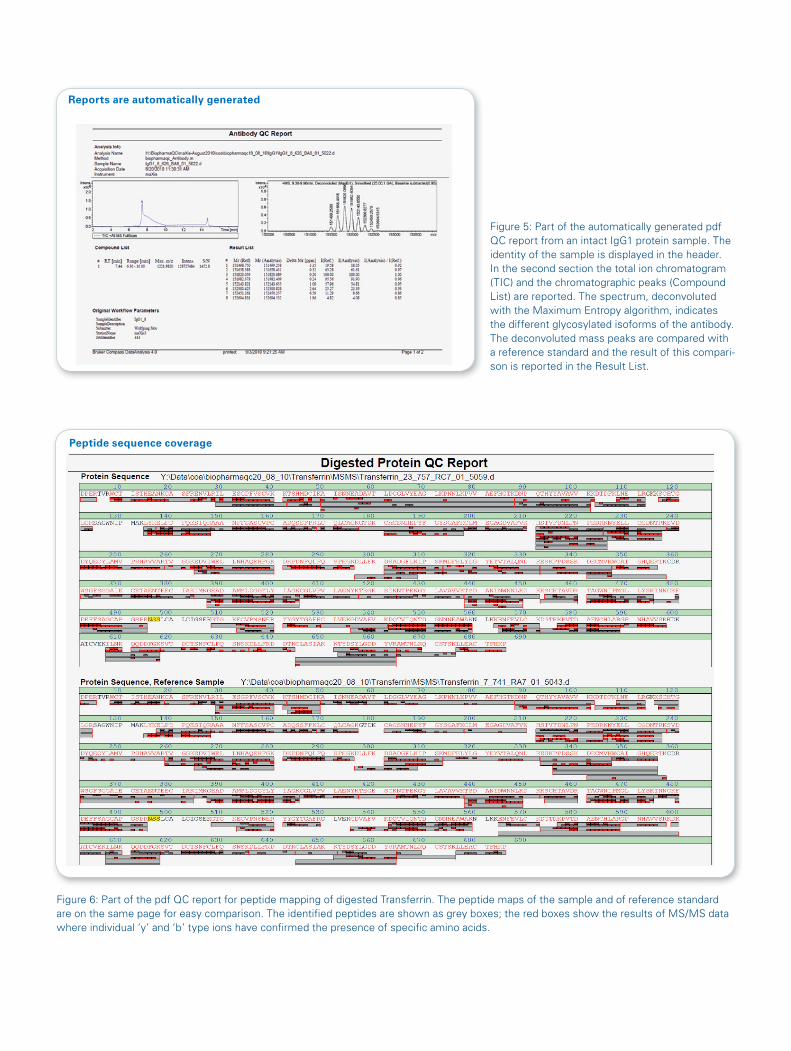
Figure 5: Part of the automatically generated pdf QC report from an intact IgG1 protein sample. The identity of the sample is displayed in the header. In the second section the total ion chromatogram (TIC) and the chromatographic peaks (Compound List) are reported. The spectrum, deconvoluted with the Maximum Entropy algorithm, indicates the different glycosylated isoforms of the antibody. The deconvoluted mass peaks are compared with a reference standard and the result of this compari-son is reported in the Result List.
Reports are automatically generated
Bru
ker
Dal
toni
cs is
con
tinua
lly im
prov
ing
its p
rodu
cts
and
rese
rves
the
rig
ht
to c
hang
e sp
ecifi
catio
ns w
ithou
t no
tice.
© B
ruke
r D
alto
nics
11-
2010
, ET-
20, #
2730
67
Keywords
Quality Control
Automated Processing
Intact Protein Measurements
Peptide Mapping
Intact Antibody Characterization
Instrumentation & Software
maXis
micrOTOF-Q II
micrOTOF II
BioPharma Compass
For research use only. Not for use in diagnostic procedures.
The efficient generation of QC reports containing full details of experimental findings is an essential part of the QC workflow. Figure 5 shows an automatically generated report from a batch of IgG samples, this report can be accessed directly from the sample table in Figure 3. This report contains the TIC and a list of compounds which have been found. In this example only one compound was detected verifying that the sample did not contain any unexpected impurities. The deconvoluted protein mass is compared with a reference standard, any peaks which are altered or changed in intensity between the sample and reference standard are highlighted in the column I(analysis) / I (ref), where a value of 1 represents an exact match between sample and reference.
Detailed peptide sequence coverage maps are also automatically generated for each sample as shown for digested transferrin in Figure 6. The grey boxes represent peptides which have been detected and identified, whilst the small red boxes within represent the detection of individual ‘y’ or ‘b’ type ions generated from MS/MS analysis of the individual peptides. In this example the sequence coverage for transferrin is 94% from a single tryptic digest. Differences between the two samples are immediately obvious by comparison of the experimental peptide map with the reference peptide map. Peptide mass maps are also available in a tabular format where information regarding modifications, mass accuracy and cleavage site are recorded.
Conclusion
Biopharma Compass provides a fully automated workflow for the characterization of biopharmaceutical products such as proteins, peptides, RNA and DNA. Sample acquisition, processing, comparison with reference standards and report generation are achieved in parallel thus dramatically increasing productivity and sample throughput. In combination with the outstanding sensitivity, mass accuracy, and resolution of the maXis UHR-TOF, BioPharma Compass assists non-specialist operators to rapidly generate high quality data to confirm the identity and purity of biopharmaceutical compounds to ensure drug safety and efficacy.
Bruker Daltonik GmbH
Bremen · GermanyPhone +49 (0)421-2205-0 Fax +49 (0)421-2205-103 [email protected]
Bruker Daltonics Inc.
Billerica, MA · USAPhone +1 (978) 663-3660 Fax +1 (978) 667-5993 [email protected]
www.bruker.com/biopharma
References
[1] Vantage Point - boom time for generics as patent cliff looms large, May 18, 2009 [2] Z. Zhang, H. Pan, X. Chen, Mass Spectrometry Reviews 28, (2009) 147-176[3] Bruker Daltonics Application Note #ET-18, Rapid Quality Control of Biopharmaceutical Products[4] Bruker Daltonics Application Note #ET-17 / MT-99, Characterization of the N-glycosylation Pattern of
Antibodies by ESI – and MALDI Mass Spectrometry
Authors
Christian Albers, Laura Main, Carsten Bäßmann, Wolfgang Jabs; Bruker Daltonik GmbH, Bremen