Embed Size (px)
Citation preview

Few industries are as affected by test standards as the automotive sector. Brakes, clutches, seatbelts, engines, tires, etc., are all tested for their material properties in accordance with ASTM, DIN, JIS, ISO and other standards. The problem is finding test equipment that has a versatile configuration to perform all of these standard tests as well as custom tests requested by OEMs. Bruker has addressed this issue with the UMT TriboLab® Mechanical Tester. With interchangeable modules, TriboLab can perform multiple tests on a single platform. This application note discusses a sampling of the many automotive component and material tests possible with a flexible, high-performance tribometer.
Experimental Applications
The purpose of the test was to compare the static and dynamic friction properties of three clutch plates with different surface preparations. Figure 1 shows three clutch samples that were tested. The first one has a concentric pattern, the second one has a diamond pattern, and the third is square grooved.
In each case, the clutch samples were mounted inside a container on the test platform and locked in place to prevent movement. Automatic transmission fluid was applied uniformly to the clutch specimens.
A 200 N force sensor and a torque sensor with a full scale of 4 N-m were mounted to the upper carriage to measure normal force (Fz), and torque (Tz), respectively. A steel disk (1-inch diameter) was mounted under the torque sensor and static and dynamic friction tests were conducted at 200 N load at 30 rpm. The dynamic friction tests were conducted for 30 minutes under cyclic motion with reversals every 15 minutes. Coefficient of friction (COF) data were obtained from the Tz and Fz data. The test setup is presented in Figure 2.
Table 1 presents the static and dynamic COF data for the three clutch samples. Static friction tests were repeated
Application Note #1002Automotive Applications for Tribometers
Figure 1. Photos of clutch pieces (a) concentric- (b) diamond- and (c) square-grooved.
A B C
Disc-on-Disc Clutch Test
COF Sample Plots
Clutch Sample

Lubricant Test on Friction Plates
Another example of tribology testing within the clutch assembly is the comparison of four different grades of transmission fluid. To best match real-world applications, the fluids were tested in combination with actual clutch components. Figure 5 presents an example of friction plates used in automotive clutch assemblies. One of these friction plates was fixed to the lower rotary drive platen. The rotational speed of the drive was set to the desired value between 1 to 5000 rpm (see Figure 6). The second plate was attached to the upper carriage of the test platform, directly mated to the force/torque sensor with a special sample holder. This holder was self-leveling to ensure a face-to-face contact during tests. In this test, a six-dimension torque/force sensor (up to 1,000 N*mm and 50 N) was used to measure the torque and force between the contact interfaces. This test configuration also included an acoustic emission (AE) sensor that detects the sound waves generated as the two surfaces interact.
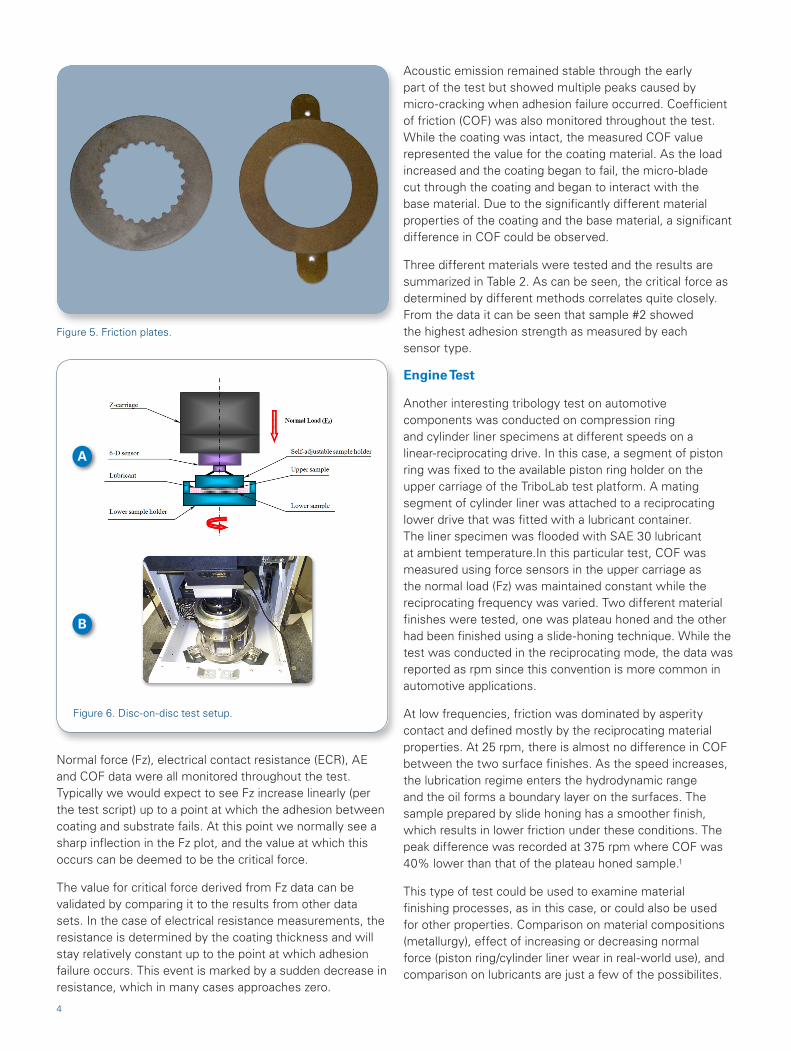
Of the four lubricants tested, sample 0 was a control sample while the other three (samples A, B and C) each contained additives intended to modify friction properties. A constant normal load (Fz) was maintained by closed-loop control of the Z-carriage. Tests were conducted at four different normal loads and readings were measured at several different rotational speeds.
Figure 7 shows the friction coefficient changes as a function of the load-to-speed ratio for all four tested lubricants. The curves in these figures show a similar trend. The friction coefficient is fairly constant at the lower ratio and it increases at the higher ratio. Lubricants with the additives (lubricant samples A, B, and C) slightly reduce the friction where the ratio is low. At the high-ratio regime, as compared with the base gear oil, lubricant sample A slightly reduces friction, while lubricants with higher viscosity (B and C) slightly increase friction.
three times for each specimen. Figure 3 shows the static COF versus time plots for concentric, square-, and diamond-grooved clutch pieces, respectively. In Figure 4 you can see the dynamic COF versus time plots for concentric, square- and diamond-grooved clutch pieces, respectively.
From the results we can see that although the concentric grooved sample provided the highest result for COF under static conditions, it was the lowest under dynamic testing. Conversely, the square-grooved sample had the lowest COF under static conditions but the highest dynamic friction. By performing this test the designer will have the data necessary to select the surface preparation that best meets the end-use application.
Table 1. Static and dynamic friction data of clutch pieces
Specimen
COF
Static Dynamic
1 2 3 Mean Mean
Concentric-grooved 0.218 0.269 0.218 0.235 0.265
Square-grooved 0.126 0.117 0.141 0.128 0.344
Diamond-grooved 0.204 0.208 0.218 0.210 0.311
Figure 2. Test setup for friction test of clutch pieces.
2

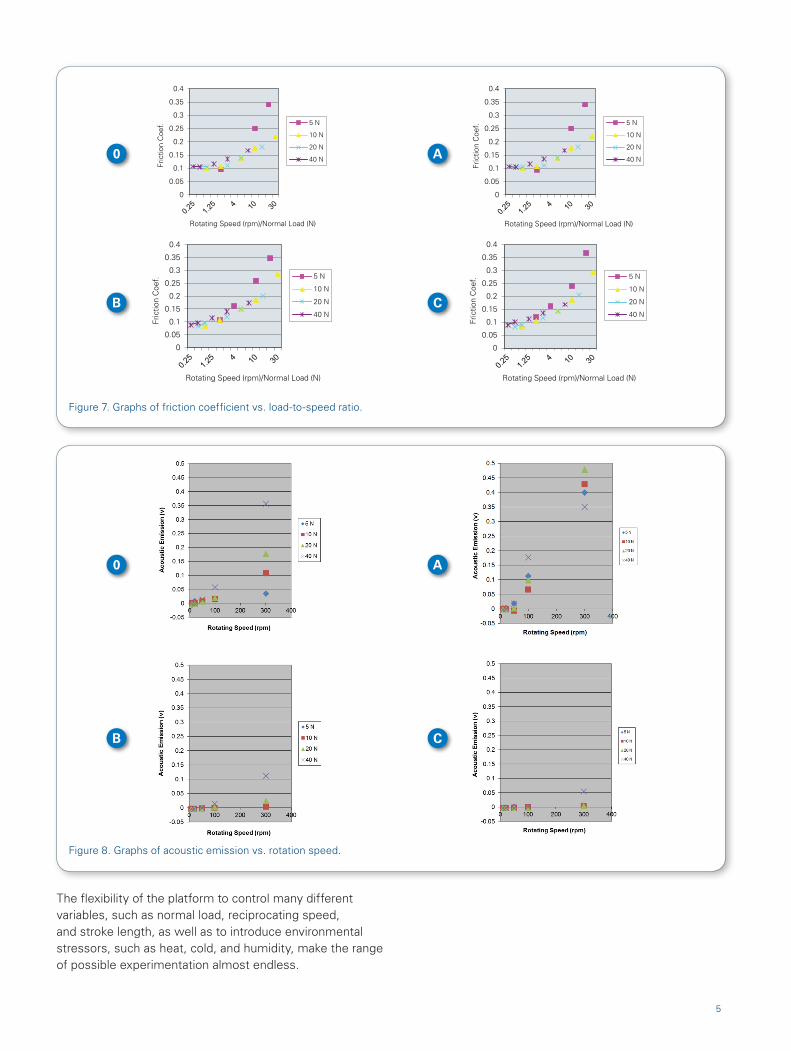
Figure 8 shows the summarized results from the acoustic emission (AE) sensor plotted against rotational speed of the lower sample for all four tested lubricants. As one might imagine, in all cases the acoustic emission increased with the speed. At low speed (<50 rpm) all four lubricants tested showed similar results. However, as speed increased, noticeable differences began to appear. Samples B and C showed significant decreases in acoustic emission, indicating smoother motion with less chatter. Sample A, on the other hand, actually showed an increase in acoustic emission.
By having the flexibility to accurately control normal force and speed, and by having the additional data from acoustic emission sensors, a more complete characterization of the lubricant formulations could be conducted. As the testing was on actual automotive components, the materials scientist could have confidence in the results and could down-select to only materials that showed promise,
thereby greatly reducing the amount of time required for bench testing on actual drive train assemblies.
Adhesion Test on Coated Tires
The TriboLab platform is also widely used in the tire industry to examine material properties under a wide variety of conditions, such as heat and humidity, as well as over a range of motions and loading. In one such test, the objective was to determine the adhesion strength of a coating applied to the base tire material. The coated tire samples were fixed on a stationary lower table while a micro-blade (400μm tip diameter) was attached to the upper carriage. During the test, the blade was moved laterally across the sample at a constant speed of 0.05mm/s over a 5mm sliding distance, while the sample remained stationary. The normal load, controlled using a closed-loop feedback servo, was increased linearly from 1g to 10g over the course of the test.
Figure 3. Static COF of (a) concentric-, (b) square- and (c) diamond-grooved clutch pieces.
Figure 4. Dynamic COF of (a) concentric-, (b) square- and (c) diamond-grooved clutch pieces.
A A
B B
C C
3
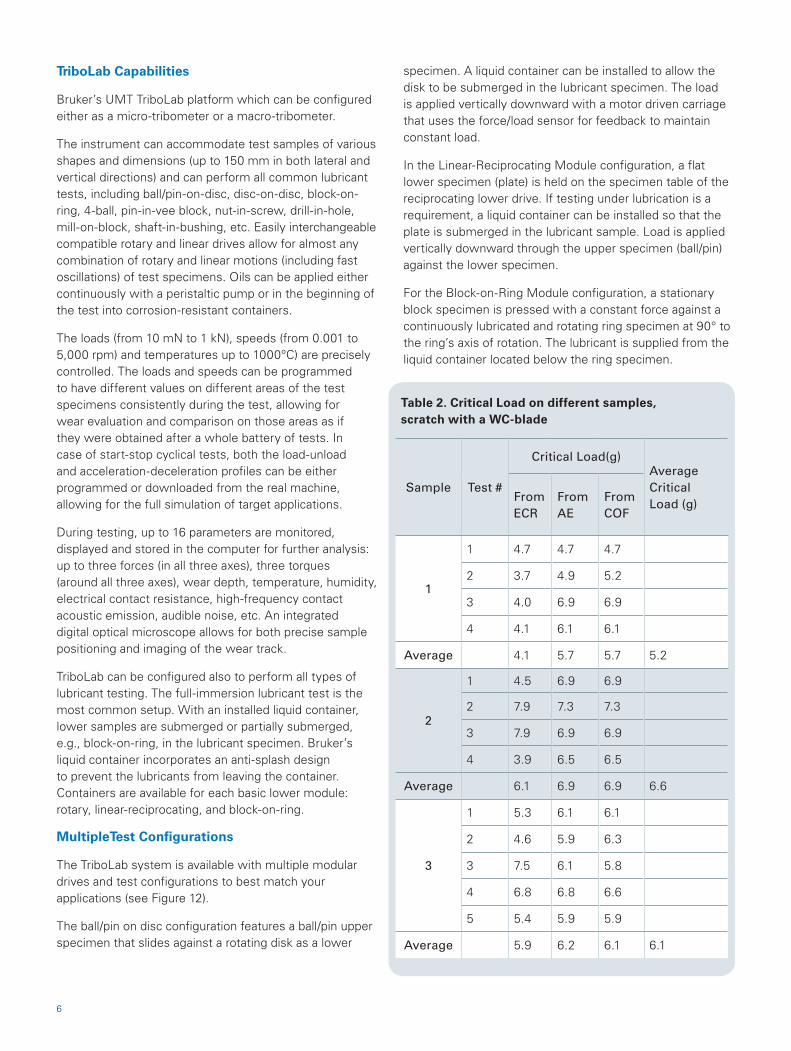
Acoustic emission remained stable through the early part of the test but showed multiple peaks caused by micro-cracking when adhesion failure occurred. Coefficient of friction (COF) was also monitored throughout the test. While the coating was intact, the measured COF value represented the value for the coating material. As the load increased and the coating began to fail, the micro-blade cut through the coating and began to interact with the base material. Due to the significantly different material properties of the coating and the base material, a significant difference in COF could be observed.
Three different materials were tested and the results are summarized in Table 2. As can be seen, the critical force as determined by different methods correlates quite closely. From the data it can be seen that sample #2 showed the highest adhesion strength as measured by each sensor type.
Engine Test
Another interesting tribology test on automotive components was conducted on compression ring and cylinder liner specimens at different speeds on a linear-reciprocating drive. In this case, a segment of piston ring was fixed to the available piston ring holder on the upper carriage of the TriboLab test platform. A mating segment of cylinder liner was attached to a reciprocating lower drive that was fitted with a lubricant container. The liner specimen was flooded with SAE 30 lubricant at ambient temperature.In this particular test, COF was measured using force sensors in the upper carriage as the normal load (Fz) was maintained constant while the reciprocating frequency was varied. Two different material finishes were tested, one was plateau honed and the other had been finished using a slide-honing technique. While the test was conducted in the reciprocating mode, the data was reported as rpm since this convention is more common in automotive applications.
At low frequencies, friction was dominated by asperity contact and defined mostly by the reciprocating material properties. At 25 rpm, there is almost no difference in COF between the two surface finishes. As the speed increases, the lubrication regime enters the hydrodynamic range and the oil forms a boundary layer on the surfaces. The sample prepared by slide honing has a smoother finish, which results in lower friction under these conditions. The peak difference was recorded at 375 rpm where COF was 40% lower than that of the plateau honed sample.1
This type of test could be used to examine material finishing processes, as in this case, or could also be used for other properties. Comparison on material compositions (metallurgy), effect of increasing or decreasing normal force (piston ring/cylinder liner wear in real-world use), and comparison on lubricants are just a few of the possibilites.
Normal force (Fz), electrical contact resistance (ECR), AE and COF data were all monitored throughout the test. Typically we would expect to see Fz increase linearly (per the test script) up to a point at which the adhesion between coating and substrate fails. At this point we normally see a sharp inflection in the Fz plot, and the value at which this occurs can be deemed to be the critical force.
The value for critical force derived from Fz data can be validated by comparing it to the results from other data sets. In the case of electrical resistance measurements, the resistance is determined by the coating thickness and will stay relatively constant up to the point at which adhesion failure occurs. This event is marked by a sudden decrease in resistance, which in many cases approaches zero.
Figure 5. Friction plates.
B
A
Figure 6. Disc-on-disc test setup.
4
The flexibility of the platform to control many different variables, such as normal load, reciprocating speed, and stroke length, as well as to introduce environmental stressors, such as heat, cold, and humidity, make the range of possible experimentation almost endless.
Figure 8. Graphs of acoustic emission vs. rotation speed.
Figure 7. Graphs of friction coefficient vs. load-to-speed ratio.
0
0.05
0.1
0.15
0.2
0.25
0.3
0.35
0.4
Fric
tion
Coe
f.
Rotating Speed (rpm)/Normal Load (N)
5 N
10 N
20 N
40 N
0
0.05
0.1
0.15
0.2
0.25
0.3
0.35
0.4
Fric
tion
Coe
f.
Rotating Speed (rpm)/Normal Load (N)
5 N
10 N
20 N
40 N
0
0.05
0.1
0.15
0.2
0.25
0.3
0.35
0.4
Fric
tion
Coe
f.
Rotating Speed (rpm)/Normal Load (N)
5 N
10 N
20 N
40 N
0
0.05
0.1
0.15
0.2
0.25
0.3
0.35
0.4
Fric
tion
Coe
f.
Rotating Speed (rpm)/Normal Load (N)
5 N
10 N
20 N
40 N
0
0
B
B
A
A
C
C
5
TriboLab Capabilities
Bruker’s UMT TriboLab platform which can be configured either as a micro-tribometer or a macro-tribometer.
The instrument can accommodate test samples of various shapes and dimensions (up to 150 mm in both lateral and vertical directions) and can perform all common lubricant tests, including ball/pin-on-disc, disc-on-disc, block-on-ring, 4-ball, pin-in-vee block, nut-in-screw, drill-in-hole, mill-on-block, shaft-in-bushing, etc. Easily interchangeable compatible rotary and linear drives allow for almost any combination of rotary and linear motions (including fast oscillations) of test specimens. Oils can be applied either continuously with a peristaltic pump or in the beginning of the test into corrosion-resistant containers.
The loads (from 10 mN to 1 kN), speeds (from 0.001 to 5,000 rpm) and temperatures up to 1000ºC) are precisely controlled. The loads and speeds can be programmed to have different values on different areas of the test specimens consistently during the test, allowing for wear evaluation and comparison on those areas as if they were obtained after a whole battery of tests. In case of start-stop cyclical tests, both the load-unload and acceleration-deceleration profiles can be either programmed or downloaded from the real machine, allowing for the full simulation of target applications.
During testing, up to 16 parameters are monitored, displayed and stored in the computer for further analysis: up to three forces (in all three axes), three torques (around all three axes), wear depth, temperature, humidity, electrical contact resistance, high-frequency contact acoustic emission, audible noise, etc. An integrated digital optical microscope allows for both precise sample positioning and imaging of the wear track.
TriboLab can be configured also to perform all types of lubricant testing. The full-immersion lubricant test is the most common setup. With an installed liquid container, lower samples are submerged or partially submerged, e.g., block-on-ring, in the lubricant specimen. Bruker’s liquid container incorporates an anti-splash design to prevent the lubricants from leaving the container. Containers are available for each basic lower module: rotary, linear-reciprocating, and block-on-ring.
MultipleTest Configurations
The TriboLab system is available with multiple modular drives and test configurations to best match your applications (see Figure 12).
The ball/pin on disc configuration features a ball/pin upper specimen that slides against a rotating disk as a lower
specimen. A liquid container can be installed to allow the disk to be submerged in the lubricant specimen. The load is applied vertically downward with a motor driven carriage that uses the force/load sensor for feedback to maintain constant load.
In the Linear-Reciprocating Module configuration, a flat lower specimen (plate) is held on the specimen table of the reciprocating lower drive. If testing under lubrication is a requirement, a liquid container can be installed so that the plate is submerged in the lubricant sample. Load is applied vertically downward through the upper specimen (ball/pin) against the lower specimen.
For the Block-on-Ring Module configuration, a stationary block specimen is pressed with a constant force against a continuously lubricated and rotating ring specimen at 90° to the ring’s axis of rotation. The lubricant is supplied from the liquid container located below the ring specimen.
Table 2. Critical Load on different samples, scratch with a WC-blade
Sample Test #
Critical Load(g)Average Critical Load (g)
From ECR
From AE
From COF
1
1 4.7 4.7 4.7
2 3.7 4.9 5.2
3 4.0 6.9 6.9
4 4.1 6.1 6.1
Average 4.1 5.7 5.7 5.2
2
1 4.5 6.9 6.9
2 7.9 7.3 7.3
3 7.9 6.9 6.9
4 3.9 6.5 6.5
Average 6.1 6.9 6.9 6.6
3
1 5.3 6.1 6.1
2 4.6 5.9 6.3
3 7.5 6.1 5.8
4 6.8 6.8 6.6
5 5.4 5.9 5.9
Average 5.9 6.2 6.1 6.1
6

Finally, in the 4-Ball Attachment configuration, three ball specimens are held in a ball cup mounted on a specimen table on a lower rotary module. The ball cup is filled with the lubricant specimen. A fourth ball specimen is held stationary on the upper carriage centered to the rotary module’s axis of rotation. Load is applied vertically downward through the upper ball against the three balls.
With interchangeable modules, TriboLab can run a wide variety of ASTM tests. Table 3 lists only some of the ASTM standards that are applicable to automotive material testing.
Conclusion
Testing has an important role in automotive applications. In addition to the materials property testing, surface finish characterization, and lubricant qualification examples discussed above, Bruker’s UMT TriboLab can perform everything from wear testing of wiper blades and measuring recovery of seal materials after multiple compressions to investigating the durability of paints, clear-coats and other finishes. The list of possible applications is literally endless. Thanks to its interchangeable modules and the ability to program and control complex forces and motions through
servo-control, TriboLab has found widespread use in automotive applications around the world. Users have the option to run existing ASTM, DIN and SAE test standards, or customized tests, while gathering accurate data for a wide array of analyses. Multiple sensors, automated test procedures and data presentation makes this tribometer platform a key instrument for everyone from parts suppliers to OEMs, whether they are performing high-load drive train applications or perfecting cosmetic finishes.
Figure 9. Compression ring and liner test schematic.
Figure 11. UMT TriboLab Mechanical Tester.
Figure 10. Friction reciprocating bench test.
7

References
1. E. Tomanik and A. Ferrarese, “Low Friction Ring Pack for Gasoline Engines,” ASME ICEF Fall 2006, ICEF2006-1566 (2006), 2.
2. J. Jocsak, E. Tomanik, V.W. Wong, and T. Tian, “The Characterization and Simulation of Cylinder Liner Surface Finishes” ASME ICE 2005, ICES2005-1080 (2005), 6.
Authors
James Earle, Bruker Nano Surfaces Division([email protected])
Suresh Kuiry, Ph.D., Bruker Nano Surfaces Division([email protected])
Table 3. Sample ASTM tribological test standards
ASTM# Description
D2266-91& D4172-94
Wear Preventive Characteristics of Lubricants (4-ball)
D2509-03Load-Carrying Capacity of Lubricating Grease
D5706-97Determining Extreme Pressure Properties of Lubricating Greases
D5707-97Friction And Wear Properties of Lubricating Grease
D6078-99 Lubricity of Diesel Fuels
D6425-99Friction and Wear Properties of Extreme Pressure (EP) Lubricating Oils
G181-04Friction Test of Piston and Cylinder Liner Materials Under Lubricated Conditions
G204-10Determining Damage to Contacting Solid Surfaces under Fretting Conditions
A B C D
Figure 12. Modular drives are easily exchanged using tool-less clamping: (a) Rotary Drive, (b) Reciprocating Drive, (c) Block-on-Ring Drive, (d) Linear Drive.
9
Bruker Nano Surfaces DivisonSan Jose, CA · [email protected]
©20
18 B
ruke
r C
orpo
ratio
n. A
ll rig
hts
rese
rved
. UM
T Tr
iboL
ab is
a t
rade
mar
k of
Bru
ker
Cor
pora
tion.
All
othe
r
trad
emar
ks a
re t
he p
rope
rty
of t
heir
resp
ectiv
e co
mpa
nies
. AN
1002
, Rev
. A2
www.bruker.com/TriboLab