Embed Size (px)
Citation preview
Application Guidelines for Microprocessor-Based, High-Impedance
Bus Differential Relays
Stanley E. Zocholl and David Costello Schweitzer Engineering Laboratories, Inc.
Published in SEL Journal of Reliable Power, Volume 2, Number 3, September 2011
Previously presented at the 36th Annual Western Protective Relay Conference, October 2009,
and 63rd Annual Georgia Tech Protective Relaying Conference, April 2009
Previous revised edition released April 2009
Originally presented at the 62nd Annual Conference for Protective Relay Engineers, March 2009
1
Application Guidelines for Microprocessor-Based, High-Impedance Bus Differential Relays
Stanley E. Zocholl and David Costello, Schweitzer Engineering Laboratories, Inc.
Abstract—High-impedance bus differential relays have been applied successfully for decades. These relays are preferred for many reasons, including their speed, security, and ease of setting and wiring, as well as the high number of breakers that can be included in the zone of protection. However, these relays present challenging application considerations. The relationship between the CT knee-point voltage and the relay setting voltage remains mysterious to many.
This paper provides a review of the high-impedance differen-tial principle. It details the performance of CTs used in high-impedance applications and shares the CT and relay current waveforms experienced during primary high-current laboratory testing. The paper explains the resulting digitally filtered signal used by the relay. It also investigates dependability for internal faults, including sensitivity for low-magnitude faults, and secu-rity for external faults.
Throughout the paper, practical application guidelines are provided for common and challenging applications.
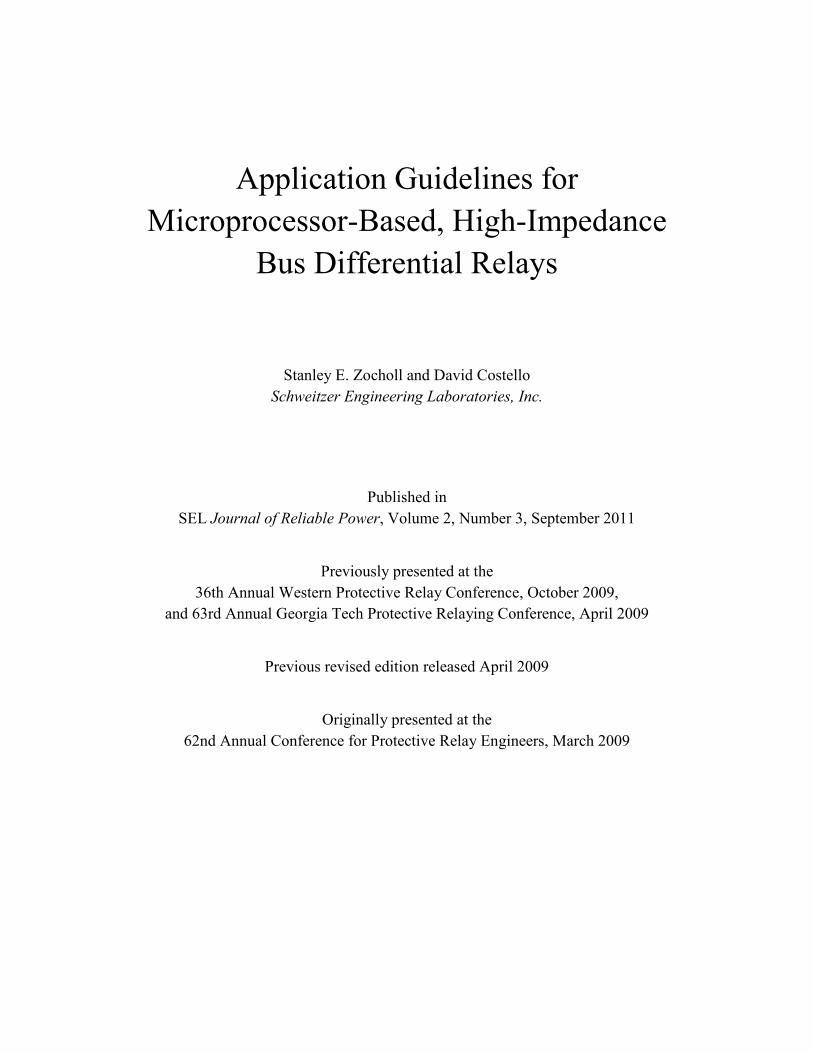
I. REVIEW OF HIGH-IMPEDANCE DIFFERENTIAL PRINCIPLE In the high-impedance bus differential scheme in Fig. 1,
current transformers (CTs) with equal ratios are placed on each phase conductor. The CTs of each phase conductor are paralleled with an overcurrent relay. The overcurrent relay accounts for the sum of the currents entering and leaving the bus zone of protection.
52-1
A C
86-2 86-3
52-2 52-3
101
102 104 106
103 105
C
52-4
B A A AB B BC C
ABC
86-1External Lockout Relay
87Z
87Z-
A
87Z-
B
87Z-
C
Fig. 1. High-Impedance Bus Scheme
Fig. 2 is the two-CT equivalent of the bus scheme with the currents for an external fault. In Fig. 2, RCT is the CT winding resistance, RL is the CT lead resistance, and XM is the CT magnetizing reactance. The total number of feeders on the bus is represented by n. Impedances are divided by n – 1 to indicate a parallel combination of CTs. The right side of the diagram (Side B) represents the CT on the faulted feeder. The
left side (Side A) represents the parallel equivalent of the remaining n – 1 CTs. Consider that the 51 relay is a low-impedance, microprocessor-based overcurrent relay.
MXn 1−
CTRn 1−
LRn 1−
Fig. 2. Two-CT Equivalent Circuit With an External Fault
Note that the Side A and Side B impedances must be equal for the overcurrent relay to measure zero current for an external fault. Consequently, there will be differential error current when there are more than two CTs on the bus, as in the case in Fig. 1. Fig. 3 shows the relay current with a 20 kA external fault in a system of four C200 1200:5 CTs. The CT winding resistance RCT is 0.387 Ω, and the lead resistance RL is 0.113 Ω. In the relay, the cosine-filtered differential signal reaches 80 A secondary.
Sec
onda
ry C
urre
nt
Fig. 3. Differential Current During an External Fault
To improve security during external faults, we add a large stabilizing resistance in series with the low-impedance overcurrent relay. This reduces the differential current to a milliamp level and allows the secondary current to flow between the CTs.
2
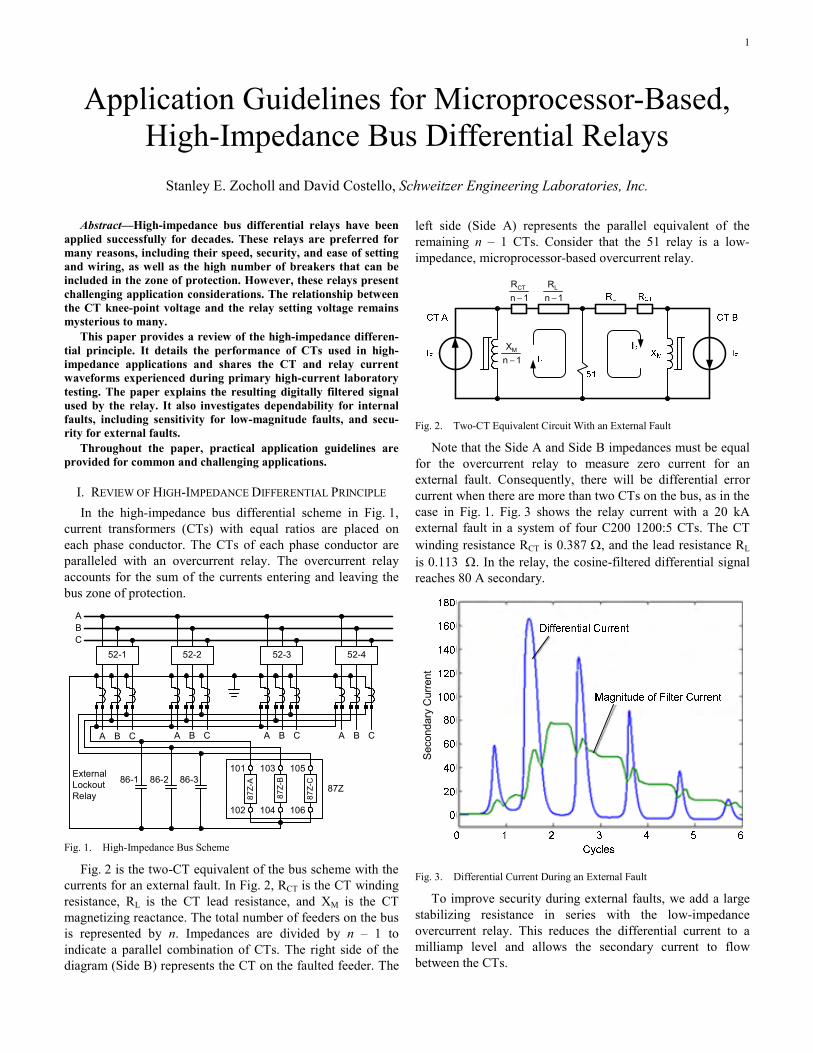
In Fig. 4, Rr is the stabilizing resistance. MOV is a metal oxide varistor. The reduced differential current and voltage across the relay are shown in Fig. 5 and Fig. 6, respectively.
MXn 1−
CTRn 1−
LRn 1−
Fig. 4. Two-CT Equivalent Circuit With Stabilizing Resistor
Differential Current
Cycles0 1 2 3 4 5 6
0.025
0.02
0.015
0.01
0.005
0
–0.005
–0.01
–0.015
–0.02
Fig. 5. Differential Current During an External Fault With a 2000 Ω Stabilizing Resistance
Vol
ts
Sec
onda
ry C
urre
nt (A
mpe
res)
Fig. 6. Relay Voltage During an External Fault With a 2000 Ω Stabilizing Resistor
Consequently, the high-impedance bus differential relay consists of a sensitive overcurrent relay and a series 2000 Ω resistor in each phase. The relay pickup is calibrated in volt-age. Therefore, with a 100 V setting, the relay pickup current is 0.05 A. The high-resistance burden produces a high voltage for any substantial differential current. The MOV in Fig. 4 is an important component wired across each phase that limits the high voltage resulting from high differential current during internal bus faults. Not shown in Fig. 4 is a recommended output contact from a lockout relay, wired in parallel with the MOV. This lockout relay is operated by the bus differential relay trip and short-circuits the high impedance for further overvoltage protection. See Fig. 1.
II. TRADITIONAL VOLTAGE SETTING CALCULATIONS Traditional voltage setting calculations place emphasis on a
high-value setting to ensure stability for external faults versus a low-value setting for maximum sensitivity for internal faults. In the extreme saturation assumption, XM in CT B is assumed to be zero. The voltage across the relay, VR, during a worst-case external fault is estimated using (1).
( )R CT L FV R P • R • I= + (1) where:
RCT = the CT secondary winding and lead resistance IF = the maximum bus fault current, in secondary amperes RL = the one-way resistance of leads from the junction point to the most distant CT P = 1 for three-phase faults and 2 for single-phase-to-ground faults
The voltage is proportional to the CT secondary resistance and the CT secondary leads. Typical practices employed to keep this voltage as low as possible include using the highest possible CT ratios, using the lowest gauge (resistance) leads possible, keeping CT lead lengths as short as possible, and paralleling all the CT secondaries to a junction point that is equidistant from and as close as possible to the CTs.
The relay voltage setting VS is then set to a conservative multiple of VR. Typical VS settings range from 150 to 200 percent of VR. After the secure voltage setting is determined, confirm that the setting achieves the desired minimum sensi-tivity for internal faults.
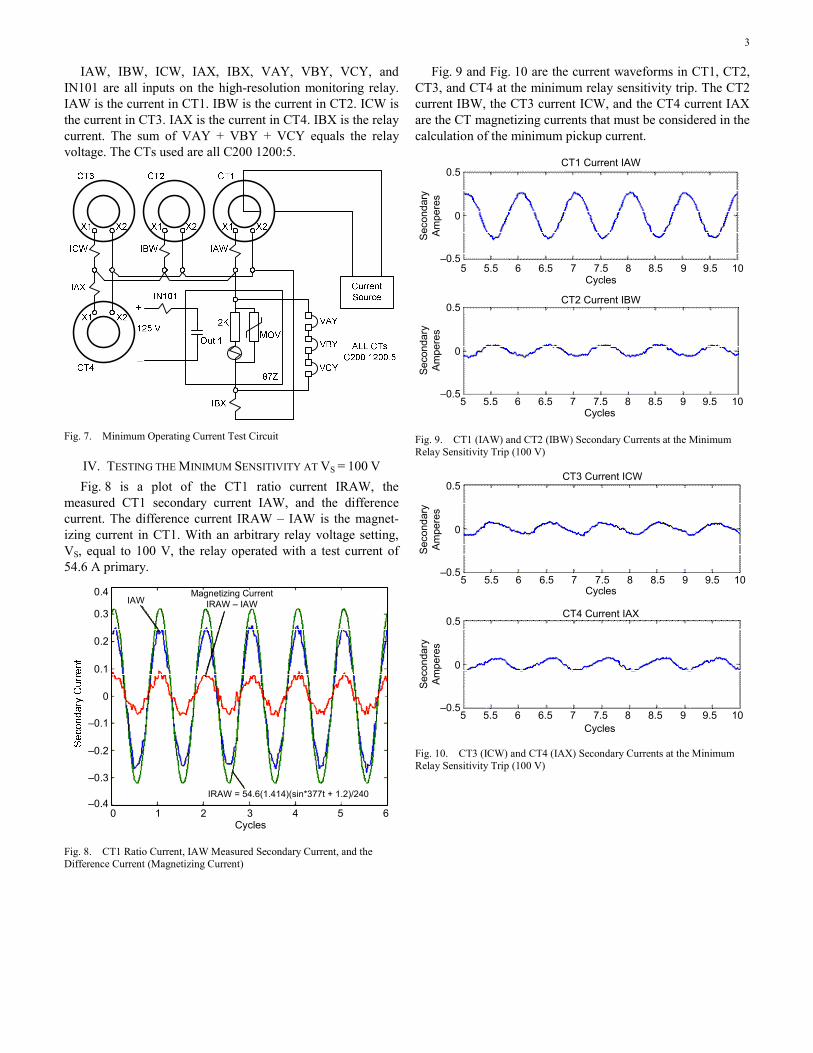
III. MINIMUM SENSITIVITY TEST SCHEME Fig. 7 is the high-impedance bus protection scheme used to
test the minimum pickup current for internal faults. With pri-mary current measured by CT1, secondary current is supplied to the relay and CT2, CT3, and CT4. Current and voltage ele-ments of a second microprocessor-based relay with 8 kHz sampling monitor the CT currents and relay current and volt-age. OUT1 is a trip output contact from the bus differential relay.
3
IAW, IBW, ICW, IAX, IBX, VAY, VBY, VCY, and IN101 are all inputs on the high-resolution monitoring relay. IAW is the current in CT1. IBW is the current in CT2. ICW is the current in CT3. IAX is the current in CT4. IBX is the relay current. The sum of VAY + VBY + VCY equals the relay voltage. The CTs used are all C200 1200:5.
Fig. 7. Minimum Operating Current Test Circuit
IV. TESTING THE MINIMUM SENSITIVITY AT VS = 100 V Fig. 8 is a plot of the CT1 ratio current IRAW, the
measured CT1 secondary current IAW, and the difference current. The difference current IRAW – IAW is the magnet-izing current in CT1. With an arbitrary relay voltage setting, VS, equal to 100 V, the relay operated with a test current of 54.6 A primary.
Cycles0 1 2 3 4 5 6
0.4
0.3
0.2
0.1
0
–0.1
–0.2
–0.3
–0.4
IAWMagnetizing Current
IRAW – IAW
IRAW = 54.6(1.414)(sin*377t + 1.2)/240
Fig. 8. CT1 Ratio Current, IAW Measured Secondary Current, and the Difference Current (Magnetizing Current)
Fig. 9 and Fig. 10 are the current waveforms in CT1, CT2, CT3, and CT4 at the minimum relay sensitivity trip. The CT2 current IBW, the CT3 current ICW, and the CT4 current IAX are the CT magnetizing currents that must be considered in the calculation of the minimum pickup current.
Cycles5 5.5 6 6.5 7 7.5 8
Seco
ndar
y Am
pere
s
0.5
0
–0.5
CT1 Current IAW
Cycles
CT2 Current IBW
8.5 9 9.5 10
5 5.5 6 6.5 7 7.5 8 8.5 9 9.5 10
0.5
0
–0.5
Seco
ndar
y Am
pere
s
Fig. 9. CT1 (IAW) and CT2 (IBW) Secondary Currents at the Minimum Relay Sensitivity Trip (100 V)
Cycles5 5.5 6 6.5 7 7.5 8
Seco
ndar
y Am
pere
s
0.5
0
–0.5
CT3 Current ICW
Cycles
CT4 Current IAX
8.5 9 9.5 10
5 5.5 6 6.5 7 7.5 8 8.5 9 9.5 10
0.5
0
–0.5
Seco
ndar
y Am
pere
s
Fig. 10. CT3 (ICW) and CT4 (IAX) Secondary Currents at the Minimum Relay Sensitivity Trip (100 V)

4
The relay voltage (VAY + VBY + VCY) and current IBX at the minimum sensitivity trip with a 100 V setting are shown in Fig. 11 and Fig. 12. The relay uses a half-cycle cosine filter that extracts the fundamental component of the voltage signal. The relay asserts a trip signal when the filtered voltage magnitude exceeds the voltage setting VS. Fig. 13 shows the filtered fundamental and its magnitude compared to the 100 V trip threshold. The signal magnitude and trip threshold are scaled by 1.414 so that the rms (root-mean-square) values align with the peak of the fundamental sine wave for visual effect.
Cycles
200
150
100
50
0
–50
–100
–200
–150
10 2 3 4 5 6
Fig. 11. Relay Voltage (VAY + VBY + VCY) at the Minimum Relay Sensitivity Trip (100 V)
Cycles
0.15
0.1
0.05
0
–0.05
–0.15
–0.1
10 2 3 4 5 6
IBX
Fundamental
Fig. 12. Relay Current (IBX), Distorted by Harmonics, at the Minimum Relay Sensitivity Trip (100 V), 0.07 A Peak or 0.05 A RMS
Cycles10 2 3 4 5 6
200
150
100
50
0
–50
–100
–200
–150
Magnitude of Half-Cycle Cosine Filter100 V Trip Threshold
Fig. 13. Filtered Voltage Magnitude at the Minimum Relay Sensitivity Trip (100 V)
V. CALCULATING THE MINIMUM SENSITIVITY AT VS = 100 V The traditional calculation used to determine the minimum
internal fault operating current is given by (2). ( )MIN e R MI n • I I I • CTR= + + (2) where:
IMIN = minimum relay sensitivity, in primary amperes n = number of CTs in parallel with the relay Ie = CT excitation current at the voltage setting VS IR = relay current at the voltage setting VS IM = MOV current at the voltage setting VS
For voltages less than 1000 V, the current in the MOV is less than 1 • 10–5 A. Therefore, the voltage setting produces no significant current in the MOV, and the IM term is ignored. The test determined the relay current IR as shown in Fig. 12 and a measured value of the total magnetizing current (n • Ie) shown in Fig. 14. Entering the rms quantity of these values in (2) gives us 56.4 A primary, shown as (3). The result is within 3 percent of the test result. This was done simply to verify our graphs and data.
MIN0.262 0.07I • 240 56.4 A
2 2⎛ ⎞
= + =⎜ ⎟⎝ ⎠
(3)
5
Cycles
0.5
0.4
0.3
0.2
0.1
0
–0.1
–0.2
10 2 3 4 5 6
Sec
onda
ry C
urre
nt
–0.3
–0.4
–0.5
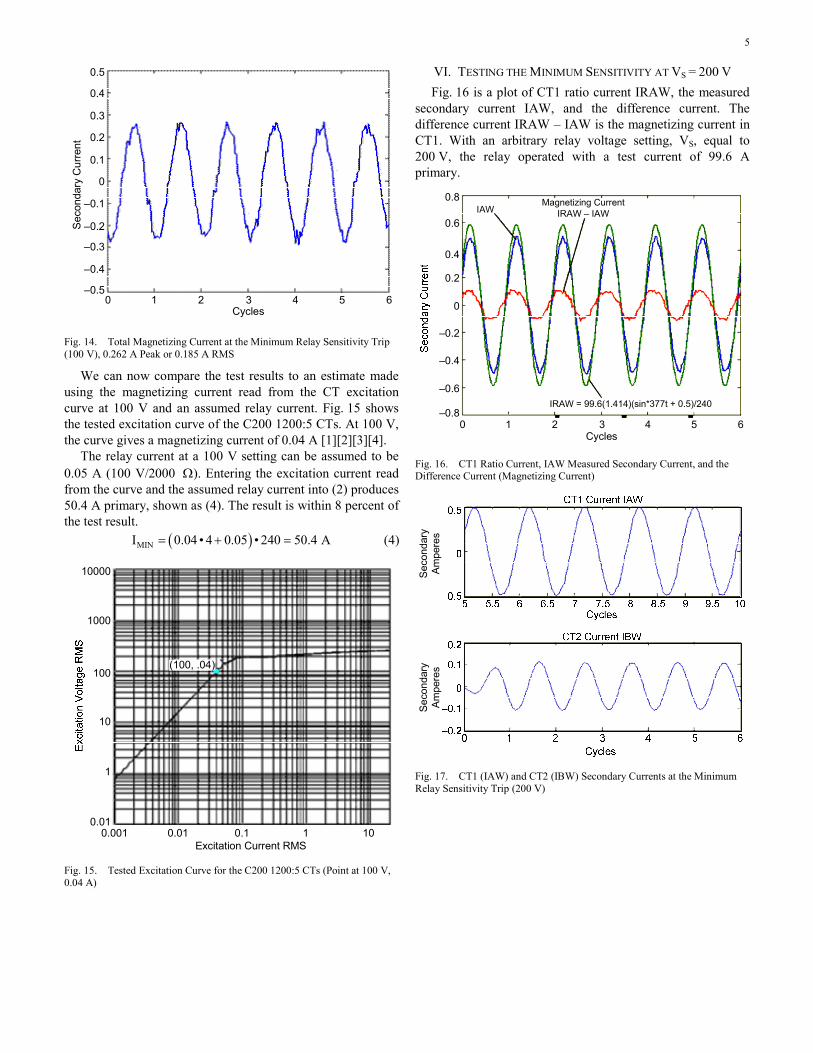
Fig. 14. Total Magnetizing Current at the Minimum Relay Sensitivity Trip (100 V), 0.262 A Peak or 0.185 A RMS
We can now compare the test results to an estimate made using the magnetizing current read from the CT excitation curve at 100 V and an assumed relay current. Fig. 15 shows the tested excitation curve of the C200 1200:5 CTs. At 100 V, the curve gives a magnetizing current of 0.04 A [1][2][3][4].
The relay current at a 100 V setting can be assumed to be 0.05 A (100 V/2000 Ω). Entering the excitation current read from the curve and the assumed relay current into (2) produces 50.4 A primary, shown as (4). The result is within 8 percent of the test result.
( )MINI 0.04 • 4 0.05 • 240 50.4 A= + = (4)
Excitation Current RMS
10000
1000
100
10
1
0.01
(100, .04)
0.001 0.01 0.1 1 10
Fig. 15. Tested Excitation Curve for the C200 1200:5 CTs (Point at 100 V, 0.04 A)
VI. TESTING THE MINIMUM SENSITIVITY AT VS = 200 V Fig. 16 is a plot of CT1 ratio current IRAW, the measured
secondary current IAW, and the difference current. The difference current IRAW – IAW is the magnetizing current in CT1. With an arbitrary relay voltage setting, VS, equal to 200 V, the relay operated with a test current of 99.6 A primary.
Cycles
0.8
0.6
0.4
0
–0.4
–0.2
10 2 3 4 5 6
IAWMagnetizing Current
IRAW – IAW
IRAW = 99.6(1.414)(sin*377t + 0.5)/240
0.2
–0.6
–0.8
Fig. 16. CT1 Ratio Current, IAW Measured Secondary Current, and the Difference Current (Magnetizing Current)
Seco
ndar
y Am
pere
sSe
cond
ary
Ampe
res
Fig. 17. CT1 (IAW) and CT2 (IBW) Secondary Currents at the Minimum Relay Sensitivity Trip (200 V)
6
Cycles0 1 2 3 4 5 6
Sec
onda
ry
Am
pere
s0.2
0
–0.2
CT3 Current ICW
Cycles
CT4 Current IAX0.2
0
–0.2
Sec
onda
ry
Am
pere
s
–0.1
0.1
0 1 2 3 4 5 6
0.1
–0.1
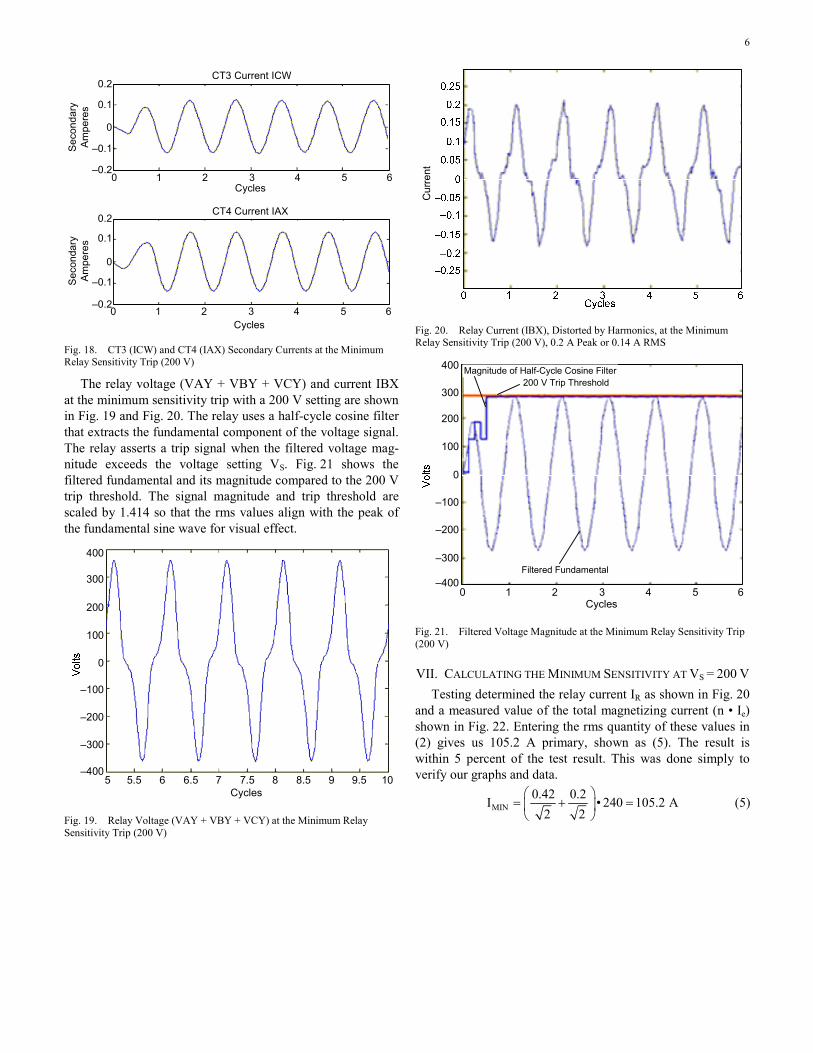
Fig. 18. CT3 (ICW) and CT4 (IAX) Secondary Currents at the Minimum Relay Sensitivity Trip (200 V)
The relay voltage (VAY + VBY + VCY) and current IBX at the minimum sensitivity trip with a 200 V setting are shown in Fig. 19 and Fig. 20. The relay uses a half-cycle cosine filter that extracts the fundamental component of the voltage signal. The relay asserts a trip signal when the filtered voltage mag-nitude exceeds the voltage setting VS. Fig. 21 shows the filtered fundamental and its magnitude compared to the 200 V trip threshold. The signal magnitude and trip threshold are scaled by 1.414 so that the rms values align with the peak of the fundamental sine wave for visual effect.
Cycles
400
300
200
100
0
–100
–200
–400
–300
5 5.5 6 6.5 7 7.5 8 8.5 9 9.5 10
Fig. 19. Relay Voltage (VAY + VBY + VCY) at the Minimum Relay Sensitivity Trip (200 V)
Cur
rent
Fig. 20. Relay Current (IBX), Distorted by Harmonics, at the Minimum Relay Sensitivity Trip (200 V), 0.2 A Peak or 0.14 A RMS
Cycles10 2 3 4 5 6
400
300
200
100
0
–100
–200
–400
–300
Magnitude of Half-Cycle Cosine Filter200 V Trip Threshold
Filtered Fundamental
Fig. 21. Filtered Voltage Magnitude at the Minimum Relay Sensitivity Trip (200 V)
VII. CALCULATING THE MINIMUM SENSITIVITY AT VS = 200 V Testing determined the relay current IR as shown in Fig. 20
and a measured value of the total magnetizing current (n • Ie) shown in Fig. 22. Entering the rms quantity of these values in (2) gives us 105.2 A primary, shown as (5). The result is within 5 percent of the test result. This was done simply to verify our graphs and data.
MIN0.42 0.2I • 240 105.2 A
2 2⎛ ⎞
= + =⎜ ⎟⎝ ⎠
(5)
7
Cycles0 1 2 3 4 5 6
0.5
0.4
0.3
0.2
0
–0.2
–0.3
–0.5
0.1
–0.1
–0.4
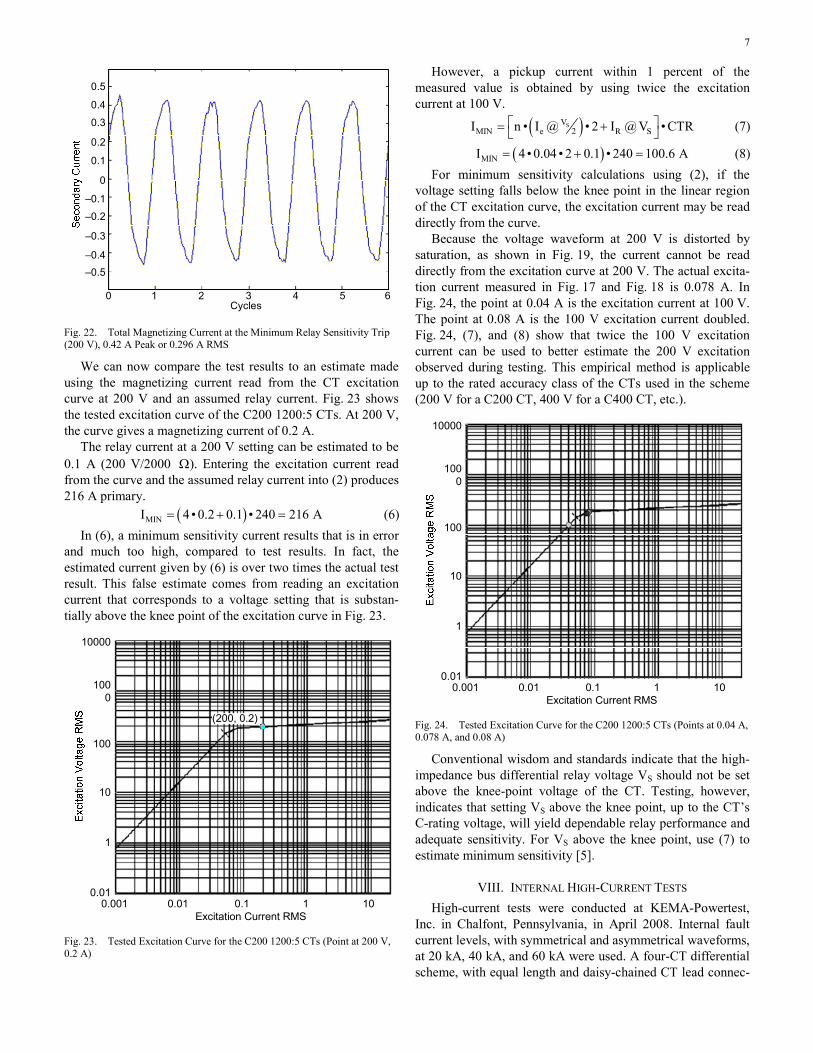
Fig. 22. Total Magnetizing Current at the Minimum Relay Sensitivity Trip (200 V), 0.42 A Peak or 0.296 A RMS
We can now compare the test results to an estimate made using the magnetizing current read from the CT excitation curve at 200 V and an assumed relay current. Fig. 23 shows the tested excitation curve of the C200 1200:5 CTs. At 200 V, the curve gives a magnetizing current of 0.2 A.
The relay current at a 200 V setting can be estimated to be 0.1 A (200 V/2000 Ω). Entering the excitation current read from the curve and the assumed relay current into (2) produces 216 A primary.
( )MINI 4 • 0.2 0.1 • 240 216 A= + = (6) In (6), a minimum sensitivity current results that is in error
and much too high, compared to test results. In fact, the estimated current given by (6) is over two times the actual test result. This false estimate comes from reading an excitation current that corresponds to a voltage setting that is substan-tially above the knee point of the excitation curve in Fig. 23.
Excitation Current RMS
10000
1000
100
10
1
0.01
(200, 0.2)
0.001 0.01 0.1 1 10
Fig. 23. Tested Excitation Curve for the C200 1200:5 CTs (Point at 200 V, 0.2 A)
However, a pickup current within 1 percent of the measured value is obtained by using twice the excitation current at 100 V.
( )SV2MIN e R SI n • I @ • 2 I @ V • CTR⎡ ⎤= +⎣ ⎦ (7)
( )MINI 4 • 0.04 • 2 0.1 • 240 100.6 A= + = (8) For minimum sensitivity calculations using (2), if the
voltage setting falls below the knee point in the linear region of the CT excitation curve, the excitation current may be read directly from the curve.
Because the voltage waveform at 200 V is distorted by saturation, as shown in Fig. 19, the current cannot be read directly from the excitation curve at 200 V. The actual excita-tion current measured in Fig. 17 and Fig. 18 is 0.078 A. In Fig. 24, the point at 0.04 A is the excitation current at 100 V. The point at 0.08 A is the 100 V excitation current doubled. Fig. 24, (7), and (8) show that twice the 100 V excitation current can be used to better estimate the 200 V excitation observed during testing. This empirical method is applicable up to the rated accuracy class of the CTs used in the scheme (200 V for a C200 CT, 400 V for a C400 CT, etc.).
Excitation Current RMS
10000
1000
100
10
1
0.010.001 0.01 0.1 1 10
Fig. 24. Tested Excitation Curve for the C200 1200:5 CTs (Points at 0.04 A, 0.078 A, and 0.08 A)
Conventional wisdom and standards indicate that the high-impedance bus differential relay voltage VS should not be set above the knee-point voltage of the CT. Testing, however, indicates that setting VS above the knee point, up to the CT’s C-rating voltage, will yield dependable relay performance and adequate sensitivity. For VS above the knee point, use (7) to estimate minimum sensitivity [5].
VIII. INTERNAL HIGH-CURRENT TESTS High-current tests were conducted at KEMA-Powertest,
Inc. in Chalfont, Pennsylvania, in April 2008. Internal fault current levels, with symmetrical and asymmetrical waveforms, at 20 kA, 40 kA, and 60 kA were used. A four-CT differential scheme, with equal length and daisy-chained CT lead connec-
8
tions, was simulated. Equal length leads are recommended, but daisy-chained leads are common in switchgear installa-tions. Schemes with all C200 1200:5 CTs and all C200 3000:5 CTs were used. Several microprocessor-based relays and a popular electromechanical, high-impedance bus differential relay were tested.
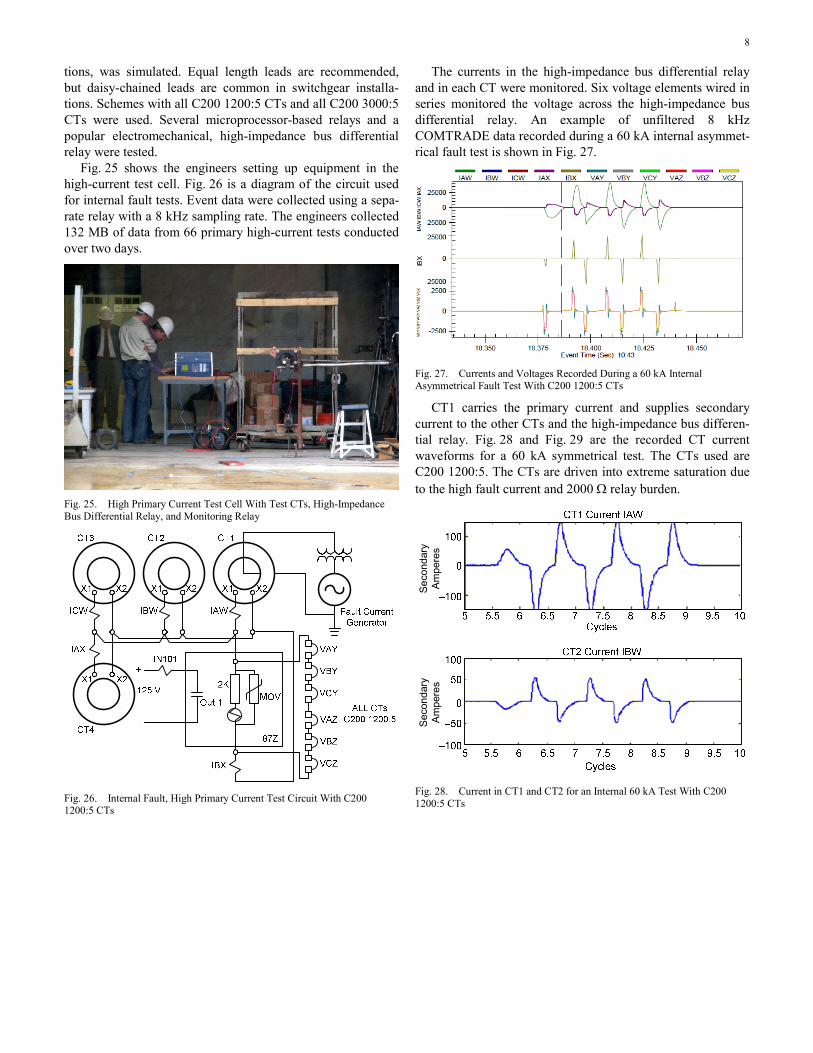
Fig. 25 shows the engineers setting up equipment in the high-current test cell. Fig. 26 is a diagram of the circuit used for internal fault tests. Event data were collected using a sepa-rate relay with a 8 kHz sampling rate. The engineers collected 132 MB of data from 66 primary high-current tests conducted over two days.
Fig. 25. High Primary Current Test Cell With Test CTs, High-Impedance Bus Differential Relay, and Monitoring Relay
Fig. 26. Internal Fault, High Primary Current Test Circuit With C200 1200:5 CTs
The currents in the high-impedance bus differential relay and in each CT were monitored. Six voltage elements wired in series monitored the voltage across the high-impedance bus differential relay. An example of unfiltered 8 kHz COMTRADE data recorded during a 60 kA internal asymmet-rical fault test is shown in Fig. 27.
Fig. 27. Currents and Voltages Recorded During a 60 kA Internal Asymmetrical Fault Test With C200 1200:5 CTs
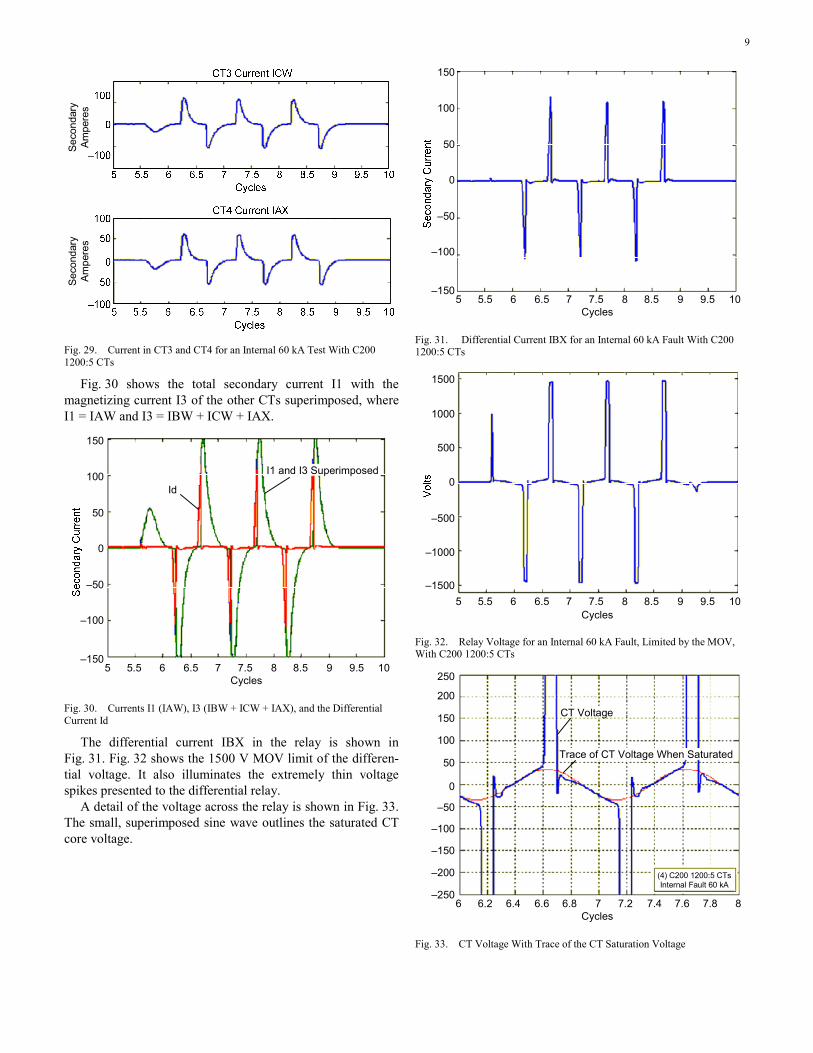
CT1 carries the primary current and supplies secondary current to the other CTs and the high-impedance bus differen-tial relay. Fig. 28 and Fig. 29 are the recorded CT current waveforms for a 60 kA symmetrical test. The CTs used are C200 1200:5. The CTs are driven into extreme saturation due to the high fault current and 2000 Ω relay burden.
Seco
ndar
y Am
pere
sSe
cond
ary
Ampe
res
Fig. 28. Current in CT1 and CT2 for an Internal 60 kA Test With C200 1200:5 CTs
9
Seco
ndar
y Am
pere
sSe
cond
ary
Ampe
res
Fig. 29. Current in CT3 and CT4 for an Internal 60 kA Test With C200 1200:5 CTs
Fig. 30 shows the total secondary current I1 with the magnetizing current I3 of the other CTs superimposed, where I1 = IAW and I3 = IBW + ICW + IAX.
Cycles
150
100
50
0
–50
–100
–1505 5.5 6 6.5 7 7.5 8 8.5 9 9.5 10
Id
I1 and I3 Superimposed
Fig. 30. Currents I1 (IAW), I3 (IBW + ICW + IAX), and the Differential Current Id
The differential current IBX in the relay is shown in Fig. 31. Fig. 32 shows the 1500 V MOV limit of the differen-tial voltage. It also illuminates the extremely thin voltage spikes presented to the differential relay.
A detail of the voltage across the relay is shown in Fig. 33. The small, superimposed sine wave outlines the saturated CT core voltage.
Cycles
150
100
50
0
–50
–100
–1505 5.5 6 6.5 7 7.5 8 8.5 9 9.5 10
Fig. 31. Differential Current IBX for an Internal 60 kA Fault With C200 1200:5 CTs
Cycles
1500
1000
500
0
–500
–1000
–15005 5.5 6 6.5 7 7.5 8 8.5 9 9.5 10
Fig. 32. Relay Voltage for an Internal 60 kA Fault, Limited by the MOV, With C200 1200:5 CTs
Cycles
250
200
150
100
0
–100
–150
–250
–200
6 6.2 6.4 6.6 6.8 7 7.2 7.4 7.6 7.8 8
50
–50
CT Voltage
Trace of CT Voltage When Saturated
(4) C200 1200:5 CTsInternal Fault 60 kA
Fig. 33. CT Voltage With Trace of the CT Saturation Voltage
10
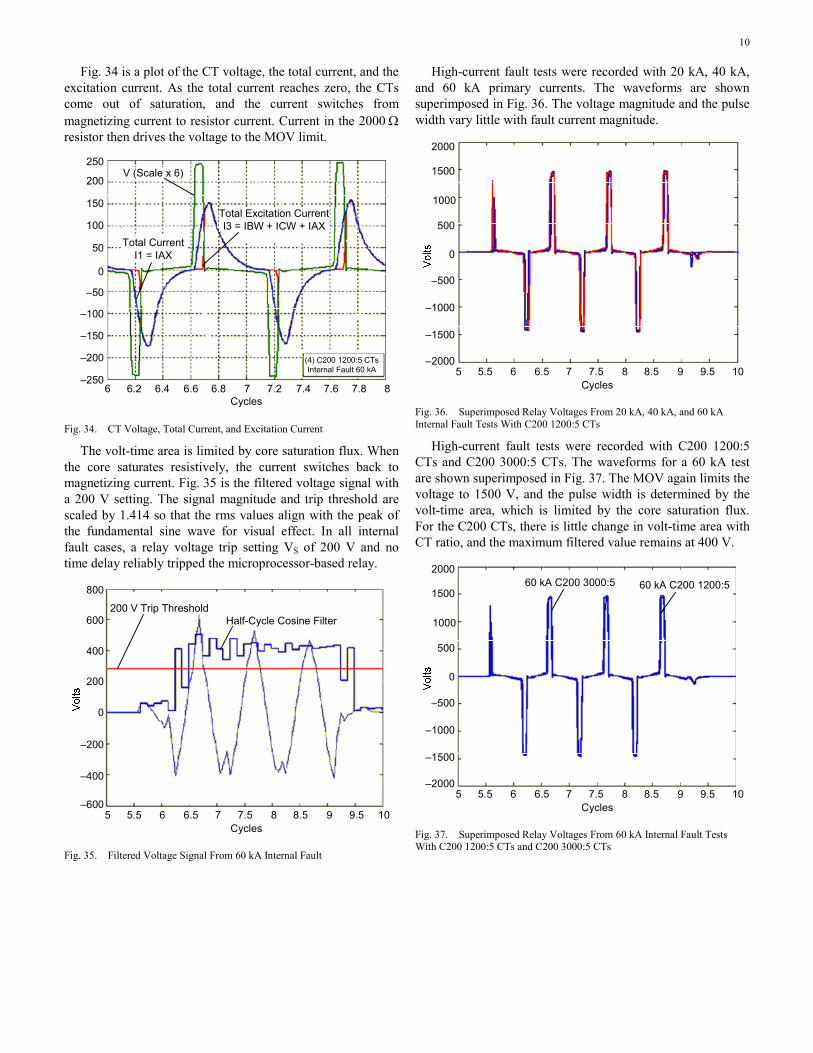
Fig. 34 is a plot of the CT voltage, the total current, and the excitation current. As the total current reaches zero, the CTs come out of saturation, and the current switches from magnetizing current to resistor current. Current in the 2000 Ω resistor then drives the voltage to the MOV limit.
Cycles
250
200
150
100
0
–100
–150
–250
–200
6 6.2 6.4 6.6 6.8 7 7.2 7.4 7.6 7.8 8
50
–50
V (Scale x 6)
Total Excitation CurrentI3 = IBW + ICW + IAX
(4) C200 1200:5 CTsInternal Fault 60 kA
Total CurrentI1 = IAX
Fig. 34. CT Voltage, Total Current, and Excitation Current
The volt-time area is limited by core saturation flux. When the core saturates resistively, the current switches back to magnetizing current. Fig. 35 is the filtered voltage signal with a 200 V setting. The signal magnitude and trip threshold are scaled by 1.414 so that the rms values align with the peak of the fundamental sine wave for visual effect. In all internal fault cases, a relay voltage trip setting VS of 200 V and no time delay reliably tripped the microprocessor-based relay.
Cycles
800
600
400
0
–200
–400
5 5.5 6 6.5 7 7.5 8 8.5 9 9.5 10
200
–600
200 V Trip ThresholdHalf-Cycle Cosine Filter
Fig. 35. Filtered Voltage Signal From 60 kA Internal Fault
High-current fault tests were recorded with 20 kA, 40 kA, and 60 kA primary currents. The waveforms are shown superimposed in Fig. 36. The voltage magnitude and the pulse width vary little with fault current magnitude.
Cycles
2000
1500
500
0
–500
–1000
5 5.5 6 6.5 7 7.5 8 8.5 9 9.5 10–2000
1000
–1500
Fig. 36. Superimposed Relay Voltages From 20 kA, 40 kA, and 60 kA Internal Fault Tests With C200 1200:5 CTs
High-current fault tests were recorded with C200 1200:5 CTs and C200 3000:5 CTs. The waveforms for a 60 kA test are shown superimposed in Fig. 37. The MOV again limits the voltage to 1500 V, and the pulse width is determined by the volt-time area, which is limited by the core saturation flux. For the C200 CTs, there is little change in volt-time area with CT ratio, and the maximum filtered value remains at 400 V.
Cycles
2000
1500
500
0
–500
–1000
5 5.5 6 6.5 7 7.5 8 8.5 9 9.5 10–2000
1000
–1500
60 kA C200 3000:5 60 kA C200 1200:5
Fig. 37. Superimposed Relay Voltages From 60 kA Internal Fault Tests With C200 1200:5 CTs and C200 3000:5 CTs
11
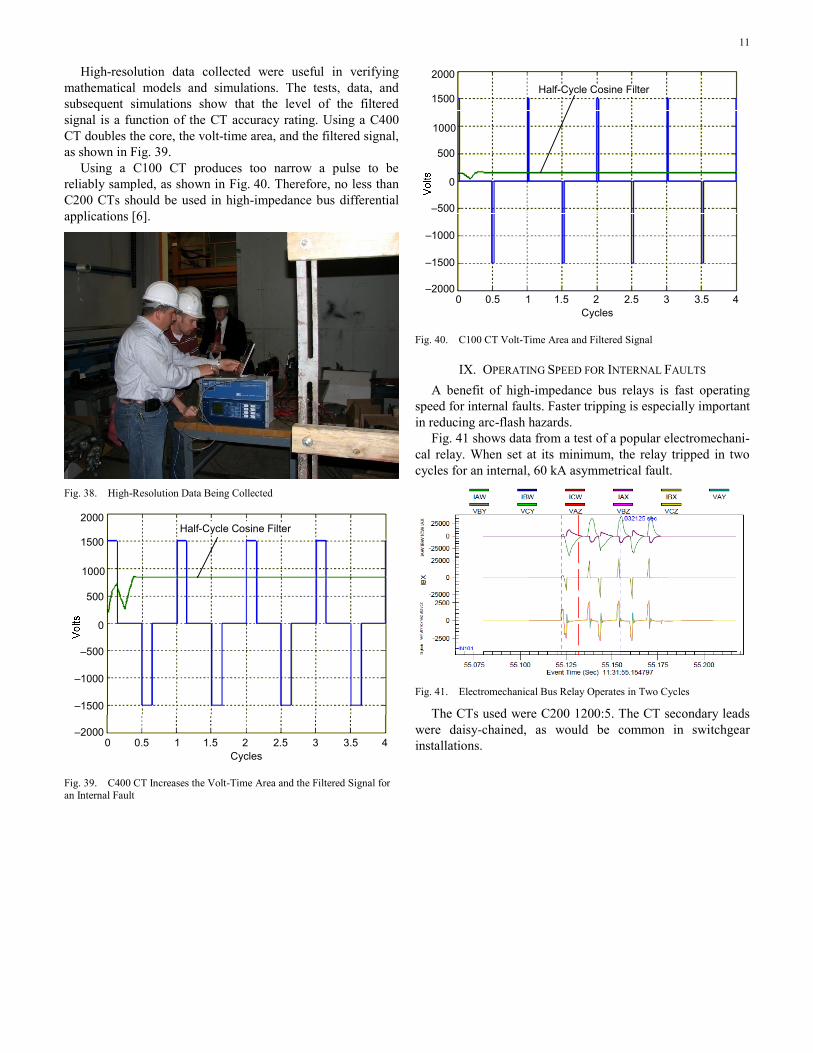
High-resolution data collected were useful in verifying mathematical models and simulations. The tests, data, and subsequent simulations show that the level of the filtered signal is a function of the CT accuracy rating. Using a C400 CT doubles the core, the volt-time area, and the filtered signal, as shown in Fig. 39.
Using a C100 CT produces too narrow a pulse to be reliably sampled, as shown in Fig. 40. Therefore, no less than C200 CTs should be used in high-impedance bus differential applications [6].
Fig. 38. High-Resolution Data Being Collected
Cycles
2000
1500
500
0
–500
–1000
0 0.5 1 1.5 2 2.5 3 3.5 4–2000
1000
–1500
Half-Cycle Cosine Filter
Fig. 39. C400 CT Increases the Volt-Time Area and the Filtered Signal for an Internal Fault
Cycles
2000
1500
500
0
–500
–1000
0 0.5 1 1.5 2 2.5 3 3.5 4–2000
1000
–1500
Half-Cycle Cosine Filter
Fig. 40. C100 CT Volt-Time Area and Filtered Signal
IX. OPERATING SPEED FOR INTERNAL FAULTS A benefit of high-impedance bus relays is fast operating
speed for internal faults. Faster tripping is especially important in reducing arc-flash hazards.
Fig. 41 shows data from a test of a popular electromechani-cal relay. When set at its minimum, the relay tripped in two cycles for an internal, 60 kA asymmetrical fault.
Fig. 41. Electromechanical Bus Relay Operates in Two Cycles
The CTs used were C200 1200:5. The CT secondary leads were daisy-chained, as would be common in switchgear installations.
12
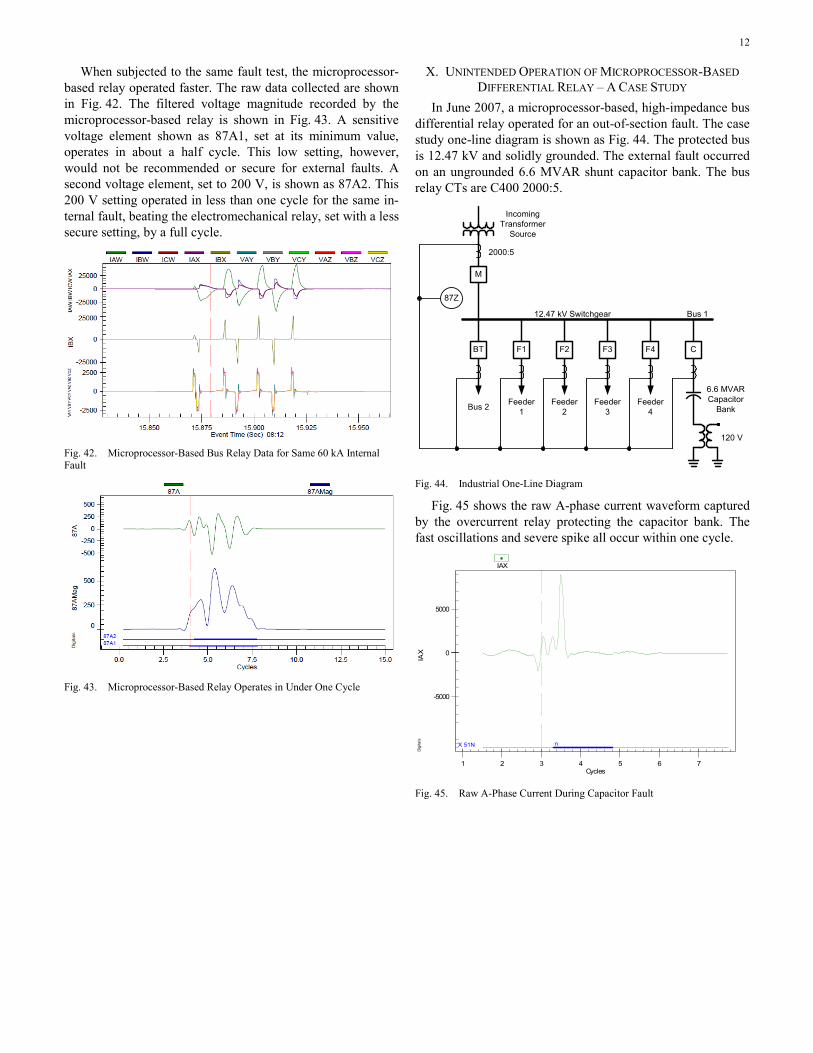
When subjected to the same fault test, the microprocessor-based relay operated faster. The raw data collected are shown in Fig. 42. The filtered voltage magnitude recorded by the microprocessor-based relay is shown in Fig. 43. A sensitive voltage element shown as 87A1, set at its minimum value, operates in about a half cycle. This low setting, however, would not be recommended or secure for external faults. A second voltage element, set to 200 V, is shown as 87A2. This 200 V setting operated in less than one cycle for the same in-ternal fault, beating the electromechanical relay, set with a less secure setting, by a full cycle.
Fig. 42. Microprocessor-Based Bus Relay Data for Same 60 kA Internal Fault
Fig. 43. Microprocessor-Based Relay Operates in Under One Cycle
X. UNINTENDED OPERATION OF MICROPROCESSOR-BASED DIFFERENTIAL RELAY – A CASE STUDY
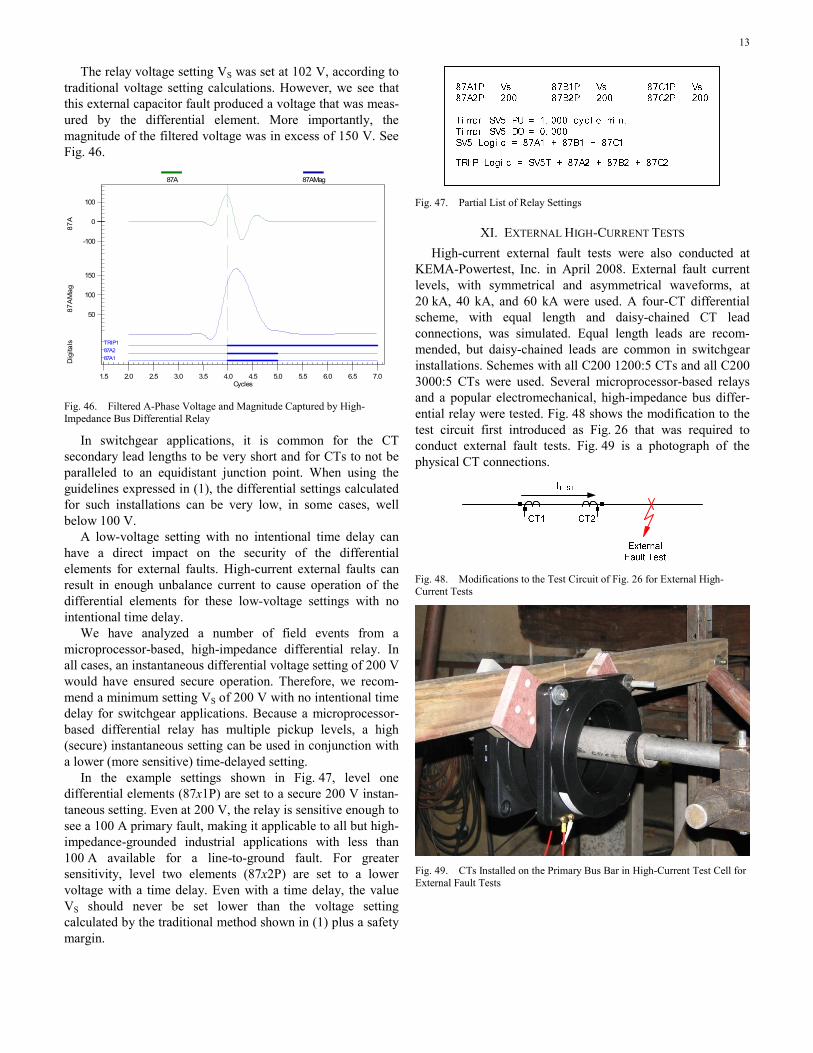
In June 2007, a microprocessor-based, high-impedance bus differential relay operated for an out-of-section fault. The case study one-line diagram is shown as Fig. 44. The protected bus is 12.47 kV and solidly grounded. The external fault occurred on an ungrounded 6.6 MVAR shunt capacitor bank. The bus relay CTs are C400 2000:5.
M
87Z
2000:5
12.47 kV Switchgear Bus 1
C
6.6 MVARCapacitor
Bank
F4
Feeder 4
F3
Feeder 3
F2
Feeder 2
F1
Feeder 1
BT
Bus 2
Incoming Transformer
Source
120 V
Fig. 44. Industrial One-Line Diagram
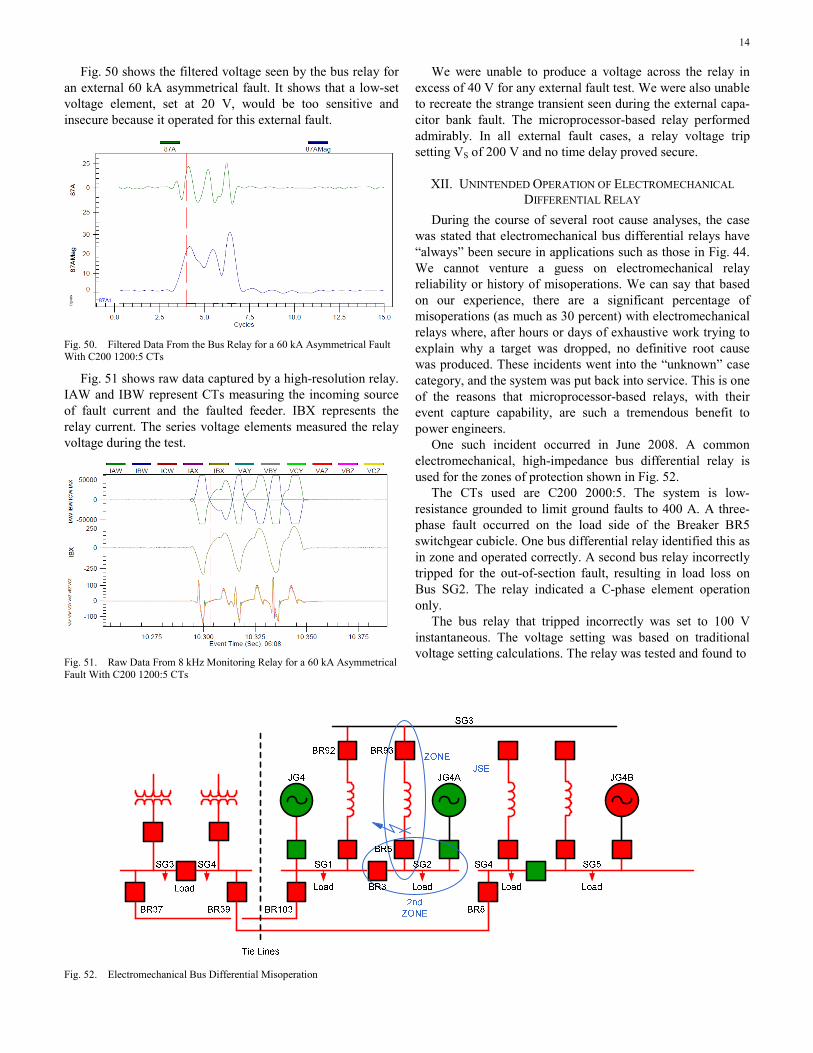
Fig. 45 shows the raw A-phase current waveform captured by the overcurrent relay protecting the capacitor bank. The fast oscillations and severe spike all occur within one cycle.
X 51N n
-5000
0
5000
1 2 3 4 5 6 7
IAX
Digi
tals
Cycles
IAX
Fig. 45. Raw A-Phase Current During Capacitor Fault
13
The relay voltage setting VS was set at 102 V, according to traditional voltage setting calculations. However, we see that this external capacitor fault produced a voltage that was meas-ured by the differential element. More importantly, the magnitude of the filtered voltage was in excess of 150 V. See Fig. 46.
87A187A2TRIP1
-100
0
100
50
100
150
1.5 2.0 2.5 3.0 3.5 4.0 4.5 5.0 5.5 6.0 6.5 7.0
87A
87A
Mag
Dig
itals
Cycles
87A 87AMag
Fig. 46. Filtered A-Phase Voltage and Magnitude Captured by High-Impedance Bus Differential Relay
In switchgear applications, it is common for the CT secondary lead lengths to be very short and for CTs to not be paralleled to an equidistant junction point. When using the guidelines expressed in (1), the differential settings calculated for such installations can be very low, in some cases, well below 100 V.
A low-voltage setting with no intentional time delay can have a direct impact on the security of the differential elements for external faults. High-current external faults can result in enough unbalance current to cause operation of the differential elements for these low-voltage settings with no intentional time delay.
We have analyzed a number of field events from a microprocessor-based, high-impedance differential relay. In all cases, an instantaneous differential voltage setting of 200 V would have ensured secure operation. Therefore, we recom-mend a minimum setting VS of 200 V with no intentional time delay for switchgear applications. Because a microprocessor-based differential relay has multiple pickup levels, a high (secure) instantaneous setting can be used in conjunction with a lower (more sensitive) time-delayed setting.
In the example settings shown in Fig. 47, level one differential elements (87x1P) are set to a secure 200 V instan-taneous setting. Even at 200 V, the relay is sensitive enough to see a 100 A primary fault, making it applicable to all but high-impedance-grounded industrial applications with less than 100 A available for a line-to-ground fault. For greater sensitivity, level two elements (87x2P) are set to a lower voltage with a time delay. Even with a time delay, the value VS should never be set lower than the voltage setting calculated by the traditional method shown in (1) plus a safety margin.
Fig. 47. Partial List of Relay Settings
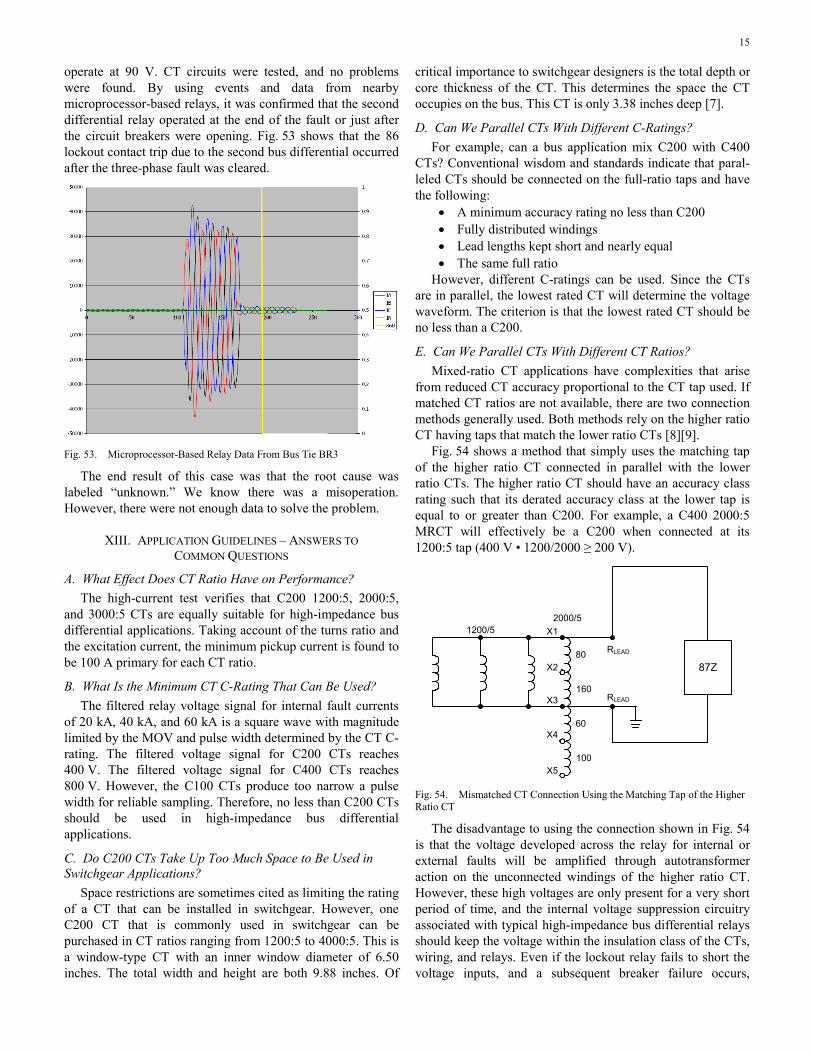
XI. EXTERNAL HIGH-CURRENT TESTS High-current external fault tests were also conducted at
KEMA-Powertest, Inc. in April 2008. External fault current levels, with symmetrical and asymmetrical waveforms, at 20 kA, 40 kA, and 60 kA were used. A four-CT differential scheme, with equal length and daisy-chained CT lead connections, was simulated. Equal length leads are recom-mended, but daisy-chained leads are common in switchgear installations. Schemes with all C200 1200:5 CTs and all C200 3000:5 CTs were used. Several microprocessor-based relays and a popular electromechanical, high-impedance bus differ-ential relay were tested. Fig. 48 shows the modification to the test circuit first introduced as Fig. 26 that was required to conduct external fault tests. Fig. 49 is a photograph of the physical CT connections.
Fig. 48. Modifications to the Test Circuit of Fig. 26 for External High-Current Tests
Fig. 49. CTs Installed on the Primary Bus Bar in High-Current Test Cell for External Fault Tests
14
Fig. 50 shows the filtered voltage seen by the bus relay for an external 60 kA asymmetrical fault. It shows that a low-set voltage element, set at 20 V, would be too sensitive and insecure because it operated for this external fault.
Fig. 50. Filtered Data From the Bus Relay for a 60 kA Asymmetrical Fault With C200 1200:5 CTs
Fig. 51 shows raw data captured by a high-resolution relay. IAW and IBW represent CTs measuring the incoming source of fault current and the faulted feeder. IBX represents the relay current. The series voltage elements measured the relay voltage during the test.
Fig. 51. Raw Data From 8 kHz Monitoring Relay for a 60 kA Asymmetrical Fault With C200 1200:5 CTs
We were unable to produce a voltage across the relay in excess of 40 V for any external fault test. We were also unable to recreate the strange transient seen during the external capa-citor bank fault. The microprocessor-based relay performed admirably. In all external fault cases, a relay voltage trip setting VS of 200 V and no time delay proved secure.
XII. UNINTENDED OPERATION OF ELECTROMECHANICAL DIFFERENTIAL RELAY
During the course of several root cause analyses, the case was stated that electromechanical bus differential relays have “always” been secure in applications such as those in Fig. 44. We cannot venture a guess on electromechanical relay reliability or history of misoperations. We can say that based on our experience, there are a significant percentage of misoperations (as much as 30 percent) with electromechanical relays where, after hours or days of exhaustive work trying to explain why a target was dropped, no definitive root cause was produced. These incidents went into the “unknown” case category, and the system was put back into service. This is one of the reasons that microprocessor-based relays, with their event capture capability, are such a tremendous benefit to power engineers.
One such incident occurred in June 2008. A common electromechanical, high-impedance bus differential relay is used for the zones of protection shown in Fig. 52.
The CTs used are C200 2000:5. The system is low-resistance grounded to limit ground faults to 400 A. A three-phase fault occurred on the load side of the Breaker BR5 switchgear cubicle. One bus differential relay identified this as in zone and operated correctly. A second bus relay incorrectly tripped for the out-of-section fault, resulting in load loss on Bus SG2. The relay indicated a C-phase element operation only.
The bus relay that tripped incorrectly was set to 100 V instantaneous. The voltage setting was based on traditional voltage setting calculations. The relay was tested and found to
Fig. 52. Electromechanical Bus Differential Misoperation
15
operate at 90 V. CT circuits were tested, and no problems were found. By using events and data from nearby microprocessor-based relays, it was confirmed that the second differential relay operated at the end of the fault or just after the circuit breakers were opening. Fig. 53 shows that the 86 lockout contact trip due to the second bus differential occurred after the three-phase fault was cleared.
Fig. 53. Microprocessor-Based Relay Data From Bus Tie BR3
The end result of this case was that the root cause was labeled “unknown.” We know there was a misoperation. However, there were not enough data to solve the problem.
XIII. APPLICATION GUIDELINES – ANSWERS TO COMMON QUESTIONS
A. What Effect Does CT Ratio Have on Performance? The high-current test verifies that C200 1200:5, 2000:5,
and 3000:5 CTs are equally suitable for high-impedance bus differential applications. Taking account of the turns ratio and the excitation current, the minimum pickup current is found to be 100 A primary for each CT ratio.
B. What Is the Minimum CT C-Rating That Can Be Used? The filtered relay voltage signal for internal fault currents
of 20 kA, 40 kA, and 60 kA is a square wave with magnitude limited by the MOV and pulse width determined by the CT C-rating. The filtered voltage signal for C200 CTs reaches 400 V. The filtered voltage signal for C400 CTs reaches 800 V. However, the C100 CTs produce too narrow a pulse width for reliable sampling. Therefore, no less than C200 CTs should be used in high-impedance bus differential applications.
C. Do C200 CTs Take Up Too Much Space to Be Used in Switchgear Applications?
Space restrictions are sometimes cited as limiting the rating of a CT that can be installed in switchgear. However, one C200 CT that is commonly used in switchgear can be purchased in CT ratios ranging from 1200:5 to 4000:5. This is a window-type CT with an inner window diameter of 6.50 inches. The total width and height are both 9.88 inches. Of
critical importance to switchgear designers is the total depth or core thickness of the CT. This determines the space the CT occupies on the bus. This CT is only 3.38 inches deep [7].
D. Can We Parallel CTs With Different C-Ratings? For example, can a bus application mix C200 with C400
CTs? Conventional wisdom and standards indicate that paral-leled CTs should be connected on the full-ratio taps and have the following:
• A minimum accuracy rating no less than C200 • Fully distributed windings • Lead lengths kept short and nearly equal • The same full ratio
However, different C-ratings can be used. Since the CTs are in parallel, the lowest rated CT will determine the voltage waveform. The criterion is that the lowest rated CT should be no less than a C200.
E. Can We Parallel CTs With Different CT Ratios? Mixed-ratio CT applications have complexities that arise
from reduced CT accuracy proportional to the CT tap used. If matched CT ratios are not available, there are two connection methods generally used. Both methods rely on the higher ratio CT having taps that match the lower ratio CTs [8][9].
Fig. 54 shows a method that simply uses the matching tap of the higher ratio CT connected in parallel with the lower ratio CTs. The higher ratio CT should have an accuracy class rating such that its derated accuracy class at the lower tap is equal to or greater than C200. For example, a C400 2000:5 MRCT will effectively be a C200 when connected at its 1200:5 tap (400 V • 1200/2000 ≥ 200 V).
87Z
1200/52000/5
X1
X2
X3
X4
X5
80
160
60
100
RLEAD
RLEAD
Fig. 54. Mismatched CT Connection Using the Matching Tap of the Higher Ratio CT
The disadvantage to using the connection shown in Fig. 54 is that the voltage developed across the relay for internal or external faults will be amplified through autotransformer action on the unconnected windings of the higher ratio CT. However, these high voltages are only present for a very short period of time, and the internal voltage suppression circuitry associated with typical high-impedance bus differential relays should keep the voltage within the insulation class of the CTs, wiring, and relays. Even if the lockout relay fails to short the voltage inputs, and a subsequent breaker failure occurs,
16
remote clearing would be expected in seconds. If the maximum voltage exceeds the dielectric strength of the CT windings, additional voltage suppression must be applied across the CT open windings.
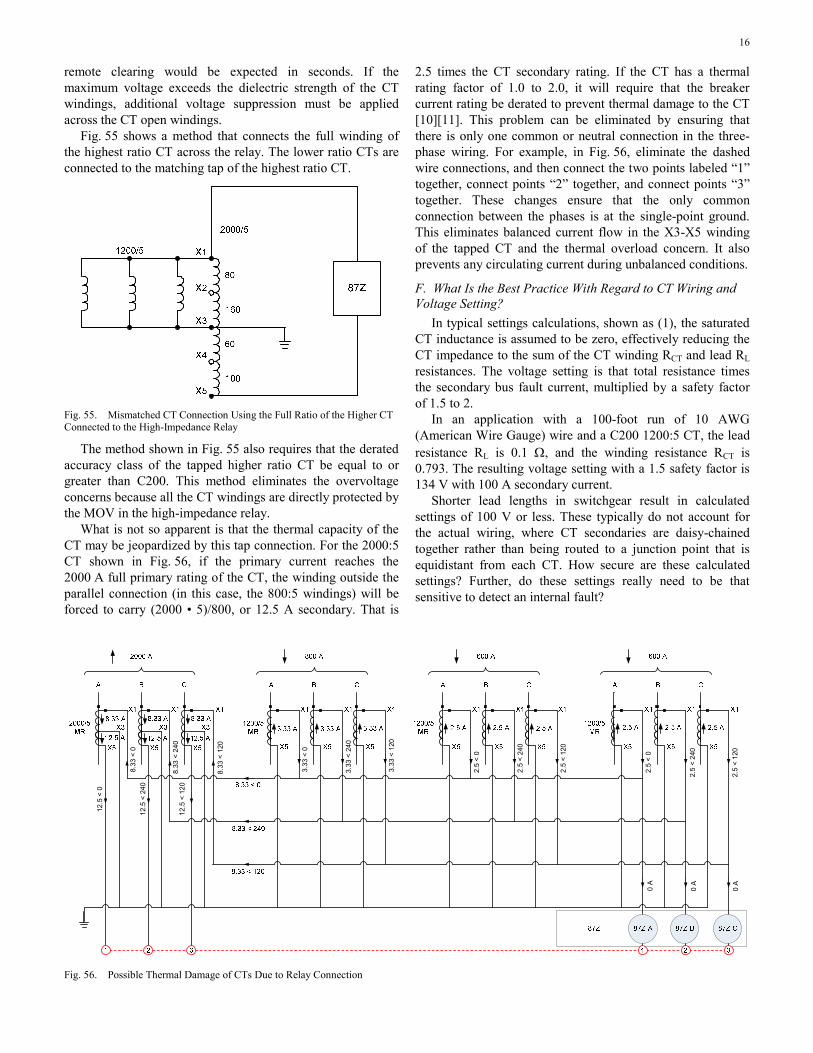
Fig. 55 shows a method that connects the full winding of the highest ratio CT across the relay. The lower ratio CTs are connected to the matching tap of the highest ratio CT.
Fig. 55. Mismatched CT Connection Using the Full Ratio of the Higher CT Connected to the High-Impedance Relay
The method shown in Fig. 55 also requires that the derated accuracy class of the tapped higher ratio CT be equal to or greater than C200. This method eliminates the overvoltage concerns because all the CT windings are directly protected by the MOV in the high-impedance relay.
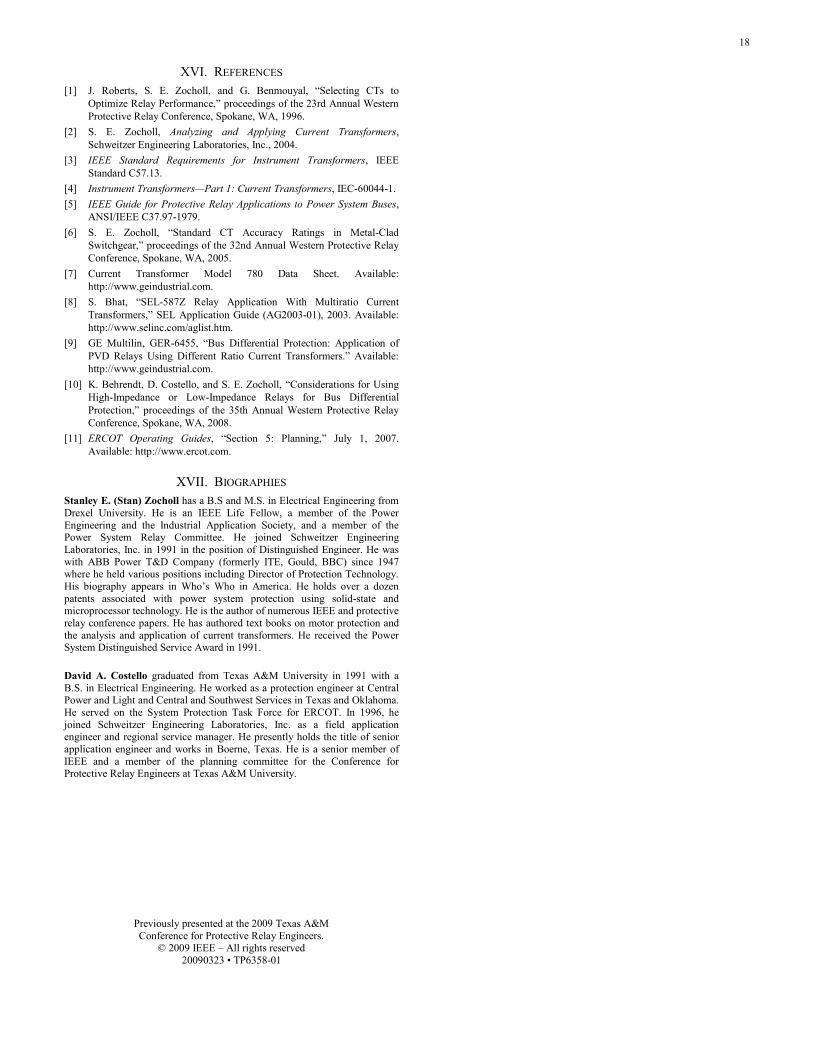
What is not so apparent is that the thermal capacity of the CT may be jeopardized by this tap connection. For the 2000:5 CT shown in Fig. 56, if the primary current reaches the 2000 A full primary rating of the CT, the winding outside the parallel connection (in this case, the 800:5 windings) will be forced to carry (2000 • 5)/800, or 12.5 A secondary. That is
2.5 times the CT secondary rating. If the CT has a thermal rating factor of 1.0 to 2.0, it will require that the breaker current rating be derated to prevent thermal damage to the CT [10][11]. This problem can be eliminated by ensuring that there is only one common or neutral connection in the three-phase wiring. For example, in Fig. 56, eliminate the dashed wire connections, and then connect the two points labeled “1” together, connect points “2” together, and connect points “3” together. These changes ensure that the only common connection between the phases is at the single-point ground. This eliminates balanced current flow in the X3-X5 winding of the tapped CT and the thermal overload concern. It also prevents any circulating current during unbalanced conditions.
F. What Is the Best Practice With Regard to CT Wiring and Voltage Setting?
In typical settings calculations, shown as (1), the saturated CT inductance is assumed to be zero, effectively reducing the CT impedance to the sum of the CT winding RCT and lead RL resistances. The voltage setting is that total resistance times the secondary bus fault current, multiplied by a safety factor of 1.5 to 2.
In an application with a 100-foot run of 10 AWG (American Wire Gauge) wire and a C200 1200:5 CT, the lead resistance RL is 0.1 Ω, and the winding resistance RCT is 0.793. The resulting voltage setting with a 1.5 safety factor is 134 V with 100 A secondary current.
Shorter lead lengths in switchgear result in calculated settings of 100 V or less. These typically do not account for the actual wiring, where CT secondaries are daisy-chained together rather than being routed to a junction point that is equidistant from each CT. How secure are these calculated settings? Further, do these settings really need to be that sensitive to detect an internal fault?
12.5
< 0
8.33
< 0
12.5
< 2
40
8.33
< 2
4012
.5 <
120
8.33
< 1
20
3.33
< 0
3.33
< 2
40
3.33
< 1
20
2.5
< 0
2.5
< 24
0
2.5
< 12
0
2.5
< 0
2.5
< 24
0
2.5
< 12
0
0 A
0 A
0 A
Fig. 56. Possible Thermal Damage of CTs Due to Relay Connection

17
Out of an installed base of over 5,000 microprocessor-based, high-impedance bus differential relays, we have seen four cases of tripping on an external fault. Two cases involve an external flashover to ground of a capacitor bank fed from the bus. The case discussed in this paper showed a transient differential signal exceeding a 150 V relay setting. There were no cases that would have tripped a 200 V setting. Subsequent thorough high-current lab testing proved this to be the case. Consequently, we consider 200 V as the minimum secure voltage setting.
Low-current testing has proven that the high-impedance relay is remarkably sensitive. Even with a secure 200 V setting, the relay trips for a 100 A primary internal bus fault. For impedance-grounded systems where even lower line-to-ground fault currents are available, a 200 V instantaneous element coupled with a lower-set, time-delayed element offers even greater sensitivity.
G. What Is the Relation of Knee-Point Voltage to Relay Voltage Setting?
If a voltage setting is above the knee point, the current read from the excitation curve at that voltage produces a current magnitude that is too large. In other words, the calculation overestimates the minimum fault current sensitivity.
The 200 V minimum pickup tests showed that although the relay voltage at pickup had a 200 V fundamental magnitude, the waveform above the knee point is distorted by saturation and is not a 200 V sine wave. Therefore, reading the excitation current from the curve at that point is inaccurate. The tests also showed that the actual excitation current was twice the excitation current read at 100 V, or half the relay setting, and a point left of the knee.
Setting VS above the knee point, up to the CT’s C-rating voltage, yields dependable relay performance and adequate sensitivity.
H. Is There a Practical Limit to the Number of Breakers That Can Be Paralleled?
We have seen actual systems with as many as 22 breaker CTs paralleled to the high-impedance relay. The CT excitation current at a voltage setting determines the minimum pickup current. Therefore, the number of CTs may need to be limited to ensure tripping with limited ground fault current. A system with four C200 1200:5 CTs has a minimum pickup current of 100 A with a 200 V setting. With 20 CTs, for example, the minimum sensitivity increases to 400 A.
XIV. CONCLUSIONS Based on high- and low-current primary testing, field event
report data, and simulations, the following conclusions and application guidelines were determined:
• If the voltage setting falls below the knee point, the excitation current may be read directly from the curve.
• If the voltage setting falls above the knee point, a more accurate estimate of excitation current is twice the excitation current read at half the voltage setting.
• Testing indicates that voltage settings above the knee point, up to the CT’s C-rating voltage, yield dependable relay performance and adequate sensitivity.
• Low-current tests prove the high-impedance relay can achieve very good sensitivity, for example, 100 A primary with a 200 V setting and four C200 1200:5 CTs.
• Use no less than C200 CTs for high-impedance bus differential applications for dependable operation.
• Testing indicates that microprocessor-based, high-impedance relays can be twice as fast as their electromechanical counterparts.
• When using traditional settings calculations, switchgear applications can produce voltage settings that are too low to be considered secure.
• High-current external faults can result in enough unbalance current to cause operation of the differential elements for these low-voltage settings with no intentional time delay.
• We recommend a minimum setting VS of 200 V with no intentional time delay.
• When additional sensitivity is required for impedance-grounded applications, a high 200 V instantaneous setting can be used in conjunction with a lower (more sensitive) time-delayed setting.
XV. ACKNOWLEDGEMENTS The authors express their sincere thanks to the engineers in
the industry who supplied the field data for event analysis shared in this paper. Jeff Pope, George Alexander, and Andrew Swinghamer assisted with high-current laboratory testing. Rogerio Scharlach, Sal Jadid, and Jeff Pope conducted minimum current pickup tests. Joe Mooney was involved in field data analysis, testing, and developing recommendations. This paper would not be possible without their contributions.
18
XVI. REFERENCES [1] J. Roberts, S. E. Zocholl, and G. Benmouyal, “Selecting CTs to
Optimize Relay Performance,” proceedings of the 23rd Annual Western Protective Relay Conference, Spokane, WA, 1996.
[2] S. E. Zocholl, Analyzing and Applying Current Transformers, Schweitzer Engineering Laboratories, Inc., 2004.
[3] IEEE Standard Requirements for Instrument Transformers, IEEE Standard C57.13.
[4] Instrument Transformers—Part 1: Current Transformers, IEC-60044-1. [5] IEEE Guide for Protective Relay Applications to Power System Buses,
ANSI/IEEE C37.97-1979. [6] S. E. Zocholl, “Standard CT Accuracy Ratings in Metal-Clad
Switchgear,” proceedings of the 32nd Annual Western Protective Relay Conference, Spokane, WA, 2005.
[7] Current Transformer Model 780 Data Sheet. Available: http://www.geindustrial.com.
[8] S. Bhat, “SEL-587Z Relay Application With Multiratio Current Transformers,” SEL Application Guide (AG2003-01), 2003. Available: http://www.selinc.com/aglist.htm.
[9] GE Multilin, GER-6455, “Bus Differential Protection: Application of PVD Relays Using Different Ratio Current Transformers.” Available: http://www.geindustrial.com.
[10] K. Behrendt, D. Costello, and S. E. Zocholl, “Considerations for Using High-Impedance or Low-Impedance Relays for Bus Differential Protection,” proceedings of the 35th Annual Western Protective Relay Conference, Spokane, WA, 2008.
[11] ERCOT Operating Guides, “Section 5: Planning,” July 1, 2007. Available: http://www.ercot.com.
XVII. BIOGRAPHIES Stanley E. (Stan) Zocholl has a B.S and M.S. in Electrical Engineering from Drexel University. He is an IEEE Life Fellow, a member of the Power Engineering and the Industrial Application Society, and a member of the Power System Relay Committee. He joined Schweitzer Engineering Laboratories, Inc. in 1991 in the position of Distinguished Engineer. He was with ABB Power T&D Company (formerly ITE, Gould, BBC) since 1947 where he held various positions including Director of Protection Technology. His biography appears in Who’s Who in America. He holds over a dozen patents associated with power system protection using solid-state and microprocessor technology. He is the author of numerous IEEE and protective relay conference papers. He has authored text books on motor protection and the analysis and application of current transformers. He received the Power System Distinguished Service Award in 1991.
David A. Costello graduated from Texas A&M University in 1991 with a B.S. in Electrical Engineering. He worked as a protection engineer at Central Power and Light and Central and Southwest Services in Texas and Oklahoma. He served on the System Protection Task Force for ERCOT. In 1996, he joined Schweitzer Engineering Laboratories, Inc. as a field application engineer and regional service manager. He presently holds the title of senior application engineer and works in Boerne, Texas. He is a senior member of IEEE and a member of the planning committee for the Conference for Protective Relay Engineers at Texas A&M University.
Previously presented at the 2009 Texas A&M Conference for Protective Relay Engineers.
© 2009 IEEE – All rights reserved 20090323 • TP6358-01