Embed Size (px)
Citation preview

Application for Certification 00-AFC-14
EL SEGUNDO POWERREDEVELOPMENT PROJECT
NOISE ANALYSIS
Prepared by:
El Segundo Power II LLCSymphony Towers750 B Street, Suite 2740San Diego, CA 92101-8129
With technical assistance from:
130 Robin Hill Road, Suite 100Santa Barbara, California 93117
and
2020 East First Street, Suite 400Santa Ana, California 97205
December 2001

TABLE OF CONTENTS
S:\00proj\00000030-NRG\Data Request Set 7\Noise\report 120701.doc i
SECTION PAGE
1.0 INTRODUCTION .......................................................................................................... 12.0 SOUND AND NOISE: A BRIEF PRIMER ................................................................. 23.0 EXISTING ESGS AND 45TH STREET SOUND AND NOISE ENVIRONMENT.. 74.0 ESPR: DESCRIPTION OF CHANGES AND ACTIVITIES .................................... 9
4.1 FUEL OIL STORAGE TANK REMOVAL........................................................... 94.2 REPLACEMENT OF UNITS 1 AND 2 WITH UNITS 5, 6, AND 7 .................... 94.3 GAS COMPRESSOR STATION ........................................................................... 9
5.0 NOISE DATA: NEW AND PREVIOUSLY PRODUCED....................................... 126.0 ANALYSIS OF ESPR IMPACT AND CHANGES ON SOUND
AND ENVIRONMENT ............................................................................................... 13
6.1 ORIGINAL AFC ANALYSIS .............................................................................. 136.2 INITIAL ESTIMATE OF FUEL OIL TANK REMOVAL EFFECTS ................ 136.3 DATA REQUEST ANALYSIS ............................................................................ 13
6.3.1 Simultaneous Measurements North of Fuel Oil Tanks andInside and Outside 4420 The Strand ......................................................... 13
6.4 SURF NOISE MEASUREMENTS ...................................................................... 146.5 NOISE MODEL RESULTS – CADNA/A® ......................................................... 156.6 UNIT 4 SHUTDOWN AND RESTART.............................................................. 17
7.0 SUMMARY................................................................................................................... 26
7.1 SUMMARY OF NOISE SURVEY RESULTS AND METHODS.. .................... 267.2 CHANGES TO THE NOISE ENVIRONMENT.................................................. 277.3 IMPACTS AND LORS COMPLIANCE.............................................................. 28
8.0 SUMMARY OF LORS COMPLIANCE ................................................................... 29
8.1 WARREN-ALQUIST ACTIVITIES .................................................................... 298.2 CALIFORNIA ENVIRONMENTAL QUALITY ACTIVITIES ......................... 298.3 CITY OF MANHATTAN BEACH NOISE ORDINANCE................................. 298.4 CITY OF EL SEGUNDO NOISE ORDINANCE ................................................ 30
9.0 PROPOSED NOISE REDUCTION MEASURES .................................................... 31
9.1 PROPOSED CONDITION OF CERTIFICATION NOISE-6.............................. 31

TABLE OF CONTENTS
S:\00proj\00000030-NRG\Data Request Set 7\Noise\report 120701.doc ii
9.2 POSSIBLE NOISE REDUCTION TREATMENT OF UNIT 4 SOUTH SIDE .. 32
10.0 REFERENCES ............................................................................................................. 33
LIST OF TABLES PAGE
Table 1 Noise and Community Response ............................................................................ 3Table 2 Noise Monitoring Data Relevant to 45th Street Analyses ..................................... 12Table 3 Cadna/A® Results (in A-Weighted Decibels, dBA).............................................. 17Table 4 Noise Impacts Summary ....................................................................................... 26
LIST OF FIGURES PAGE
Figure 1 Noise Scale: Common Sound Levels ...................................................................... 6Figure 2 Existing ESGS Sound and Noise Environment....................................................... 8Figure 3 Site Modifications With Project............................................................................ 11Figure 4 Noise Measurement Locations .............................................................................. 20Figure 5 Hourly Noise Levels at Location 1 (ESGS Southern Boundary / 45th Street)
with All Units Operating Versus with One Unit Operating .................................. 21Figure 6 CADNA/A® Noise Results: Existing Sound Environment, El Segundo
Generating Station................................................................................................. 22Figure 7 CADNA/A® Noise Results: Sound Environment With Fuel Oil Tanks
Removed, El Segundo Generating Station............................................................ 23Figure 8 Unit 4 Shutdown Noise Measurements 8-10-01 – 8-11-01: Simultaneous
Noise Levels (dBA L50) for Locations 10, 11, and 12 Plus Unit 4 Settings ......... 24Figure 9 Unit 4 Restart Noise Measurements 8-16-01 – 8-18-01: Simultaneous
Noise Levels (dBA L50) for Locations 10, 11, and 12 Plus Unit 4 Settings ......... 25
LIST OF APPENDICES
Appendix A Surf Noise DataAppendix B Surf, Wind, Tide DataAppendix C Unit 4 Shutdown and Restart DataAppendix D Multivariate Data Analysis

SECTION 1.0 INTRODUCTION
S:\00proj\00000030-NRG\Data Request Set 7\Noise\report 120701.doc 1
El Segundo Power II (ESPII) proposes to construct and operate the El Segundo PowerRedevelopment Project (ESPR) at the existing El Segundo Generating Station (ESGS). ESPIIfiled ESPR Application for Certification (00-AFC-14) on December 18, 2000. Duringpreparation of the AFC, and during the subsequent proceedings, ESPII conducted a series ofnoise investigations to answer the following questions:
• How will ESPR operations (project) effect the neighboring noise-sensitive receivers?
• What is the best way of determining the project’s effect?
• How do changes in the ambient noise level determine our ability to measure the project’seffect?
• What mitigation measures are appropriate for ESPR?
This report details the evolution of the noise analysis, and summarizes the answers to thesequestions.
With regard to noise, the major functional feature of the project (the replacement of Units 1and 2 at the northern boundary of the ESGS with a modern combined cycle plant – Units 5,6, and 7) has become secondary relative to the issue of the noise effects resulting fromremoval of two large fuel oil tanks near the southern project boundary. Residences that arecurrently visually and acoustically shielded from the ESGS are concerned that removal of thetanks could significantly increase noise levels from both the existing and new plantcomponents. If it were possible to crank down the tanks like a car window and then crankthem back up, the analysis of the project’s effects would be simple. Unfortunately, this is notpossible; the estimation of the tank removal effects on nearby residents is complicated by therelatively high ambient noise levels in the area and site logistics.
Based upon the work conducted, the ESPR is predicted to have a less-than-significant impactupon the neighboring noise-sensitive receivers, as defined by noise standards established bythe California Energy Commission (CEC), the City of El Segundo (COES) and the City ofManhattan Beach (COMB).
A reliable method is needed to verify the actual future operations-phase noise impacts onnearby residences. Verification measurements taken at the nearest residential receivers wouldbe unreliable because of the unique features of this project such as the planned removal oftwo large fuel oil tanks and its location and setting. These features make it difficult toa) predict the project’s impact, b) verify the project’s impact, and c) verify the effectivenessof mitigation measures if implemented. Thus, a portion of this report explains why the CECand COMB’s proposed verification method is problematic, and then proposes alternativeverification and remedy methods.

SECTION 2.0 SOUND AND NOISE: A BRIEF PRIMER
S:\00proj\00000030-NRG\Data Request Set 7\Noise\report 120701.doc 2
The following “frequently asked questions” address the relevant concepts of communitynoise impact analysis.
What is Sound?
Sound is the mechanical vibration of a gaseous, liquid, or solid elastic medium throughwhich energy is transferred away from the source by progressive sound waves. The technicalterm corresponding to the layman’s “loudness” of sound is sound pressure level (SPL).
What is Noise?
Noise is unwanted sound. The human response to environmental noise is subjective andvaries considerably from individual to individual. The effects of noise can range frominterference with sleep, concentration, and communication, to the causation of physiologicaland psychological stress, and at the highest levels, hearing loss.
How is Sound Described?
Sound is technically described in terms of amplitude (loudness) and frequency (pitch). Thestandard unit of sound amplitude measurement is the decibel (dB). Because the human ear isnot equally sensitive to sound at all frequencies, a special frequency-dependent rating scalehas been devised to relate noise to human sensitivity. The decibel scale adjusted for A-weighting (dBA) provides this compensation by discriminating against frequencies in amanner approximating the sensitivity of the human ear. Over the audible range of pitch, thehuman ear is less sensitive to low frequencies and is more sensitive to mid-level and high-pitched sound. Figure 1 lists noise levels in dBA for various noise sources in the environmentand industry.
Leq, the equivalent energy noise level, is the average acoustic energy content of noise, usuallymeasured over one hour. Thus, the Leq of a time-varying noise and that of a steady noise arethe same if they deliver the same acoustic energy to the ear during exposure. Other noisemeasures give information on the range of instantaneous noise levels experienced over time.Examples include L50, the noise level that was exceeded 50 percent of the time during ameasurement period (e.g., 30 minutes in a one-hour measurement period).
What Difference in Noise Level is Measurable?
The tolerance for Type 1 (precision-grade) sound level meters, generally the most accurateinstrument type used for community noise analyses, is plus or minus 1 dB.

SECTION 2.0 SOUND AND NOISE: A BRIEF PRIMER
S:\00proj\00000030-NRG\Data Request Set 7\Noise\report 120701.doc 3
What Difference in Noise Level is Audible?
Based upon independent studies of human perceptions to noise, a change of 3 dBA is justperceptible, while a 5 dBA change is considered clearly perceptible. Outside of carefullycontrolled conditions, a change of 1 dB is generally not perceptible. A change of 10 dBAwould be perceived by the typical listener as a doubling of loudness.
How does Noise Behave? Is Noise Additive ?
Noise levels from a source diminish as the distance from the receptor increases. Other factorssuch as the weather and reflecting or shielding also help intensify or reduce noise levels atany given location. For a “point” source of noise such as a piece of stationary equipment (ora power plant if the distances are large), the noise is reduced by approximately 6 dBA foreach doubling of distance. Noise levels may also be reduced by intervening structures;generally, a solid structure that just breaks the line-of-sight between the receptor and thenoise source reduces the noise level by approximately 5 dBA.
Because noise levels are typically described using the (logarithmic) decibel scale, noisecalculations involving the combining of two or more levels are performed in the logarithmicdomain. Thus, two identical noise sources, each having a sound pressure level of 60 dBA at agiven reference distance, combine to produce a sound pressure level of 63 dBA, not 120 dBAas one might believe. To increase the noise levels by another 3 dBA, it would be necessary to“switch on” two more 60 dBA sound sources. In other words, for each (just perceptible)increase in the sound pressure level of 3 decibels, a doubling of the sound power is required.
What are Human Responses to Changes in Noise Levels?
Human responses to changes in the noise environment have been categorized in a variety ofways. Furthermore, individual responses can vary widely depending upon hearing acuity aswell as psycho-acoustic factors. One reference1 uses the following scale (shown in Table 1)to describe community responses to noise level changes.
TABLE 1NOISE AND COMMUNITY RESPONSE
Estimated Community ResponseAmount in dB(A) by which the rating sound levelexceeds the noise criterion Category Description
0 None No observed reaction5 Little Sporadic complaints
10 Medium Widespread complaints15 Strong Threats of community action20 Very Strong Vigorous community action
1 Acoustic Noise Measurements, Hassall and Zavari.

SECTION 2.0 SOUND AND NOISE: A BRIEF PRIMER
S:\00proj\00000030-NRG\Data Request Set 7\Noise\report 120701.doc 4
How Does Noise Science Ensure That Changes In Noise Will Not Disturb People?
Noise science is based upon typical human response to noise. The current basis of what is“typical” has primarily been developed over the past four to five decades by social scientistsand psycho-acousticians, using social surveys. Thus, noise science cannot ensure that anyone individual will not be annoyed by a change in the noise environment. Within any largegroup of individuals, there will be a small percentage who are highly sensitive to very smallchanges in noise, a small percentage who are quite insensitive to changes in noise, and amiddle group (constituting the majority) that are moderately sensitive to changes in noise.However, noise science can be used to minimize annoyance to the vast majority of thecommunity, often referred to as “persons of normal sensibility,” in the establishment ofplanning guidelines and noise ordinances.
Does Time of Day or Location of Noise Matter?
Human response to noise is dependent upon time of day. During the nighttime hours(typically defined as being from 10 p.m. to 7 a.m.), humans are generally more sensitive tonoise, and thus tend to be more easily annoyed by noise. Location or context of the noise isalso important. Noises that are known or familiar generally will not elicit a response asreadily as “strange” noises.
What is Masking?
Masking is the process by which the threshold of audibility for one sound is raised by thepresence of another sound. Masking is most effective when the masking sound includes awide range of frequencies2, and is of a sufficient sound power (loudness) to compete with orovershadow the sound of concern. Both surf noise and modern turbine aircraft noise containa wide range of frequencies, and have a great deal of sound power (directly related to theenergy involved with both the surf and the takeoff of large commercial aircraft).
What Does Ambient Noise Level Mean?
Ambient noise is the all-encompassing noise associated with a given environment at aspecified time, being composed of sound from many sources at many directions, near andfar3. For ESPR, the meaning of the term “ambient noise level” is very important because thenoise standards against which the project is assessed are based upon the ambient noise level.
Implicit in noise assessments involving the collection of ambient noise data is the assumptionthat the ambient conditions being measured are typical of that place. CEC siting criteria 2 Handbook of Noise Measurement, Ninth Addition. Arnold P.G. Peterson3 Handbook of Acoustical Measurements and Noise Control, Third Edition. Cyril M. Harris, ed.

SECTION 2.0 SOUND AND NOISE: A BRIEF PRIMER
S:\00proj\00000030-NRG\Data Request Set 7\Noise\report 120701.doc 5
(CEC Siting Regulations, Section 4[B]) specify that in presenting a “representativecharacterization of the ambient noise levels in the project vicinity,” the applicant use “aminimum of 25 consecutive hours at a minimum of one site. Other sites may be monitoredfor a duration at the applicant’s discretion during the same 25-hour period.” The cleardirection is that the chosen 25-hour period should be typical of a normal cycle – neither thequietest nor the loudest day of the year, month, or week.
The California Department of Transportation (Caltrans), in their Technical Noise Supplement(October, 1998), gives the following guidance for those conducting highway noisemeasurements: “…if the purpose of the noise measurements is to determine a future noiseimpact by comparing predicted noise with measured, the measurements must reflect thehighest existing hourly noise level that occurs regularly.” Caltrans and the Federal HighwayAdministration will not fund a soundwall project for a noise impact that only occurs once ortwice a year. Generally, Caltrans recommends that noise measurements be conducted duringmidweek days only (Tuesdays, Wednesdays, and Thursdays) and not during a holiday weekor other unusual major events, to avoid the possibility that conditions are other than typical.
Similarly, airport noise studies generally use one or more years’ worth of aircraft flyover datato generate the noise contours that define noise-impacted areas. The very loudest aircraftevents, while most certainly an important (and annoying) component of the airport’soperations, do not accurately characterize the typical conditions. To accurately characterizethe typical conditions, all of the airport’s typical operations must be factored in, not just thequietest or just the loudest.

NOISE SCALE: COMMON SOUND LEVELS
Project No.: Date: Project: Figure 1EL SEGUNDO POWER REDEVELOPMENTNOVEMBER 20016600000030.03
L:/n
rg/n
oise
sca
le fi
g 1.
fh9
11/
01
SOURCE:Draft EIS/EIR LAX Proposed Master Plan Improvements, Los Angeles, CAU.S. Dept. of Transportation, FAAJanuary 2001

EXISTING ESGS AND 45TH STREETSECTION 3.0 SOUND AND NOISE ENVIRONMENT
S:\00proj\00000030-NRG\Data Request Set 7\Noise\report 120701.doc 7
Figure 2 shows the locations of major ESGS noise sources. Units 1 and 2 are locatedapproximately 2,200 feet away from the nearest residences along 45th Street, while Units 3and 4 are located approximately 1,750 feet away. The gas metering station is locatedapproximately 1,200 feet from the nearest residences. Three fuel oil storage tanks occupy aseven-acre property at the southern end of the ESGS. The two large tanks and theirassociated berms are located immediately north of 45th Street. These structures providevarying degrees of shielding between the residences and the ESGS.
Based upon the noise measurements and critical listening conducted for the project, soundsources at 45th Street residences include the surf from the Pacific Ocean, aircraft departingand (at night) arriving at Los Angeles International Airport (LAX), helicopters and otheraircraft flying overhead and low parallel to the beach, and traffic along HighlandAvenue/Vista Del Mar and local streets. At locations closer to the west end of 45th Street, thesurf sounds are more dominant, while near Highland Avenue/Vista Del Mar, traffic noisebecomes more of a factor (during morning, daytime, and early evening hours). At locationsalong the east end of 45th Street, noises from the adjacent Chevron Refinery can sometimesbe heard. Based upon the observations during the noise measurements, noise from theexisting ESGS is not a primary contributor to the noise environment at residences near 45th
Street.

EXISTING ESGS SOUND AND NOISE ENVIRONMENT
Project No.: Date: Project: Figure 2EL SEGUNDO POWER REDEVELOPMENTNOVEMBER 20016600000030.03
L:/n
rg/e
xist
ES
GS
.fh9
11/
01
El Segundo Generating Station
N
UNITS 1&2UNITS 3&4
GASMETERING
STATION
FUEL OILSTORAGETANKS
Gate
Chevron
Refinery P
roperty
Gate Bike Path
Gate Gate
Gate Gate Bike Path
The Strand
Ocean Dr.
45th St.
Vista Del Mar Blvd.
Gate
Rock Berm
Los AngelesInternational Airport(Approx. 2 Miles North)
Pacific Ocean

SECTION 4.0 ESPR: DESCRIPTION OF CHANGES AND ACTIVITIES
S:\00proj\00000030-NRG\Data Request Set 7\Noise\report 120701.doc 9
ESPR includes several components with the potential or perceived potential to permanentlyeffect the noise environment of adjacent residences. Figure 3 shows the changes in the sitethat will result from the project.
4.1 FUEL OIL STORAGE TANK REMOVAL
The two large fuel oil storage tanks will be removed during ESPR construction. In the earlierplanning stages of the project, the tank removal was to have been accomplished prior to thecommencement of the project, and the cleared area was to be used for construction stagingand storage. Consequently, the initial noise analysis (docketed 12/18/00) did not consider thedirect effects of the removal of the fuel oil tanks. In response to community concern relatingto construction noise, the current plan is to use the empty fuel oil tanks as both a temporarynoise barrier and a warehouse for construction staging and storage. Large access doors wouldbe cut into the tanks in the sides that face away from the El Porto Community. Tank removalwill occur in two stages: the north tank will be removed at the completion of Units 1 and 2demolition; the south tank will be removed at the completion of Units 5, 6, and 7construction.
The fuel oil tanks (each is 219 feet in diameter and 48 feet in height) presently block much orall of the direct view from the west end of the 45th Street area to the ESGS power units.Removal of the two fuel oil tanks would result in changes in the view experienced byresidents and visitors of the El Porto community, particularly along 45th Street and TheStrand. By removing the tanks, observers would have a less obstructed view of the ESGSpower units, although intervening terrain and structures would still shield varying portions ofthe facility from observers, depending upon the observation point.
4.2 REPLACEMENT OF UNITS 1 AND 2 WITH UNITS 5, 6, AND 7
The primary objective of ESPR is the replacement of the two oldest existing power units(Units 1 and 2, which are steam-powered turbines) with a newer, more efficient plant (Units5, 6, and 7, consisting of two combustion turbines and one steam turbine). The noiseproduced by Units 5, 6, and 7 and the associated equipment was analyzed in the initial noiseassessment for the project (Docketed 12/18/00). Units 5, 6, and 7 would incorporate noisereduction features to ensure compliance with CEC and local noise standards (i.e., would notcontribute to a 5 dBA increase above existing conditions at the property line).
4.3 GAS COMPRESSOR STATION
As part of the project, a new gas compressor station (GCS) would be installed approximately300 feet south of Unit 4 and approximately 1,250 feet north of the nearest residences. Thenoise produced from the new gas compressor station was analyzed, along with the other

SECTION 4.0 ESPR: DESCRIPTION OF CHANGES AND ACTIVITIES
S:\00proj\00000030-NRG\Data Request Set 7\Noise\report 120701.doc 10
equipment associated with construction of Units 5, 6, and 7, in the initial noise assessmentfor the project.
The GCS will include noise reduction features to ensure compliance with CEC and localnoise standards (i.e., would not contribute to a 5 dBA increase above existing conditions atthe property line).

SITE MODIFICATIONS WITH PROJECT
Project No.: Date: Project: Figure 3EL SEGUNDO POWER REDEVELOPMENTNOVEMBER 20016600000030.03
L:/n
rg/s
ite m
ods.
fh9
11/
01
El Segundo Generating Station
N
Gate
Chevron
Refinery P
roperty
Gate Bike Path
Gate Gate
Gate Gate Bike Path
The Strand
Ocean Dr.
45th St.
Vista Del Mar Blvd.
Gate
ALL OR PART OF ROCK BERMTO BE REMOVED
FUEL OILSTORAGE TANKSREMOVED
NEW UNITS5,6,7 REPLACE OLD 1&2
UNITS 3&4TO REMAIN
GAS COMPRESSORSTATION
GAS METERING STATIONTO REMAIN

SECTION 5.0 NOISE DATA: NEW AND PREVIOUSLY PRODUCED
S:\00proj\00000030-NRG\Data Request Set 7\Noise\report 120701.doc 12
Table 2 lists the noise data relevant to the 45th Street community noise analyses. Prior AFCfilings, Data Response submittals, and internal analyses used a different numbering systemfor some of the referenced data; thus, the previous symbol or number is provided forreference.
TABLE 2NOISE MONITORING DATA RELEVANT TO 45TH STREET ANALYSES
Location Date(s) Type of Monitoring/DurationPrevious
MeasurementNumber
7/20/00 - 7/21/00 Long-term (25-hr) LT-21 At south side of ESGS, acrossstreet from 45th Street Community 8/31/00 – 9/01/00 Long-term (25-hr) LT-2A
2 In front of 120 45th Street 7/20/00 Short-Term ST-43 Approx. 120 feet south of Unit 4
stack11/13/00 Short-term, broadband and octave band spectral
measurementsST-17
4 North of north fuel oil tank 4/01/01 – 4/02/01(11 p.m. – 1 a.m.)
Short-term, simultaneous with Location 5A and5B measurements to try to determine noisereduction from tanks
ST-19
5A On balcony of 4420 The Strand,overlooking Pacific Ocean
4/01/01 – 4/02/01(11 p.m. – 12 a.m.)
Short-term (1 minute duration, multiple times toscreen for aircraft and other sources)
ST-18A
5B Inside 4420 The Strand,microphone next to an open 2ndfloor window facing north
4/01/01 – 4/02/01(12 a.m. – 1 a.m.)
Short-term (1 minute duration, multiple times toscreen for aircraft and other sources)
ST-18B
6 Adjacent to bike path at boundarybetween ESGS and The Strand
4/02/01 (1:30 a.m.) Short-term, reference measurement of surf noise ST-20
7 85 feet south of gas meteringvalve
4/02/01 Short-term, reference measurement of gasmetering valve
ST-21
8 Approx. 360 feet south of Unit 4stack centerline
4/2/01 Short-term, reference measurement of Unit 4ST-22
6/20/01 – 6/23/01 Long-term, surf noise measurements SNM7/31/01 – 8/03/01 Long-term, surf noise measurements SNM
9 Atop west side of fuel oil tankcontainment berm, west of southfuel oil tank, overlooking the surf 8/06/01 – 8/09/01 Long-term, surf noise measurements SNM
8/10/01 – 8/13/01 Long-term, reference measurement of Unit 4 andrest of plant before, during and after shutdown
Ref.110 Approx. 90 feet southeast of Unit 4Forced Draft Fan
8/16/01 – 8/19/01 Long-term, reference measurement of Unit 4 andrest of plant before, during and after re-start
Ref.1
8/10/01 – 8/13/01 Long-term, reference measurement of Unit 4 andrest of plant before, during and after shutdown
Ref.211 Approx. 1,000 feet south of Unit 4,approx. 600 feet north of 45thStreet residences 8/16/01 – 8/19/01 Long-term, reference measurement of Unit 4 and
rest of plant before, during and after re-startRef.2
8/10/01 – 8/13/01 Long-term, reference measurement of Unit 4 andrest of plant before, during and after shutdown
Ref.312 Approx. 1,600 feet south of Unit 4,approx. 100 feet north of 45thStreet residences, atop securitymonitor pole
8/16/01 – 8/19/01 Long-term, reference measurement of Unit 4 andrest of plant before, during and after re-start
Ref.3
Following is a summary of the analysis methods and results, in the chronological order thatthey took place.

ANALYSIS OF ESPR IMPACT AND CHANGESSECTION 6.0 ON SOUND AND ENVIRONMENT
S:\00proj\00000030-NRG\Data Request Set 7\Noise\report 120701.doc 13
6.1 ORIGINAL AFC ANALYSIS
As explained previously, the original AFC analysis focused on the installation of Units 5, 6,and 7 and related new equipment. The change in noise levels from the removal of the fuel oilstorage tanks was not specifically addressed. However, the analysis did not take credit forshielding from any structures or topography, including Units 3 and 4 or the fuel oil tanks, andwas thus highly conservative. The results of that analysis indicated that the operation of Units5, 6, and 7 and related equipment would result in an increase of less than one decibel in theoverall noise level at the 45th Street community.
6.2 INITIAL ESTIMATE OF FUEL OIL TANK REMOVAL EFFECTS
Using data collected during noise measurements on July 20 – 21, 2000, August 31 –September 1, 2000 and November 13, 2000, the effect of the fuel oil storage tanks’ removalwas estimated analytically. The noise measurement data collected near the existing ESGS(Location 3 as shown in Figure 4), where the dominant noise source was the power plant,was adjusted for the extra distance to the nearest residences and compared with themeasurement data collected near those residences (i.e., Locations 1 and 2). The resultsindicated that the tank removal would result in an increase of approximately 3 to 4 dBA (A-weighted decibels) at the worst-case receivers. This preliminary analysis conservativelyneglected effects from air absorption or shielding from terrain or structures that wouldremain.
6.3 DATA REQUEST ANALYSIS
6.3.1 Simultaneous Measurements North of Fuel Oil Tanks and Inside and Outside4420 The Strand
At the request of the CEC, simultaneous noise measurements were conducted on the northside of the north fuel oil tank (Location 4) and at one of the residences currently receiving themost acoustical shielding from the tanks, located at 4420 The Strand (Location 5A/5B).Adjusting the data to account for the extra distance and the noise influences of the surf and agas metering valve, it was estimated that the post-tank-removal noise levels at the worst-caselocation would be 4 to 5 dBA higher than the pre-tank-removal noise levels during thequietest periods. During typical daytime ambient conditions, it was estimated that noise fromthe ESGS (including ESPR) would not be audible. Noise level effects at other locationswould diminish in direct proportion to the degree of shielding currently provided by the fueloil storage tanks. At locations that currently do not receive any visual shielding from thetanks, removal of the tanks would have no noise effect with regard to noise from ESPR.Although attempts were made to physically and analytically separate the influences of surf

ANALYSIS OF ESPR IMPACT AND CHANGESSECTION 6.0 ON SOUND AND ENVIRONMENT
S:\00proj\00000030-NRG\Data Request Set 7\Noise\report 120701.doc 14
noise and valve noise from the plant noise near the north fuel oil tank, the results of thisstudy were less conclusive than any of the parties had hoped.
6.4 SURF NOISE MEASUREMENTS
To better understand the influence of the ocean surf on the ambient noise conditions in the45th Street community, long-term surf noise measurements were conducted.
Why Surf Noise Measurements?
Figure 5 represents the two sets of 25-hour noise measurement data collected thus far at thesouthern boundary of the El Porto community, at Location 1 (the southern ESGS propertyline, approximately midway between the eastern and western boundaries). Location 1 isshown on Figure 4. The first set of noise data was collected from July 20, 2000 to July 21,2000 while all four existing power units (Units 1, 2, 3, and 4) were operating. The measuredhourly noise levels ranged from 52 – 58 dBA L50 (50 – 56 dBA L90). During the secondmeasurement, conducted from August 31, 2000 to September 1, 2000, only Unit 3 wasoperating. The measured hourly noise levels ranged from 56 – 58 L50 (53 – 57 dBA L90). Thefact that the lowest hourly noise levels were lower with all four power units running thanwith only one unit running suggests that ESGS operations have a negligible effect on thenoise levels at the southern boundary of the ESGS. The differences between LT-2 and LT-2A(up to four decibels) in the lowest hourly noise levels are attributable to local ambient factors,especially surf noise. The surf noise generally masks operations noise from the plant. Thismasking effect has also been evident from critical listening conducted during numerous sitevisits in and around the 45th Street community.
Surf Noise Measurement Methodology
A total of nine days of surf noise measurements (made up of three sets of continuous three-day sessions) were conducted. All three sessions were conducted during the 2001 summerseason. According to residents (and verified by our research), the summertime generally hasthe lowest and therefore quietest surf of the year. The surf noise data is included as AppendixA.
As shown in Figure 4, the noise monitor (Location 9) used for the measurements was locatedalong the west side of the containment berm for the fuel oil storage tanks, approximately 250feet north of the southern ESGS property line. The noise measurement location was selectedin order to have surf noise as the main noise source, with minimal influence from othersources. The noise monitor was mounted on a wooden railing near the top of the containmentberm. The monitor’s microphone had an unobstructed view of the surf, which (depending

ANALYSIS OF ESPR IMPACT AND CHANGESSECTION 6.0 ON SOUND AND ENVIRONMENT
S:\00proj\00000030-NRG\Data Request Set 7\Noise\report 120701.doc 15
upon tide and surf conditions) varied from approximately 150 to 400 feet away. Duringinstallation and removal of the instrument, the surf noise was observed to be the dominantnoise source, with periodic aircraft “events” (flights from LAX and helicopters along thecoastline) and distant beachgoers (during daytime hours) as secondary noise sources. TheESGS was inaudible at the surf noise measurement location, and thus not an influence on themeasurements.
Surf, Meteorology, and Plant Operations Data
In addition to the noise data, information on the surf height, tide levels, and wind werecollected for the three measurement periods. Based upon a historical data search, the surf andmeteorology were consistent with typical summer conditions for the area. Operational datafrom the plant was also obtained for the measurement periods.
Conclusions of Surf Noise Measurements
A multivariate analysis of the surf noise, tide levels, wind data, and plant operation wasconducted and is attached as Appendix D. The multivariate analysis concludes thatenvironmental factors were highly statistically significant as an influence on the surf noise,with wave height being the most statistically significant factor. This analysis also concludesthat plant operations were not a major contributor to the noise levels measured.
6.5 NOISE MODEL RESULTS – CADNA/A®
Cadna/A® is a computer software program for prediction and assessment of noise levels inthe vicinity of industrial facilities and other noise sources. Cadna/A® uses internationallyrecognized algorithms (ISO 9613-2) for the propagation of outdoor sound to calculate thenoise impacts, and presents the resultant noise levels in an easy to understand, graphically-oriented format. The program allows for input of all pertinent features (such as terrain orstructures) that affect noise, resulting in a highly accurate estimate of existing and futurenoise levels.
Cadna/A® was used to create a model of the existing facility and the 45th Street residentialarea to the south. Digital Elevation Modeling was used to account for elevation and terrainfeatures, and aerial photographs were used to model the existing structures. Noise emissionlevels were input using octave band levels (measured near the source of interest), toaccurately estimate noise propagation and attenuation effects. To ensure that the model wasproviding accurate results, the model was tested using previously measured and modelednoise data, and was found to be consistent with both practice and theory.

ANALYSIS OF ESPR IMPACT AND CHANGESSECTION 6.0 ON SOUND AND ENVIRONMENT
S:\00proj\00000030-NRG\Data Request Set 7\Noise\report 120701.doc 16
Noise from Unit 4, the gas metering valve south of Unit 4, and the surf were modeled. Noisefrom other noise sources, such as aircraft from LAX and local traffic, were not included inthe model in order to provide a more conservative analysis, and because these other sources,while generally present, decrease in level during the late night and early morning hours.
Figures 6 and 7 present the results of the Cadna/A® noise analysis. Figure 6 shows theexisting noise environment in and around the ESGS, with the fuel oil tanks in place. Figure 7shows the same noise sources with the tanks removed.
Low Average Ocean Noise Level
In order to provide a conservative assessment, the surf noise levels used in the analysisrepresent “low average” conditions. For each of the nine days of surf noise measurements(conducted in June, July, and August, 2001), the lowest four-hour period was determined andthen averaged. The nine four-hour periods were then averaged, to arrive at the “low average”surf noise level.
Unit 4 and Gas Metering Valve Noise Levels
The noise levels from measurements of Unit 4 and the gas metering valve conducted on4/2/01 were used to calibrate the Cadna/A® model. Units 1, 2, and 4 were operating duringthe time of the measurements. The model was calibrated by increasing or reducing theoverall level of each noise source until the resultant modeled sound pressure level matchedthe measured sound pressure level at a reference point dominated by the source beingadjusted.
Predicted Changes Using Cadna/A®
As can be seen by comparison of Figures 6 and 7 (and review of Table 3), noise levels atresidential receivers are predicted to increase by 0.5 to 1.9 dBA depending upon proximity tothe ocean and the degree to which the tanks shield the receiver. Model Receiver Location C-1(on the corner of 45th Street and The Strand, labeled in Table 3 and shown in Figures 6 and 7)is the residence receiving the most amount of tank shielding from the ESGS. Cadna/A®
predicts that removal of the tanks would result in an overall increase in noise levels of 1.7dBA at this location. The remainder of Model Receiver Locations (C2 through C6) arelocated east of Location C-1. At these locations, the tanks do not shield residences from theESGS as well as at Location C-1. At these locations, Cadna/A® predicts an overall increasein noise levels ranging from 0.5 dBA (Location C-6) to 1.9 dBA (Location C-3). Theseincreases are attributable to an increase in exposure to surf noise, not plant noise. Tankremoval would increase the view (and thus the noise level) of the surf at these locations.

ANALYSIS OF ESPR IMPACT AND CHANGESSECTION 6.0 ON SOUND AND ENVIRONMENT
S:\00proj\00000030-NRG\Data Request Set 7\Noise\report 120701.doc 17
TABLE 3CADNA/A® RESULTS (IN A-WEIGHTED DECIBELS, dBA)
ModelReceptorNumber
With fuel oil tanks in place(existing condition); Unit 4 &
gas metering valve noise levelsfrom test conditions; "low-ambient" surf noise levels
(A)
With fuel oil tanks removed;Unit 4 & gas metering valve
noise levels from testconditions; "low-ambient" surf
noise levels(B)
Noise level difference
(B-A)C-1 52.5 54.2 1.7C-2 50.1 51.5 1.4C-3 48 49.9 1.9C-4 47.8 49.3 1.5C-5 48.3 49 0.7C-6 48.1 48.6 0.5
In summary, Cadna/A® analysis indicates that at the residential locations currently receivingthe most acoustical benefit from tank shielding with respect to Unit 4, the effect of tankremoval would be an increase in noise levels of less than 2 dBA during conditions of “lowaverage” surf. During conditions of average and above-average surf, the increase in noiselevels attributable to tank removal would be further reduced.
6.6 UNIT 4 SHUTDOWN AND RESTART
Unit 4 was shutdown for scheduled maintenance on midnight of August 11, 2001. Long-termnoise monitors were installed prior to the shutdown and programmed to record the noiselevels before, during, and after Unit 4 shutdown. Noise monitors were installed in threelocations onsite: Location 10 immediately south of Unit 4; Location 11 approximately 1,000feet south of Unit 4; and Location 12 approximately 1,500 feet south of Unit 4, adjacent tothe southern ESGS property boundary. Locations 10, 11, and 12 are shown in Figure 4.These locations were carefully selected in an effort to isolate – to the extent possible – noiseemanating from Unit 4:
• Location 10 is in the immediate proximity of Unit 4 (approximately 160feet southeast of the forced draft fan);
• Location 11 is as far south as possible while still maintaining a line-of-sight to Unit 4 (particularly the forced draft fan and the west side of Unit4, including the stack);
ANALYSIS OF ESPR IMPACT AND CHANGESSECTION 6.0 ON SOUND AND ENVIRONMENT
S:\00proj\00000030-NRG\Data Request Set 7\Noise\report 120701.doc 18
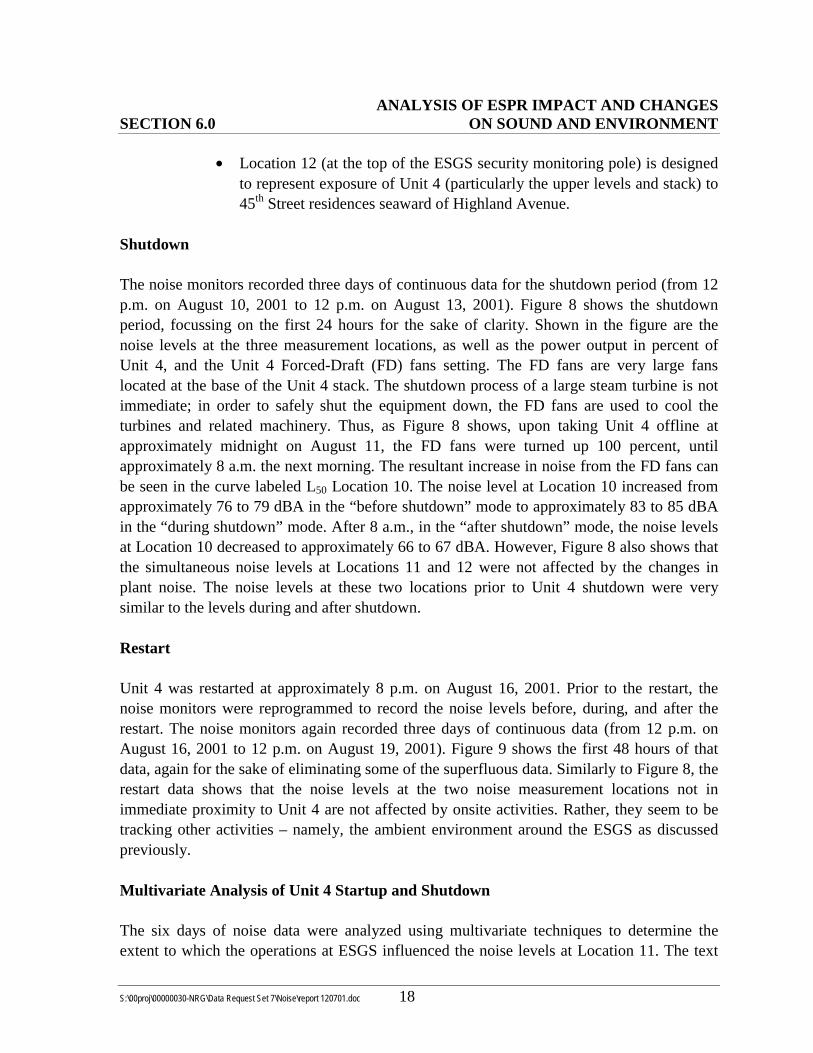
• Location 12 (at the top of the ESGS security monitoring pole) is designedto represent exposure of Unit 4 (particularly the upper levels and stack) to45th Street residences seaward of Highland Avenue.
Shutdown
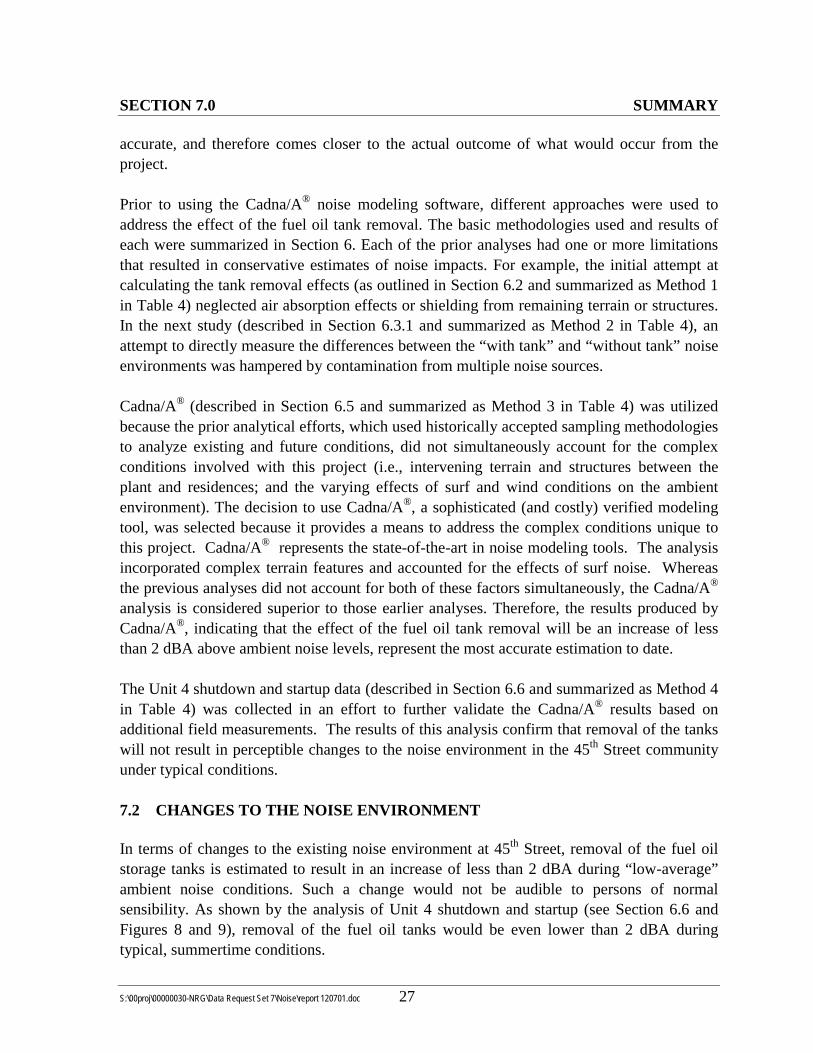
The noise monitors recorded three days of continuous data for the shutdown period (from 12p.m. on August 10, 2001 to 12 p.m. on August 13, 2001). Figure 8 shows the shutdownperiod, focussing on the first 24 hours for the sake of clarity. Shown in the figure are thenoise levels at the three measurement locations, as well as the power output in percent ofUnit 4, and the Unit 4 Forced-Draft (FD) fans setting. The FD fans are very large fanslocated at the base of the Unit 4 stack. The shutdown process of a large steam turbine is notimmediate; in order to safely shut the equipment down, the FD fans are used to cool theturbines and related machinery. Thus, as Figure 8 shows, upon taking Unit 4 offline atapproximately midnight on August 11, the FD fans were turned up 100 percent, untilapproximately 8 a.m. the next morning. The resultant increase in noise from the FD fans canbe seen in the curve labeled L50 Location 10. The noise level at Location 10 increased fromapproximately 76 to 79 dBA in the “before shutdown” mode to approximately 83 to 85 dBAin the “during shutdown” mode. After 8 a.m., in the “after shutdown” mode, the noise levelsat Location 10 decreased to approximately 66 to 67 dBA. However, Figure 8 also shows thatthe simultaneous noise levels at Locations 11 and 12 were not affected by the changes inplant noise. The noise levels at these two locations prior to Unit 4 shutdown were verysimilar to the levels during and after shutdown.
Restart
Unit 4 was restarted at approximately 8 p.m. on August 16, 2001. Prior to the restart, thenoise monitors were reprogrammed to record the noise levels before, during, and after therestart. The noise monitors again recorded three days of continuous data (from 12 p.m. onAugust 16, 2001 to 12 p.m. on August 19, 2001). Figure 9 shows the first 48 hours of thatdata, again for the sake of eliminating some of the superfluous data. Similarly to Figure 8, therestart data shows that the noise levels at the two noise measurement locations not inimmediate proximity to Unit 4 are not affected by onsite activities. Rather, they seem to betracking other activities – namely, the ambient environment around the ESGS as discussedpreviously.
Multivariate Analysis of Unit 4 Startup and Shutdown
The six days of noise data were analyzed using multivariate techniques to determine theextent to which the operations at ESGS influenced the noise levels at Location 11. The text
ANALYSIS OF ESPR IMPACT AND CHANGESSECTION 6.0 ON SOUND AND ENVIRONMENT
S:\00proj\00000030-NRG\Data Request Set 7\Noise\report 120701.doc 19
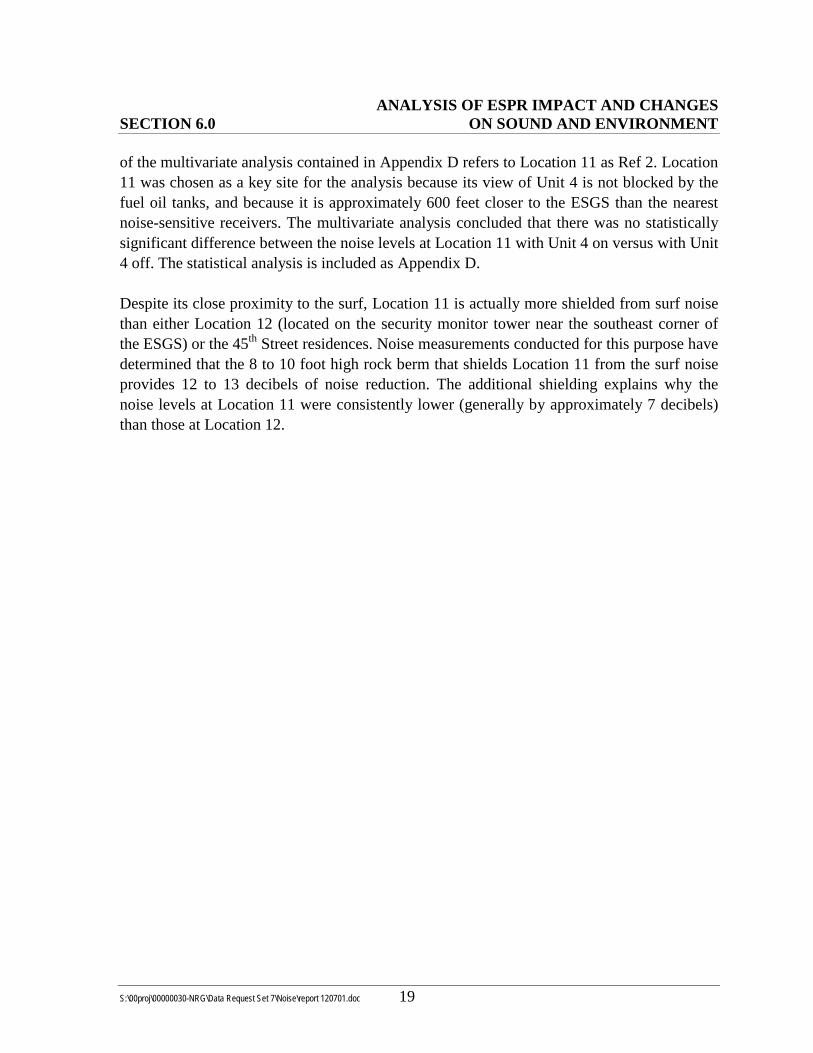
of the multivariate analysis contained in Appendix D refers to Location 11 as Ref 2. Location11 was chosen as a key site for the analysis because its view of Unit 4 is not blocked by thefuel oil tanks, and because it is approximately 600 feet closer to the ESGS than the nearestnoise-sensitive receivers. The multivariate analysis concluded that there was no statisticallysignificant difference between the noise levels at Location 11 with Unit 4 on versus with Unit4 off. The statistical analysis is included as Appendix D.
Despite its close proximity to the surf, Location 11 is actually more shielded from surf noisethan either Location 12 (located on the security monitor tower near the southeast corner ofthe ESGS) or the 45th Street residences. Noise measurements conducted for this purpose havedetermined that the 8 to 10 foot high rock berm that shields Location 11 from the surf noiseprovides 12 to 13 decibels of noise reduction. The additional shielding explains why thenoise levels at Location 11 were consistently lower (generally by approximately 7 decibels)than those at Location 12.

9
7
8
3
NOISE MEASUREMENT LOCATIONS
Project No.: Date: Project: Figure 4EL SEGUNDO POWER REDEVELOPMENTNOVEMBER 20016600000030.03
L:/n
rg/p
rope
rty fi
g 4.
fh9
11/
01
Gate
Chevron
Refinery P
roperty
Gate Bike Path
Gate Gate
Gate Gate Bike Path
The Strand
Ocean Dr.
45th St.
Vista Del Mar Blvd.
El Segundo Generating StationG
ate
G
Rock Berm
41
122
5B
5A
1 Noise Measurement Location
LEGEND
6
11
10
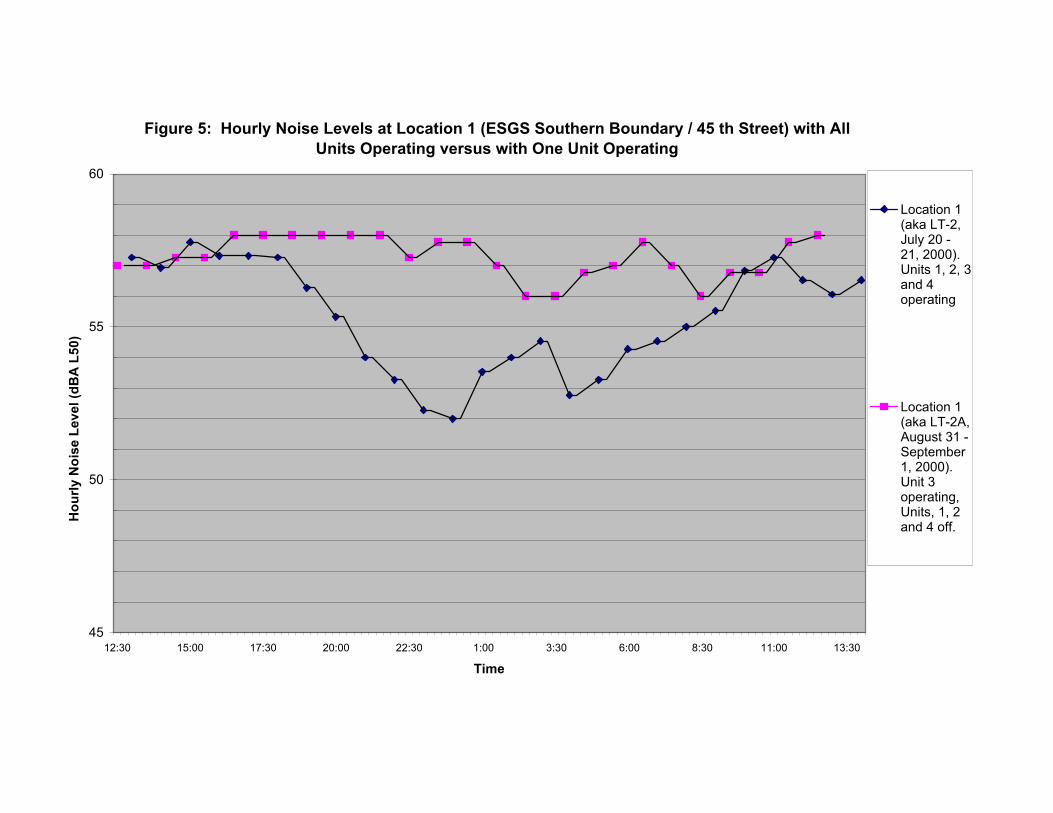
Figure 5: Hourly Noise Levels at Location 1 (ESGS Southern Boundary / 45 th Street) with All Units Operating versus with One Unit Operating
45
50
55
60
12:30 15:00 17:30 20:00 22:30 1:00 3:30 6:00 8:30 11:00 13:30
Time
Hou
rly N
oise
Lev
el (d
BA
L50
)
Location 1(aka LT-2,July 20 -21, 2000).Units 1, 2, 3and 4operating
Location 1(aka LT-2A,August 31 -September1, 2000).Unit 3operating,Units, 1, 2and 4 off.


Figure 8: Unit 4 Shut-Down Noise Measurements 8-10-01 - 8-11-01: Simultaneous Noise Levels (dBA L50) for Locations 10, 11 and 12 Plus Unit 4 Settings
40
45
50
55
60
65
70
75
80
85
90
12:008/10/2001
14:00 16:00 18:00 20:00 22:00 0:008/11/2001
2:00 4:00 6:00 8:00 10:00 12:00 14:00
Date/Time
Soun
d Pr
essu
re L
evel
(dB
A)
0%
10%
20%
30%
40%
50%
60%
70%
80%
90%
100%
Uni
t 4 S
ettin
gs (P
erce
nt)
Location 10
Location 11
Location 12
Unit 4 Forced-Draft FanSetting(Percent)
Unit 4 PowerOutput(Percent)

12/17/2001 11:15 AM Figure 9 Unit 4 restart Ref 1, 2 & 3 + Power Chart
Figure 9: Unit 4 Restart Noise Measurements 8-16-01 - 8-18-01: Simultaneous Noise Levels (dBA L50) for Locations 10, 11 and 12, plus Unit 4 Settings
40
45
50
55
60
65
70
75
80
85
12:00 8/16/01
14:00 16:00 18:00 20:00 22:00 0:00 8/17/01
2:00 4:00 6:00 8:00 10:00 12:00 14:00 16:00 18:00 20:00 22:00 0:00 8/18/01
2:00 4:00 6:00 8:00 10:00 12:00
Date / Time
Soun
d Pr
essu
re L
evel
(dB
A)
0
0.1
0.2
0.3
0.4
0.5
0.6
0.7
0.8
0.9
1
Uni
t 4 S
ettin
gs (P
erce
nt)
L50 Ref.1
L50 Ref.2
L50 Ref.3
Unit 4PowerOutput(Percent)

SECTION 7.0 SUMMARY
S:\00proj\00000030-NRG\Data Request Set 7\Noise\report 120701.doc 26
7.1 SUMMARY OF NOISE SURVEY RESULTS AND METHODS
Table 4 summarizes the results from the various analyses conducted for this project.
TABLE 4NOISE IMPACTS SUMMARY
AnalysisMethod
Estimated Noise LevelIncrease from Fuel Oil
Tank Removal
Comments (Method, Limitations)
1 Approximately 4 dBA Using short-term measurement data near ESGS, adjusted for distanceto nearest residence. This analysis conservatively neglected shieldingeffects from terrain or remaining structures, as well as effects from airabsorption.
2 4.8 dBA Simultaneous noise measurements conducted north of the fuel oiltanks and at residence receiving maximum tank shielding from theESGS. Difficult to physically “exclude” and analytically separate theeffects of gas metering valve noise, plant noise and ocean noise fromone another.
3 Less than 2 dBA Cadna/A® computer model; accounts for topography, multiple sourcesand levels input as octave band (frequency-specific). Utilized “low-average” (i.e., quiet summertime surf) ambient conditions.
4 Not measurable (1 dBAor less)
Simultaneous, long-term measurements at multiple locations whileUnit 4 was shut down and then restarted. Conservative becausereference measurement location unobstructed by the tanks (Location11) was approximately 600 feet closer to Unit 4 than the nearestresidences.
Rationale for Selection of Different Analysis Methods Used for the ESPR Project
Noise analyses are conducted to try to estimate or predict the results of something that is notreadily measurable. It is understood that the available calculation methods are not perfect;assumptions and approximations must be made. Because of this, in conducting noise analysesas in any type of engineering study, it is standard practice to err on the side of caution. This isoften referred to as conducting a “worst-case” analysis, or using “conservative engineeringjudgement.” For ESPR, the noise analysis has consistently followed this conservativepractice. For example, the initial analysis of the noise effects from Units 5, 6, and 7 did nottake any credit for noise shielding from existing and remaining structures or terrain features.Thus the analysis of noise levels from Units 5, 6, and 7 at residences to the south ignores anynoise-shielding that would be provided by Units 3 and 4, or any other objects.
The corollary to the standard engineering practice of erring on the side of caution is that themore sophisticated the analysis approach taken, the less conservative the assumptions need tobe. An analysis that takes into account more of the factors involved is by definition more
SECTION 7.0 SUMMARY
S:\00proj\00000030-NRG\Data Request Set 7\Noise\report 120701.doc 27
accurate, and therefore comes closer to the actual outcome of what would occur from theproject.
Prior to using the Cadna/A® noise modeling software, different approaches were used toaddress the effect of the fuel oil tank removal. The basic methodologies used and results ofeach were summarized in Section 6. Each of the prior analyses had one or more limitationsthat resulted in conservative estimates of noise impacts. For example, the initial attempt atcalculating the tank removal effects (as outlined in Section 6.2 and summarized as Method 1in Table 4) neglected air absorption effects or shielding from remaining terrain or structures.In the next study (described in Section 6.3.1 and summarized as Method 2 in Table 4), anattempt to directly measure the differences between the “with tank” and “without tank” noiseenvironments was hampered by contamination from multiple noise sources.
Cadna/A® (described in Section 6.5 and summarized as Method 3 in Table 4) was utilizedbecause the prior analytical efforts, which used historically accepted sampling methodologiesto analyze existing and future conditions, did not simultaneously account for the complexconditions involved with this project (i.e., intervening terrain and structures between theplant and residences; and the varying effects of surf and wind conditions on the ambientenvironment). The decision to use Cadna/A®, a sophisticated (and costly) verified modelingtool, was selected because it provides a means to address the complex conditions unique tothis project. Cadna/A® represents the state-of-the-art in noise modeling tools. The analysisincorporated complex terrain features and accounted for the effects of surf noise. Whereasthe previous analyses did not account for both of these factors simultaneously, the Cadna/A®
analysis is considered superior to those earlier analyses. Therefore, the results produced byCadna/A®, indicating that the effect of the fuel oil tank removal will be an increase of lessthan 2 dBA above ambient noise levels, represent the most accurate estimation to date.
The Unit 4 shutdown and startup data (described in Section 6.6 and summarized as Method 4in Table 4) was collected in an effort to further validate the Cadna/A® results based onadditional field measurements. The results of this analysis confirm that removal of the tankswill not result in perceptible changes to the noise environment in the 45th Street communityunder typical conditions.
7.2 CHANGES TO THE NOISE ENVIRONMENT
In terms of changes to the existing noise environment at 45th Street, removal of the fuel oilstorage tanks is estimated to result in an increase of less than 2 dBA during “low-average”ambient noise conditions. Such a change would not be audible to persons of normalsensibility. As shown by the analysis of Unit 4 shutdown and startup (see Section 6.6 andFigures 8 and 9), removal of the fuel oil tanks would be even lower than 2 dBA duringtypical, summertime conditions.

SECTION 7.0 SUMMARY
S:\00proj\00000030-NRG\Data Request Set 7\Noise\report 120701.doc 28
7.3 IMPACTS AND LORS COMPLIANCE
CEC, COES, and COMB noise standards will not be exceeded at nearby residences;therefore, ESPR, including removal of the fuel oil tanks, will, by definition, not have asignificant noise impact on this area.
ESPR will have no significant noise impact, as defined by the California EnvironmentalQuality Act (CEQA), and will be LORS-compliant under the terms of the Warren-AlquistAct.

SECTION 8.0 SUMMARY OF LORS COMPLIANCE
S:\00proj\00000030-NRG\Data Request Set 7\Noise\report 120701.doc 29
Following is a brief summary of the project’s compliance with applicable laws, ordinances,regulations and standards (LORS).
8.1 WARREN-ALQUIST ACTIVITIES
Pursuant to the Warren-Alquist Act, the CEC is required to establish reasonable impactassessment criteria. To this end, CEC siting criteria (Section 4[A]) uses a 5-dBA increase asthe basis for determining impacts in community noise analysis. ESPR will meet this 5-dBAcriteria.
8.2 CALIFORNIA ENVIRONMENTAL QUALITY ACTIVITIES
CEQA requires an analysis of noise impacts using industry standards and practices, andrequires mitigation if significant impacts are identified. If a determination of no significantimpacts is made, mitigation is not required. Based on the analyses, ESPR will not causesignificant noise impacts.
8.3 CITY OF MANHATTAN BEACH NOISE ORDINANCE
ESPII believes that COMB’s noise standards are compatible with and essentially equivalentto the CEC and COES criterion of ambient noise level plus 5 dBA.
Section 5.48.160 is the portion of the COMB Noise Ordinance dealing with exterior noisestandards. Table 1 of Section 5.48.160 lists exterior noise standards that may not be exceededfor a cumulative period of more than 30 minutes in any hour. Because the project is a powerplant, emitting a (nearly) continuous noise level, Section 5.48.160 is the applicable noisestandard. The residential noise standard is 50 dBA from 7 a.m. to 10 p.m., and 45 dBA from10 p.m. to 7 a.m. The commercial noise standard is 65 dBA from 7 a.m. to 10 p.m., and theindustrial noise standard is 70 dBA. Table 1 also includes the statement that if the 30-minuteper hour ambient level (L50) exceeds the applicable level, then the ambient L50 becomes theexterior noise standard which may not be exceeded for a cumulative period of more than 30minutes in any hour. Subsection F of Section 5.48.160 states in part: “If the measurementlocation is on a boundary between two (2) different land use classifications, the noise levellimit applicable to the more restrictive land use classification plus five (5) dB, shall apply”(Ord. 1957am eff 12/5/96).
The ESPR Project property (an industrial land use) is located immediately to the north of45th Street. The El Porto Community (a residential land use) is located immediately to thesouth of 45th Street. Therefore, ESPII believes that subsection F of Section 5.48.160 isapplicable. Pursuant to subsection 5.48.160 (F), the noise level limit would be the ambient
SECTION 8.0 SUMMARY OF LORS COMPLIANCE
S:\00proj\00000030-NRG\Data Request Set 7\Noise\report 120701.doc 30
noise level plus 5 dBA, which is consistent with the analysis presented in the Application forCertification (AFC).
Contrary to the above interpretation, the City asserts that a 2-dBA increase is the applicableimpact threshold. Based upon the Cadna/A® and the Unit 4 shutdown analyses, ESPR willmeet this 2-dBA threshold criteria.
8.4 CITY OF EL SEGUNDO NOISE ORDINANCE
The COES Noise Ordinance sets permissible project-related increases above ambient noiselevels by land use; 5 dBA above the ambient noise level is the limit for residential, while 8dBA above the ambient noise level is the limit for commercial and industrial. ESPR willmeet these threshold criteria.

SECTION 9.0 PROPOSED NOISE REDUCTION MEASURES
S:\00proj\00000030-NRG\Data Request Set 7\Noise\report 120701.doc 31
Based on the results presented herein, the following measures are recommended to ensurethat operational noise from implementation of the ESPR Project will not adversely impactresidents of the El Porto community:
1. Modify ESPR Condition of Certification NOISE-6 to reflect standard noise impactmeasurement (i.e., 25-hour continuous survey at the start of operations) which aredesigned to verify the pre-construction noise estimates and quantify the actual operationalnoise conditions. This would entail post-construction ambient noise measurements in theproximity of Unit 4, and extrapolation of those measurements to the nearest receptors.Pure tone analysis would be conducted in the immediate vicinity of the nearest residentialreceptors.
2. Contingent on the acceptance of Recommendation 1, provide acoustical treatment of thesouth side of Unit 4, as an enhancement to the project.
These recommendations are discussed below.
9.1 PROPOSED CONDITION OF CERTIFICATION NOISE-6
ESPII recommends the following proposed noise Condition of Certification be implemented.
NOISE-6. Upon the project first achieving an output of 80 percent or greater of ratedcapacity, the project owner shall conduct a 25-hour community noise survey, utilizing thesame monitoring sites employed in the pre-project ambient noise survey as a minimum. Thesurvey shall also include the octave band pressure levels to ensure that no new pure-tonenoise components have been introduced. No single piece of equipment shall be allowed tostand out as a dominant source of noise that draws complaints. Steam relief valves shall beadequately muffled to preclude noise that draws complaints. The noise contributed by theESPR operations at the nearest residence shall not exceed the ambient noise level by 5 dBAL50 under normal operating conditions. If the results from the survey indicate that powerplant noise levels are in excess of 5 dBA L50 above the ambient at the nearest residence,additional mitigation measures shall be implemented to reduce noise to a level of compliancewith this limit. The mitigation measures (to be employed as required) include, but are notlimited to:
1. Standard outdoor/weather enclosures for the combustion turbine generator packages;2. Air inlet silencers for the combustion turbines;3. Standard outdoor/weather enclosure for the steam turbine;4. Generator packages; and5. Silencers for the heat recovery steam generator exhaust stacks.

SECTION 9.0 PROPOSED NOISE REDUCTION MEASURES
S:\00proj\00000030-NRG\Data Request Set 7\Noise\report 120701.doc 32
Protocol
The measurement of power plant noise for purposes of demonstrating compliance with thisCondition may be made at an acceptable location close to the plant (e.g., 400 to 1,000 feetfrom the power generating units), and this measured level may then be mathematicallyextrapolated to determine the plant noise contribution at the nearest sensitive receptor.
Notwithstanding the use of this alternative method for determining the noise level, thecharacter of plant noise shall be evaluated at the nearest sensitive receptor to determine thepresence of pure tones or other dominant sources of plant noise.
Within thirty (30) days after first achieving an output of 80 percent or greater of rated output,the project owner shall conduct the above described noise survey. Within thirty (30) daysafter completing the survey, the project owner shall submit a summary report of the survey tothe Cities of El Segundo and Manhattan Beach, and to the CPM. Included in the report willbe a description of any additional mitigation measures necessary to achieve compliance withthe above listed noise limits, and a schedule, subject to CPM approval, for implementingthese measures. Within thirty (30) days of completion of installation of these measures, theproject owner shall submit to the CPM a summary report of a new noise survey, performedas described above and showing compliance with this Condition.
9.2 POSSIBLE NOISE REDUCTION TREATMENT OF UNIT 4 SOUTH SIDE
Contingent on acceptance of the proposed Noise-6 condition, acoustical treatment of thesouth side of Unit 4 could be implemented as an enhancement to the project. The acousticaltreatment would be designed to achieve a minimum reduction of Unit 4 noise of 2 decibels.
Noise reduction of Unit 4 would have a negligible beneficial effect on the community duringall but the very quietest times of the year for short periods of time and is not requiredpursuant to the California Environmental Quality Act (CEQA) or the Warren-Alquist Act.This is because the potentially affected receptors – the residents and visitors around the ElPorto Community – are typically the recipients of sounds and noises from a variety ofsources other than the power plant. Surf noise, aircraft noise from LAX, and roadway noiseare all major contributors to the noise environment in the area.

SECTION 10.0 REFERENCES
S:\00proj\00000030-NRG\Data Request Set 7\Noise\report 120701.doc 33
California Department of Transportation. 1998. Technical Noise Supplement to the TrafficNoise Analysis Protocol (in reference to ambient noise and determination of noiseimpacts)
California Energy Commission. August 2000. Rules of Practice and Procedure & Power PlantSite Certification Regulations. Siting Regulations. Sacramento, CA.
Hassall, J.R. and K. Zaveri. 1988. Acoustic Noise Measurements. Fifth Edition. Brüel and KjærInstruments, Inc. Copenhagen, Denmark.
Harris, Cyril M., ed. 1991. Handbook of Acoustical Measurements and Noise Control. ThirdEdition. McGraw-Hill, Inc. New York, NY.
International Organization for Standardization (ISO). 1996. ISO 9613-2: Acoustics –Attenuation of sound during propagation outdoors (as used by Cadna/A® noisemodeling program.
Peterson, A.P.G. and E. Gross, Jr. 1972. Handbook of Noise Measurement. Seventh Edition.General Radio Company. Concord, MA.
City of El Segundo. El Segundo Municipal Code, Title 9 – Peace, Safety, and Morals, Chapter9.06, Noise and Vibration Regulations.
City of Manhattan Beach. 1996. City of Manhattan Beach Municipal Code, Chapter 5.48 NoiseRegulations-General Provisions.