Embed Size (px)
Citation preview
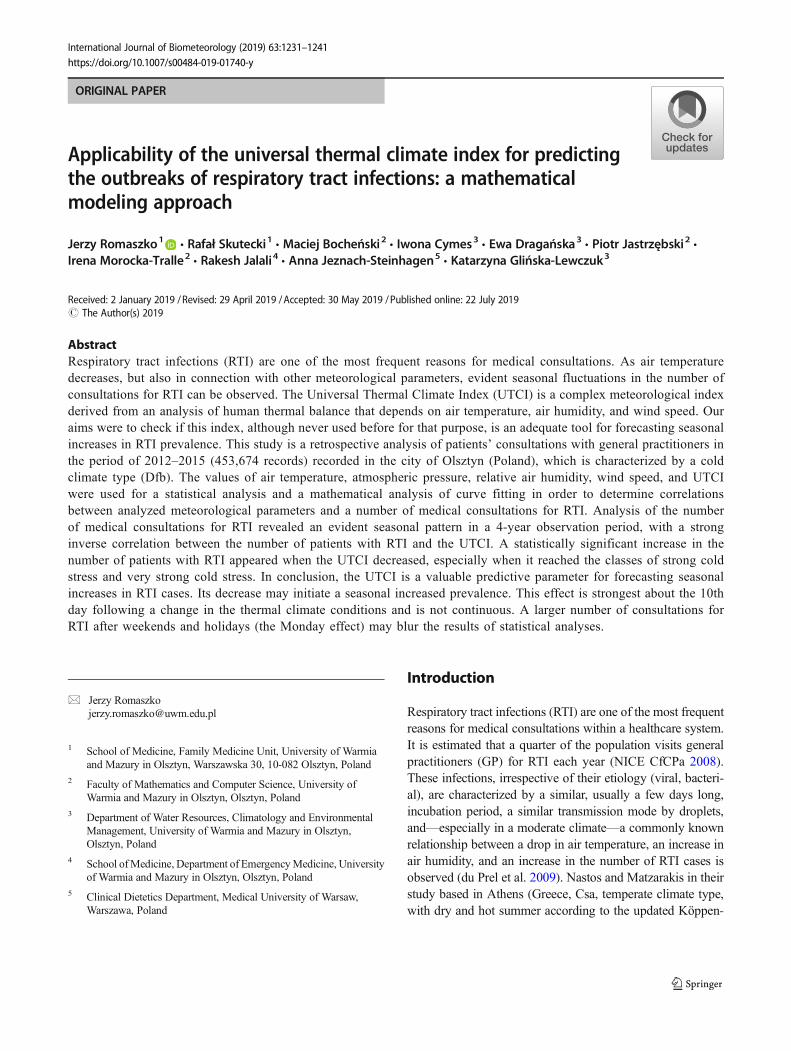
ORIGINAL PAPER
Applicability of the universal thermal climate index for predictingthe outbreaks of respiratory tract infections: a mathematicalmodeling approach
Jerzy Romaszko1& Rafał Skutecki1 & Maciej Bocheński2 & Iwona Cymes3 & Ewa Dragańska3 & Piotr Jastrzębski2 &
Irena Morocka-Tralle2& Rakesh Jalali4 & Anna Jeznach-Steinhagen5
& Katarzyna Glińska-Lewczuk3
Received: 2 January 2019 /Revised: 29 April 2019 /Accepted: 30 May 2019 /Published online: 22 July 2019# The Author(s) 2019
AbstractRespiratory tract infections (RTI) are one of the most frequent reasons for medical consultations. As air temperaturedecreases, but also in connection with other meteorological parameters, evident seasonal fluctuations in the number ofconsultations for RTI can be observed. The Universal Thermal Climate Index (UTCI) is a complex meteorological indexderived from an analysis of human thermal balance that depends on air temperature, air humidity, and wind speed. Ouraims were to check if this index, although never used before for that purpose, is an adequate tool for forecasting seasonalincreases in RTI prevalence. This study is a retrospective analysis of patients’ consultations with general practitioners inthe period of 2012–2015 (453,674 records) recorded in the city of Olsztyn (Poland), which is characterized by a coldclimate type (Dfb). The values of air temperature, atmospheric pressure, relative air humidity, wind speed, and UTCIwere used for a statistical analysis and a mathematical analysis of curve fitting in order to determine correlationsbetween analyzed meteorological parameters and a number of medical consultations for RTI. Analysis of the numberof medical consultations for RTI revealed an evident seasonal pattern in a 4-year observation period, with a stronginverse correlation between the number of patients with RTI and the UTCI. A statistically significant increase in thenumber of patients with RTI appeared when the UTCI decreased, especially when it reached the classes of strong coldstress and very strong cold stress. In conclusion, the UTCI is a valuable predictive parameter for forecasting seasonalincreases in RTI cases. Its decrease may initiate a seasonal increased prevalence. This effect is strongest about the 10thday following a change in the thermal climate conditions and is not continuous. A larger number of consultations forRTI after weekends and holidays (the Monday effect) may blur the results of statistical analyses.
Introduction
Respiratory tract infections (RTI) are one of the most frequentreasons for medical consultations within a healthcare system.It is estimated that a quarter of the population visits generalpractitioners (GP) for RTI each year (NICE CfCPa 2008).These infections, irrespective of their etiology (viral, bacteri-al), are characterized by a similar, usually a few days long,incubation period, a similar transmission mode by droplets,and—especially in a moderate climate—a commonly knownrelationship between a drop in air temperature, an increase inair humidity, and an increase in the number of RTI cases isobserved (du Prel et al. 2009). Nastos and Matzarakis in theirstudy based in Athens (Greece, Csa, temperate climate type,with dry and hot summer according to the updated Köppen-
* Jerzy [email protected]
1 School of Medicine, Family Medicine Unit, University of Warmiaand Mazury in Olsztyn, Warszawska 30, 10-082 Olsztyn, Poland
2 Faculty of Mathematics and Computer Science, University ofWarmia and Mazury in Olsztyn, Olsztyn, Poland
3 Department of Water Resources, Climatology and EnvironmentalManagement, University of Warmia and Mazury in Olsztyn,Olsztyn, Poland
4 School ofMedicine, Department of EmergencyMedicine, Universityof Warmia and Mazury in Olsztyn, Olsztyn, Poland
5 Clinical Dietetics Department, Medical University of Warsaw,Warszawa, Poland
International Journal of Biometeorology (2019) 63:1231–1241https://doi.org/10.1007/s00484-019-01740-y

Geiger climate classification) reported a statistically signifi-cant difference in the number of GP consultations dependingon air temperature (minimum, maximum and mean) and ab-solute humidity (Peel et al. 2007). They also reported a 10-daylag between worsened weather and RTI epidemiological onset(Nastos and Matzarakis 2006). When analyzing data fromKajaani, Finland (Dfc, cold climate type, without dry seasonand with cold summer), characterized by a different climatezone, Makinen et al. obtained a statistically significant corre-lation between cases of RTI and decreased air temperatureand/or decreased humidity and a similar 14-day lag for theoccurrence of RTI (Makinen et al. 2009). Hajat et al., basedon the dataset collected from primary care settings in 16 urbanlocations in the UK, also described a relationship between adrop in temperature and the number of consultations for RTI(Hajat et al. 2004). They reported that this effect proved stron-ger in the north and weaker in the south of the country. Thisrelationship between RTI occurrences and temperature hasbeen also described in several other studies (Danielides et al.2002; Fielder 1989). In 2009, when analyzing reasons for thehospitalization of children due to viral causes in Mainz(Germany), Prel et al. reported an association between mete-orological parameters and the cases of hospitalization for RTI.According to their data, rhinoviruses (the most common in-fectious agents) preferred a humid climate whereas many oth-er respiratory pathogens, such as RSV (respiratory syncytialvirus) and influenza A, favored low temperatures (du Prelet al. 2009).
The increased interest of researchers in biometeorologicalconditions for RTI occurrences includes not only outdoor airtemperatures (maximum, minimum, mean), but also windspeed, air humidity, and other meteorological parameters(Liu et al. 2016). Biometeorology employs various methodsand indices as well as mathematical models to determine re-lationships between meteorological parameters and humanhealth (Epstein and Moran 2006; Lowe et al. 2018).
More complex bioclimatic indices represent relationshipsbetween values of a few basic meteorological parameters asempirical formulas. One of the first indices, introduced in the1940s, was the wind chill index (WCI), which is especiallyuseful when assessing winter conditions (Court 1948). Otherindices include, for instance, effective temperature (ET), nor-mal effective temperature (NET), heat stress index (HSI), orhumidex (Li and Chan 2000; Masterton and Fa 1979;Osczevski and Bluestein 2005). It should be remembered,however, that most of these indices do not relate directly tophysiological reactions of the human organism in response tochanging thermal conditions. Consequently, a number of com-plex indices have been designed based on the analysis of hu-man thermal balance, such as physiological equivalent tem-perature (PET), perceived temperature (PT), physiologicalsubjective temperature (PST), and physiological strain (PhS)(Blazejczyk 1994; Błażejczyk and McGregor 2008;
Laschewski and Jendritzky 2002; Matzarakis and Mayer1996). The most recent index from this group is the universalthermal climate index (UTCI), which was developed as a re-sult of international cooperation within the framework of theCOST Action 730 (Cooperation in Science and TechnicalDevelopment) in the years 2005–2009 (Brode et al. 2012;Jendritzky et al. 2009). The UTCI is based on the analysis ofhuman thermal balance with the application of the Fiala modelthat is one of the most advanced multinode thermoregulatorymodels (Fiala et al. 2012; Fiala et al. 1999, 2001). The UTCI isa universal index due to its appropriateness for thermal assess-ments in all climates, seasons, and scales (Pantavou et al.2018; Blazejczyk et al. 2012; McGregor 2012). As comparedwith other indices, the UTCI is more sensitive to changes inthe following ambient stimuli: temperature, solar radiation,humidity, and wind speed (Blazejczyk et al. 2012).Additionally, the UTCI, unlike, e.g., PET, is independent ofpersonal characteristics such as age, gender, specific activities,and clothing (Bröde 2000).
Although the relationship between seasonal increases inRTI occurrences and a drop in temperature is well document-ed, the time lag between these two phenomena still remainsunclear. Moreover, it should be remembered that this correla-tion is not continuous and the worsening of weather condi-tions is only one of the elements that initiate an epidemiolog-ical cascade. Work organizational issues are one of the factorsthat blur methodological correctness of analyses concerningthe number of patients admitted within the framework of thehealthcare system. If the daily (or even hourly) analysis ofmeteorological parameters is methodologically sound, theanalysis of patients’ daily admissions raises doubts due tothe organizational framework of the healthcare system(Buckingham-Jeffery et al. 2017; Whynes et al. 1999). Thefrequency of patients’ daily visits as regards outpatient clinicsis uneven and ranges from a minimal number on weekends tomaximal values on Mondays, a phenomenon that we termed“the Monday effect”.
In this paper, we suggest that the UTCI should be ap-plied to predict consultations for RTI within the healthcaresystem framework just by monitoring daily UTCI valuesbased on a mathematical model attenuating “the Mondayeffect”.
Materials and methods
Study population
The study is a retrospective analysis of an epidemiologicaldataset based on the register of patients’ admissions withinthe framework of the healthcare system in the city ofOlsztyn (north-eastern Poland). Olsztyn has a populationof 180,000 inhabitants. The dataset was created on the
1232 Int J Biometeorol (2019) 63:1231–1241

basis of medical records from two primary care institutions(non-public primary healthcare centre Atarax andPantamed limited liability company), a service register ofthe Regional Ambulance Station and a register of admis-sions at the Emergency Department of the RegionalSpecialist Hospital in Olsztyn. Primary care centers areopened from 8:00 to 18:00 h Monday to Friday, and pro-vide medical care for about 20,500 patients daily (the ac-tive list changes every day; however, these changes areminimal as compared to the total number of patients).The maximal and minimal records of admitted patients inboth practices within the analyzed period were Atarax;6402/6855, Pantamed; 13913/14147, respectively. TheEmergency Department of the Regional Hospital is thelargest one out of three departments in the city ofOlsztyn. Patients are referred there by their GPs, arebrought in by the Emergency Service, and report directlyif they believe their health conditions require immediatehelp. The Regional Ambulance Station provides servicesfor the municipal commune of Olsztyn and three smallersub-municipal communes, including the population ofapprox. 200,000 people in total. Both the EmergencyDepartment of the Regional Hospital and the RegionalAmbulance Station work within the 24/7 service system.In our study, we used all medical records registered inthese institutions from 01.01.2012 to 31.12.2015,consisting in total of 452,674 records. From this number,67548 records were selected for the purpose of this analy-sis, as they represented diagnoses from J00 to J22 (respi-ratory tract infections) and A38 (scarlet fever) according toICD 10 (the 10th revision of the International StatisticalClassification of Diseases and Related Health Problems),(WHO 1992).
During the 4-year observation period, 67,548 patients withRTI were recorded, 56.8% of whom were females and 43.2%males (Table 1). Out of the total number of patients, as manyas 33,401 (49.5%) infected patients were younger than16 years of age and 15,237 (22.6%) patients were between
the ages of 17–35, while 5626 (8.32%) were older than65 years of age (Table 1).
Depending on the age group, RTI amounted to 4–5% up to50–51% of the causes for consultations within the healthcaresystem (Fig. 1).
The majority (96.6%) of the examined consultationsoccurred in primary care centers (opened from Mondayto Friday). Significant differences (p < 0.05) in the num-ber of consultations were revealed for particular weekdays(Table 2).
Meteorological data
Meteorological data for the period of analysis, i.e., 2012–2015, were obtained from the Olsztyn weather station belong-ing to the Institute of Meteorology and Water Management inWarsaw, Poland. Olsztyn is characterized by a cold climate,without dry season and with warm summer (Dfb, Peel et al.2007). An evident annual seasonal pattern of weather condi-tions determines the occurrence of 4 seasons. January was thecoldest month during the analyzed period, with a mean airtemperature of − 2.5 °C; July was the warmest, with a meantemperature of 18.9 °C. The annual precipitation rate was550 mm, and relative humidity amounted to 79%. The meanwind speed was 3 m/s, whereas the strongest wind was record-ed in winter (December, January).
On each day, UTCI values were calculated for 6:00,12:00, and 18:00 Coordinated Universal Time (UTC). Forthe calculations of universal thermal climate index, thefollowing simplified equation (Eq. 1) was applied(Błażejczyk 2011):
UTCIh ¼ 3:21þ 0:872 � Tair þ 0:2459
�Mrt–2:5078 �WS–0:0176 � RHð1Þ
where UTCIh universal thermal climate index calculatedfor hours (h); 6:00, 12:00, and 18:00 using meteorologicaldata from these hours, Tair air temperature (°C), Mrt mean
Table 1 Age groups of patients with RTI in Olsztyn in the period of 2012–2015
Age group Females Males Total males and females
Symbol Number F (%) Total (%) Symbol Number M (%) Total (%) Number Total (%)
0 to 1 F1 2355 6.14 3.49 M1 2926 10.03 4.33 5281 7.82
2 to 3 F2 3944 10.28 5.84 M2 4235 14.51 6.27 8179 12.12
4 to 6 F3 4985 12.99 7.38 M3 5289 18.12 7.83 10,274 15.21
7 to 16 F4 4940 12.88 7.31 M4 4727 16.20 7.00 9667 14.31
17 to 35 F5 9633 25.11 14.26 M5 5604 19.20 8.30 15,237 22.56
36 to 64 F6 8732 22.76 12.93 M6 4552 15.60 6.74 13,284 19.66
≥ 65 F7 3772 9.83 5.58 M7 1854 6.35 2.74 5626 8.32
Total – 38,361 100 56.79 – 29,187 100 43.21 67,548 100
Int J Biometeorol (2019) 63:1231–1241 1233

radiant temperature (°C), WS wind speed at 10 m aboveground (m s−1), RH relative humidity of air (%).
From the UTCI values calculated on a given day, the valueindicating the most severe conditions was selected to representand assess thermal load on that day. UTCI values are classifiedby taking into account the intensity of the organism’s physio-logical reactions during specific meteorological conditions,which is associated with the necessity of employing variousprotective means against overheating and hypothermia. Heatstress may appear on days characterized by high temperatureand intensive solar radiation. Among the UTCI heat stressclasses that appeared during the period of our study wereUTCI_ +1 (moderate) (with temperatures from 26.1 to32.0 °C), UTCI_ +2 (strong) (from 32.1 to 38.0 °C),UTCI_ +3 (very strong) (38.1 to 46.0 °C), and UTCI_ +4(extreme) (> 46.0 °C). Cold stress, on the other hand, mightbe experienced when air temperature is low and wind speed ishigh. Among UTCI cold stress classes were indicated: UTCI_
−1 (slight) (0.1 to 9.0 °C), UTCI_−2 (moderate) (from 12.9 to237 0.0 °C), UTCI_−3 (strong) (− 26.9 to − 13.0), UTCI_−4(very strong) (from− 39.9 to − 27.0 °C), and UTCI _−5(extreme) (< − 40.0 °C). Thermoneutral conditions (UTCIclass O) refer to conditions when UTCI values indicate theabsence of heat stress, thus ranging from 9.1 to 26 °C. Basedon such assumptions, it is possible to divide thermal condi-tions into classes and ascribe patients with RTI to these classes(Table 3).
Statistical analyses
A preliminary and exploratory statistical analysis was carriedout by a traditional approach, i.e., by evaluating the relation-ships between daily consultations rates and daily weather databy using a regression analysis. This examination was per-formed for the overall group of 67,548 patients and for sevendifferent age groups: younger than 1 year; from 2 to 3 years;from 4 to 6 years; from 7 to 16 years; from 17 to 35 years;from 36 to 64 years; and older than 65 years of age.
A one-way analysis of variance (ANOVA) with theTukey’s multiple comparison test (p < 0.05) as a post hoc pro-cedure was used to test differences between numbers of ad-missions for RTI during consecutive days of a week (Table 2)as well as between groups of infected patients in UTCI clas-ses. The mean abundances and standard deviations (± SD)were calculated using Dell™ Statistica™ 13.1.
Values of mean daily air temperature (Tair), air pressure(Patm), relative humidity (RH), wind speed (WS), and UTCIwere used to analyze the relationship between the occurrencesof infectious diseases (RTI) and weather conditions via a par-tial least squares regression (PLS-R). This is a technique thatcombines features from a principal component analysis (PCA)and a multiple linear regression method (Fleming et al. 2002).The PLS-R model is based on a linear combination of the
Fig. 1 Share of age groups andgender in admissions due toinfectious diseases versus totalnumber of admissions (gray). Fstands for females, while Mstands for males. F1 and M1 from0 to 1 year old; F2 and M2 from 2to 3 years old; F3 and M3 from 4to 6 years old; F4 and M4 from 7to 16 years old; F5 and M5 from17 to 35 years old; F6 and M6from 36 to 64 years old; F7, M7 ≥65 years old.
Table 2 Number ofadmissions (%) ofpatients with RTI inOlsztyn in the period of2012–2015 on specificweekdays
Day of week Admissions (%)
Monday 27.53d
Tuesday 19.04c
Wednesday 17.25bc
Thursday 16.66b
Friday 18.49bc
Saturday 0.54a
Sunday 0.49a
Statistical significance was determinedwith the variance analysis (one-wayANOVA, post hoc Tukey’s HSD test).Groups of mean values that do not differstatistically are marked with the same let-ters (standard error: mean square (MS) be-tween groups = 689.65, degree of freedom(df) = 1454.0, for p < 0.0001)
1234 Int J Biometeorol (2019) 63:1231–1241
original scores that aim at the best representation of the re-sponse variable, hereafter the number of RTI admissions (Y).It is a useful technique when the problem of multi-colinearityappears (e.g., between the UTCI and temperature). As part ofPLS-R analyses, the procedure of importance for the projec-tion (VIP) for each explanatory variable, hereafter meteoro-logical factor (X) was performed to show which of them con-tribute most to the model. AVIP value > 1 indicates that thevariable is very relevant in the process of explaining Y, where-by parameters with a VIP < 0.8 contribute little to the predic-tion (Henningsson et al. 2001). All PLS-R analyses were per-formed using the XLSTAT ver. 2018.3 software for data anal-ysis and statistical application available for Microsoft Excel®by Addinsoft.
Mathematical analysis
For reasons explained in the Introduction and referring to theaim of the study (the Monday effect, lack of event continuity),in order to calculate the relationship between the UTCI and thenumber of admissions for RTI, a mathematical method ofcurve fitting was applied.
By an infectious disease outbreak we mean the rapid in-crease in the number of admissions to healthcare system insti-tutions. To identify the outbreak, we adopted the followingreal-valued functions (Eq. 2and Eq. 3):
f 1 tð Þ≔ewt−wt−1wt−1 −1 ð2Þ
and
f 2 tð Þ≔ewt−wt−2wt−2 −1; ð3Þ
where wt denotes the number of admissions during the weeknumber t, wt − 1 denotes the number of admissions during theweek number t − 1, and wt − 2 denotes the number of admis-sions during the week number t − 2. Notice that f1 (f2, respec-tively) measures the exponential of the relative increase in thenumber of admissions with respect to the number of admis-sions the week before (2 weeks before, respectively).Therefore f1 and f2 grow exponentially with the relative in-crease of admissions.
To determine a relationship between admissions and UTCIvalues, we take the extremal (minimum ormaximum) value ofdaily UTCI from each week (i.e., for each weekwe set a UTCIvalue as the extremal UTCI value among the correspondingseven daily ones). Note that UTCI values associated to colderthermal stress occur in the winter season, and those associatedto hotter thermal stress occur in summer season. Thus, theUTCI value can be approximated by a periodic function oftime (within a 1-year period). We use the following function(Eq.4):
g tð Þ ¼ a0 þ a1cos Atð Þ þ b1sin Atð Þ ð4Þand calculate the coefficients a0, a1, b1, and A using CurveFitting Tool from Matlab (The MathWorks). The goodnessof the curve fitting is expressed using the R-squared [Eq. 5- Eq. 8]
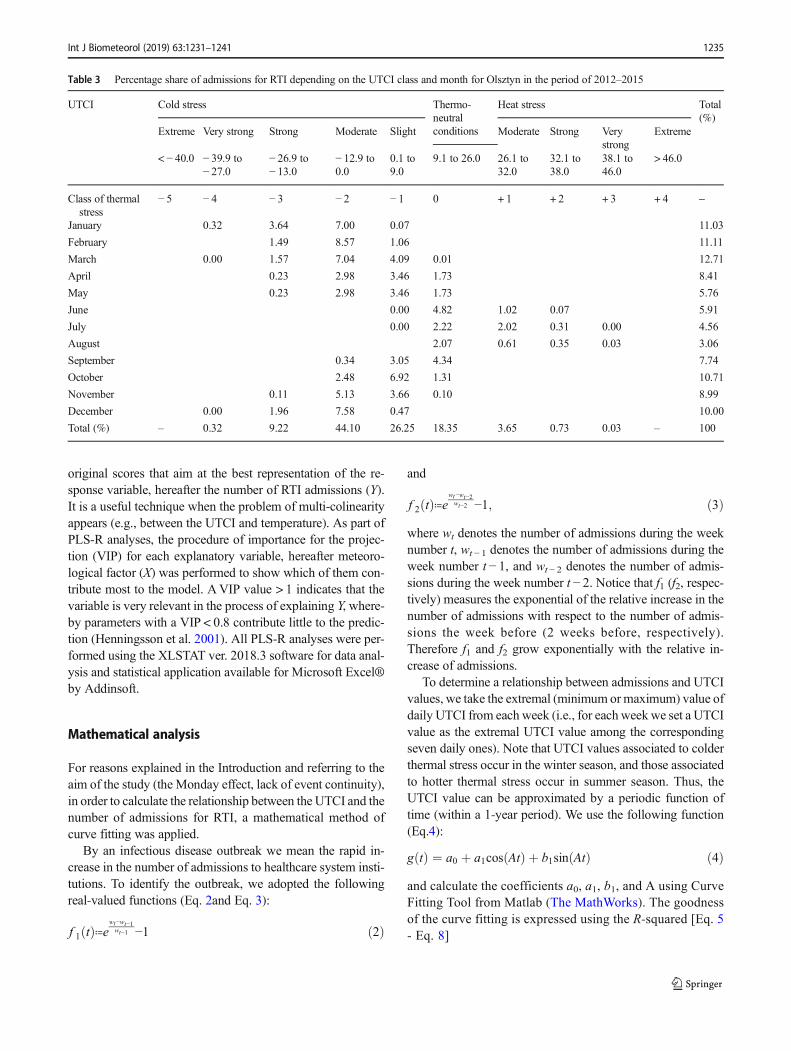
Table 3 Percentage share of admissions for RTI depending on the UTCI class and month for Olsztyn in the period of 2012–2015
UTCI Cold stress Thermo-neutralconditions
Heat stress Total(%)
Extreme Very strong Strong Moderate Slight Moderate Strong Verystrong
Extreme
< − 40.0 − 39.9 to− 27.0
− 26.9 to− 13.0
− 12.9 to0.0
0.1 to9.0
9.1 to 26.0 26.1 to32.0
32.1 to38.0
38.1 to46.0
> 46.0
Class of thermalstress
− 5 − 4 − 3 − 2 − 1 0 + 1 + 2 + 3 + 4 –
January 0.32 3.64 7.00 0.07 11.03
February 1.49 8.57 1.06 11.11
March 0.00 1.57 7.04 4.09 0.01 12.71
April 0.23 2.98 3.46 1.73 8.41
May 0.23 2.98 3.46 1.73 5.76
June 0.00 4.82 1.02 0.07 5.91
July 0.00 2.22 2.02 0.31 0.00 4.56
August 2.07 0.61 0.35 0.03 3.06
September 0.34 3.05 4.34 7.74
October 2.48 6.92 1.31 10.71
November 0.11 5.13 3.66 0.10 8.99
December 0.00 1.96 7.58 0.47 10.00
Total (%) – 0.32 9.22 44.10 26.25 18.35 3.65 0.73 0.03 – 100
Int J Biometeorol (2019) 63:1231–1241 1235

R−squared ¼ 1−ST; ð5Þ
S ¼ ∑n
i¼1y tið Þ−g tið Þð Þ2; ð6Þ
T ¼ ∑n
i¼1y tið Þ−y
� �2; ð7Þ
y ¼ 1
n∑n
i¼1y tið Þ; ð8Þ
where ti denotes the ith week, y(ti) is the UTCI value in theith week, and g(ti) is the predicted UTCI value in the ithweek. Next, we find values of the function, i.e., the UTCIvalues, corresponding to the weeks in which the outbreaksoccurred.
Ethic statement
This is a retrospective epidemiological study of medicalevents registered routinely in the healthcare system. Suchobservational analyses do not require the consent of theEthical Committee. Data necessary for analysis were ob-tained with consent of the heads of all four medical insti-tutions (data were anonymous) and provided by them.Personal details of patients were not processed duringthe study.
Results
The analysis of daily medical consultations of patientswith RTI revealed an evident seasonal pattern during a4-year observation period (Fig. 2). The curve illustratingadmissions for RTI is of sinusoidal shape which adverselyfollows the sinusoidal waveform of UTCI values.Extremely high UTCI values, generally achieved in sum-mer, correspond to minimal numbers of patients’
consultations for RTI, and this tendency is seen as re-versed in winter: low UTCI values correspond to in-creased numbers of admissions for RTI.
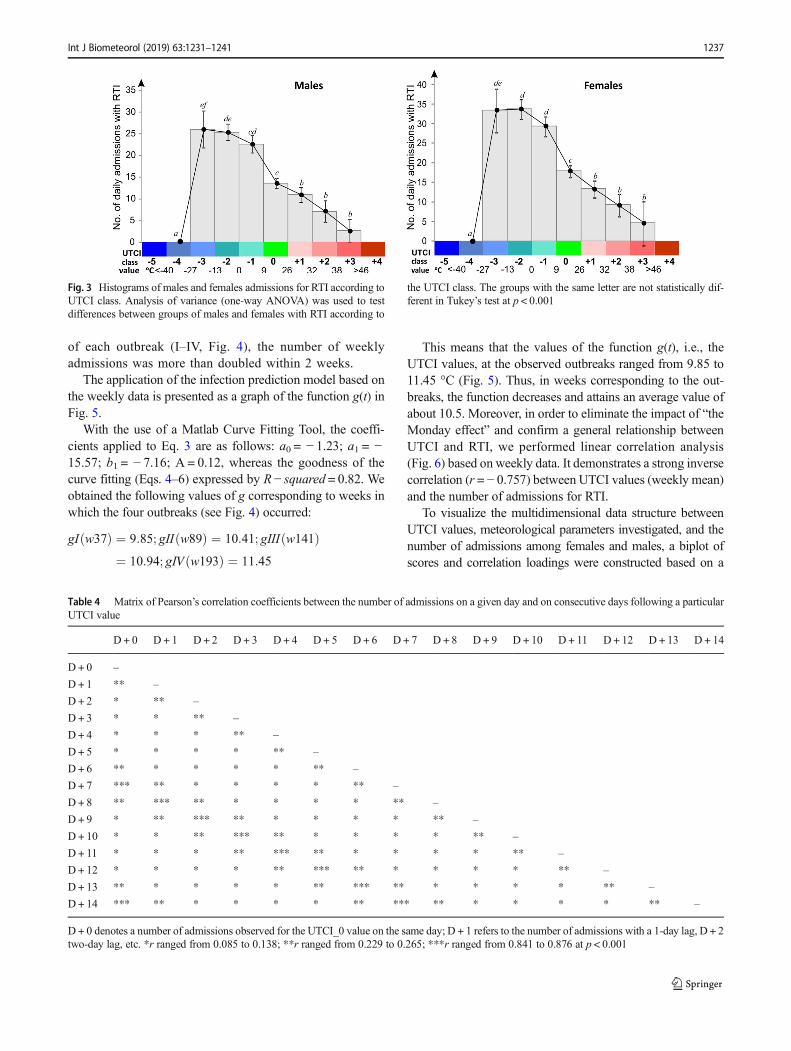
The inversely proportional relationship of daily chang-es in the number of patients with RTI in relation to UTCIvalues is confirmed when comparing the share of infec-tious diseases in the groups of females and males in rela-tion to UTCI classes (Fig. 3). Irrespective of gender, astatistically significantly higher number of consultationsfor RTI was revealed for UTCI classes − 3, − 2, and − 1(one-way ANOVA, Tukey’s test, p < 0.001), whereasUTCI classes + 1, + 2, and + 3 created a homogenousgroup with a statistically significantly lower number ofadmissions of patients with RTI (Fig. 3). UTCI 0 repre-sents a thermoneutral class that differs significantly fromother UTCI classes (except for class − 1 for males).
Using daily numbers of admissions for RTI in relation toUTCI values yields satisfactory results in analyzing long-term relationships (e.g., seasonal patterns), demonstratinga generalized cause-effect trend (Fig. 2). Short-term dataanalyses, however, require careful attention due to the al-ready mentioned “Monday effect”, as a result of whichafter weekends and holidays, when primary care centersare closed, aggregated numbers of admissions were ob-served (Table 4).
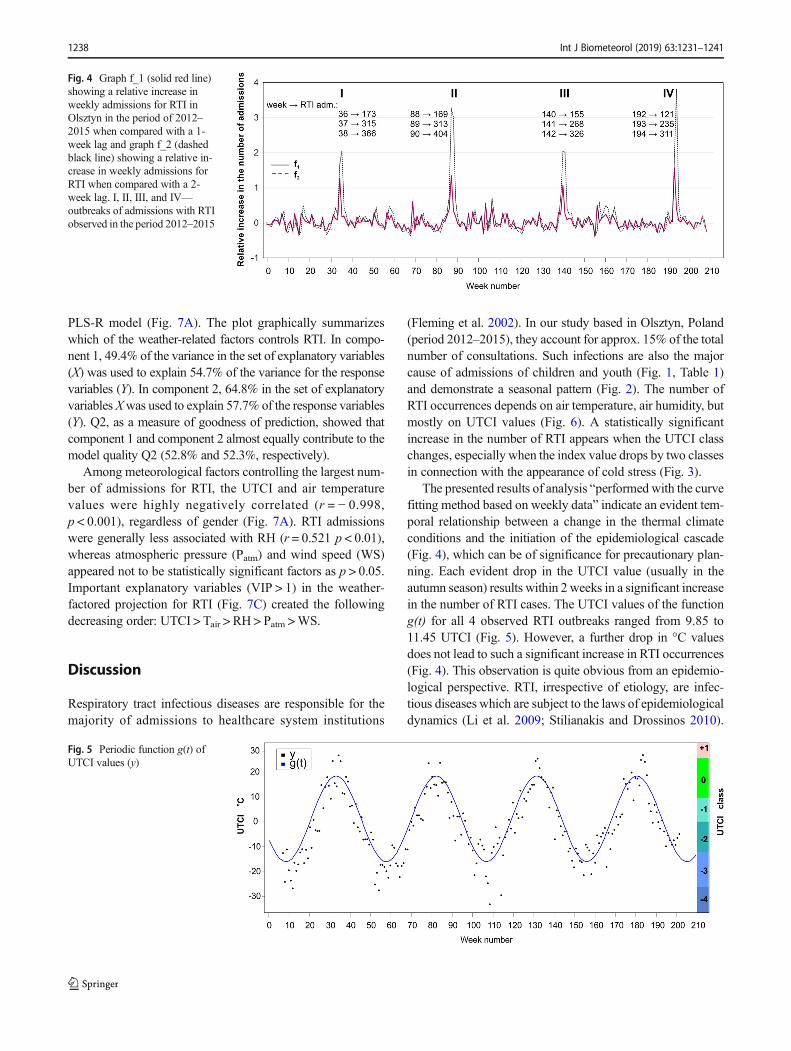
Having a complementary epidemiological and meteo-rological dataset of many years at our disposal, we used amathematical model based on the curve fitting model(Fig. 4) to calculate an actual time lag of epidemiologicaloutbreaks. In order to reduce “the Monday effect”, weused temporal (weekly) time intervals (N = 208). We ob-tained four distinct outbreaks (see Fig. 4) in the dataset: I(between 36 and 38 weeks of observation) (Autumn2012); II (between 88 and 90 weeks of observation)(Autumn 2013); III (between 140 and 142 weeks of ob-servation) (Autumn 2014), and IV (between 192 and194 weeks of observation) (Autumn 2015). In the case
Fig. 2 Actual daily number of consultations for RTI within the healthcare system in the city of Olsztyn and UTCI values in the analyzed period of 2012–2015
1236 Int J Biometeorol (2019) 63:1231–1241
of each outbreak (I–IV, Fig. 4), the number of weeklyadmissions was more than doubled within 2 weeks.
The application of the infection prediction model based onthe weekly data is presented as a graph of the function g(t) inFig. 5.
With the use of a Matlab Curve Fitting Tool, the coeffi-cients applied to Eq. 3 are as follows: a0 = − 1.23; a1 = −15.57; b1 = − 7.16; A = 0.12, whereas the goodness of thecurve fitting (Eqs. 4–6) expressed by R − squared = 0.82. Weobtained the following values of g corresponding to weeks inwhich the four outbreaks (see Fig. 4) occurred:
gI w37ð Þ ¼ 9:85; gII w89ð Þ ¼ 10:41; gIII w141ð Þ¼ 10:94; gIV w193ð Þ ¼ 11:45
This means that the values of the function g(t), i.e., theUTCI values, at the observed outbreaks ranged from 9.85 to11.45 °C (Fig. 5). Thus, in weeks corresponding to the out-breaks, the function decreases and attains an average value ofabout 10.5. Moreover, in order to eliminate the impact of “theMonday effect” and confirm a general relationship betweenUTCI and RTI, we performed linear correlation analysis(Fig. 6) based on weekly data. It demonstrates a strong inversecorrelation (r = − 0.757) between UTCI values (weekly mean)and the number of admissions for RTI.
To visualize the multidimensional data structure betweenUTCI values, meteorological parameters investigated, and thenumber of admissions among females and males, a biplot ofscores and correlation loadings were constructed based on a
Table 4 Matrix of Pearson’s correlation coefficients between the number of admissions on a given day and on consecutive days following a particularUTCI value
D + 0 D + 1 D + 2 D + 3 D + 4 D + 5 D + 6 D + 7 D + 8 D + 9 D + 10 D + 11 D + 12 D + 13 D + 14
D + 0 –
D+ 1 ** –
D+ 2 * ** –
D+ 3 * * ** –
D+ 4 * * * ** –
D+ 5 * * * * ** –
D+ 6 ** * * * * ** –
D+ 7 *** ** * * * * ** –
D+ 8 ** *** ** * * * * ** –
D+ 9 * ** *** ** * * * * ** –
D+ 10 * * ** *** ** * * * * ** –
D+ 11 * * * ** *** ** * * * * ** –
D+ 12 * * * * ** *** ** * * * * ** –
D+ 13 ** * * * * ** *** ** * * * * ** –
D+ 14 *** ** * * * * ** *** ** * * * * ** –
D+ 0 denotes a number of admissions observed for the UTCI_0 value on the same day; D + 1 refers to the number of admissions with a 1-day lag, D + 2two-day lag, etc. *r ranged from 0.085 to 0.138; **r ranged from 0.229 to 0.265; ***r ranged from 0.841 to 0.876 at p < 0.001
Fig. 3 Histograms of males and females admissions for RTI according toUTCI class. Analysis of variance (one-way ANOVA) was used to testdifferences between groups of males and females with RTI according to
the UTCI class. The groups with the same letter are not statistically dif-ferent in Tukey’s test at p < 0.001
Int J Biometeorol (2019) 63:1231–1241 1237
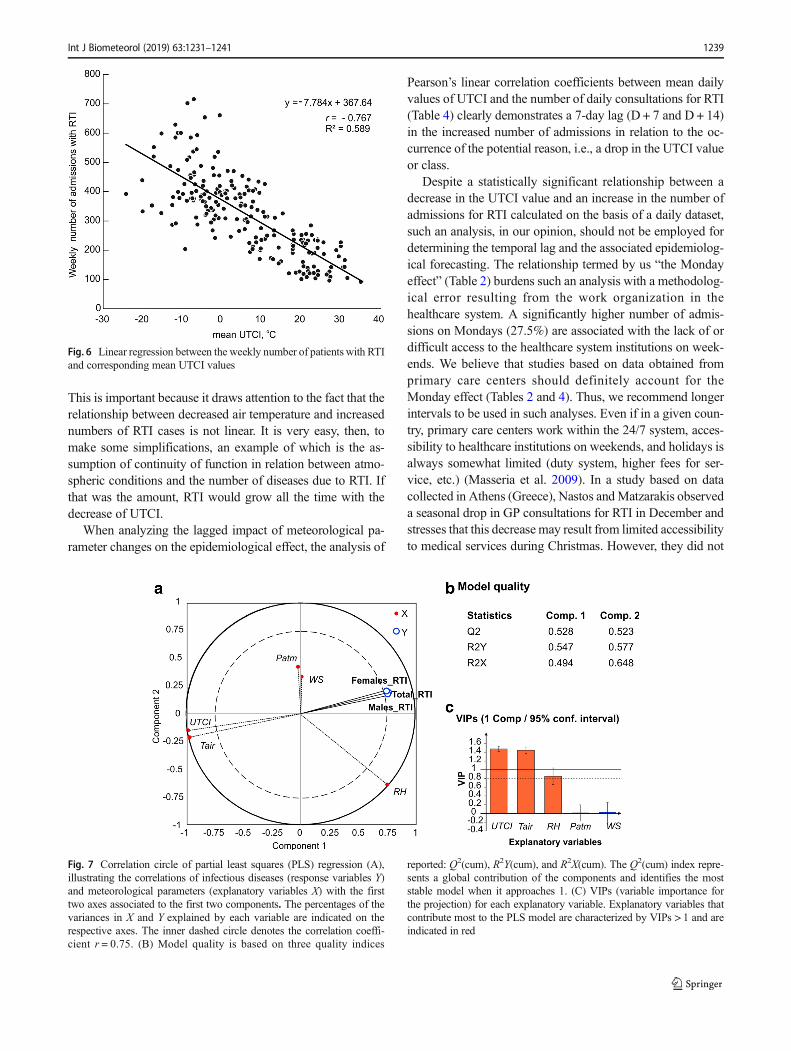
PLS-R model (Fig. 7A). The plot graphically summarizeswhich of the weather-related factors controls RTI. In compo-nent 1, 49.4% of the variance in the set of explanatory variables(X) was used to explain 54.7% of the variance for the responsevariables (Y). In component 2, 64.8% in the set of explanatoryvariables Xwas used to explain 57.7% of the response variables(Y). Q2, as a measure of goodness of prediction, showed thatcomponent 1 and component 2 almost equally contribute to themodel quality Q2 (52.8% and 52.3%, respectively).
Among meteorological factors controlling the largest num-ber of admissions for RTI, the UTCI and air temperaturevalues were highly negatively correlated (r = − 0.998,p < 0.001), regardless of gender (Fig. 7A). RTI admissionswere generally less associated with RH (r = 0.521 p < 0.01),whereas atmospheric pressure (Patm) and wind speed (WS)appeared not to be statistically significant factors as p > 0.05.Important explanatory variables (VIP > 1) in the weather-factored projection for RTI (Fig. 7C) created the followingdecreasing order: UTCI > Tair > RH > Patm >WS.
Discussion
Respiratory tract infectious diseases are responsible for themajority of admissions to healthcare system institutions
(Fleming et al. 2002). In our study based in Olsztyn, Poland(period 2012–2015), they account for approx. 15% of the totalnumber of consultations. Such infections are also the majorcause of admissions of children and youth (Fig. 1, Table 1)and demonstrate a seasonal pattern (Fig. 2). The number ofRTI occurrences depends on air temperature, air humidity, butmostly on UTCI values (Fig. 6). A statistically significantincrease in the number of RTI appears when the UTCI classchanges, especially when the index value drops by two classesin connection with the appearance of cold stress (Fig. 3).
The presented results of analysis “performed with the curvefitting method based on weekly data” indicate an evident tem-poral relationship between a change in the thermal climateconditions and the initiation of the epidemiological cascade(Fig. 4), which can be of significance for precautionary plan-ning. Each evident drop in the UTCI value (usually in theautumn season) results within 2 weeks in a significant increasein the number of RTI cases. The UTCI values of the functiong(t) for all 4 observed RTI outbreaks ranged from 9.85 to11.45 UTCI (Fig. 5). However, a further drop in °C valuesdoes not lead to such a significant increase in RTI occurrences(Fig. 4). This observation is quite obvious from an epidemio-logical perspective. RTI, irrespective of etiology, are infec-tious diseases which are subject to the laws of epidemiologicaldynamics (Li et al. 2009; Stilianakis and Drossinos 2010).
Fig. 4 Graph f_1 (solid red line)showing a relative increase inweekly admissions for RTI inOlsztyn in the period of 2012–2015 when compared with a 1-week lag and graph f_2 (dashedblack line) showing a relative in-crease in weekly admissions forRTI when compared with a 2-week lag. I, II, III, and IV—outbreaks of admissions with RTIobserved in the period 2012–2015
Fig. 5 Periodic function g(t) ofUTCI values (y)
1238 Int J Biometeorol (2019) 63:1231–1241
This is important because it draws attention to the fact that therelationship between decreased air temperature and increasednumbers of RTI cases is not linear. It is very easy, then, tomake some simplifications, an example of which is the as-sumption of continuity of function in relation between atmo-spheric conditions and the number of diseases due to RTI. Ifthat was the amount, RTI would grow all the time with thedecrease of UTCI.
When analyzing the lagged impact of meteorological pa-rameter changes on the epidemiological effect, the analysis of
Pearson’s linear correlation coefficients between mean dailyvalues of UTCI and the number of daily consultations for RTI(Table 4) clearly demonstrates a 7-day lag (D + 7 and D + 14)in the increased number of admissions in relation to the oc-currence of the potential reason, i.e., a drop in the UTCI valueor class.
Despite a statistically significant relationship between adecrease in the UTCI value and an increase in the number ofadmissions for RTI calculated on the basis of a daily dataset,such an analysis, in our opinion, should not be employed fordetermining the temporal lag and the associated epidemiolog-ical forecasting. The relationship termed by us “the Mondayeffect” (Table 2) burdens such an analysis with a methodolog-ical error resulting from the work organization in thehealthcare system. A significantly higher number of admis-sions on Mondays (27.5%) are associated with the lack of ordifficult access to the healthcare system institutions on week-ends. We believe that studies based on data obtained fromprimary care centers should definitely account for theMonday effect (Tables 2 and 4). Thus, we recommend longerintervals to be used in such analyses. Even if in a given coun-try, primary care centers work within the 24/7 system, acces-sibility to healthcare institutions on weekends, and holidays isalways somewhat limited (duty system, higher fees for ser-vice, etc.) (Masseria et al. 2009). In a study based on datacollected in Athens (Greece), Nastos andMatzarakis observeda seasonal drop in GP consultations for RTI in December andstresses that this decrease may result from limited accessibilityto medical services during Christmas. However, they did not
Fig. 7 Correlation circle of partial least squares (PLS) regression (A),illustrating the correlations of infectious diseases (response variables Y)and meteorological parameters (explanatory variables X) with the firsttwo axes associated to the first two components. The percentages of thevariances in X and Y explained by each variable are indicated on therespective axes. The inner dashed circle denotes the correlation coeffi-cient r = 0.75. (B) Model quality is based on three quality indices
reported: Q2(cum), R2Y(cum), and R2X(cum). The Q2(cum) index repre-sents a global contribution of the components and identifies the moststable model when it approaches 1. (C) VIPs (variable importance forthe projection) for each explanatory variable. Explanatory variables thatcontribute most to the PLS model are characterized by VIPs > 1 and areindicated in red
Fig. 6 Linear regression between the weekly number of patients with RTIand corresponding mean UTCI values
Int J Biometeorol (2019) 63:1231–1241 1239
analyze accessibility to medical services on weekends (Nastosand Matzarakis 2006). Some authors circumvented this prob-lem by providing weekly analyses (Costilla-Esquivel et al.2014; Falagas et al. 2008; Sundell et al. 2016). Such a modeof analysis, despite retaining basic relationships (Fig. 6), pre-cludes the possibility of calculating the lag in the epidemio-logical effect in relation to the actual meteorological situation.
As a result of our research, we also recognized that thehuman thermal environment leading to RTI occurrences cannotbe represented with just a single parameter such as air temper-ature due to its various degrees of impacting on the humanorganism in different climatic zones. According to Jendritzky,for warm conditions, such indices consist usually of combina-tions of air temperature and one of a variety of indices forhumidity, while for cold conditions the combination consiststypically of air temperature related in some way with windspeed (Jendritzky et al. 2012). A number of papers have beenpublished that demonstrate relationships between, for instance,humidity and RTI occurrences (Costilla-Esquivel et al. 2014;Gardinassi et al. 2012; Ho et al. 2018; Khor et al. 2012;Makinen et al. 2009). The relationship between air temperatureand the number of consultations for RTI in moderate and coldclimates is usually the same (the lower the air temperature, thelarger the number of admissions for RTI) (Shiue et al. 2014;Donaldson et al. 2012). This correlation, however, may be dif-ferent in tropical climates or others. While not negating therelationships reported by other authors (in our study air temper-ature is also significant), we wish to draw attention to the factthat comparisons of results obtained in countries from differentclimatic zones may lead to erroneous conclusions.
In our opinion, by combining 4 basic meteorological pa-rameters, the UTCI is a definitely more reliable index to beused in analyses of weather-related infections than single ordoublemeteorological parameters (Zare et al. 2018). The anal-ysis of admissions for RTI in the moderate transitional climateof Central and Eastern Europe presented in our study demon-strated a strong impact of both air temperature and relativehumidity, and a very weak impact of atmospheric pressureand wind speed (Fig. 7A–C).
The results of our epidemiological study, based on a cause-effect related approach, showed that the UTCI is a promisingparameter which could be effectively used in precautionaryplanning and should be considered in developing appropriateoperational products for the public health system. The advan-tage of the UTCI is its standardized value which might besuccessfully applied in different climates.
Conclusions
The UTCI is a valuable predictive parameter for forecasting sea-sonal increases in RTI occurrences. A statistically significantincrease in the number of RTI cases appeared when UTCI values
decreased, especially when the UTCI reached strong and verystrong cold stress classes. This effect is strongest about 7–14 daysfollowing the change in the thermal climate conditions and is notcontinuous. The described “Monday effect” may blur typicalstatistical analyses, leading to erroneous conclusions.
Limitations
Although this study is based on a rather large dataset, the dataare collected only from one city and cover a relatively shortperiod of time, given this type of research. Data concerningthe number of daily consultations may be periodically smallerthan the demand for them. The healthcare system capacity islimited, and it can sometimes be even smaller during RTI epi-demics (employees’ sickness). This is another argument dem-onstrating that such analyses should be based on weekly data.
Compliance with ethical standards
Conflict of interest The authors declare that they have no conflict ofinterest.
Open Access This article is distributed under the terms of the CreativeCommons At t r ibut ion 4 .0 In te rna t ional License (h t tp : / /creativecommons.org/licenses/by/4.0/), which permits unrestricted use,distribution, and reproduction in any medium, provided you give appro-priate credit to the original author(s) and the source, provide a link to theCreative Commons license, and indicate if changes were made.
References
Blazejczyk K (1994) New climatological-and-physiological model of thehuman heat balance outdoor (MENEX) and its applications inbioclimatological studies in different scales. Zeszyty IgiPZ PAN28:27–58
Błażejczyk K (2011) Mapping of UTCI in local scale (the case ofWarsaw). Prace i Studia Geograficzne WGSR UW 47:275–283
Błażejczyk K, McGregor G (2008) Mortality in European cities and itsrelations to biothermal conditions. Klimat i bioklimat miast.Wydawnictwo Uniwersytetu łódzkiego, pp 13–324
BlazejczykK, Epstein Y, JendritzkyG, Staiger H, Tinz B (2012) Comparisonof UTCI to selected thermal indices. Int J Biometeorol 56(3):515–535.https://doi.org/10.1007/s00484-011-0453-2
Bröde P (2000) UTCI universal thermal climate index. Leibniz ResearchCentre for Working Environment and Human Factors. http://www.utci.org/index.php. Accessed 25 Apr 2019
Brode P, Fiala D, Blazejczyk K, Holmer I, Jendritzky G, Kampmann B,Tinz B, Havenith G (2012) Deriving the operational procedure forthe universal thermal climate index (UTCI). Int J Biometeorol 56(3):481–494. https://doi.org/10.1007/s00484-011-0454-1
Buckingham-Jeffery E, Morbey R, House T, Elliot AJ, Harcourt S, SmithGE (2017) Correcting for day of the week and public holiday effects:improving a national daily syndromic surveillance service for de-tecting public health threats. BMC Public Health 17(1):477
Costilla-Esquivel A, Corona-Villavicencio F, Velasco-Castañón J,Medina-De La Garza C, Martinez-Villarreal R, Cortes-HernándezD, Ramirez-Lopez L, Gonzalez-Farias G (2014) A relationship
1240 Int J Biometeorol (2019) 63:1231–1241

between acute respiratory illnesses and weather. Epidemiol Infect142(7):1375–1383
Court A (1948) Wind chill. Bull Am Meteorol Soc 29:487–493Danielides V, Nousia CS, Patrikakos G, Bartzokas A, Lolis CJ, Milionis
HJ, Skevas A (2002) Effect of meteorological parameters on acutelaryngitis in adults. Acta Otolaryngol 122(6):655–660
Donaldson GC, Goldring JJ, Wedzicha JA (2012) Influence of season onexacerbation characteristics in patients with COPD. Chest 141(1):94–100
du Prel J-B, Puppe W, Gröndahl B, Knuf M, Weigl F, Schaaff F, Schaaff F,Schmitt H-J (2009) Are meteorological parameters associated withacute respiratory tract infections? Clin Infect Dis 49(6):861–868
Epstein Y, Moran DS (2006) Thermal comfort and the heat stress indices.Ind Health 44(3):388–398
Falagas ME, Theocharis G, Spanos A, Vlara LA, Issaris EA, Panos G,Peppas G (2008) Effect of meteorological variables on the incidenceof respiratory tract infections. Respir Med 102(5):733–737. https://doi.org/10.1016/j.rmed.2007.12.010
Fiala D, Lomas KJ, Stohrer M (1999) A computer model of humanthermoregulation for a wide range of environmental conditions:the passive system. J Appl Physiol (1985) 87(5):1957–1972.https://doi.org/10.1152/jappl.1999.87.5.1957
Fiala D, Lomas KJ, Stohrer M (2001) Computer prediction of humanthermoregulatory and temperature responses to a wide range of en-vironmental conditions. Int J Biometeorol 45(3):143–159
Fiala D, Havenith G, Brode P, Kampmann B, Jendritzky G (2012) UTCI-Fiala multi-node model of human heat transfer and temperatureregulation. Int J Biometeorol 56(3):429–441. https://doi.org/10.1007/s00484-011-0424-7
Fielder CP (1989) Effect of weather conditions on acute laryngotracheitis.J Laryngol Otol 103(2):187–190
Fleming D, Smith G, Charlton J, Charlton J, Nicoll A (2002) Impact ofinfections on primary care–greater than expected. Commun DisPublic Health 5(1):7–12
Gardinassi LG, Marques Simas PV, Salomao JB, Durigon EL, ZanettaTrevisan DM, Cordeiro JA, Lacerda MN, Rahal P, de Souz FP (2012)Seasonality of viral respiratory infections in southeast of Brazil: theinfluence of temperature and air humidity. Braz J Microbiol 43(1):98–108. https://doi.org/10.1590/S1517-838220120001000011
Hajat S, Bird W, Haines A (2004) Cold weather and GP consultations forrespiratory conditions by elderly people in 16 locations in the UK.Eur J Epidemiol 19(10):959–968
Henningsson M, Sundbom E, Armelius BA, Erdberg P (2001) PLS mod-el building: a multivariate approach to personality test data. Scand JPsychol 42(5):399–409
Ho NT, Thompson C, Nhan LNT, Van HMT, Dung NT, Tran My P,Quang VM, Minh NNQ, Tuan TA, Hung NT, Tuan HM, VinhChau NV, Wolbers M, Thwaites GE, Choisy M, Baker S (2018)Retrospective analysis assessing the spatial and temporal distribu-tion of paediatric acute respiratory tract infections in Ho Chi MinhCity, Vietnam. BMJ Open 8(1):e016349. https://doi.org/10.1136/bmjopen-2017-016349
Jendritzky G, Havenith G, Weihs P, Batchvarova E (2009) Towards auniversal thermal climate index UTCI for assessing the thermal en-vironment of the human being. Final Report COSTAction 730:1–26
JendritzkyG, deDear R, HavenithG (2012)UTCI—why another thermalindex? Int J Biometeorol 56(3):421–428
Khor CS, Sam IC, Hooi PS, Quek KF, Chan YF (2012) Epidemiologyand seasonality of respiratory viral infections in hospitalized chil-dren in Kuala Lumpur, Malaysia: a retrospective study of 27 years.BMC Pediatr 12:32. https://doi.org/10.1186/1471-2431-12-32
Laschewski G, Jendritzky G (2002) Effects of the thermal environmenton human health: an investigation of 30 years of daily mortality datafrom SW Germany. Clim Res 21(1):91–103
Li P, Chan S (2000) Application of a weather stress index for alerting thepublic to stressful weather in HongKong.Meteorol Appl 7(4):369–375
Li S, Eisenberg JN, Spicknall IH, Koopman JS (2009) Dynamics andcontrol of infections transmitted from person to person through theenvironment. Am J Epidemiol 170(2):257–265
Liu Y, Liu J, Chen F, Shamsi BH, Wang Q, Jiao F, Qiao Y, Shi Y (2016)Impact of meteorological factors on lower respiratory tract infec-tions in children. J Int Med Res 44(1):30–41. https://doi.org/10.1177/0300060515586007
Lowe R, Gasparrini A, VanMeerbeeck CJ, Lippi CA,Mahon R, TrotmanAR, Rollock L, Hinds AQJ, Ryan SJ, Stewart-Ibarra AM (2018)Nonlinear and delayed impacts of climate on dengue risk inBarbados: a modelling study. PLoS Med 15(7):e1002613. https://doi.org/10.1371/journal.pmed.1002613
Makinen TM, Juvonen R, Jokelainen J, Harju TH, Peitso A, Bloigu A,Silvennoinen-Kassinen S, LeinonenM, Hassi J (2009) Cold temper-ature and low humidity are associated with increased occurrence ofrespiratory tract infections. Respir Med 103(3):456–462. https://doi.org/10.1016/j.rmed.2008.09.011
Masseria C, Irwin R, Thomson S, Gemmill M, Mossialos E (2009)Primary Care in Europe: policy brief. London: LSE
Masterton J, Fa R (1979) Amethod of quantifying human discomfort dueto excessive heat and humidity. cli 1–79: aes, environment Canada.Downsview, Ontario
Matzarakis A, Mayer H (1996) Another kind of environmental stress:thermal stress. WHO Newslett 18(1996):7–10
McGregor GR (2012) Special issue: universal thermal comfort index(UTCI). Int J Biometeorol 56(3):419–419
Nastos PT, Matzarakis A (2006) Weather impacts on respiratory infec-tions in Athens, Greece. Int J Biometeorol 50(6):358–369. https://doi.org/10.1007/s00484-006-0031-1
NICE CfCPa (2008) Respiratory tract infections-antibiotic prescribing:prescribing of antibiotics for self-limiting respiratory tract infectionsin adults and children in primary care
Osczevski R, Bluestein M (2005) The new wind chill equivalent temper-ature chart. Bull Am Meteorol Soc 86(10):1453–1458
Pantavou K, Lykoudis S, Nikolopoulou M, Tsiros IX (2018) Thermalsensation and climate: a comparison of UTCI and PET thresholdsin different climates. Int J Biometeorol 62(9):1695–1708
Peel MC, Finlayson BL, McMahon TA (2007) Updated world map of theKöppen-Geiger climate classification. Hydrol Earth Syst SciDiscuss 4(2):439–473
Shiue I, Muthers S, Bearman N (2014) The role of cold stress inpredicting extra cardiovascular and respiratory admissions. Int JCardiol 172(1):e109–e110
Stilianakis NI, Drossinos Y (2010) Dynamics of infectious disease trans-mission by inhalable respiratory droplets. J R Soc Interface 7(50):1355–1366. https://doi.org/10.1098/rsif.2010.0026
Sundell N, Andersson L-M, Brittain-Long R, LindhM,Westin J (2016) Afour year seasonal survey of the relationship between outdoor cli-mate and epidemiology of viral respiratory tract infections in a tem-perate climate. J Clin Virol 84:59–63
The MathWorks I. https://www.mathworks.com/help/curvefit/fit.html.Accessed 06 DEC 2018
WHO (1992) The ICD-10 classification of mental and behavioural disor-ders: clinical descriptions and diagnostic guidelines. World HealthOrganization, Geneva
Whynes DK, Falk-Whynes J, Pringle M (1999) Trends in acute admis-sions: a study of one English district general hospital. J PublicHealth 21(4):459–463
Zare S, Hasheminejad N, Shirvan HE, Hemmatjo R, SarebanzadehK, Ahmadi S (2018) Comparing universal thermal climate in-dex (UTCI) with selected thermal indices/environmental pa-rameters during 12 months of the year. Weather ClimateExtremes 19:49–57
Int J Biometeorol (2019) 63:1231–1241 1241


![ABC-BOOKLET OF KAJAANI · ABC-BOOKLET OF KAJAANI 2014 GROUP PROJECT 1: HANNU, NIKO, ELISA, SARIANNA, OLGA, KSENIIA JA IIA [YRITYKSEN NIMI] |[Yrityksen osoite] A: Ammattikorkeakoulu:](https://img.pdfslide.us/doc/110x75/6009f11fadfb2c2f00521d24/abc-booklet-of-kajaani-abc-booklet-of-kajaani-2014-group-project-1-hannu-niko.jpg)