Embed Size (px)
Citation preview
Smart Modular Technologies
Santa Clara, CA USA
August 2010
Apples to Apples, Pears to Pears in
SSS Performance Benchmarking
Esther Spanjer
Director, SSD Marketing
Smart Modular TechnologiesSmart Modular Technologies
Santa Clara, CA USA
August 2010 2
Santa Clara, CA USA
August 2010
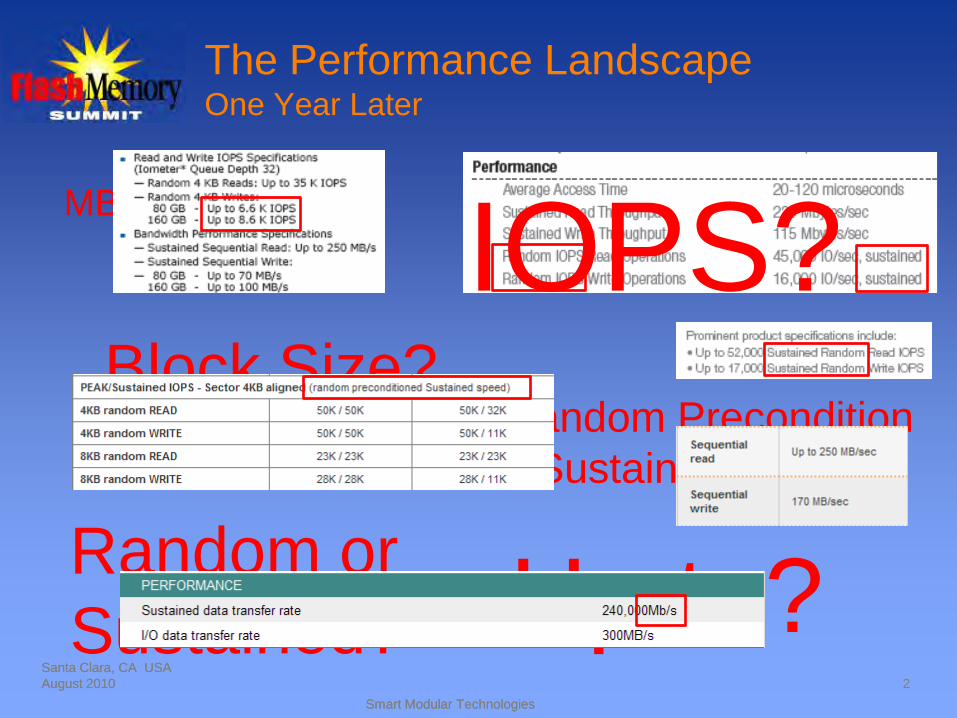
The Performance LandscapeOne Year Later
IOPS?Random Precondition
Sustained Speed?
Up to?
MB/s or Mb/s?
Random or
Sustained?
Block Size?
Smart Modular TechnologiesSmart Modular Technologies
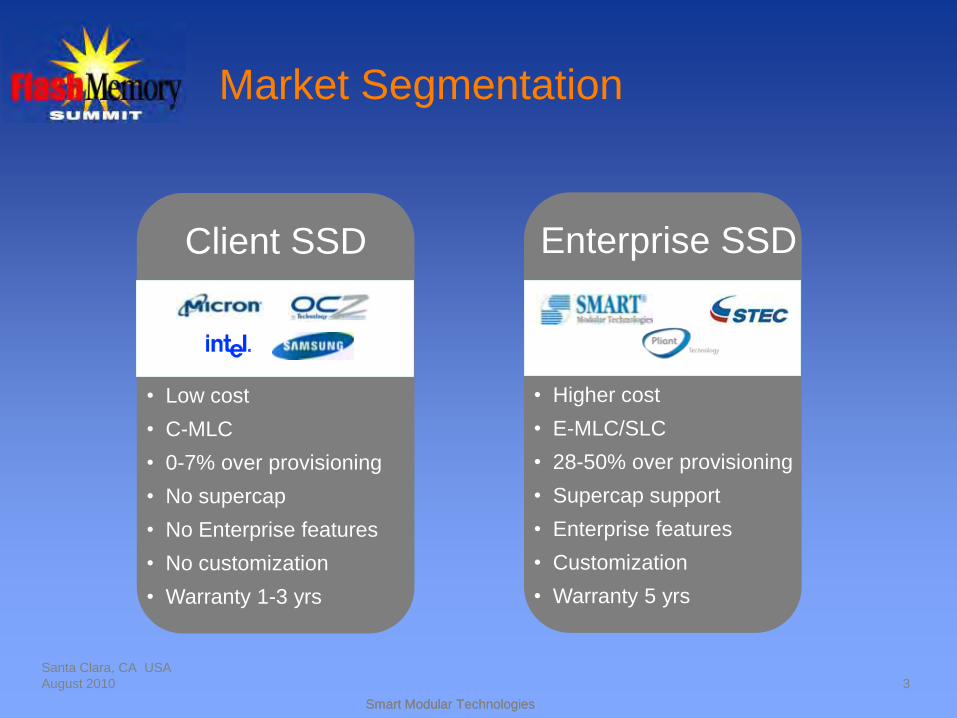
Market Segmentation
Santa Clara, CA USA
August 2010 3
Client SSD
• Low cost
• C-MLC
• 0-7% over provisioning
• No supercap
• No Enterprise features
• No customization
• Warranty 1-3 yrs
Enterprise SSD
• Higher cost
• E-MLC/SLC
• 28-50% over provisioning
• Supercap support
• Enterprise features
• Customization
• Warranty 5 yrs
Smart Modular TechnologiesSmart Modular Technologies
Santa Clara, CA USA
August 2010
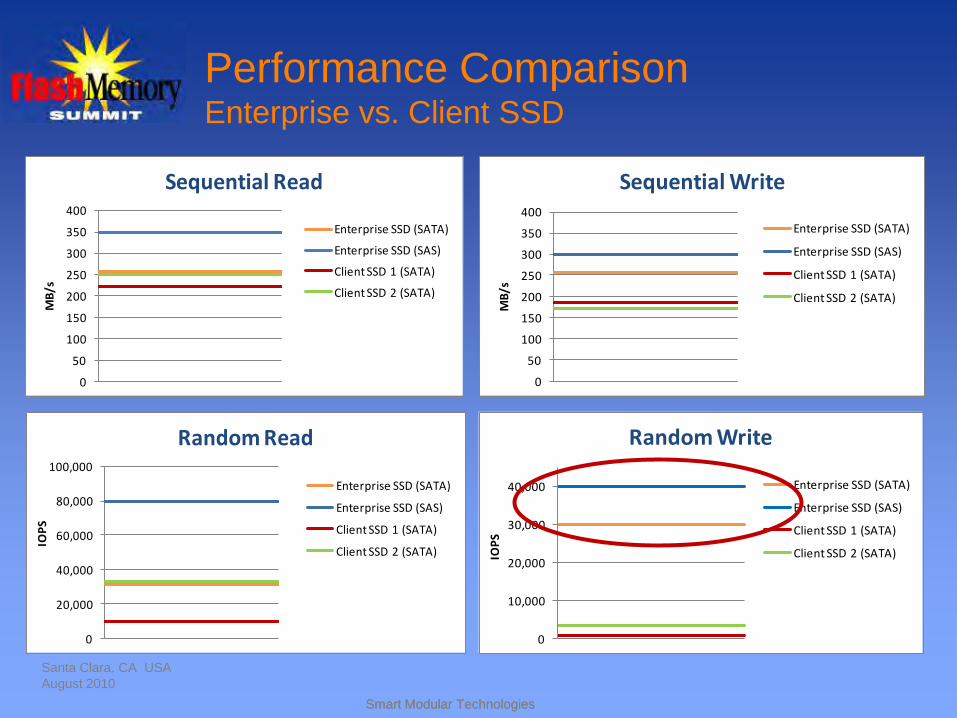
Performance ComparisonEnterprise vs. Client SSD
0
50
100
150
200
250
300
350
400
MB
/s
Sequential Read
Enterprise SSD (SATA)
Enterprise SSD (SAS)
Client SSD 1 (SATA)
Client SSD 2 (SATA)
0
50
100
150
200
250
300
350
400
MB
/s
Sequential Write
Enterprise SSD (SATA)
Enterprise SSD (SAS)
Client SSD 1 (SATA)
Client SSD 2 (SATA)
0
10,000
20,000
30,000
40,000IO
PS
Random Write
Enterprise SSD (SATA)
Enterprise SSD (SAS)
Client SSD 1 (SATA)
Client SSD 2 (SATA)
0
20,000
40,000
60,000
80,000
100,000
IOP
S
Random Read
Enterprise SSD (SATA)
Enterprise SSD (SAS)
Client SSD 1 (SATA)
Client SSD 2 (SATA)
Smart Modular TechnologiesSmart Modular Technologies
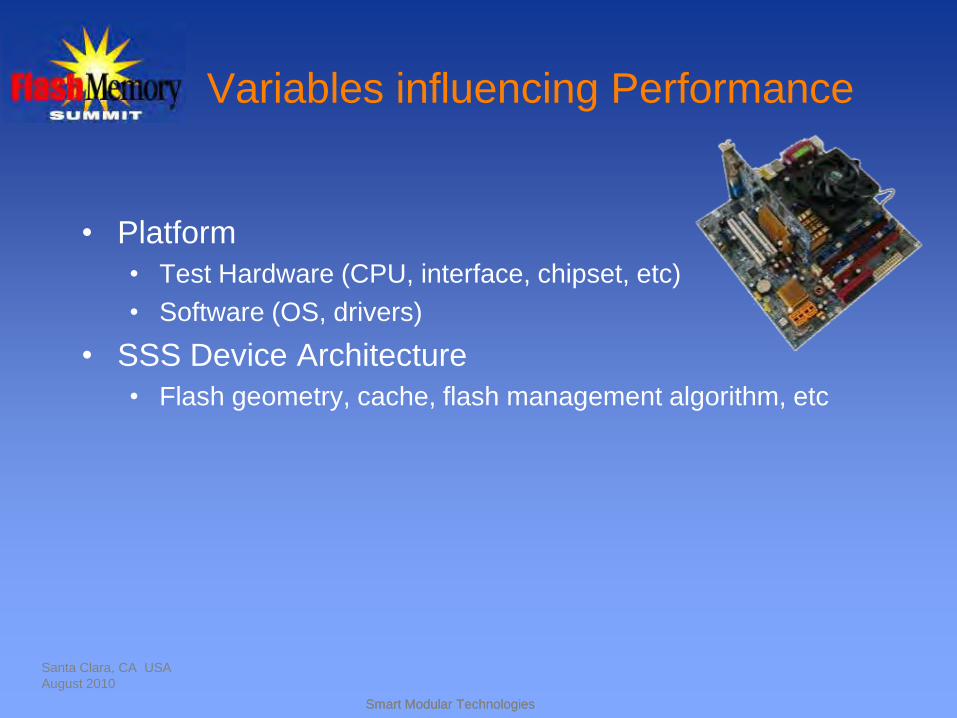
Variables influencing Performance
• Platform
• Test Hardware (CPU, interface, chipset, etc)
• Software (OS, drivers)
• SSS Device Architecture
• Flash geometry, cache, flash management algorithm, etc
Santa Clara, CA USA
August 2010
Smart Modular TechnologiesSmart Modular Technologies
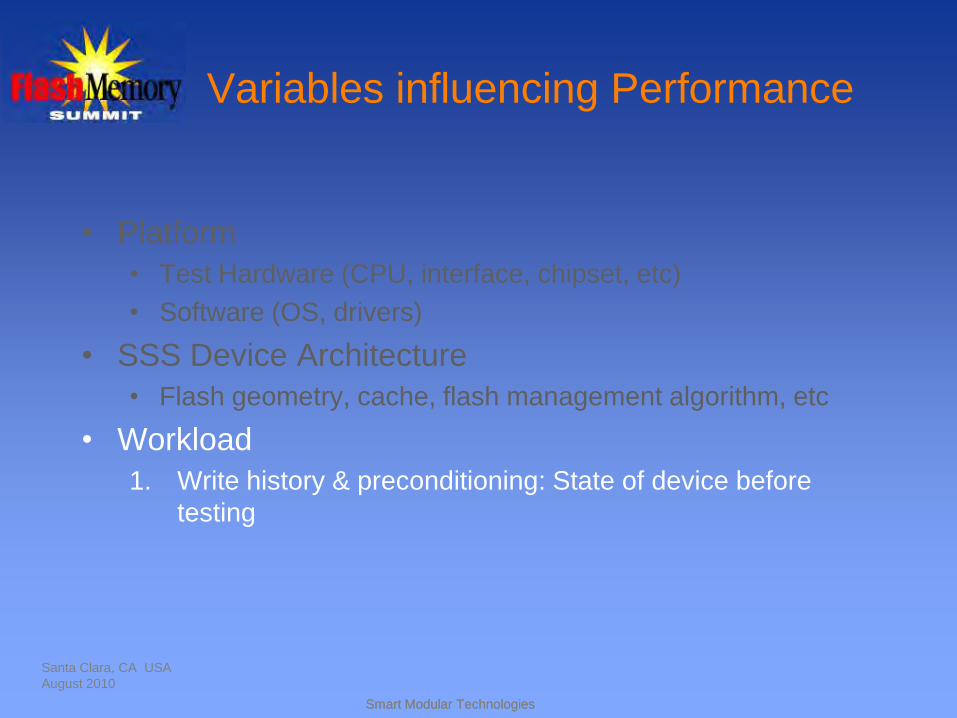
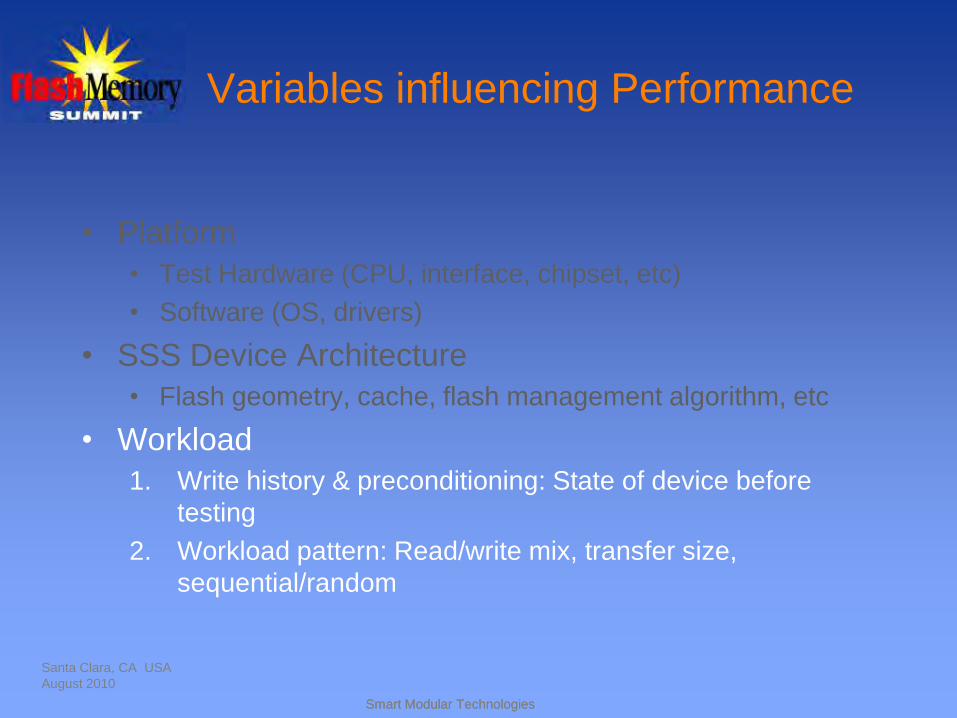
Variables influencing Performance
• Platform
• Test Hardware (CPU, interface, chipset, etc)
• Software (OS, drivers)
• SSS Device Architecture
• Flash geometry, cache, flash management algorithm, etc
• Workload
1. Write history & preconditioning: State of device before
testing
Santa Clara, CA USA
August 2010
Smart Modular TechnologiesSmart Modular Technologies
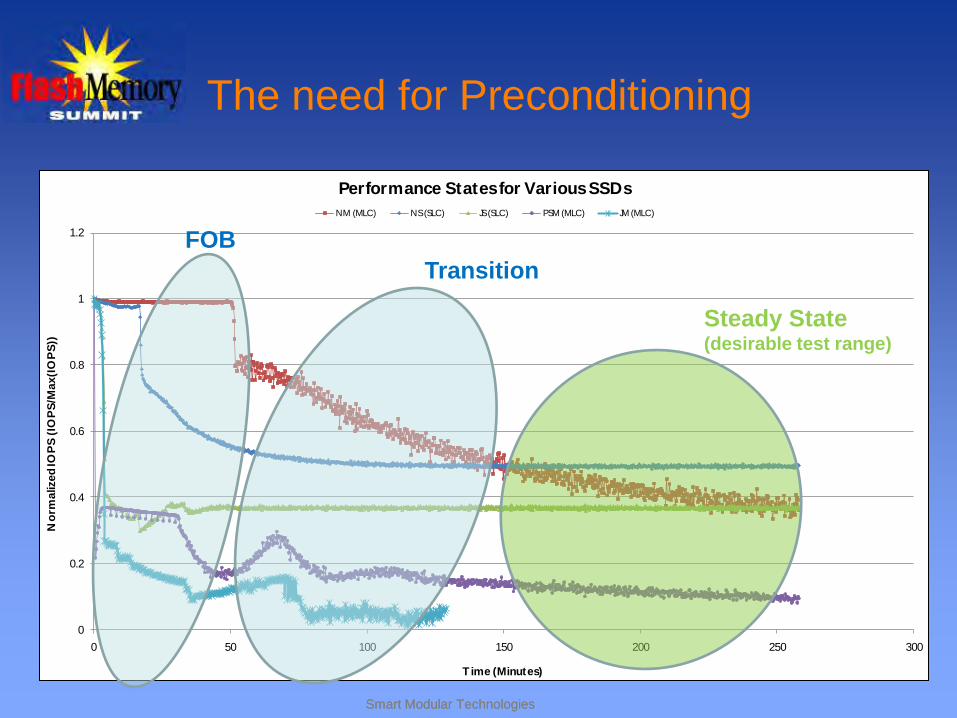
The need for Preconditioning
Santa Clara, CA USA
August 2009 7
0
0.2
0.4
0.6
0.8
1
1.2
0 50 100 150 200 250 300
No
rma
lize
d IO
PS
(IO
PS
/Ma
x(I
OP
S))
T ime (Minutes)
Performance States for Various SSDs
NM (MLC) NS (SLC) JS (SLC) PSM (MLC) JM (MLC)
FOB
Transition
Steady State (desirable test range)
Smart Modular TechnologiesSmart Modular Technologies
0
5000
10000
15000
20000
25000
30000
35000
40000
45000
20
60
100
140
180
220
260
300
340
380
420
460
500
540
580
620
660
700
740
780
820
860
900
940
980
1020
1060
1100
1140
1180
1220
1280
1320
1360
1400
1440
1480
1520
1560
1600
1640
1680
IOPS
Time (Minutes)
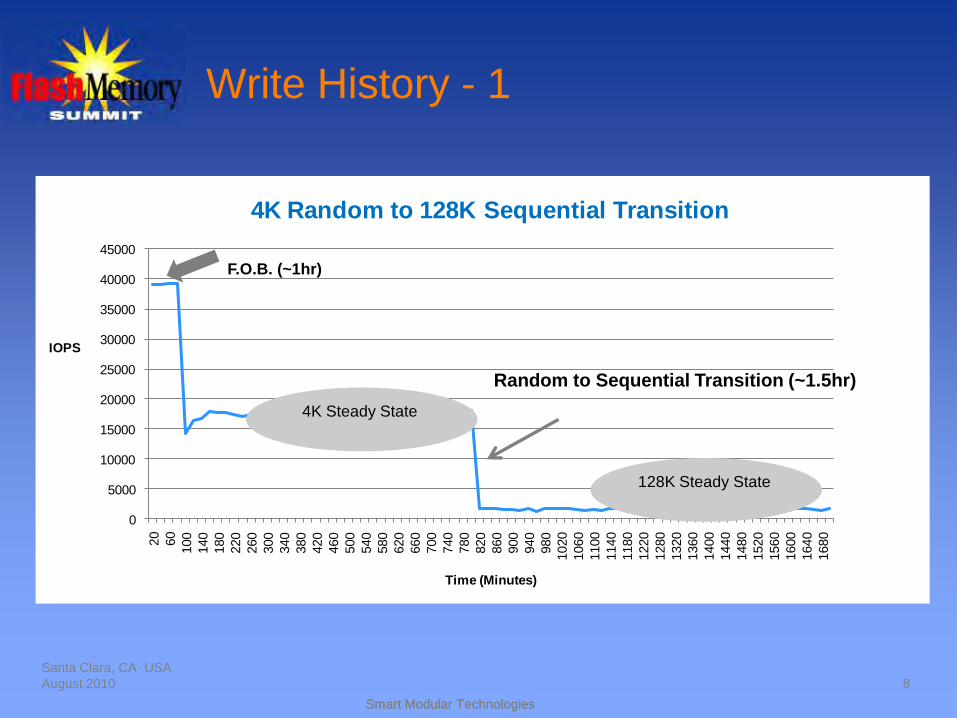
4K Random to 128K Sequential Transition
Write History - 1
Santa Clara, CA USA
August 2010 8
4K Steady State
F.O.B. (~1hr)
Random to Sequential Transition (~1.5hr)
128K Steady State
Smart Modular TechnologiesSmart Modular Technologies
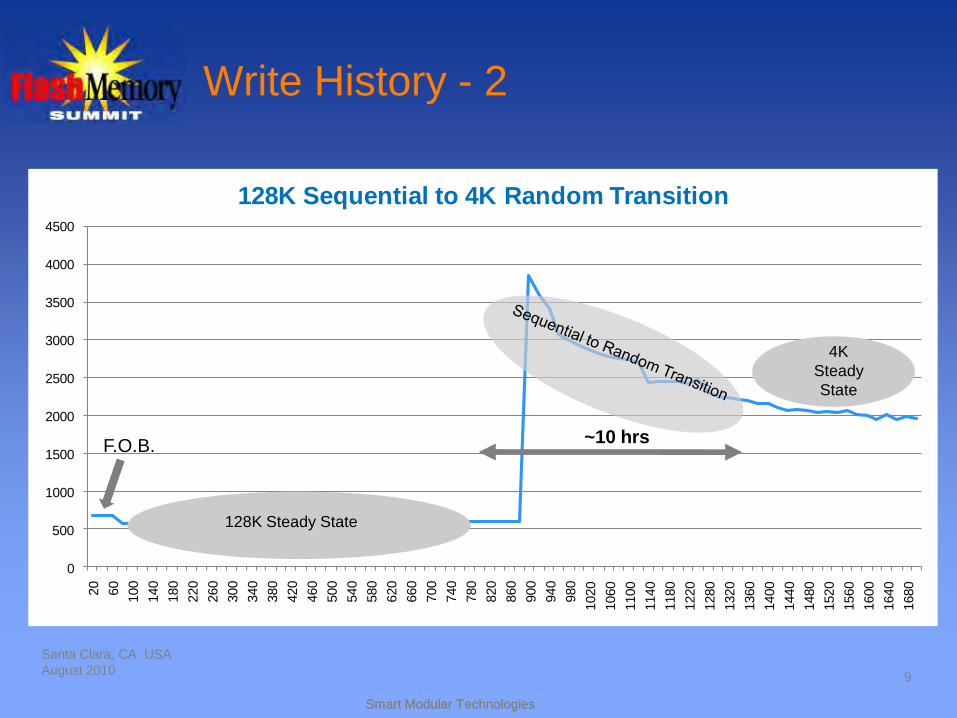
Write History - 2
Santa Clara, CA USA
August 20109
0
500
1000
1500
2000
2500
3000
3500
4000
4500
20
60
100
140
180
220
260
300
340
380
420
460
500
540
580
620
660
700
740
780
820
860
900
940
980
1020
1060
1100
1140
1180
1220
1280
1320
1360
1400
1440
1480
1520
1560
1600
1640
1680
128K Sequential to 4K Random Transition
4K
Steady
State
128K Steady State
F.O.B.~10 hrs
Smart Modular TechnologiesSmart Modular Technologies
Variables influencing Performance
• Platform
• Test Hardware (CPU, interface, chipset, etc)
• Software (OS, drivers)
• SSS Device Architecture
• Flash geometry, cache, flash management algorithm, etc
• Workload
1. Write history & preconditioning: State of device before
testing
2. Workload pattern: Read/write mix, transfer size,
sequential/random
Santa Clara, CA USA
August 2010
Smart Modular TechnologiesSmart Modular Technologies
Santa Clara, CA USA
August 2010
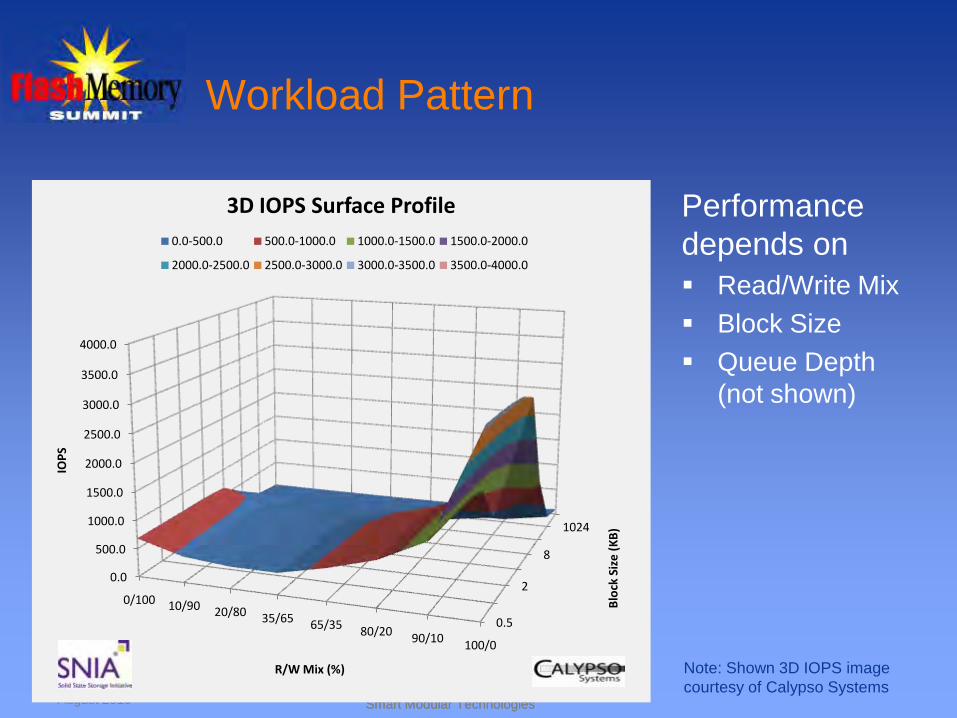
Workload Pattern
Santa Clara, CA USA
August 2009
0.5
2
8
1024
0.0
500.0
1000.0
1500.0
2000.0
2500.0
3000.0
3500.0
4000.0
0/100 10/90 20/80 35/65 65/3580/20
90/10100/0
Blo
ck S
ize
(K
B)
IOP
S
R/W Mix (%)
3D IOPS Surface Profile
0.0-500.0 500.0-1000.0 1000.0-1500.0 1500.0-2000.0
2000.0-2500.0 2500.0-3000.0 3000.0-3500.0 3500.0-4000.0
Performance
depends on
Read/Write Mix
Block Size
Queue Depth
(not shown)
Note: Shown 3D IOPS image
courtesy of Calypso Systems
Smart Modular TechnologiesSmart Modular Technologies
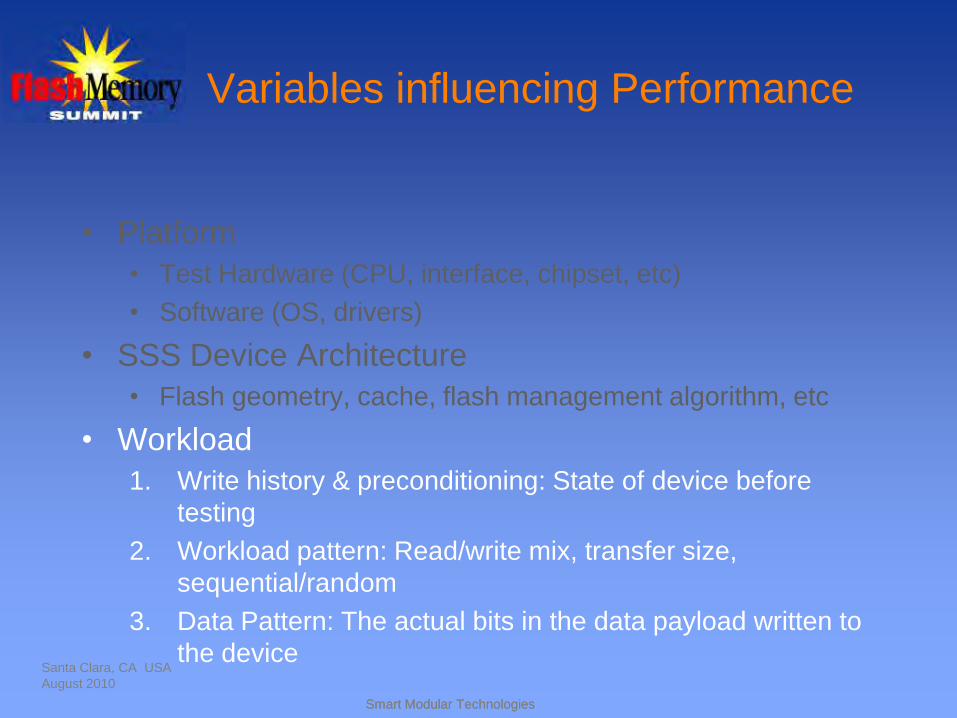
Variables influencing Performance
• Platform
• Test Hardware (CPU, interface, chipset, etc)
• Software (OS, drivers)
• SSS Device Architecture
• Flash geometry, cache, flash management algorithm, etc
• Workload
1. Write history & preconditioning: State of device before
testing
2. Workload pattern: Read/write mix, transfer size,
sequential/random
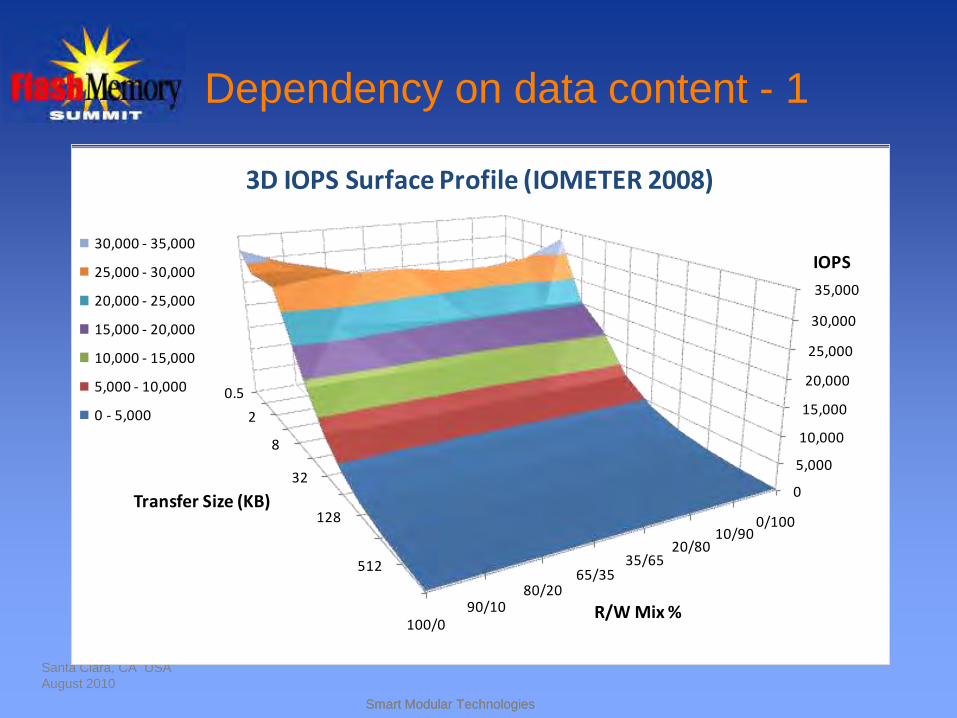
3. Data Pattern: The actual bits in the data payload written to
the deviceSanta Clara, CA USA
August 2010
Smart Modular TechnologiesSmart Modular Technologies
Santa Clara, CA USA
August 2010
Dependency on data content - 1
0.5
2
8
32
128
512
0
5,000
10,000
15,000
20,000
25,000
30,000
35,000
0/10010/90
20/8035/65
65/3580/20
90/10100/0
Transfer Size (KB)
IOPS
R/W Mix %
3D IOPS Surface Profile (IOMETER 2008)
30,000 - 35,000
25,000 - 30,000
20,000 - 25,000
15,000 - 20,000
10,000 - 15,000
5,000 - 10,000
0 - 5,000
Smart Modular TechnologiesSmart Modular Technologies
0.5
2
8
32
128
512
0
5,000
10,000
15,000
20,000
25,000
30,000
35,000
0/10010/90
20/8035/65
65/3580/20
90/10100/0
Transfer Size (KB)
IOPS
R/W Mix %
3D IOPS Surface Profile (IOMETER 2008)
30,000 - 35,000
25,000 - 30,000
20,000 - 25,000
15,000 - 20,000
10,000 - 15,000
5,000 - 10,000
0 - 5,000
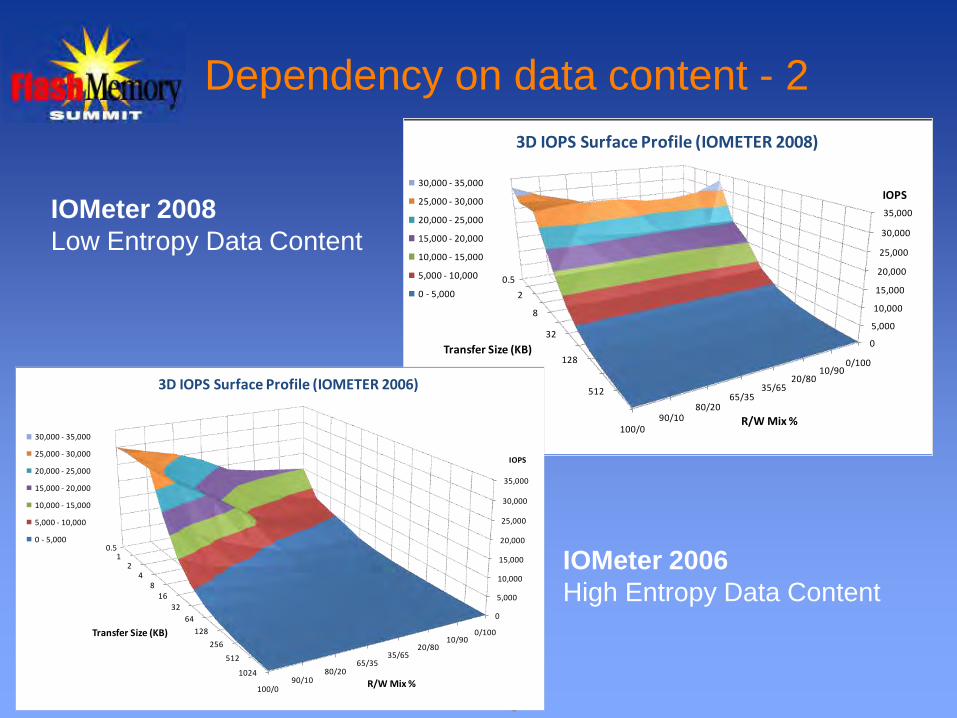
Dependency on data content - 2
14
0.51
24
816
32
64
128
256
512
1024
0
5,000
10,000
15,000
20,000
25,000
30,000
35,000
0/10010/90
20/8035/65
65/3580/20
90/10100/0
Transfer Size (KB)
IOPS
R/W Mix %
3D IOPS Surface Profile (IOMETER 2006)
30,000 - 35,000
25,000 - 30,000
20,000 - 25,000
15,000 - 20,000
10,000 - 15,000
5,000 - 10,000
0 - 5,000
IOMeter 2006
High Entropy Data Content
IOMeter 2008
Low Entropy Data Content
Smart Modular TechnologiesSmart Modular Technologies
Santa Clara, CA USA
August 2010
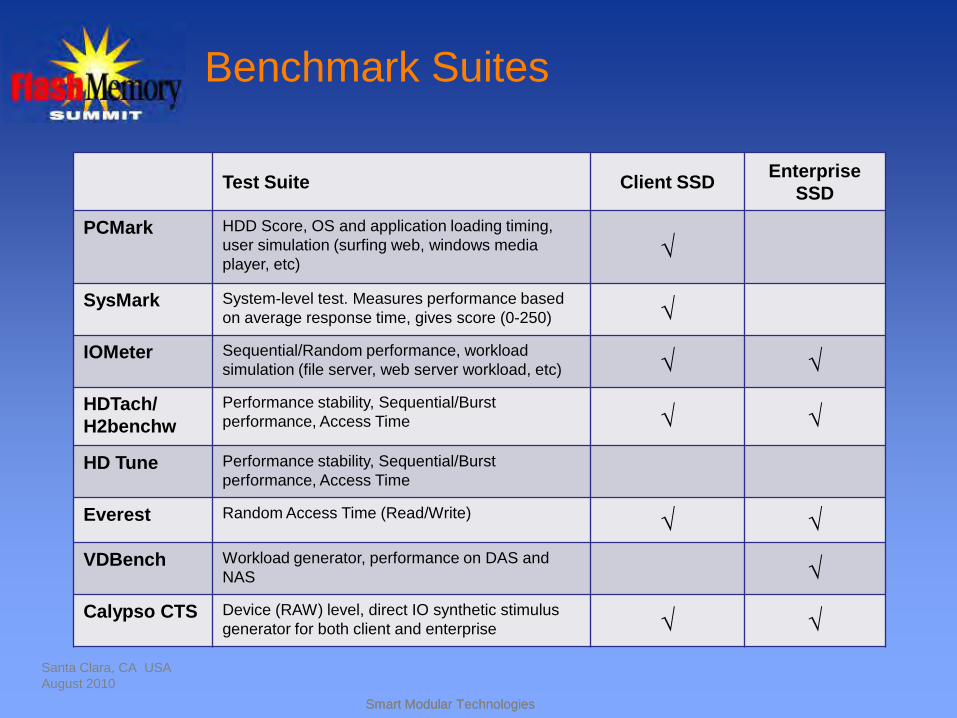
Test Suite Client SSDEnterprise
SSD
PCMark HDD Score, OS and application loading timing,
user simulation (surfing web, windows media
player, etc)√
SysMark System-level test. Measures performance based
on average response time, gives score (0-250) √
IOMeter Sequential/Random performance, workload
simulation (file server, web server workload, etc) √ √
HDTach/
H2benchw
Performance stability, Sequential/Burst
performance, Access Time √ √
HD Tune Performance stability, Sequential/Burst
performance, Access Time
Everest Random Access Time (Read/Write) √ √
VDBench Workload generator, performance on DAS and
NAS √
Calypso CTS Device (RAW) level, direct IO synthetic stimulus
generator for both client and enterprise √ √
Benchmark Suites

Smart Modular TechnologiesSmart Modular Technologies
The Need for Industry Standardization!
• SNIA Technical Working Group (TWG)
• Created in early 2009
• Specification for tests procedures to enable
comparative testing of SSS performance
• Agnostic – Does not favor any one technology
• Relevant & Repeatable – Meaningful to end
users
• Practical – Complete with reasonable time and
effort
• Spec 0.9 open for review now
• Spec 1.0 focus on Enterprise vs Client SSS testingSanta Clara, CA USA
August 2010
Smart Modular TechnologiesSmart Modular Technologies
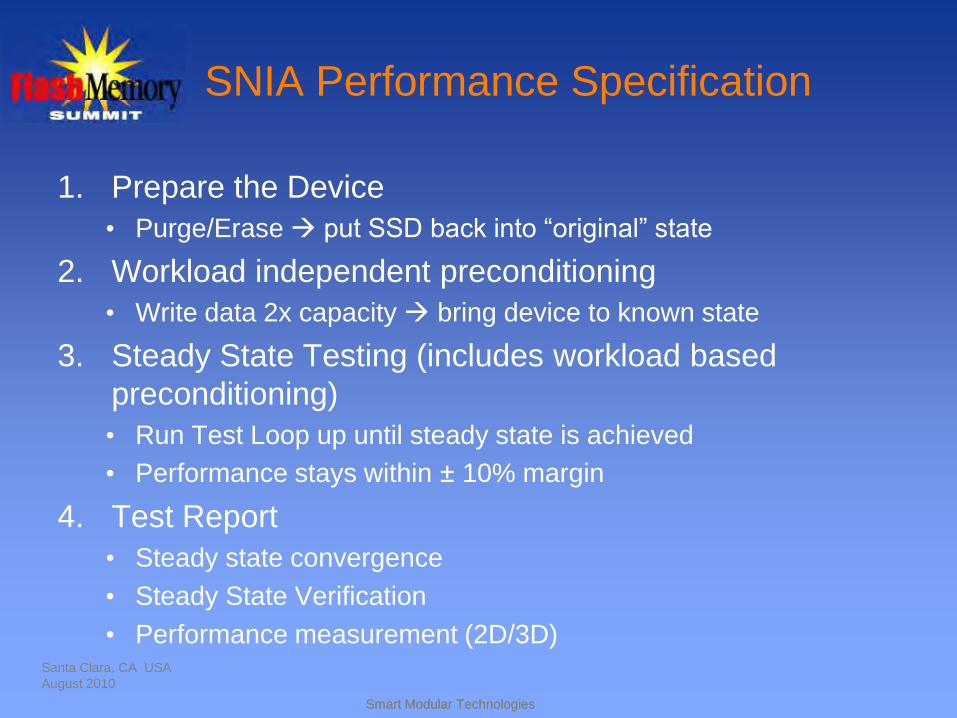
SNIA Performance Specification
1. Prepare the Device
• Purge/Erase put SSD back into “original” state
2. Workload independent preconditioning
• Write data 2x capacity bring device to known state
3. Steady State Testing (includes workload based
preconditioning)
• Run Test Loop up until steady state is achieved
• Performance stays within ± 10% margin
4. Test Report
• Steady state convergence
• Steady State Verification
• Performance measurement (2D/3D)Santa Clara, CA USA
August 2010
Smart Modular TechnologiesSmart Modular Technologies
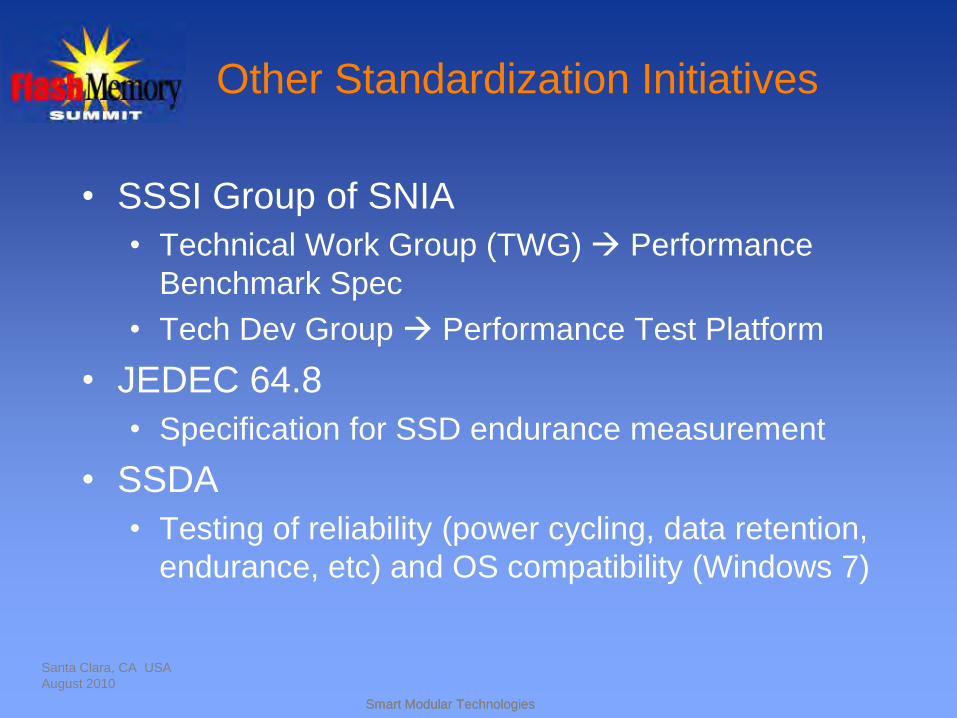
• SSSI Group of SNIA
• Technical Work Group (TWG) Performance
Benchmark Spec
• Tech Dev Group Performance Test Platform
• JEDEC 64.8
• Specification for SSD endurance measurement
• SSDA
• Testing of reliability (power cycling, data retention,
endurance, etc) and OS compatibility (Windows 7)
Other Standardization Initiatives
Santa Clara, CA USA
August 2010
Smart Modular TechnologiesSmart Modular Technologies
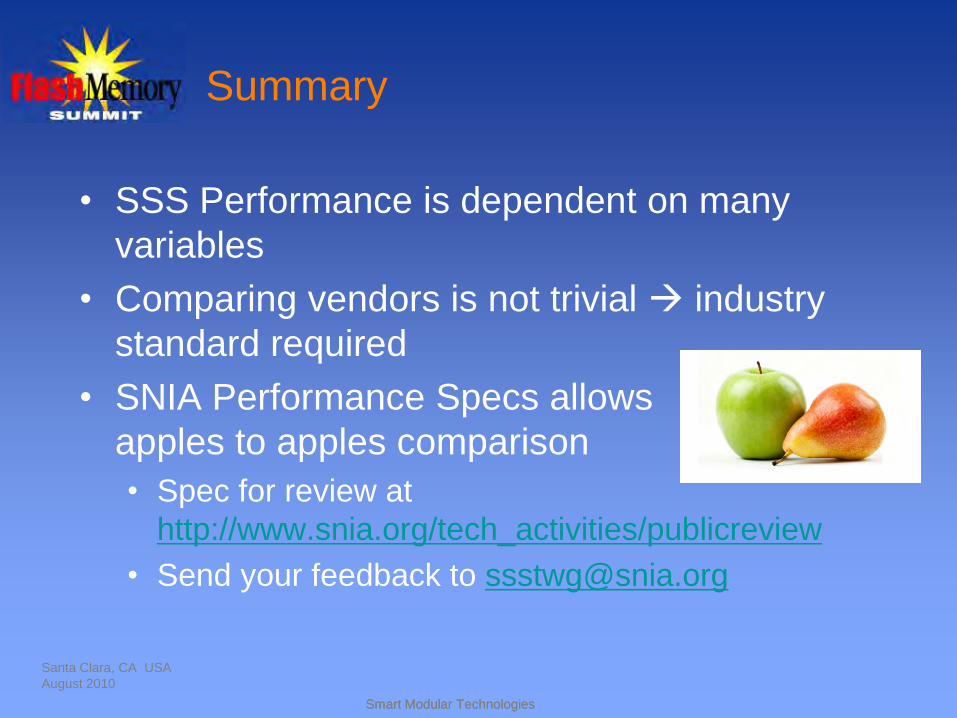
Summary
• SSS Performance is dependent on many
variables
• Comparing vendors is not trivial industry
standard required
• SNIA Performance Specs allows
apples to apples comparison
• Spec for review at
http://www.snia.org/tech_activities/publicreview
• Send your feedback to [email protected]
Santa Clara, CA USA
August 2010
Smart Modular TechnologiesSmart Modular Technologies
Santa Clara, CA USA
August 2009 20
Thank you!