Embed Size (px)
Citation preview
Apple outlook 2011 Philippe Binard
World Apple and Pear Association ( WAPA )
Freshfel Europe
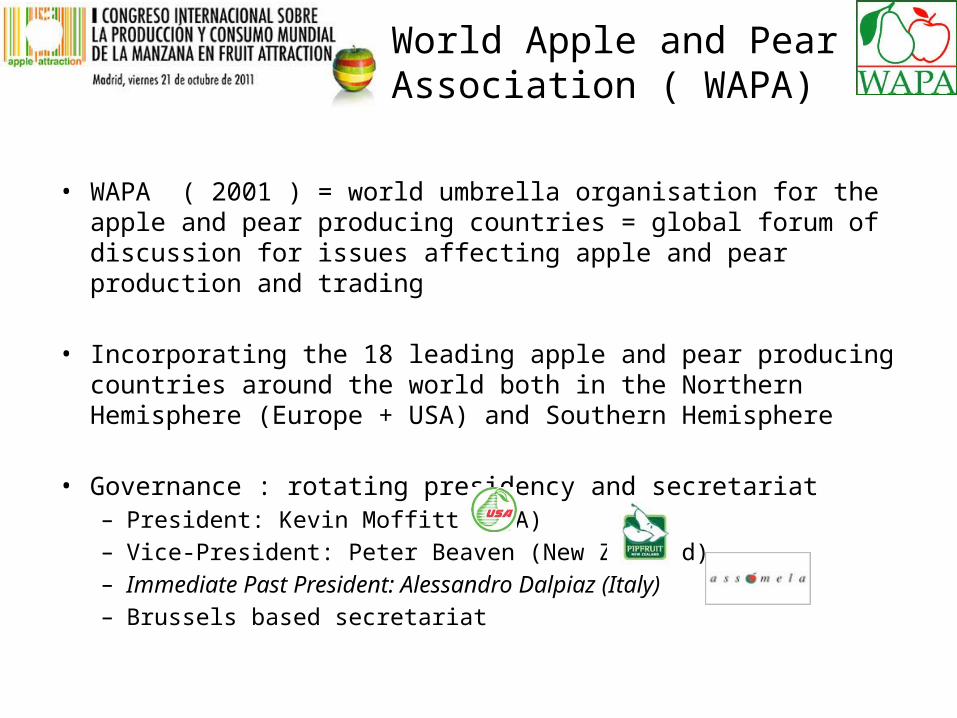
World Apple and Pear Association ( WAPA)
• WAPA ( 2001 ) = world umbrella organisation for the apple and pear producing countries = global forum of discussion for issues affecting apple and pear production and trading
• Incorporating the 18 leading apple and pear producing countries around the world both in the Northern Hemisphere (Europe + USA) and Southern Hemisphere
• Governance : rotating presidency and secretariat – President: Kevin Moffitt (USA)– Vice-President: Peter Beaven (New Zealand)– Immediate Past President: Alessandro Dalpiaz (Italy)– Brussels based secretariat
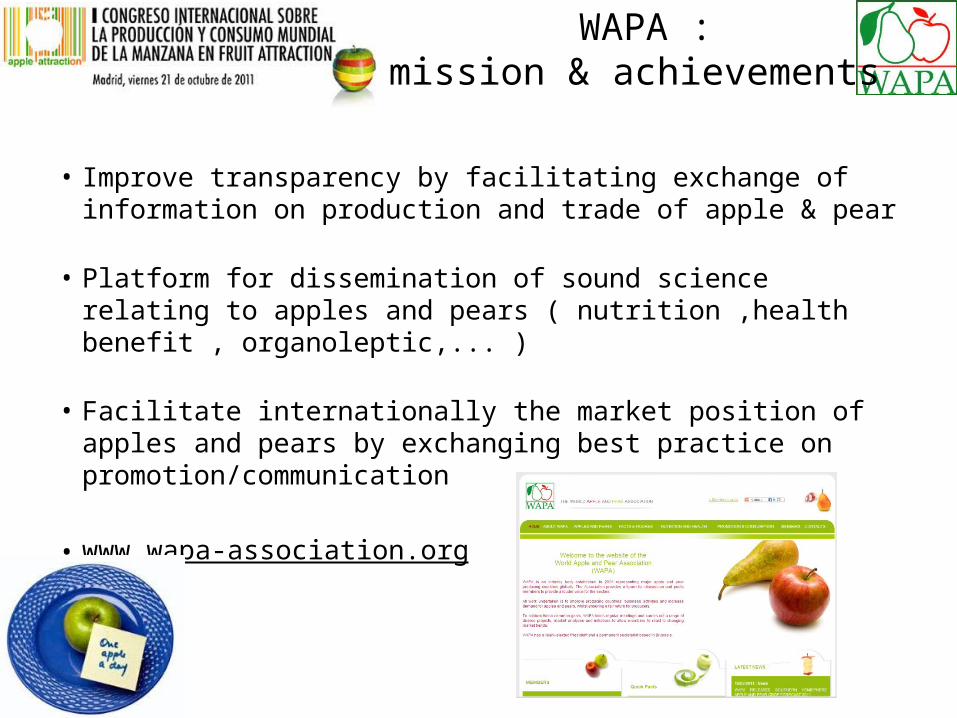
WAPA :mission & achievements
• Improve transparency by facilitating exchange of information on production and trade of apple & pear
• Platform for dissemination of sound science relating to apples and pears ( nutrition ,health benefit , organoleptic,... )
• Facilitate internationally the market position of apples and pears by exchanging best practice on promotion/communication
• www.wapa-association.org
APPLE MARKET REVIEW 2010/2011
Market Review 2010/2011
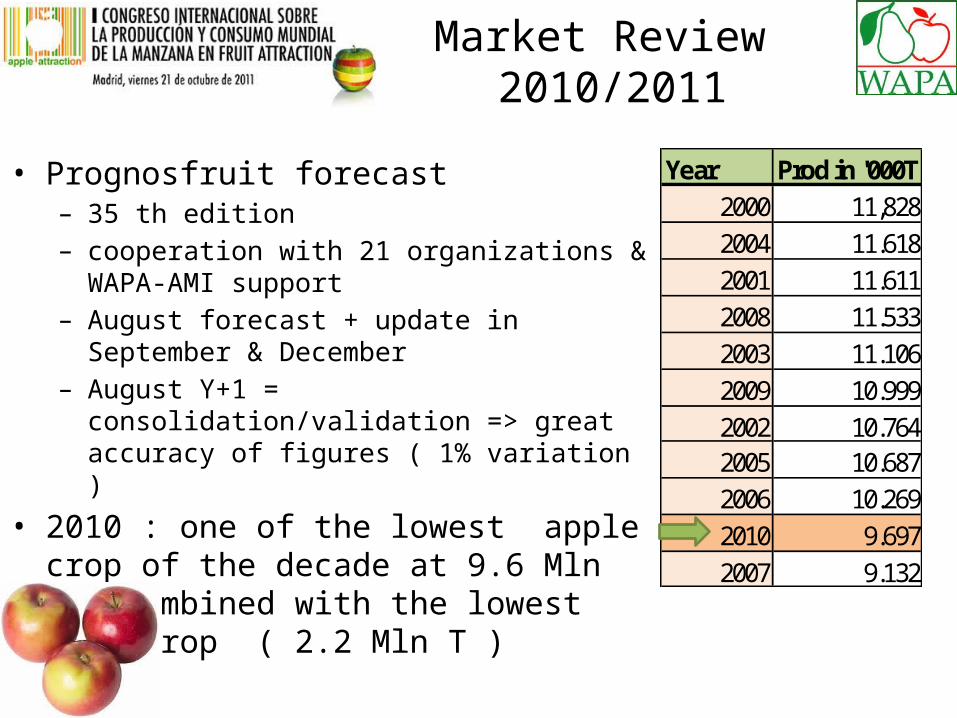
• Prognosfruit forecast– 35 th edition – cooperation with 21 organizations & WAPA-AMI
support– August forecast + update in September & December– August Y+1 = consolidation/validation => great
accuracy of figures ( 1% variation )
• 2010 : one of the lowest apple crop of the decade at 9.6 Mln T, combined with the lowest pear crop ( 2.2 Mln T )
Year Prod in '000T2000 11,8282004 11.6182001 11.6112008 11.5332003 11.1062009 10.9992002 10.7642005 10.6872006 10.2692010 9.6972007 9.132
Market Review 2010/2011
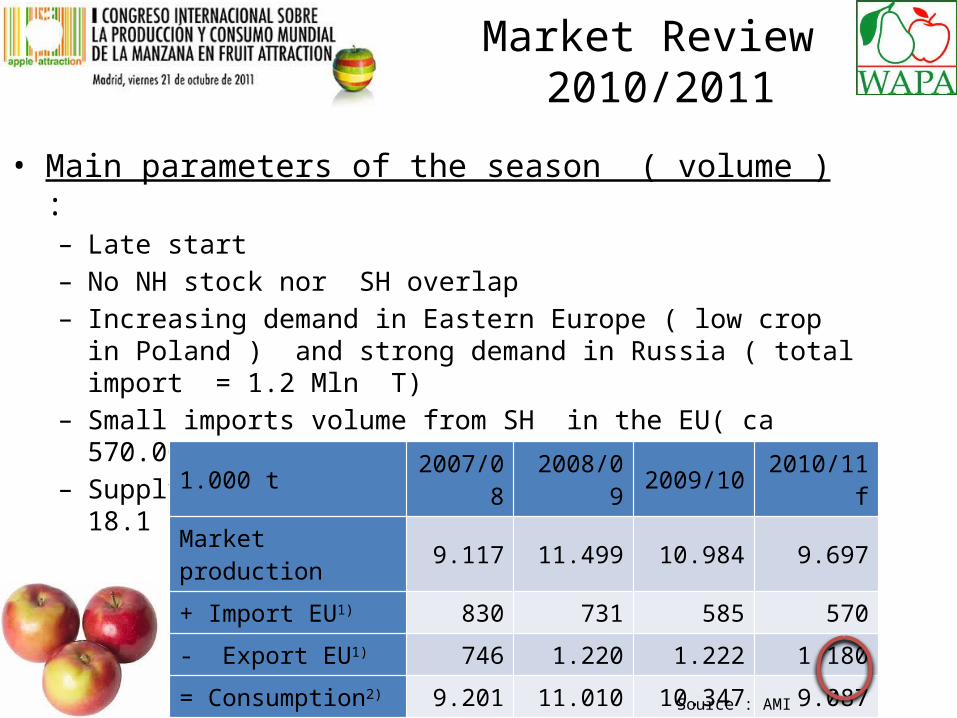
• Main parameters of the season ( volume ) : – Late start – No NH stock nor SH overlap – Increasing demand in Eastern Europe ( low crop in Poland ) and strong
demand in Russia ( total import = 1.2 Mln T) – Small imports volume from SH in the EU( ca 570.000 T )– Supply balance => lower fresh consumption at 18.1 kg/capita
1.000 t 2007/08 2008/09 2009/10 2010/11f
Market production 9.117 11.499 10.984 9.697
+ Import EU1) 830 731 585 570
- Export EU1) 746 1.220 1.222 1.180
= Consumption2) 9.201 11.010 10.347 9.087Per capita (kg) 18,4 22,0 20,7 18,1
Source : AMI
Market Review 2010/2011
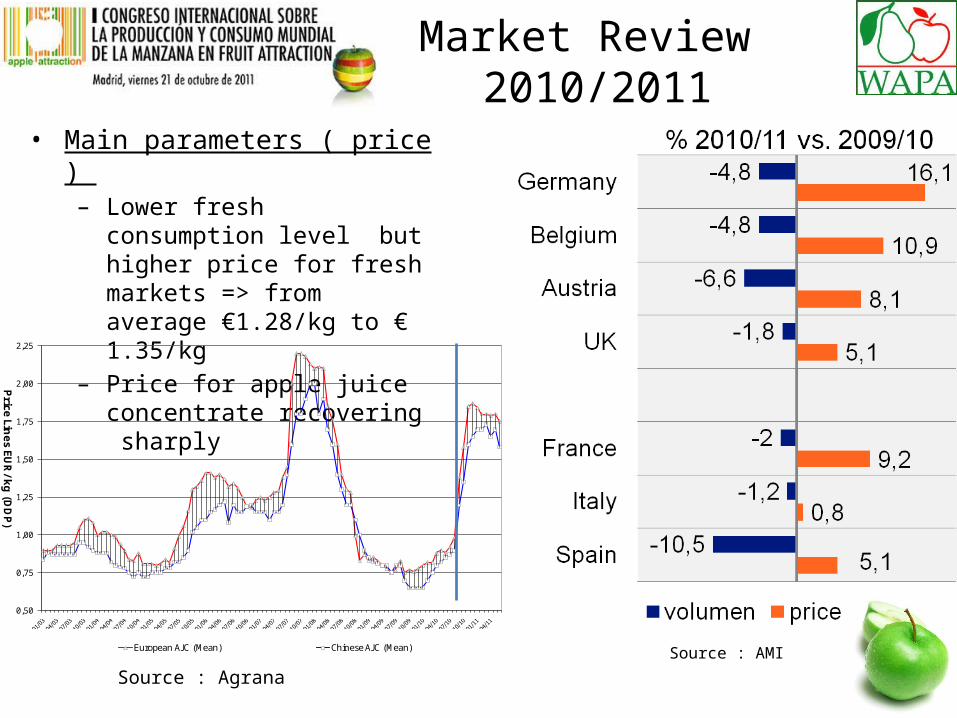
• Main parameters ( price ) – Lower fresh consumption level
but higher price for fresh markets => from average €1.28/kg to € 1.35/kg
– Price for apple juice concentrate recovering sharply
Source : AMI
0,50
0,75
1,00
1,25
1,50
1,75
2,00
2,25
Price
Lines E
UR
/kg (D
DP)
European AJC (Mean) Chinese AJC (Mean)
Source : Agrana
OUTLOOK 2011 : EU-27 AND OTHER EUROPEAN COUNTRIES
2011 crop forecast :EU-27
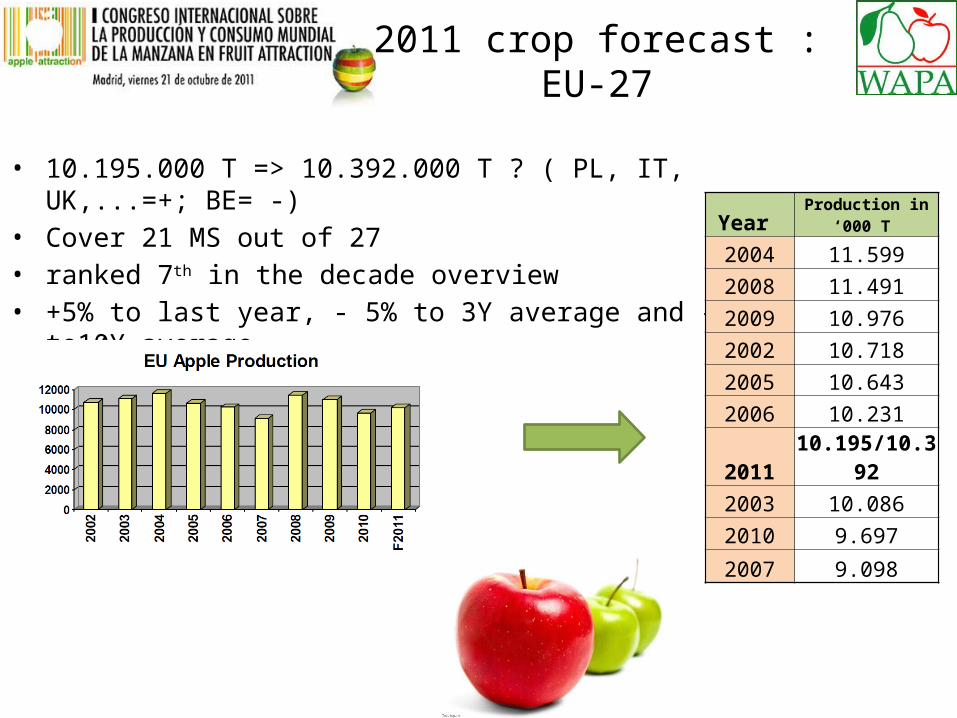
• 10.195.000 T => 10.392.000 T ? ( PL, IT, UK,...=+; BE= -)• Cover 21 MS out of 27 • ranked 7th in the decade overview • +5% to last year, - 5% to 3Y average and -4% to10Y average
Year Production in ‘000 T
2004 11.5992008 11.4912009 10.9762002 10.7182005 10.6432006 10.2312011 10.195/10.3922003 10.0862010 9.697
2007 9.098
2011 crop forecast :EU-27
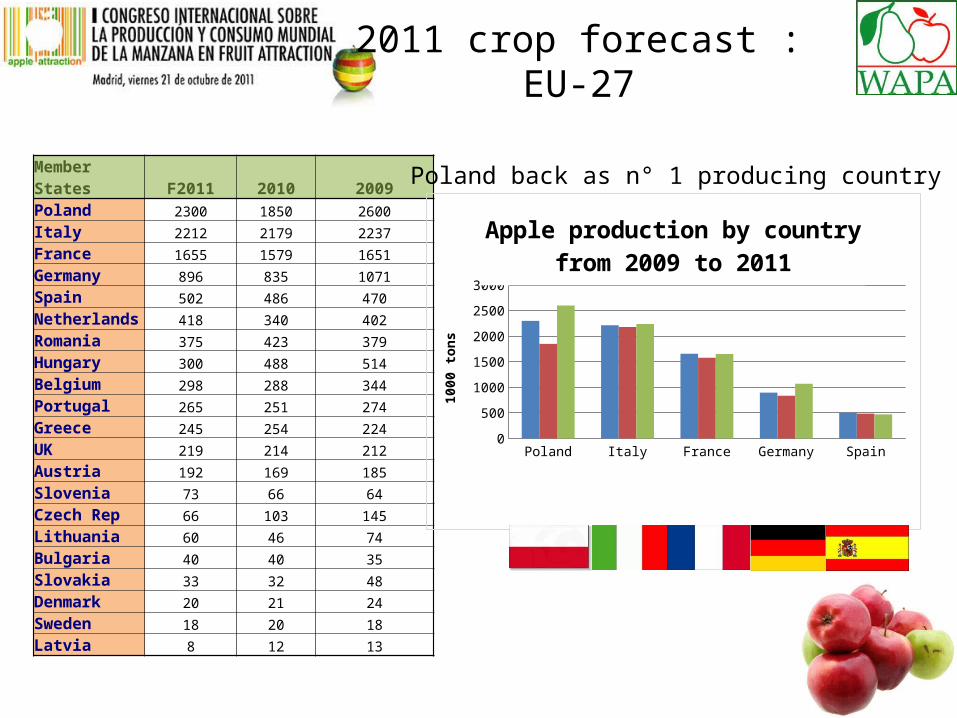
Member States F2011 2010 2009Poland 2300 1850 2600
Italy 2212 2179 2237
France 1655 1579 1651
Germany 896 835 1071
Spain 502 486 470
Netherlands 418 340 402
Romania 375 423 379
Hungary 300 488 514
Belgium 298 288 344
Portugal 265 251 274
Greece 245 254 224
UK 219 214 212
Austria 192 169 185
Slovenia 73 66 64
Czech Rep 66 103 145
Lithuania 60 46 74
Bulgaria 40 40 35
Slovakia 33 32 48
Denmark 20 21 24
Sweden 18 20 18
Latvia 8 12 13
Poland Italy France Germany Spain
F2011 2300 2212 1655 896 502
2010 1850 2179 1579 835 486
2009 2600 2237 1651 1071 470
250
750
1250
1750
2250
2750
Apple production by country from 2009 to 2011
1000
tons
Poland back as n° 1 producing country
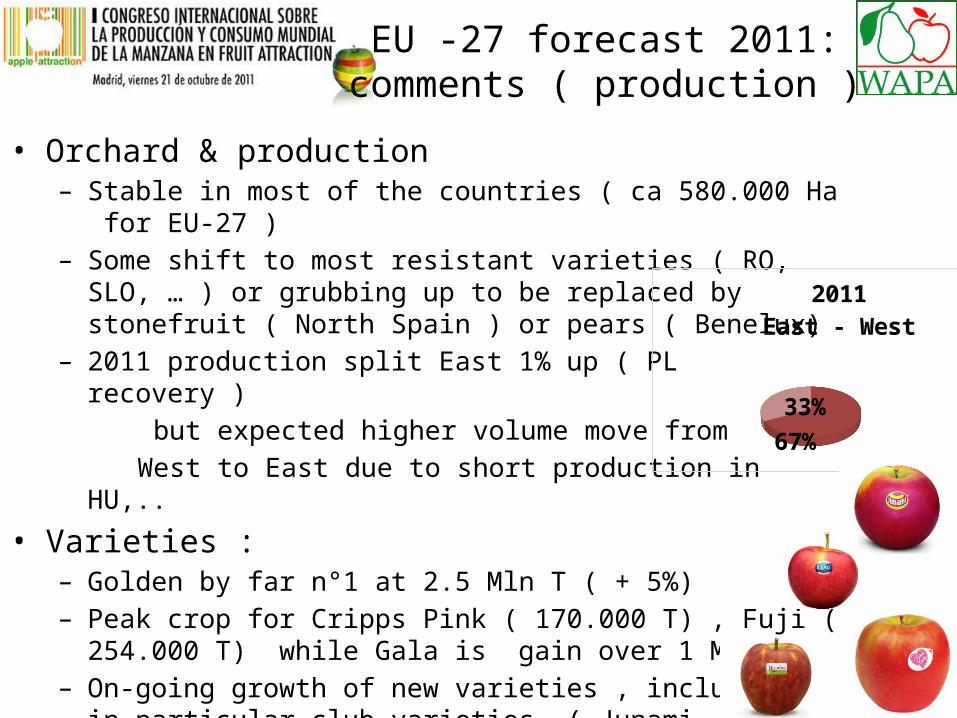
EU -27 forecast 2011: comments ( production )
• Orchard & production– Stable in most of the countries ( ca 580.000 Ha for EU-27 )– Some shift to most resistant varieties ( RO, SLO, … ) or grubbing up to
be replaced by stonefruit ( North Spain ) or pears ( Benelux) – 2011 production split East 1% up ( PL recovery ) but expected higher volume move from West to East due to short production in HU,..
• Varieties :– Golden by far n°1 at 2.5 Mln T ( + 5%) – Peak crop for Cripps Pink ( 170.000 T) , Fuji ( 254.000 T) while Gala is
gain over 1 Mln T – On-going growth of new varieties , including in particular club
varieties ( Junami, Kanzi, Rubens,…)– Decline for Idared, Jonagold , Red Delicious , Morgendurf,..
67%33%
2011 East - West
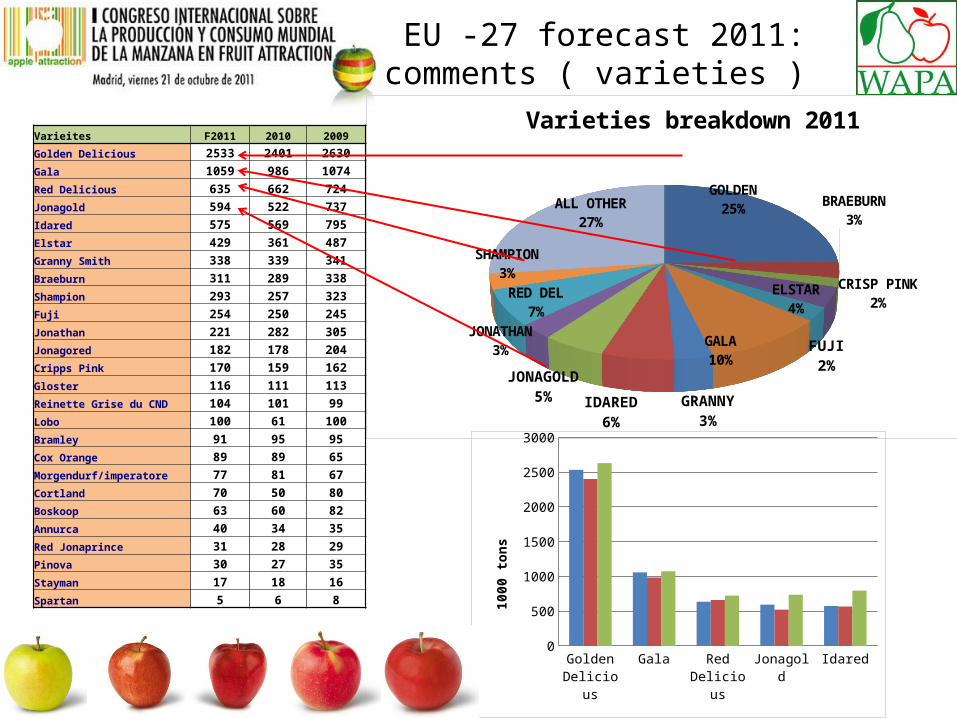
EU -27 forecast 2011: comments ( varieties )
GOLDEN25%
BRAEBURN3%
CRISP PINK2%ELSTAR
4%
FUJI2%GALA
10%
GRANNY3%
IDARED6%
JONAGOLD5%
JONATHAN3%
RED DEL7%
SHAMPION3%
ALL OTHER27%
Varieties breakdown 2011
Golden Delicious
Gala Red Deli-cious
Jonagold Idared
F2011 2533 1059 635 594 575
2010 2401 986 662 522 569
2009 2630 1074 724 737 795
250
750
1250
1750
2250
2750
1000
tons
Varieites F2011 2010 2009
Golden Delicious 2533 2401 2630
Gala 1059 986 1074
Red Delicious 635 662 724
Jonagold 594 522 737
Idared 575 569 795
Elstar 429 361 487
Granny Smith 338 339 341
Braeburn 311 289 338
Shampion 293 257 323
Fuji 254 250 245
Jonathan 221 282 305
Jonagored 182 178 204
Cripps Pink 170 159 162
Gloster 116 111 113
Reinette Grise du CND 104 101 99
Lobo 100 61 100
Bramley 91 95 95
Cox Orange 89 89 65
Morgendurf/imperatore 77 81 67
Cortland 70 50 80
Boskoop 63 60 82
Annurca 40 34 35
Red Jonaprince 31 28 29
Pinova 30 27 35
Stayman 17 18 16
Spartan 5 6 8
EU -27 forecast 2011: comments ( weather )
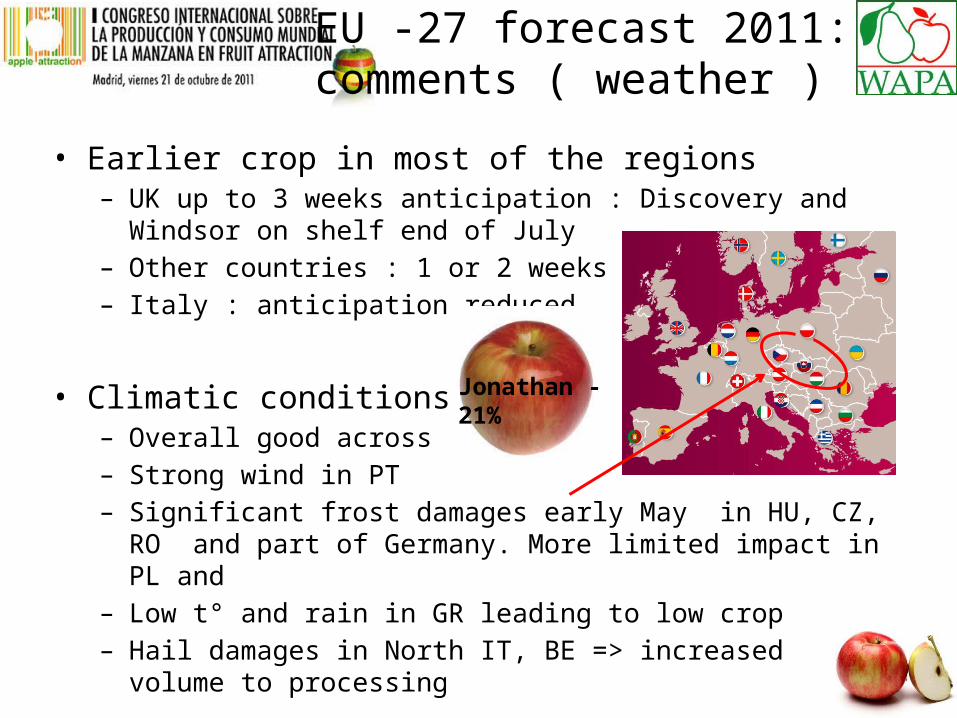
• Earlier crop in most of the regions – UK up to 3 weeks anticipation : Discovery and Windsor on shelf end of
July – Other countries : 1 or 2 weeks– Italy : anticipation reduced
• Climatic conditions– Overall good across Europe – Strong wind in PT– Significant frost damages early May in HU, CZ, RO and part of
Germany. More limited impact in PL and – Low t° and rain in GR leading to low crop– Hail damages in North IT, BE => increased volume to processing
Jonathan -21%
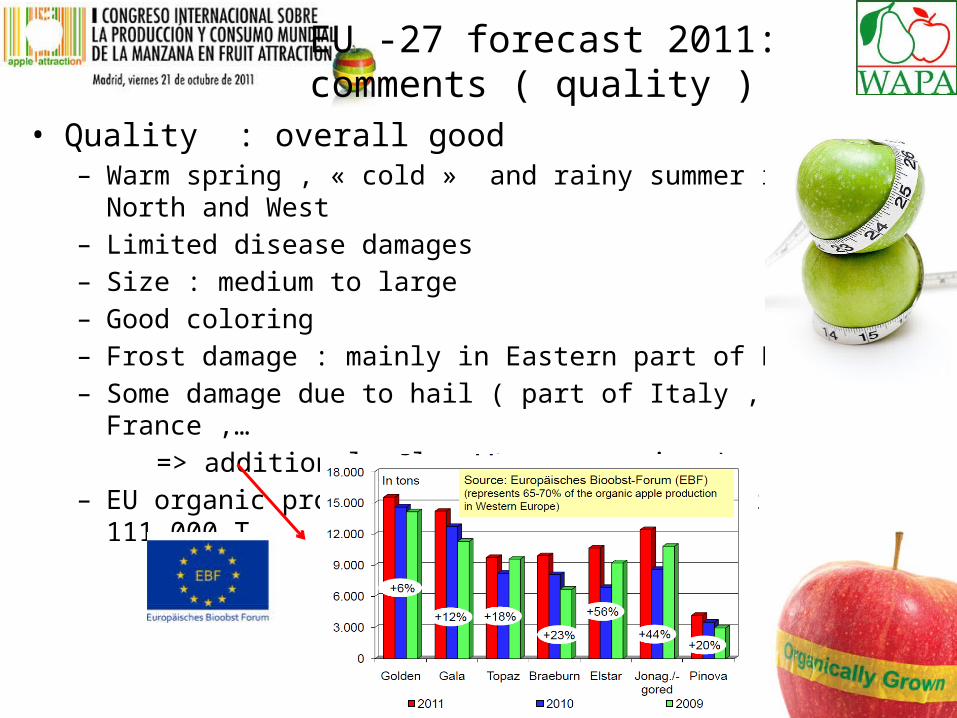
EU -27 forecast 2011: comments ( quality )
• Quality : overall good – Warm spring , « cold » and rainy summer in North and West– Limited disease damages– Size : medium to large – Good coloring– Frost damage : mainly in Eastern part of Europe– Some damage due to hail ( part of Italy , France ,… => additional volume to processing )– EU organic production up by almost 20% at 111.000 T
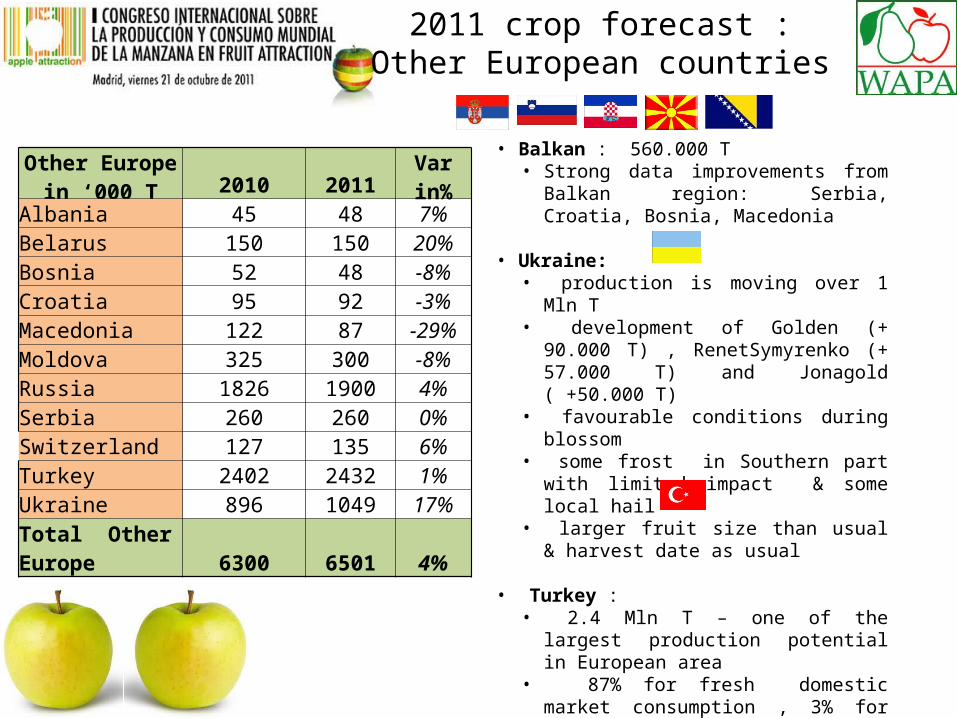
2011 crop forecast :Other European countries
• Balkan : 560.000 T
• Strong data improvements from Balkan region: Serbia, Croatia, Bosnia, Macedonia
• Ukraine: • production is moving over 1 Mln T • development of Golden (+ 90.000 T) ,
RenetSymyrenko (+ 57.000 T) and Jonagold ( +50.000 T)
• favourable conditions during blossom• some frost in Southern part with limited
impact & some local hail • larger fruit size than usual & harvest
date as usual
• Turkey : • 2.4 Mln T – one of the largest production
potential in European area• 87% for fresh domestic market
consumption , 3% for fresh exports and 10 % for juice . Limited import .
Other Europe in ‘000 T 2010 2011
Varin%
Albania 45 48 7%Belarus 150 150 20%Bosnia 52 48 -8%Croatia 95 92 -3%Macedonia 122 87 -29%Moldova 325 300 -8%Russia 1826 1900 4%Serbia 260 260 0%Switzerland 127 135 6%Turkey 2402 2432 1%Ukraine 896 1049 17%
Total Other Europe 6300 6501 4%
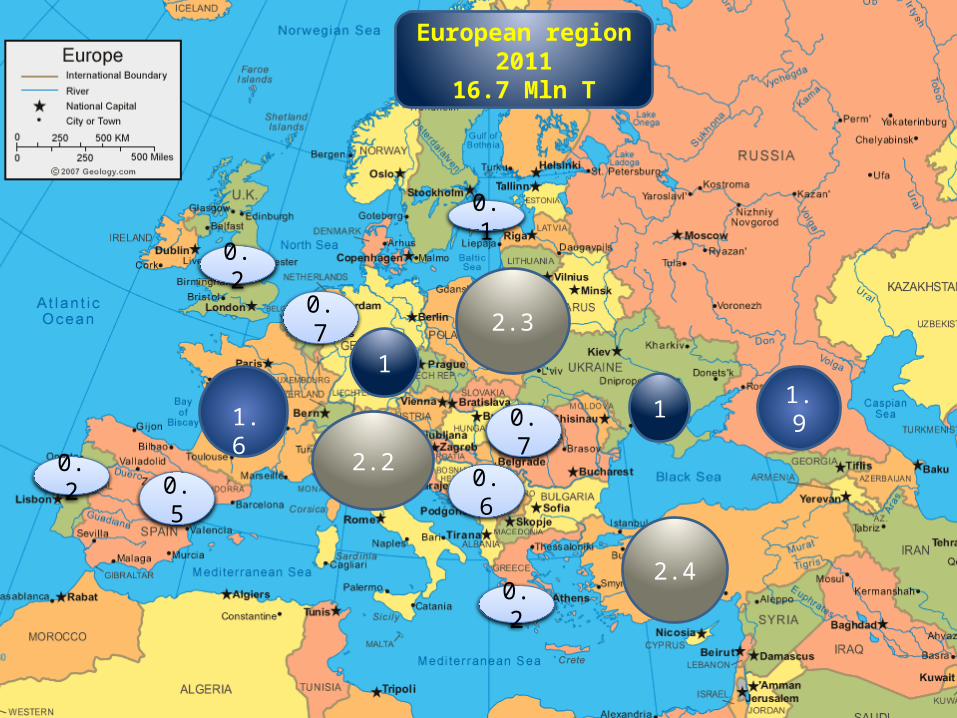
2.2
0.7
1
2.3
0.60.5
2.4
1.911.60.7
0.2
0.2
0.1
European region 201116.7 Mln T
0.2
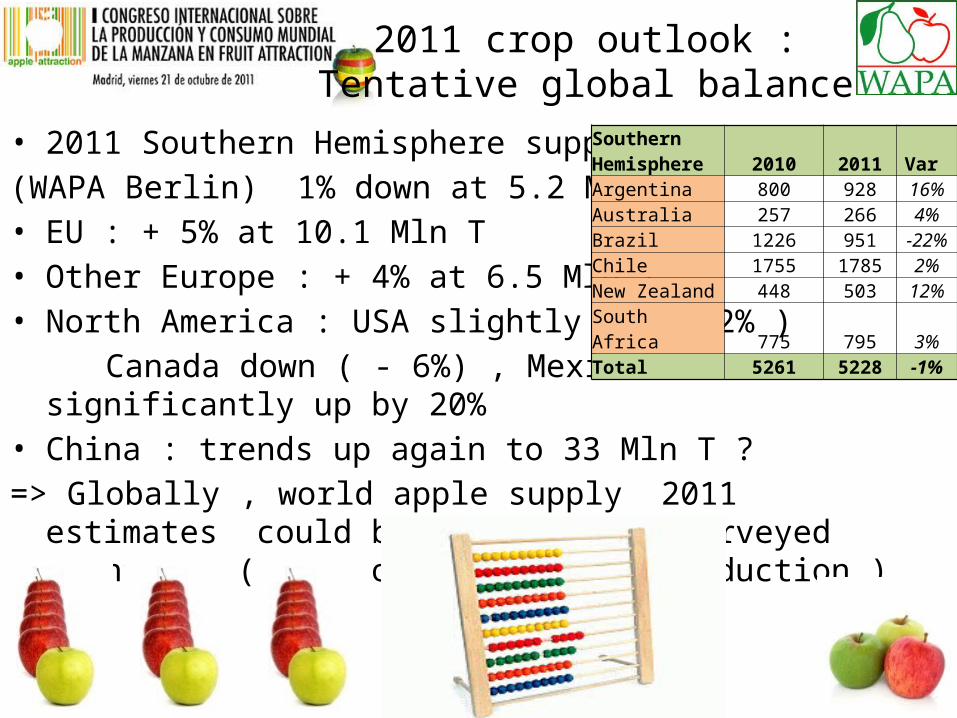
2011 crop outlook :Tentative global balance
• 2011 Southern Hemisphere supply (WAPA Berlin) 1% down at 5.2 Mln T• EU : + 5% at 10.1 Mln T • Other Europe : + 4% at 6.5 Mln T • North America : USA slightly up ( +2% ) Canada down ( - 6%) , Mexico significantly up by 20% • China : trends up again to 33 Mln T ?=> Globally , world apple supply 2011 estimates could be up by 5%
for surveyed countries ( =90% of world apple production )
Southern Hemisphere 2010 2011 Var Argentina 800 928 16%Australia 257 266 4%Brazil 1226 951 -22%Chile 1755 1785 2%New Zealand 448 503 12%South Africa 775 795 3%Total 5261 5228 -1%
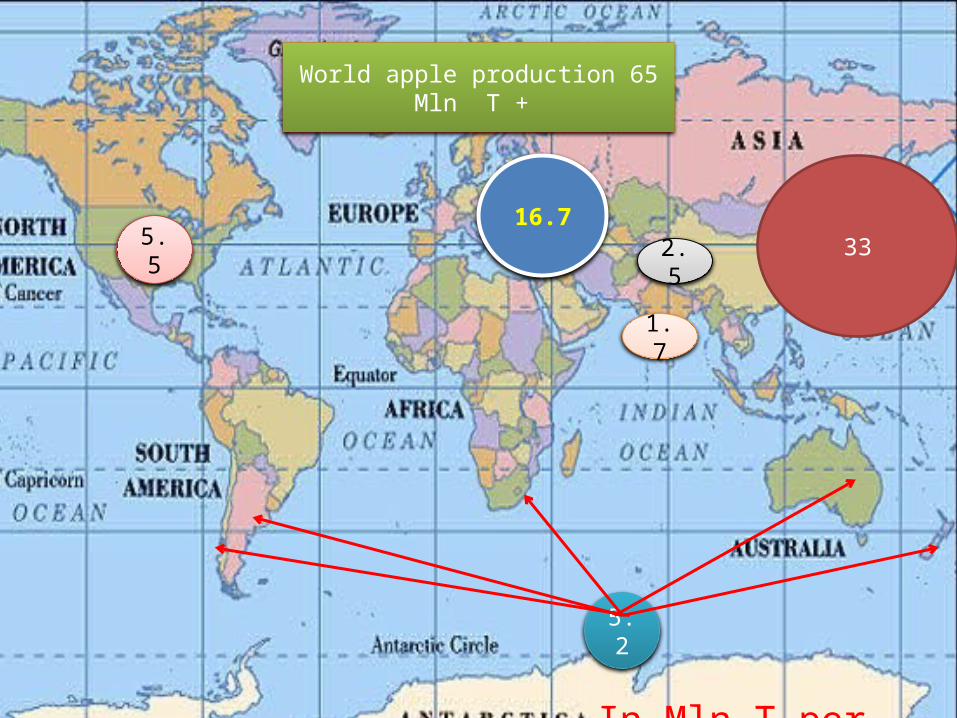
5.516.7
33
5.2
1.7
2.5
In Mln T per region
World apple production 65 Mln T +
MARKET OUTLOOK 2011-2012
?
EU Market outlook 2011-2012 :stocks
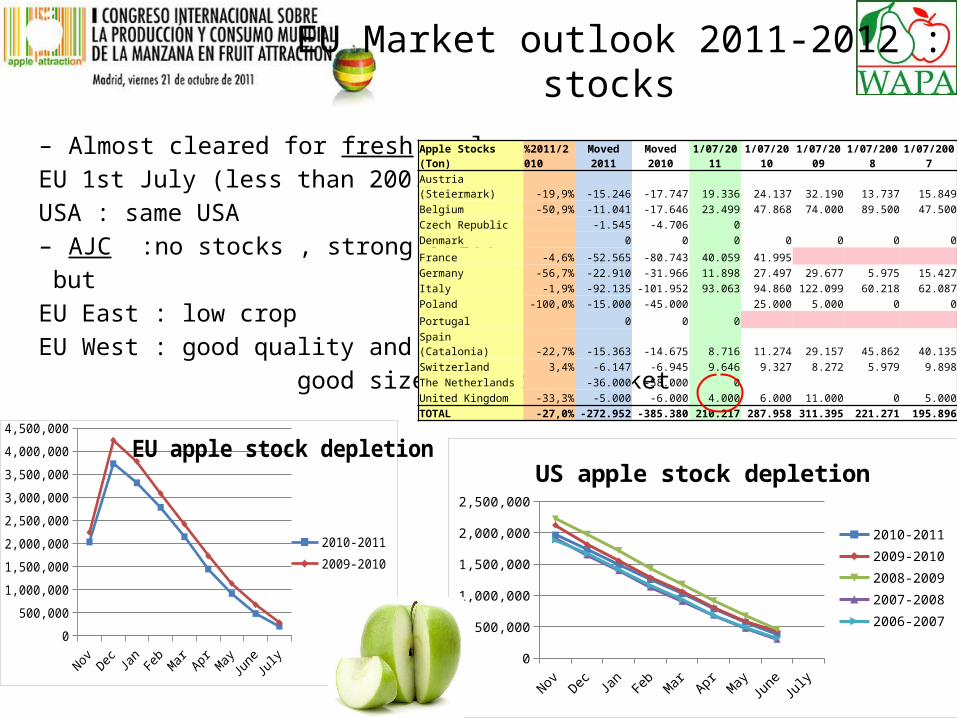
– Almost cleared for fresh apples EU 1st July (less than 200.000 T) –USA : same USA– AJC :no stocks , strong start but EU East : low cropEU West : good quality and good size for fresh market
Apple Stocks (Ton)%2011/2010
Moved 2011
Moved 2010 1/07/2011 1/07/2010 1/07/2009 1/07/2008 1/07/2007
Austria (Steiermark) -19,9% -15.246 -17.747 19.336 24.137 32.190 13.737 15.849
Belgium -50,9% -11.041 -17.646 23.499 47.868 74.000 89.500 47.500
Czech Republic -1.545 -4.706 0
Denmark 0 0 0 0 0 0 0
France -4,6% -52.565 -80.743 40.059 41.995 Germany -56,7% -22.910 -31.966 11.898 27.497 29.677 5.975 15.427
Italy -1,9% -92.135 -101.952 93.063 94.860 122.099 60.218 62.087
Poland -100,0% -15.000 -45.000 25.000 5.000 0 0
Portugal 0 0 0 Spain (Catalonia) -22,7% -15.363 -14.675 8.716 11.274 29.157 45.862 40.135
Switzerland 3,4% -6.147 -6.945 9.646 9.327 8.272 5.979 9.898
The Netherlands -36.000 -58.000 0
United Kingdom -33,3% -5.000 -6.000 4.000 6.000 11.000 0 5.000
TOTAL -27,0% -272.952 -385.380 210.217 287.958 311.395 221.271 195.896
Nov Dec Jan Feb Mar Apr May June July0
500,000
1,000,000
1,500,000
2,000,000
2,500,000
3,000,000
3,500,000
4,000,000
4,500,000EU apple stock depletion
2010-20112009-2010
Nov Dec Jan Feb Mar Apr May June July0
500,000
1,000,000
1,500,000
2,000,000
2,500,000
US apple stock depletion
2010-20112009-20102008-20092007-20082006-2007
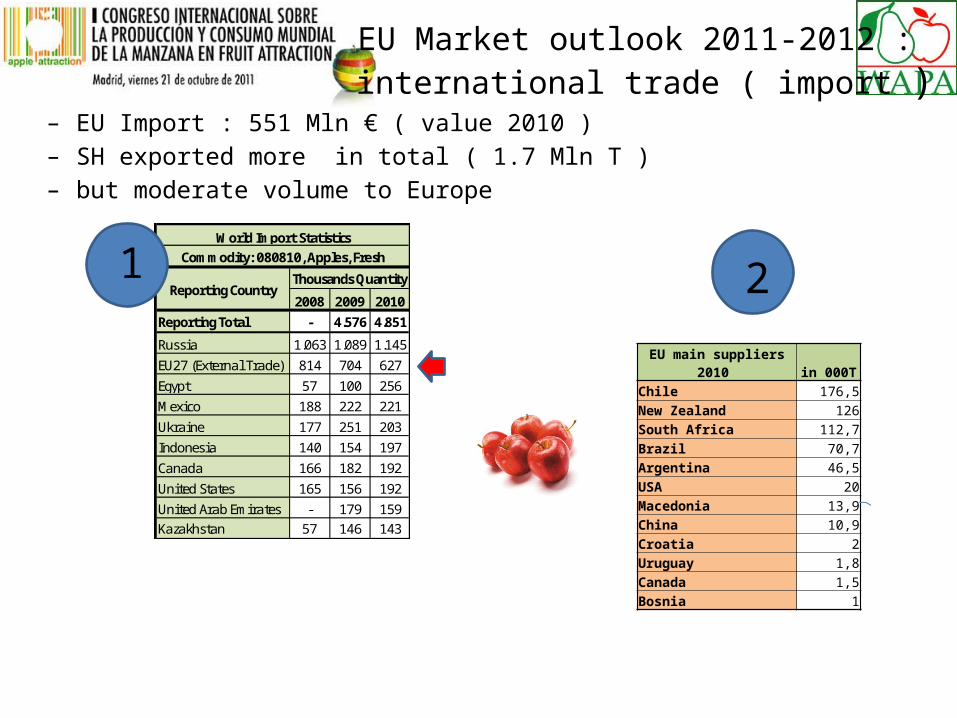
EU Market outlook 2011-2012 : international trade ( import )
– EU Import : 551 Mln € ( value 2010 ) – SH exported more in total ( 1.7 Mln T ) – but moderate volume to Europe
2008 2009 2010
Reporting Total - 4.576 4.851
Russia 1.063 1.089 1.145
EU27 (External Trade) 814 704 627
Egypt 57 100 256
Mexico 188 222 221
Ukraine 177 251 203
Indonesia 140 154 197
Canada 166 182 192
United States 165 156 192
United Arab Emirates - 179 159Kazakhstan 57 146 143
World Import StatisticsCommodity: 080810, Apples, Fresh
Reporting CountryThousands Quantity
EU main suppliers 2010 in 000TChile 176,5New Zealand 126South Africa 112,7Brazil 70,7Argentina 46,5USA 20Macedonia 13,9China 10,9Croatia 2Uruguay 1,8Canada 1,5Bosnia 1
1 2
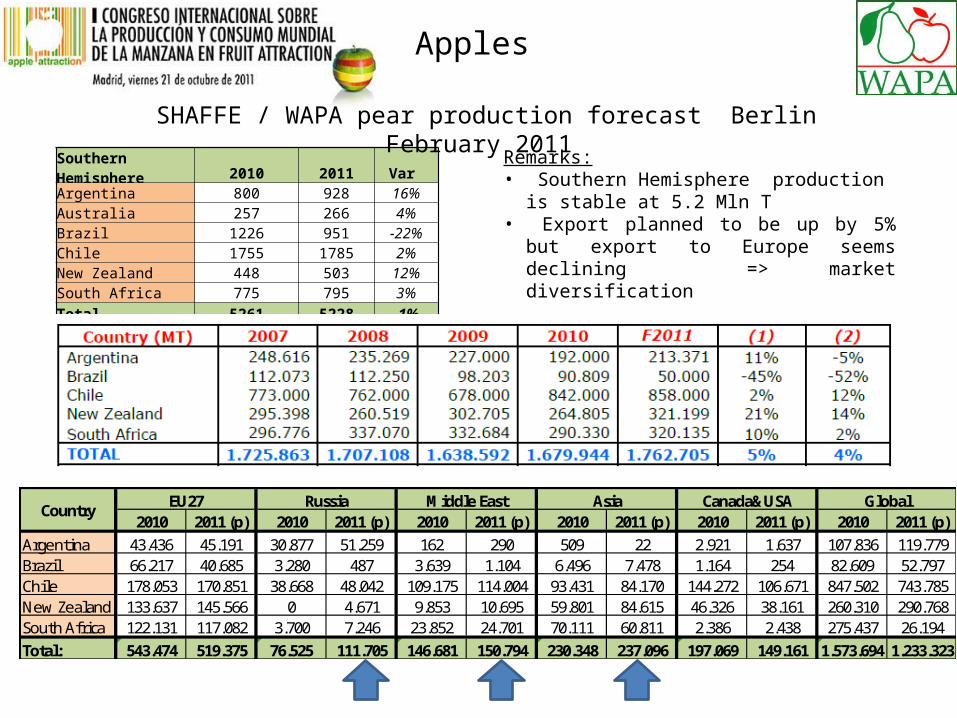
Apples
Remarks:• Southern Hemisphere production is stable
at 5.2 Mln T• Export planned to be up by 5% but export
to Europe seems declining => market diversification
Southern Hemisphere 2010 2011 Var Argentina 800 928 16%Australia 257 266 4%Brazil 1226 951 -22%Chile 1755 1785 2%New Zealand 448 503 12%South Africa 775 795 3%Total 5261 5228 -1%
SHAFFE / WAPA pear production forecast Berlin February 2011
2010 2011 (p) 2010 2011 (p) 2010 2011 (p) 2010 2011 (p) 2010 2011 (p) 2010 2011 (p)Argentina 43.436 45.191 30.877 51.259 162 290 509 22 2.921 1.637 107.836 119.779Brazil 66.217 40.685 3.280 487 3.639 1.104 6.496 7.478 1.164 254 82.609 52.797Chile 178.053 170.851 38.668 48.042 109.175 114.004 93.431 84.170 144.272 106.671 847.502 743.785New Zealand 133.637 145.566 0 4.671 9.853 10.695 59.801 84.615 46.326 38.161 260.310 290.768South Africa 122.131 117.082 3.700 7.246 23.852 24.701 70.111 60.811 2.386 2.438 275.437 26.194Total: 543.474 519.375 76.525 111.705 146.681 150.794 230.348 237.096 197.069 149.161 1.573.694 1.233.323
GlobalEU27 Russia Middle East Asia Canada&USACountry
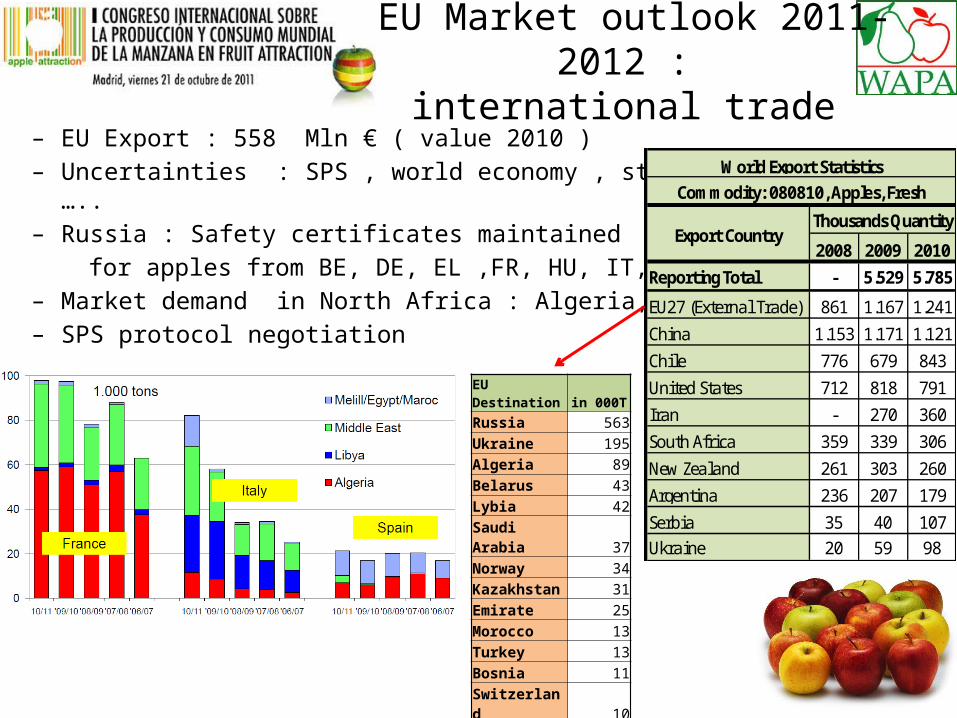
EU Market outlook 2011-2012 : international trade
– EU Export : 558 Mln € ( value 2010 ) – Uncertainties : SPS , world economy , strenght of the € ….. – Russia : Safety certificates maintained for apples from BE, DE, EL ,FR, HU, IT, NL, PL– Market demand in North Africa : Algeria, Egypt ,…– SPS protocol negotiation
2008 2009 2010
Reporting Total - 5.529 5.785
EU27 (External Trade) 861 1.167 1.241
China 1.153 1.171 1.121
Chile 776 679 843
United States 712 818 791
Iran - 270 360
South Africa 359 339 306
New Zealand 261 303 260
Argentina 236 207 179
Serbia 35 40 107Ukraine 20 59 98
World Export StatisticsCommodity: 080810, Apples, Fresh
Export CountryThousands Quantity
EU Destination in 000TRussia 563Ukraine 195Algeria 89Belarus 43Lybia 42Saudi Arabia 37Norway 34Kazakhstan 31Emirate 25Morocco 13Turkey 13Bosnia 11Switzerland 10Egypt 9Malaysia 9Croatia 8
EU Market outlook 2011-2012 : domestic market
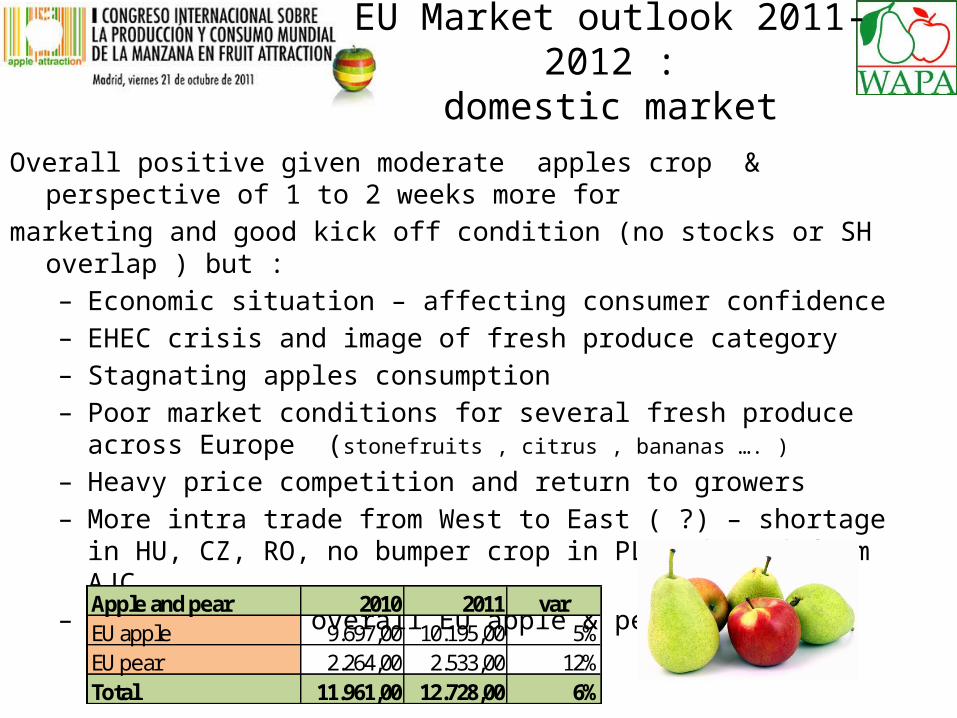
Overall positive given moderate apples crop & perspective of 1 to 2 weeks more formarketing and good kick off condition (no stocks or SH overlap ) but :
– Economic situation – affecting consumer confidence– EHEC crisis and image of fresh produce category – Stagnating apples consumption – Poor market conditions for several fresh produce across Europe (stonefruits ,
citrus , bananas …. )
– Heavy price competition and return to growers – More intra trade from West to East ( ?) – shortage in HU, CZ, RO, no bumper
crop in PL -demand from AJC – Pear crop up- overall EU apple & pear +6%
Apple and pear 2010 2011 var EU apple 9.697,00 10.195,00 5%EU pear 2.264,00 2.533,00 12%Total 11.961,00 12.728,00 6%
EU Market outlook 2011-2012 : regulatory issue
• Monitoring import licences– removed as of 1 September ( Com Regulation 669/2011) but– TAXUD and Eurostat data remaining available & SHAFFE monitoring is on-going
• Morpholine (Regulation 1333/2008 )– Not registered as additive in the EU => use is forbidden– On-going discussion for setting a cross contamination level ( at 0.3 ppm, )
• Status DPA– Being phased out unless new registration is requested ( Com Decision 2009/859 )– MRL status unclear ( Com Regulation 149/2008)
• Commission proposal to move to detection level but process of discussion and adoption is at least 9 months - consequences of persistant effect if detection level also for EU growers – non regulatory requirements to be taken into acount
• Different MRL to be considered if new registration succeeds
CONCLUSION
Key points 2011-2012
Mixed parameters but hopefully a positive outlook for 2011/2012 : • Positive elements for the season:
– “Moderate low” crop– Early start on a clean background – Good quality and size for fresh market – Demand for the AJC industry
• Negative elements for the season:– Complex fruit and vegetables markets – Market price and return to grower– Uncertainties about Russian market – Economic uncertainties – Stagnating consumption
• Prognosfruit 2012 : 3-4 August 2012 in Toulouse ( France ) with
www.prognosfruit.eu