Embed Size (px)
DESCRIPTION
APPLE CASE STUDY
Citation preview
Apple Inc.
Team Members:Mohit Bhatnagar_______________________________________
Case Abstract
• Apple Inc., originally Apple Computer, Inc., is an American multinational
corporation headquartered in California that designs, develops, and sells consumer
electronics, computer software and personal computers. The company was founded on April
1, 1976, and incorporated on January 3, 1977. The word "Computer" was removed from its
name on January 9, 2007, to reflect its shifted focus towards consumer electronics. Its best-
known hardware products are the Mac line of computers, the iPod, the iPhone and the iPad.
Its software includes the OSX and iOS operating systems, iCloud, the iTunes media
browser, the iLife and iWorkcreativity and production suites.
• Apple is the world's third-largest mobile phone maker after Samsung and Nokia.
Fortune magazine named Apple the most admired company in the United States in
2008, and in the world from 2008 to 2012. However, the company has received widespread
criticism for its contractors' labor practices, and for its environmental and business
practices. As of August 2012, Apple has 393 retail stores in fourteen countries as well as the
online Apple Store and iTunes Store. It is the largest publicly-traded corporation in the
world by market capitalization, with an estimated value of US$626 billion as of September
2012. The Apple market cap is larger than that of Google and Microsoft combined. As of
September 24, 2011, the company had 60,400 permanent full-time employees and 2,900
temporary full-time employees worldwide; its worldwide annual revenue in 2010 totaled
$65 billion, growing to $108 billion in 2011.
Vision Statement
• ―We believe that we are on the face of the earth to make great products and that's not changing. We are constantly focusing on innovating. We believe in the simple not the complex. We believe that we need to own and control the primary technologies behind the products that we make, and participate only in markets where we can make a significant contribution. We believe in saying no to thousands of projects, so that we can really focus on the few that are truly important and meaningful to us. We believe in deep collaboration and cross-pollination of our groups, which allow us to innovate in a way that others cannot. And frankly, we don't settle for anything less than excellence in every group in the company, and we have the self-honesty to admit when we're wrong and the courage to change. And regardless of who is in what job those values are so embedded in this company that Apple will do extremely well.‖
Timothy D. Cook
Apple‘s CEO
Mission Statement
• Apple designs Macs, the best personal computers in the world, along with OS
X, iLife, iWork and professional software. Apple leads the digital music revolution
with its iPods and iTunes online store. Apple has reinvented the mobile phone with
its revolutionary iPhone and App Store, and is defining the future of mobile media
and computing devices with iPad.
EFE Matrix
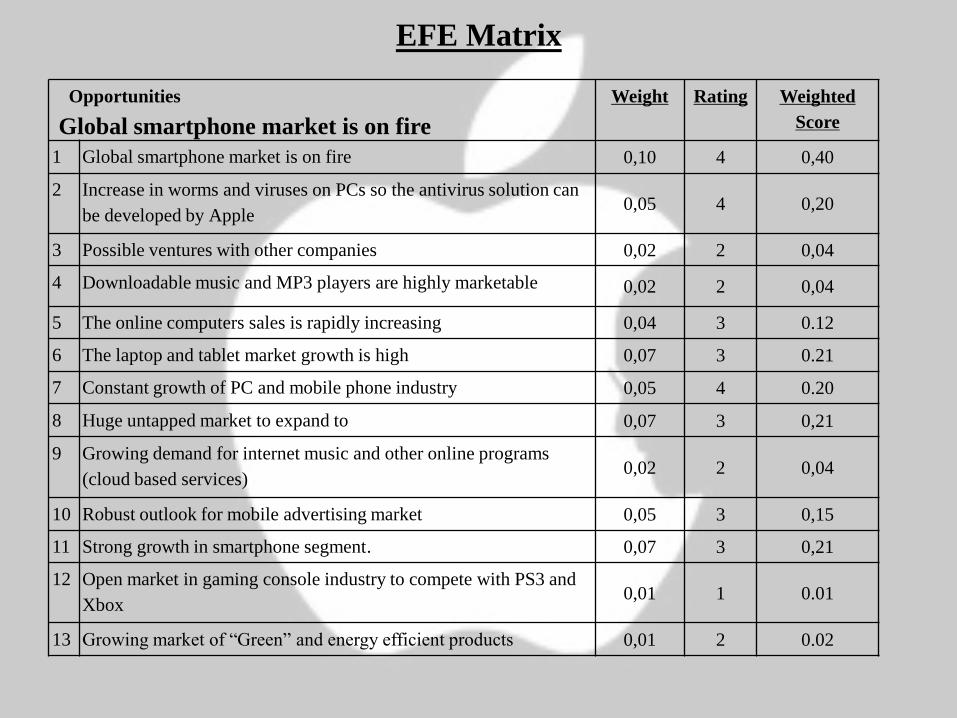
Opportunities Weight Rating Weighted
Score
1 Global smartphone market is on fire 0,10 4 0,40
2 Increase in worms and viruses on PCs so the antivirus solution can
be developed by Apple0,05 4 0,20
3 Possible ventures with other companies 0,02 2 0,04
4 Downloadable music and MP3 players are highly marketable 0,02 2 0,04
5 The online computers sales is rapidly increasing 0,04 3 0.12
6 The laptop and tablet market growth is high 0,07 3 0.21
7 Constant growth of PC and mobile phone industry 0,05 4 0.20
8 Huge untapped market to expand to 0,07 3 0,21
9 Growing demand for internet music and other online programs
(cloud based services)0,02 2 0,04
10 Robust outlook for mobile advertising market 0,05 3 0,15
11 Strong growth in smartphone segment. 0,07 3 0,21
12 Open market in gaming console industry to compete with PS3 and
Xbox0,01 1 0.01
13 Growing market of ―Green‖ and energy efficient products 0,01 2 0.02
Global smartphone market is on fire
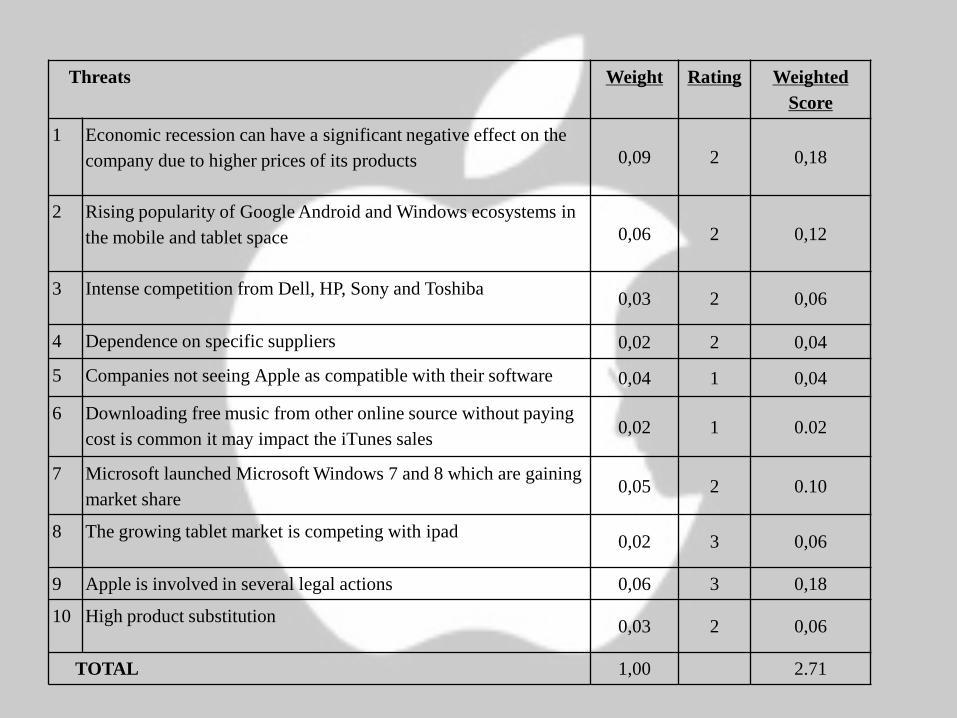
Threats Weight Rating Weighted
Score
1 Economic recession can have a significant negative effect on the
company due to higher prices of its products 0,09 2 0,18
2 Rising popularity of Google Android and Windows ecosystems in
the mobile and tablet space 0,06 2 0,12
3 Intense competition from Dell, HP, Sony and Toshiba0,03 2 0,06
4 Dependence on specific suppliers 0,02 2 0,04
5 Companies not seeing Apple as compatible with their software 0,04 1 0,04
6 Downloading free music from other online source without paying
cost is common it may impact the iTunes sales0,02 1 0.02
7 Microsoft launched Microsoft Windows 7 and 8 which are gaining
market share0,05 2 0.10
8 The growing tablet market is competing with ipad0,02 3 0,06
9 Apple is involved in several legal actions 0,06 3 0,18
10 High product substitution0,03 2 0,06
TOTAL 1,00 2.71
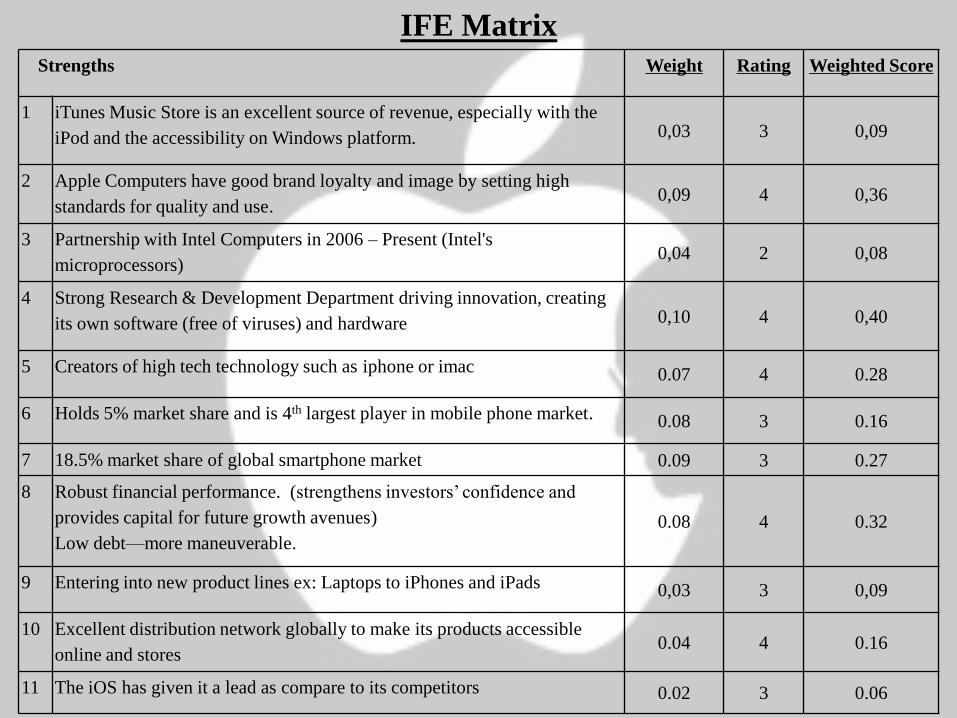
IFE Matrix
Strengths Weight Rating Weighted Score
1 iTunes Music Store is an excellent source of revenue, especially with the
iPod and the accessibility on Windows platform. 0,03 3 0,09
2 Apple Computers have good brand loyalty and image by setting high
standards for quality and use.0,09 4 0,36
3 Partnership with Intel Computers in 2006 – Present (Intel's
microprocessors)0,04 2 0,08
4 Strong Research & Development Department driving innovation, creating
its own software (free of viruses) and hardware 0,10 4 0,40
5 Creators of high tech technology such as iphone or imac 0.07 4 0.28
6 Holds 5% market share and is 4th largest player in mobile phone market. 0.08 3 0.16
7 18.5% market share of global smartphone market 0.09 3 0.27
8 Robust financial performance. (strengthens investors‘ confidence and
provides capital for future growth avenues)
Low debt—more maneuverable.
0.08 4 0.32
9 Entering into new product lines ex: Laptops to iPhones and iPads 0,03 3 0,09
10 Excellent distribution network globally to make its products accessible
online and stores0.04 4 0.16
11 The iOS has given it a lead as compare to its competitors 0.02 3 0.06
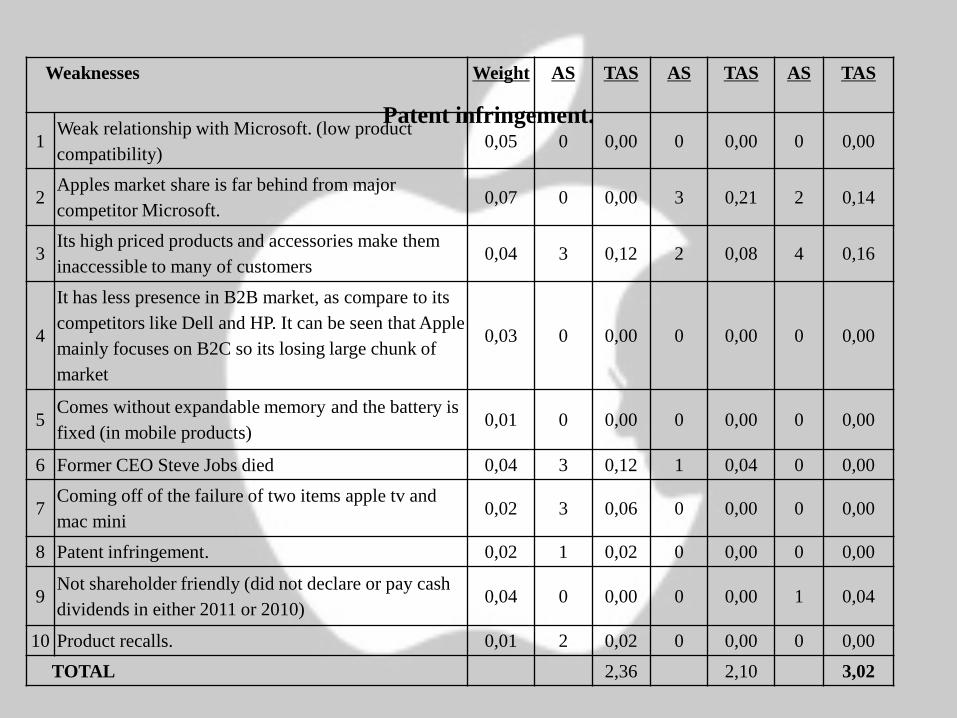
Weaknesses Weight AS TAS AS TAS AS TAS
1Weak relationship with Microsoft. (low product
compatibility)0,05 0 0,00 0 0,00 0 0,00
2Apples market share is far behind from major
competitor Microsoft.0,07 0 0,00 3 0,21 2 0,14
3Its high priced products and accessories make them
inaccessible to many of customers0,04 3 0,12 2 0,08 4 0,16
4
It has less presence in B2B market, as compare to its
competitors like Dell and HP. It can be seen that Apple
mainly focuses on B2C so its losing large chunk of
market
0,03 0 0,00 0 0,00 0 0,00
5Comes without expandable memory and the battery is
fixed (in mobile products)0,01 0 0,00 0 0,00 0 0,00
6 Former CEO Steve Jobs died 0,04 3 0,12 1 0,04 0 0,00
7Coming off of the failure of two items apple tv and
mac mini0,02 3 0,06 0 0,00 0 0,00
8 Patent infringement. 0,02 1 0,02 0 0,00 0 0,00
9Not shareholder friendly (did not declare or pay cash
dividends in either 2011 or 2010)0,04 0 0,00 0 0,00 1 0,04
10 Product recalls. 0,01 2 0,02 0 0,00 0 0,00
TOTAL 2,36 2,10 3,02
Patent infringement.
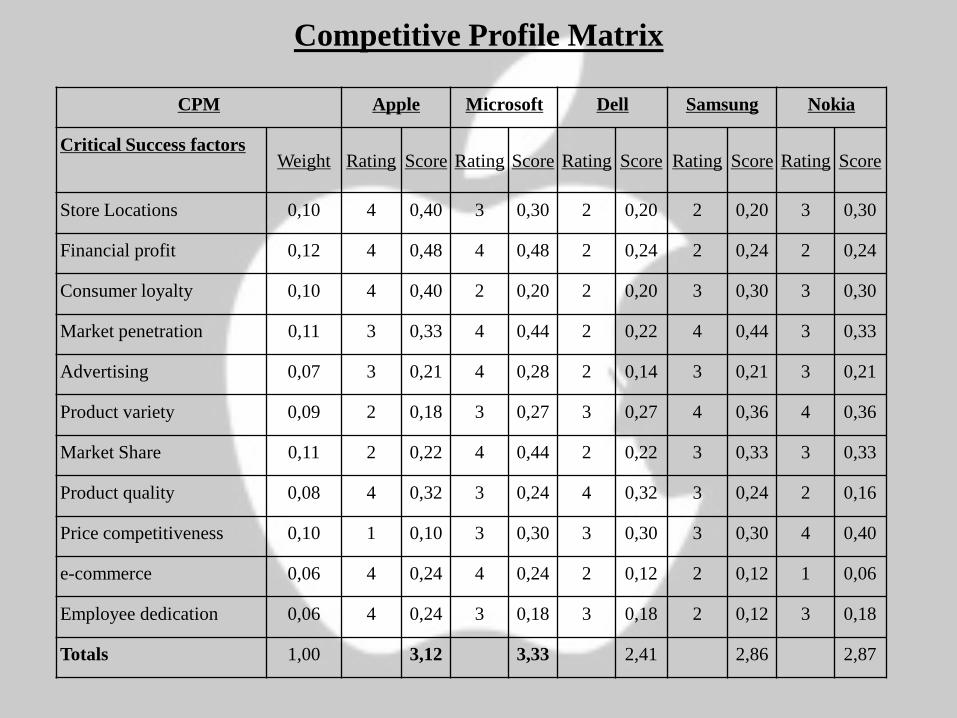
Competitive Profile Matrix
CPM Apple Microsoft Dell Samsung Nokia
Critical Success factorsWeight Rating Score Rating Score Rating Score Rating Score Rating Score
Store Locations 0,10 4 0,40 3 0,30 2 0,20 2 0,20 3 0,30
Financial profit 0,12 4 0,48 4 0,48 2 0,24 2 0,24 2 0,24
Consumer loyalty 0,10 4 0,40 2 0,20 2 0,20 3 0,30 3 0,30
Market penetration 0,11 3 0,33 4 0,44 2 0,22 4 0,44 3 0,33
Advertising 0,07 3 0,21 4 0,28 2 0,14 3 0,21 3 0,21
Product variety 0,09 2 0,18 3 0,27 3 0,27 4 0,36 4 0,36
Market Share 0,11 2 0,22 4 0,44 2 0,22 3 0,33 3 0,33
Product quality 0,08 4 0,32 3 0,24 4 0,32 3 0,24 2 0,16
Price competitiveness 0,10 1 0,10 3 0,30 3 0,30 3 0,30 4 0,40
e-commerce 0,06 4 0,24 4 0,24 2 0,12 2 0,12 1 0,06
Employee dedication 0,06 4 0,24 3 0,18 3 0,18 2 0,12 3 0,18
Totals 1,00 3,12 3,33 2,41 2,86 2,87
Financial Ratio Analysis
• Apple‘s Annual Report indicates that its business industry is Computer Hardware
and its sector is technology. Yet, many analysis consider Apple as being a direct
competitor with other hardware manufacturers such as Hewlett-Packard and even
Google, yet there is no comparison between Apple and other phone-related
manufacturers or devices, through 38% of its business is driven by iPhone and
related products. So, such competitors like Samsung or Nokia, should be strongly
considered due to the fact that they run its businesses in the same field. This usually
happens and is always a challenge when companies have wide product lines with a
different marketing mix in each line, like Apple which both belongs to the industry
of ―Computer Hardware‖ and ―Telecommunication Services‖.
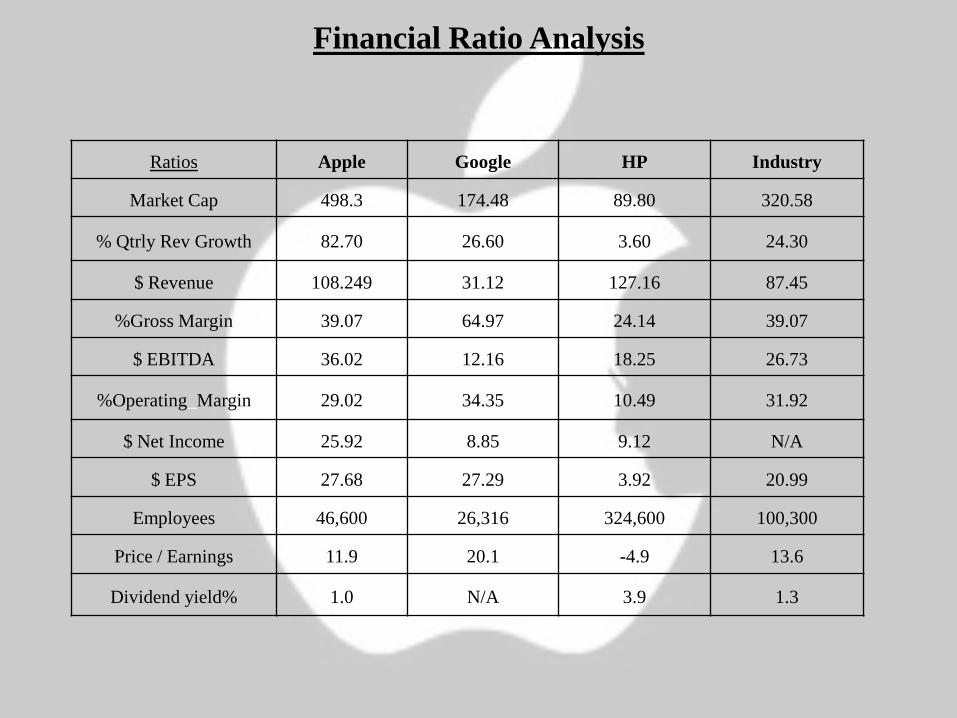
Ratios Apple Google HP Industry
Market Cap 498.3 174.48 89.80 320.58
% Qtrly Rev Growth 82.70 26.60 3.60 24.30
$ Revenue 108.249 31.12 127.16 87.45
%Gross Margin 39.07 64.97 24.14 39.07
$ EBITDA 36.02 12.16 18.25 26.73
%Operating_Margin 29.02 34.35 10.49 31.92
$ Net Income 25.92 8.85 9.12 N/A
$ EPS 27.68 27.29 3.92 20.99
Employees 46,600 26,316 324,600 100,300
Price / Earnings 11.9 20.1 -4.9 13.6
Dividend yield% 1.0 N/A 3.9 1.3
Financial Ratio Analysis
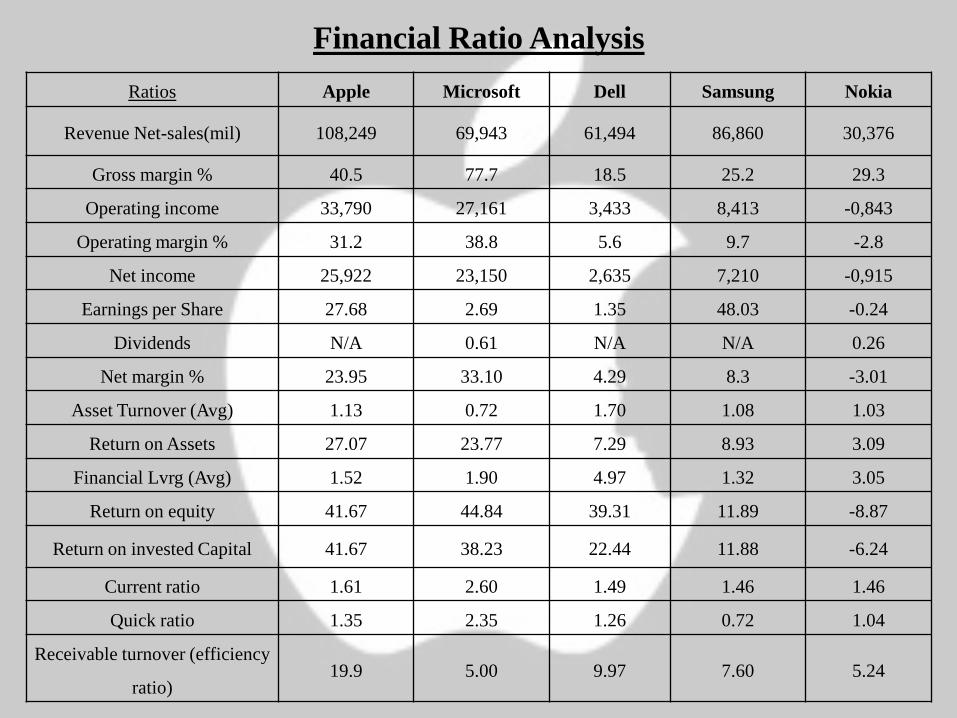
Ratios Apple Microsoft Dell Samsung Nokia
Revenue Net-sales(mil) 108,249 69,943 61,494 86,860 30,376
Gross margin % 40.5 77.7 18.5 25.2 29.3
Operating income 33,790 27,161 3,433 8,413 -0,843
Operating margin % 31.2 38.8 5.6 9.7 -2.8
Net income 25,922 23,150 2,635 7,210 -0,915
Earnings per Share 27.68 2.69 1.35 48.03 -0.24
Dividends N/A 0.61 N/A N/A 0.26
Net margin % 23.95 33.10 4.29 8.3 -3.01
Asset Turnover (Avg) 1.13 0.72 1.70 1.08 1.03
Return on Assets 27.07 23.77 7.29 8.93 3.09
Financial Lvrg (Avg) 1.52 1.90 4.97 1.32 3.05
Return on equity 41.67 44.84 39.31 11.89 -8.87
Return on invested Capital 41.67 38.23 22.44 11.88 -6.24
Current ratio 1.61 2.60 1.49 1.46 1.46
Quick ratio 1.35 2.35 1.26 0.72 1.04
Receivable turnover (efficiency
ratio)19.9 5.00 9.97 7.60 5.24
Financial Ratio Analysis
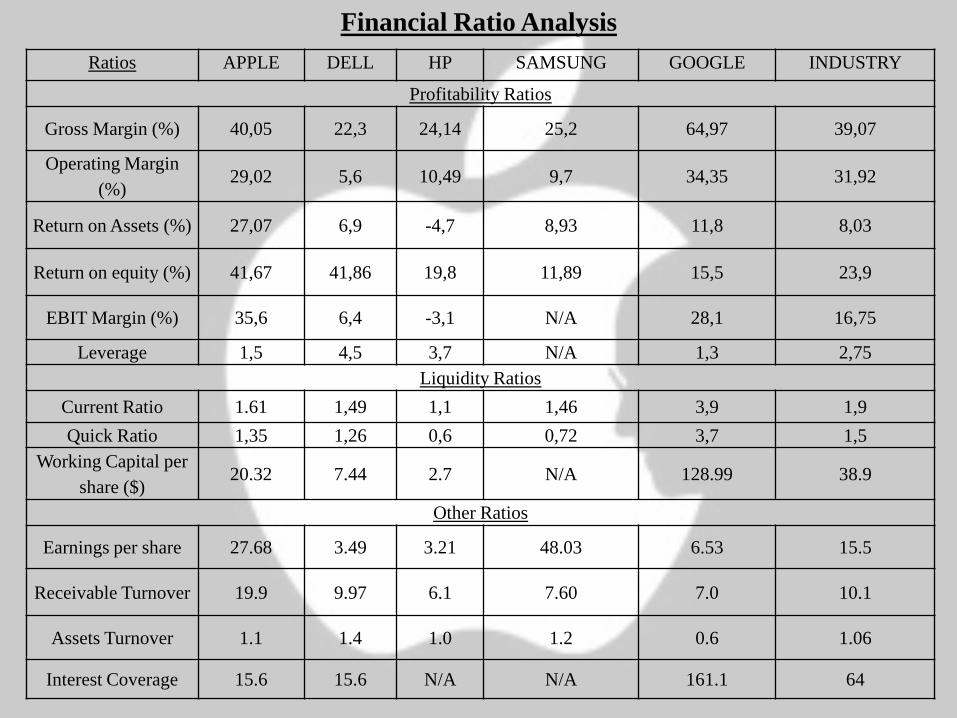
Ratios APPLE DELL HP SAMSUNG GOOGLE INDUSTRY
Profitability Ratios
Gross Margin (%) 40,05 22,3 24,14 25,2 64,97 39,07
Operating Margin
(%)29,02 5,6 10,49 9,7 34,35 31,92
Return on Assets (%) 27,07 6,9 -4,7 8,93 11,8 8,03
Return on equity (%) 41,67 41,86 19,8 11,89 15,5 23,9
EBIT Margin (%) 35,6 6,4 -3,1 N/A 28,1 16,75
Leverage 1,5 4,5 3,7 N/A 1,3 2,75
Liquidity Ratios
Current Ratio 1.61 1,49 1,1 1,46 3,9 1,9
Quick Ratio 1,35 1,26 0,6 0,72 3,7 1,5
Working Capital per
share ($)20.32 7.44 2.7 N/A 128.99 38.9
Other Ratios
Earnings per share 27.68 3.49 3.21 48.03 6.53 15.5
Receivable Turnover 19.9 9.97 6.1 7.60 7.0 10.1
Assets Turnover 1.1 1.4 1.0 1.2 0.6 1.06
Interest Coverage 15.6 15.6 N/A N/A 161.1 64
Financial Ratio Analysis
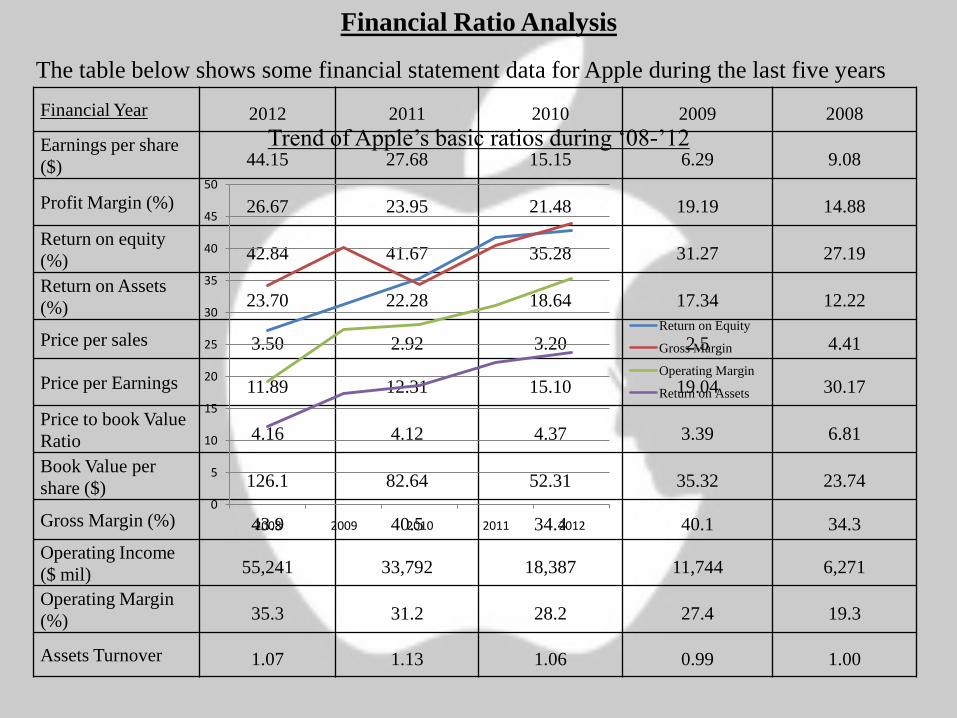
Financial Year 2012 2011 2010 2009 2008
Earnings per share
($) 44.15 27.68 15.15 6.29 9.08
Profit Margin (%) 26.67 23.95 21.48 19.19 14.88
Return on equity
(%) 42.84 41.67 35.28 31.27 27.19
Return on Assets
(%) 23.70 22.28 18.64 17.34 12.22
Price per sales 3.50 2.92 3.20 2.5 4.41
Price per Earnings 11.89 12.31 15.10 19.04 30.17
Price to book Value
Ratio 4.16 4.12 4.37 3.39 6.81
Book Value per
share ($) 126.1 82.64 52.31 35.32 23.74
Gross Margin (%) 43.9 40.5 34.4 40.1 34.3
Operating Income
($ mil) 55,241 33,792 18,387 11,744 6,271
Operating Margin
(%) 35.3 31.2 28.2 27.4 19.3
Assets Turnover 1.07 1.13 1.06 0.99 1.00
Financial Ratio Analysis
The table below shows some financial statement data for Apple during the last five years
0
5
10
15
20
25
30
35
40
45
50
2008 2009 2010 2011 2012
Return on Equity
Gross Margin
Operating Margin
Return on Assets
Trend of Apple‘s basic ratios during ‗08-‘12
Internal Analysis
Financial Position (FP)
External Analysis
Stability Position (SP)
Liquidity 7 Technological changes -1
Earnings per share 6 Price elasticity of demand -6
Sales 7 Competitive pressure -3
Revenues 7 Barriers to entry into Market -4
Return on equity 5
Financial Position (FP) Average 5,8 Stability Position (SP) Average -3,5
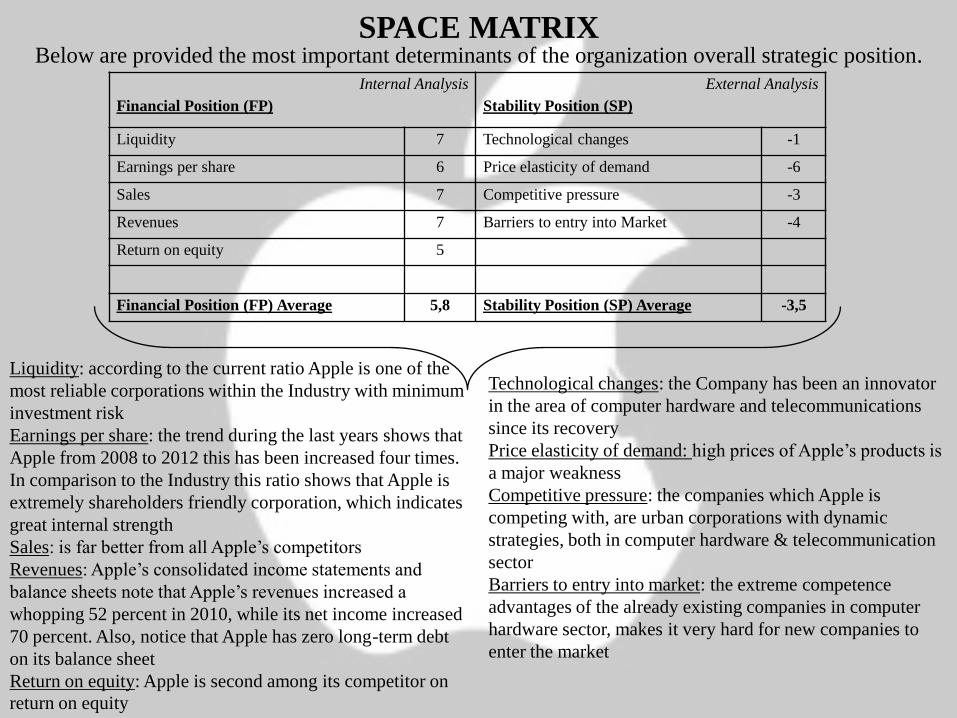
Below are provided the most important determinants of the organization overall strategic position.SPACE MATRIX
Liquidity: according to the current ratio Apple is one of the
most reliable corporations within the Industry with minimum
investment risk
Earnings per share: the trend during the last years shows that
Apple from 2008 to 2012 this has been increased four times.
In comparison to the Industry this ratio shows that Apple is
extremely shareholders friendly corporation, which indicates
great internal strength
Sales: is far better from all Apple‘s competitors
Revenues: Apple‘s consolidated income statements and
balance sheets note that Apple‘s revenues increased a
whopping 52 percent in 2010, while its net income increased
70 percent. Also, notice that Apple has zero long-term debt
on its balance sheet
Return on equity: Apple is second among its competitor on
return on equity
Technological changes: the Company has been an innovator
in the area of computer hardware and telecommunications
since its recovery
Price elasticity of demand: high prices of Apple‘s products is
a major weakness
Competitive pressure: the companies which Apple is
competing with, are urban corporations with dynamic
strategies, both in computer hardware & telecommunication
sector
Barriers to entry into market: the extreme competence
advantages of the already existing companies in computer
hardware sector, makes it very hard for new companies to
enter the market
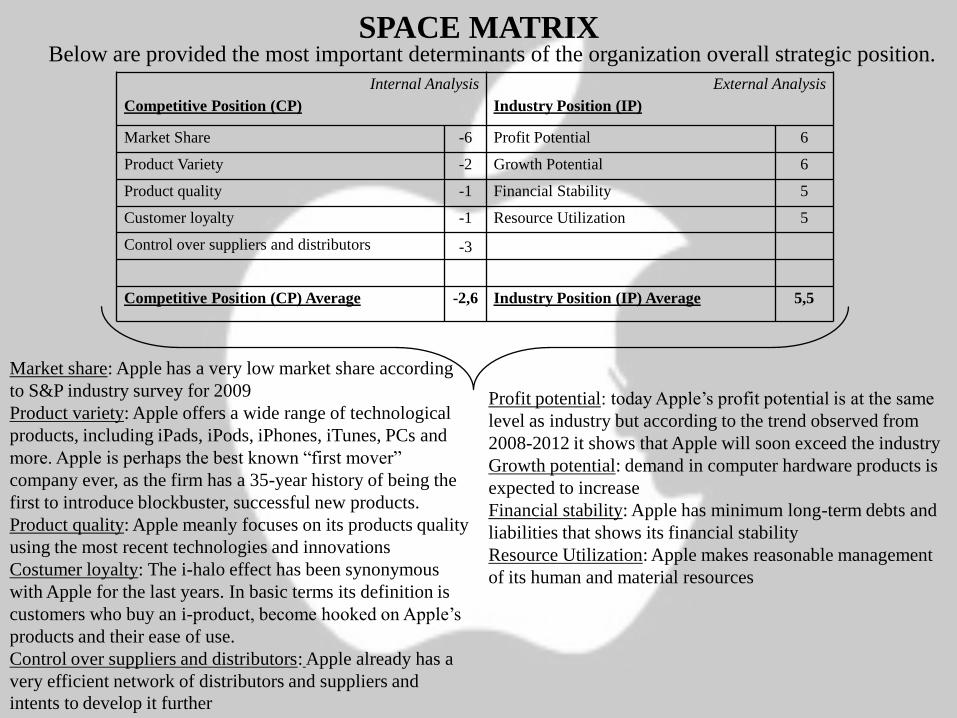
Below are provided the most important determinants of the organization overall strategic position.SPACE MATRIX
Internal Analysis
Competitive Position (CP)
External Analysis
Industry Position (IP)
Market Share -6 Profit Potential 6
Product Variety -2 Growth Potential 6
Product quality -1 Financial Stability 5
Customer loyalty -1 Resource Utilization 5
Control over suppliers and distributors -3
Competitive Position (CP) Average -2,6 Industry Position (IP) Average 5,5
Market share: Apple has a very low market share according
to S&P industry survey for 2009
Product variety: Apple offers a wide range of technological
products, including iPads, iPods, iPhones, iTunes, PCs and
more. Apple is perhaps the best known ―first mover‖
company ever, as the firm has a 35-year history of being the
first to introduce blockbuster, successful new products.
Product quality: Apple meanly focuses on its products quality
using the most recent technologies and innovations
Costumer loyalty: The i-halo effect has been synonymous
with Apple for the last years. In basic terms its definition is
customers who buy an i-product, become hooked on Apple‘s
products and their ease of use.
Control over suppliers and distributors: Apple already has a
very efficient network of distributors and suppliers and
intents to develop it further
Profit potential: today Apple‘s profit potential is at the same
level as industry but according to the trend observed from
2008-2012 it shows that Apple will soon exceed the industry
Growth potential: demand in computer hardware products is
expected to increase
Financial stability: Apple has minimum long-term debts and
liabilities that shows its financial stability
Resource Utilization: Apple makes reasonable management
of its human and material resources
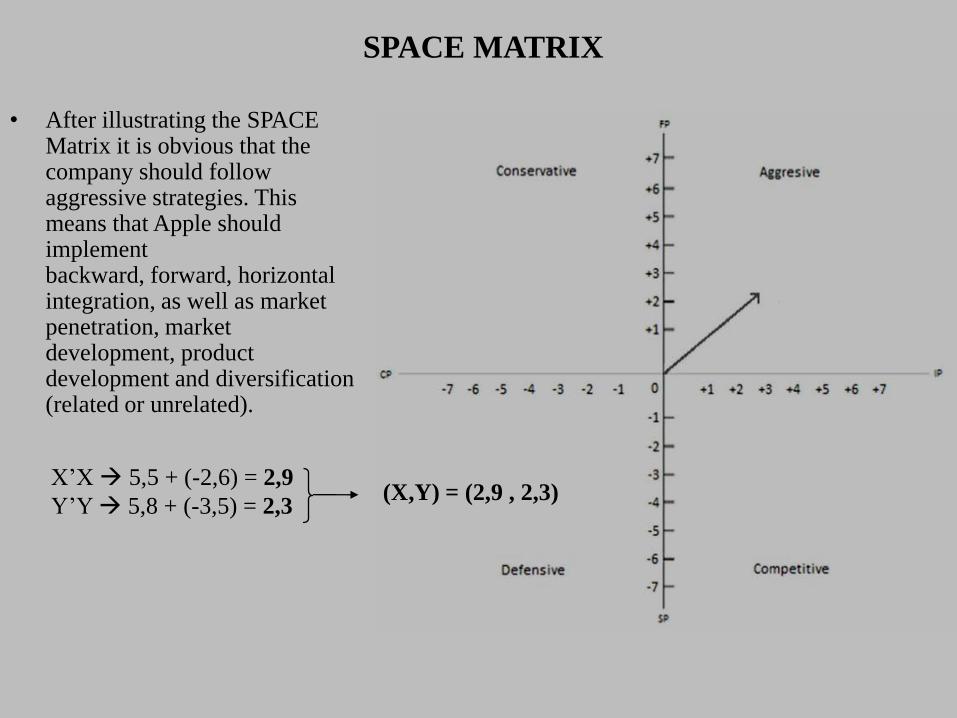
SPACE MATRIX
• After illustrating the SPACE Matrix it is obvious that the company should follow aggressive strategies. This means that Apple should implement backward, forward, horizontal integration, as well as market penetration, market development, product development and diversification (related or unrelated).
X‘X 5,5 + (-2,6) = 2,9
Y‘Y 5,8 + (-3,5) = 2,3(X,Y) = (2,9 , 2,3)
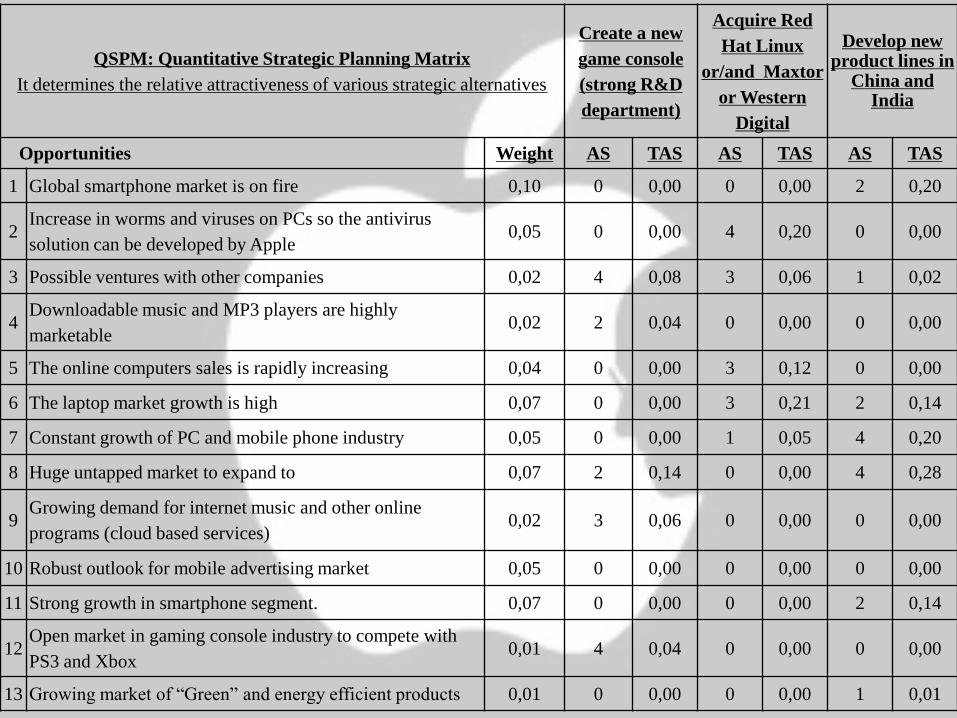
QSPM: Quantitative Strategic Planning Matrix
It determines the relative attractiveness of various strategic alternatives
Create a new
game console
(strong R&D
department)
Acquire Red
Hat Linux
or/and Maxtor
or Western
Digital
Develop new product lines in
China and India
Opportunities Weight AS TAS AS TAS AS TAS
1 Global smartphone market is on fire 0,10 0 0,00 0 0,00 2 0,20
2Increase in worms and viruses on PCs so the antivirus
solution can be developed by Apple0,05 0 0,00 4 0,20 0 0,00
3 Possible ventures with other companies 0,02 4 0,08 3 0,06 1 0,02
4Downloadable music and MP3 players are highly
marketable0,02 2 0,04 0 0,00 0 0,00
5 The online computers sales is rapidly increasing 0,04 0 0,00 3 0,12 0 0,00
6 The laptop market growth is high 0,07 0 0,00 3 0,21 2 0,14
7 Constant growth of PC and mobile phone industry 0,05 0 0,00 1 0,05 4 0,20
8 Huge untapped market to expand to 0,07 2 0,14 0 0,00 4 0,28
9Growing demand for internet music and other online
programs (cloud based services)0,02 3 0,06 0 0,00 0 0,00
10 Robust outlook for mobile advertising market 0,05 0 0,00 0 0,00 0 0,00
11 Strong growth in smartphone segment. 0,07 0 0,00 0 0,00 2 0,14
12Open market in gaming console industry to compete with
PS3 and Xbox0,01 4 0,04 0 0,00 0 0,00
13 Growing market of ―Green‖ and energy efficient products 0,01 0 0,00 0 0,00 1 0,01
QSPM: Quantitative Strategic Planning Matrix
It determines the relative attractiveness of various strategic alternatives
Create a new
game console
(strong R&D
department)
Acquire Red
Hat Linux
or/and Maxtor
or Western
Digital
Develop new product lines in
China and India
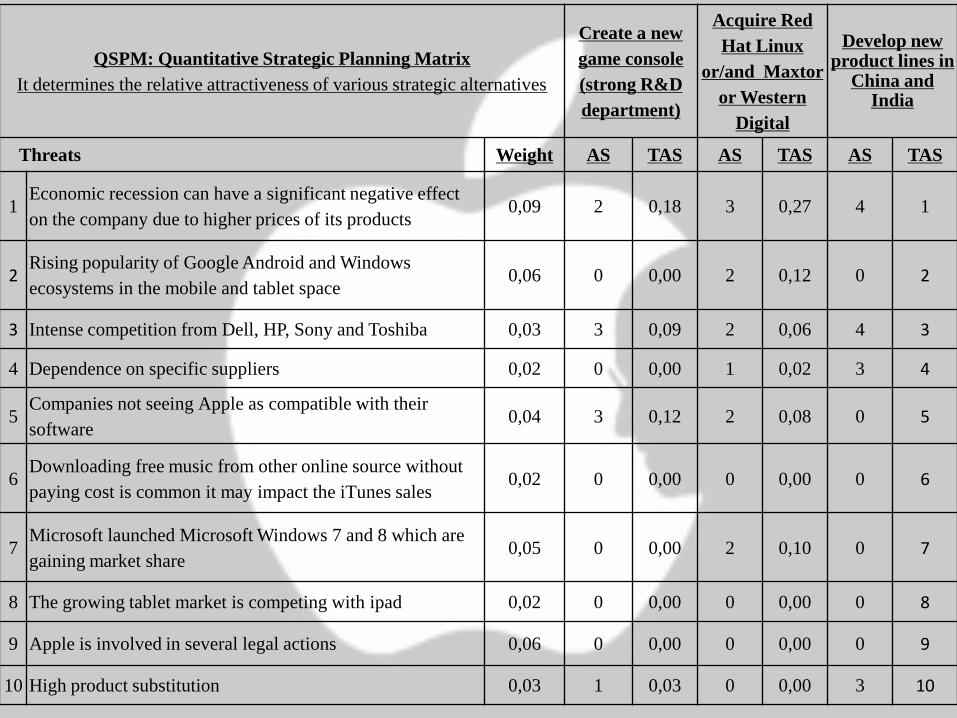
Threats Weight AS TAS AS TAS AS TAS
1Economic recession can have a significant negative effect
on the company due to higher prices of its products0,09 2 0,18 3 0,27 4 1
2Rising popularity of Google Android and Windows
ecosystems in the mobile and tablet space 0,06 0 0,00 2 0,12 0 2
3 Intense competition from Dell, HP, Sony and Toshiba 0,03 3 0,09 2 0,06 4 3
4 Dependence on specific suppliers 0,02 0 0,00 1 0,02 3 4
5Companies not seeing Apple as compatible with their
software0,04 3 0,12 2 0,08 0 5
6Downloading free music from other online source without
paying cost is common it may impact the iTunes sales0,02 0 0,00 0 0,00 0 6
7Microsoft launched Microsoft Windows 7 and 8 which are
gaining market share0,05 0 0,00 2 0,10 0 7
8 The growing tablet market is competing with ipad 0,02 0 0,00 0 0,00 0 8
9 Apple is involved in several legal actions 0,06 0 0,00 0 0,00 0 9
10 High product substitution 0,03 1 0,03 0 0,00 3 10
QSPM: Quantitative Strategic Planning Matrix
It determines the relative attractiveness of various strategic alternatives
Create a new
game console
(strong R&D
department)
Acquire Red
Hat Linux
or/and Maxtor
or Western
Digital
Develop new product lines in
China and India
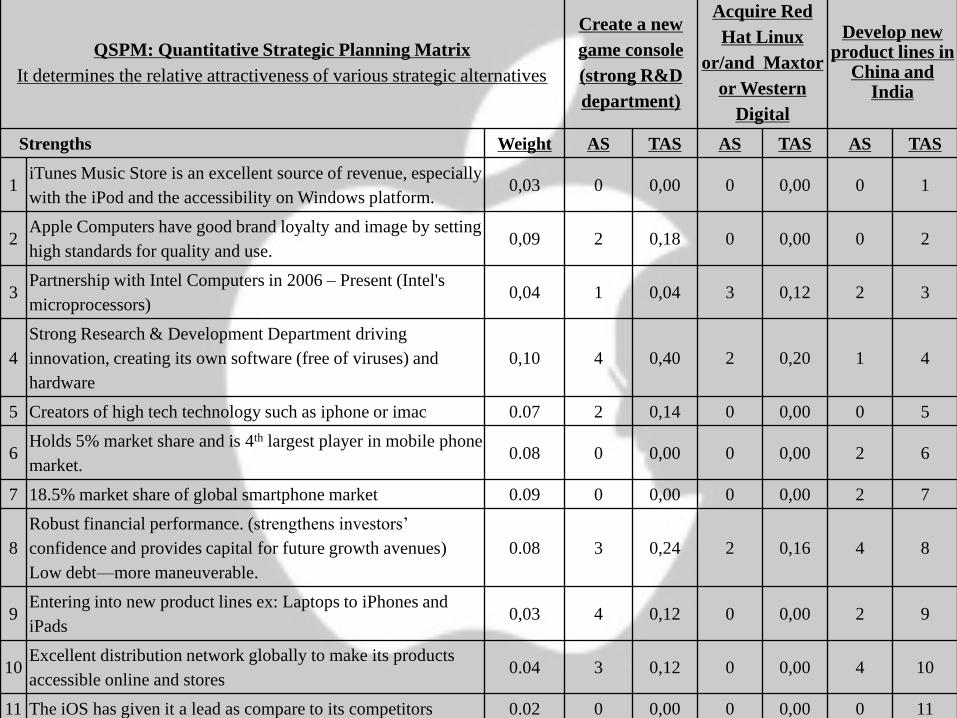
Strengths Weight AS TAS AS TAS AS TAS
1iTunes Music Store is an excellent source of revenue, especially
with the iPod and the accessibility on Windows platform.0,03 0 0,00 0 0,00 0 1
2Apple Computers have good brand loyalty and image by setting
high standards for quality and use. 0,09 2 0,18 0 0,00 0 2
3Partnership with Intel Computers in 2006 – Present (Intel's
microprocessors)0,04 1 0,04 3 0,12 2 3
4
Strong Research & Development Department driving
innovation, creating its own software (free of viruses) and
hardware
0,10 4 0,40 2 0,20 1 4
5 Creators of high tech technology such as iphone or imac 0.07 2 0,14 0 0,00 0 5
6Holds 5% market share and is 4th largest player in mobile phone
market.0.08 0 0,00 0 0,00 2 6
7 18.5% market share of global smartphone market 0.09 0 0,00 0 0,00 2 7
8
Robust financial performance. (strengthens investors‘
confidence and provides capital for future growth avenues)
Low debt—more maneuverable.
0.08 3 0,24 2 0,16 4 8
9Entering into new product lines ex: Laptops to iPhones and
iPads0,03 4 0,12 0 0,00 2 9
10Excellent distribution network globally to make its products
accessible online and stores0.04 3 0,12 0 0,00 4 10
11 The iOS has given it a lead as compare to its competitors 0.02 0 0,00 0 0,00 0 11
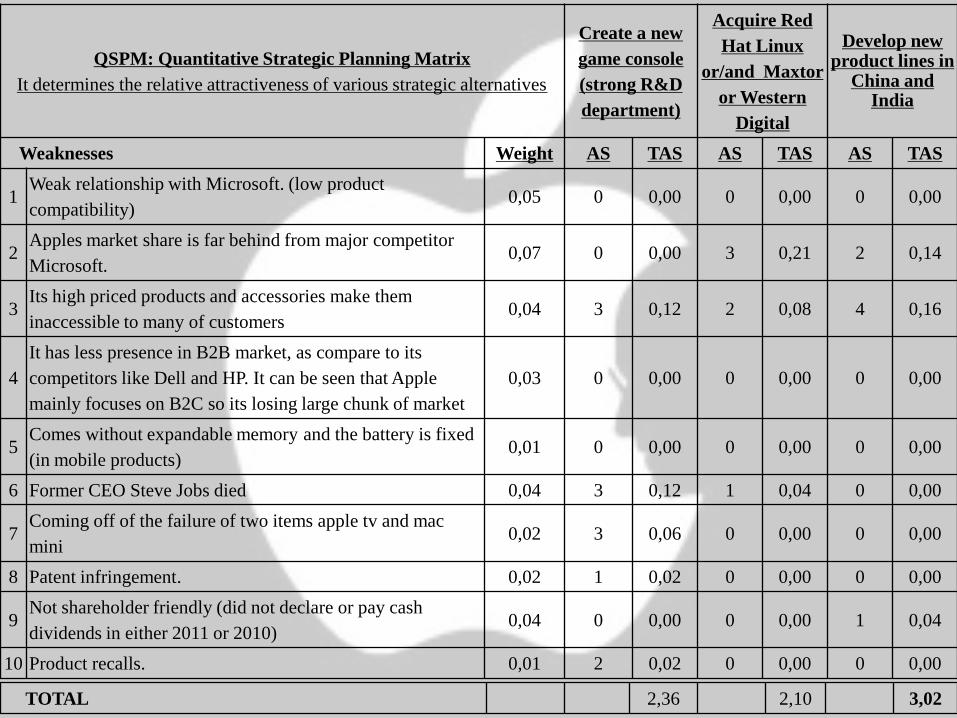
TOTAL 2,36 2,10 3,02
QSPM: Quantitative Strategic Planning Matrix
It determines the relative attractiveness of various strategic alternatives
Create a new
game console
(strong R&D
department)
Acquire Red
Hat Linux
or/and Maxtor
or Western
Digital
Develop new product lines in
China and India
Weaknesses Weight AS TAS AS TAS AS TAS
1Weak relationship with Microsoft. (low product
compatibility)0,05 0 0,00 0 0,00 0 0,00
2Apples market share is far behind from major competitor
Microsoft.0,07 0 0,00 3 0,21 2 0,14
3Its high priced products and accessories make them
inaccessible to many of customers0,04 3 0,12 2 0,08 4 0,16
4
It has less presence in B2B market, as compare to its
competitors like Dell and HP. It can be seen that Apple
mainly focuses on B2C so its losing large chunk of market
0,03 0 0,00 0 0,00 0 0,00
5Comes without expandable memory and the battery is fixed
(in mobile products)0,01 0 0,00 0 0,00 0 0,00
6 Former CEO Steve Jobs died 0,04 3 0,12 1 0,04 0 0,00
7Coming off of the failure of two items apple tv and mac
mini0,02 3 0,06 0 0,00 0 0,00
8 Patent infringement. 0,02 1 0,02 0 0,00 0 0,00
9Not shareholder friendly (did not declare or pay cash
dividends in either 2011 or 2010)0,04 0 0,00 0 0,00 1 0,04
10 Product recalls. 0,01 2 0,02 0 0,00 0 0,00
Develop new product lines in China and India
This strategy aims to handle the high cost structure of products, as well
as to expand the product lines, which is a major opportunity. By establishing
new product lines in China and India, Apple will implement its high
technological competencies, which combined with the low labor cost of
China and India, will manage to reduce the overpricing of its products and
will gain a competitive advantage among other companies.
Apple has to focus on the global market, and both China and India are
two of the most populated countries in the world and they are experiencing
lately, increased use of computers and computer technology products. The
economies of the said countries are rapidly improving with more disposable
income than ever before.
Currently, all of Asia, accounts for about 5% of Apple‘s total revenue;
however, with more advertising and focus on China and India, can be fully
exploited because the market has no prejudices yet. If tapped properly, these
two countries can provide significant revenues for Apple in the future. This
is the alternative strategy that should be followed by Apple among the other
two, due to the highest total attractive score it took, at the QSPM process.
Epilogue
Apple, is arguably the most successful company ever in many respects.
But there are major financial risks with being the premier ―first mover‖ in any
industry. Rival firms across the globe are getting better and better at quickly
duplicating successful Apple products and offering them at lower prices.
Success of Apples iPad, iPhone and Mac‘s new versions, helped Apple to
replace Microsoft as the world‘s most valuable technology company in 2010.
Apple thinks that there is yet room for improvement, to substitute the
already created wonders.
Innovation never stops.
The Technology of the Future
Coming Straight from the Past