Embed Size (px)
Citation preview
1
MAPPING EVOLUTIONARY ECONOMICS IN EUROPE
by Bart Verspagen & Claudia Werker
Ecis, Eindhoven University of [email protected], [email protected]
We are indebted to Dao Nguyen for valuable research assistance. We also acknowledgethe useful contributions of our students at the Tema MSc programma of EindhovenUniversity of Technology: Marcel Bogers, Loes Bonnemayer, Willem Bouman, Inge vanBaardwijk, Olga Huizing, Judith van Laarhoven, Joffry Maltha, Liesbeth Nix, Rene vanden Oetelaar, Anke Verhagen, and Bas de Vries. They prepared three reports on theinvisible college, and these were a valuable input in the analysis undertaken for thispaper.
1. Introduction
Evolutionary economics is a relatively new branch of the social science that is concernedwith scarcity. The term is now used by an increasing number of scholars, not all of whomshare a common understanding of what makes evolutionary economics different from‘normal economics’. The project described in this paper was aimed at mapping theintellectual interaction within the group of a particularly influential ‘type’ of evolutionaryeconomics, i.e., the research community aimed at analyzing the role of technologicalchange and innovation. This topic was not high on the agenda of most academiceconomists in the first, say, 80 years of the 20th century. The main exception to this trendof neglecting the role of technology in the economy was of course Joseph Schumpeter,the Austrian economist who viewed technology as the prime mover of economicdynamics. In his analysis, Schumpeter put much emphasis on ‘out-of-equilibriumdynamics’ rather than the description of the economy as a steady state. This, and otherelements of his work has been a reason for followers of Schumpeter’s work to regard himas an evolutionary economist. In the immediate postwar period, Schumpeter’s legacy waspicked up by a small number of economists, most notably Chris Freeman in Europe (UK)and Richard Nelson and Sydney Winter in the US.
It were the latter two scholars who introduced the term ‘evolutionary economics’ in theirwritings during the 1970s. The European work at the time was mostly concentrated at theScience Policy Research Unit (SPRU) of the University of Sussex, where Chris Freemanwas the first director. Economists and other social scientists working at SPRU remainedin close contact with their American colleagues Nelson and Winter, and this cross-Atlantic cooperation might be considered as the seed of what of the research communitythat we wish to study in this paper. With the publication of Nelson and Winter’s book‘An Evolutionary Theory of Economic Change’ in 1982, the term firmly settled in the
2
profession. SPRU managed to attract a wide international group of (PhD) scholars, suchas Giovanni Dosi, Luc Soete, Pari Patel, Keith Pavitt, Nick von Tunzelmann and RoyTurner who were rather influential in setting the evolutionary agenda for the rest of the20th century, also because these scholars established research centers in the evolutionarytradition all over Europe, such as the Maastricht Economic Research Institute onInnovation and Technology (MERIT), established by Luc Soete.
Evolutionary economics in the way these early scholars understood it, differs frommainstream economics in at least two important respects. In the first place, thebehavioural assumptions are different. Where mainstream economics assumes fullyrational behaviour, and builds its models on this, evolutionary economists argue that thestrong uncertainty connected to technological change makes full rationality a particularlybad assumption if one is interested in analyzing the economic impact of technology andinnovation. In practical terms, this implied that evolutionary economists do not havemuch trust in the equilibrium models that mainstream economists derive using the fullrationality assumption. Instead, they put much more emphasis on economic dynamics andout-of-equilibrium situations. Secondly, and related to the first issue, the ‘believe’ in theanalytic power of strict modeling approaches is much less than in mainstream economics.Thus, a more eclectic mode of analysis, in which there is a place for such diverse tools assimulation models, case studies, and biological metaphors is favoured in evolutionaryeconomics.
This rather eclectic approach favoured by most ‘evolutionary economists’ also impliesthat an exact definition of what it means to be an evolutionary economists is hard toprovide. As Giovanni Dosi put it:
“[T]here is not likely to be an exact sharing within the concerned community ofwhat such a programme ought to be ... A few close collaborators and I havesome ideas of what it is ... but one should only expect a less than perfect sharingeven by likeminded researchers”.
Some observers even assert that the fuzzy boundaries of evolutionary economics extendinto mainstream economics. Mainstream economists, evolutionary economists and other‘heterodox’ economists meet at conferences, publish in similar journals and discuss thesame issues. In a number of cases, similar methodologies are used between the differentgroups, and similar conclusions are reached. For example, Arnold Heertje (1983) argued:
"neo-Schumpeterians [i.e., the evolutionary tradition] have been productive intheir criticism of the neoclassical scheme on the basic of an evolutionaryapproach, but the questions they have raised have been addressed more or lesssuccessfully by many scholars, who have close links with the neoclassicaltradition (…) I would not be surprised to see the present Schumpeterian mood tobe part of mainstream economics before the end of this century" (p. 273-275).
The research project on ‘The Invisible College’ (a term that will be explained below) thatwas started at Ecis, Eindhoven University of Technology in the Netherlands in 2002, is
3
aimed at mapping the intellectual relations in this broad and diverse group of economistsworking in the field of the economics of innovation and technological change. The maintool of analysis is a survey that was done in the research community. The methodology ofthe survey will be described in Section 2.
The rest of this paper is aimed at analyzing the role of evolutionary economics in thebroad research community working on the economic analysis of innovation andtechnological change. Three main research questions will be asked. The first is to identifythe relative size of the evolutionary economics group in the larger research community,and to compare the structure of the evolutionary group to the broader group. Second, thequestion will be asked to what extent the notion of evolutionary economics diffused inEurope, and where the main research groups in this field are to be found. Thirdly, we willask the question how evolutionary economists agree or disagree about certain academicstandards, such as the importance of specific journals and research groups. The answer tothe latter question will be interpreted to provide some clues about the ‘identity’ ofevolutionary economics. Each one of these research questions will occupy a separatesection of the paper. A final section will summarize the argument and draw conclusions.
2. Methodology – the survey
Our method of analysis follows in the footsteps of Crane (1972). In her treatment of aresearch community as an ‘invisible college’ (a term earlier used by Robert Merton), sheviewed intellectual relations in the ‘college’ primarily as social relations betweenresearchers. The term invisible college is used to signal that the group of researchers thatis being studied works together closely. This cooperation depends not only on the strongrelations that exist between people actually working together in a single institute, but alsoon cooperation between people who are distant in geographical space. Crane’s interestwas in explaining the development of a new field of research, for which she argued that itcrucially depends on a number of pioneering scientists, and the circles of co-workers andstudents they create around them. Naturally, the structure of the invisible college changesover its lifetime, as the field evolves to a mode that Kuhn (1962) has dubbed ‘normalscience’.
Like Crane (1972), we set out a survey among scholars in the field of the economics ofinnovation and technological change and/or evolutionary economics. The survey wasaimed at mapping the intellectual relations between people active in the field, in a waythat has become popular in the field of social network analysis (e.g., Wasserman andFaust, 1994) and social capital (e.g., Lin, 1999). In particular, we interpret the invisiblecollege that we are analyzing as a social network in which both strong and weak ties(Granovetter, 1973) play a role. Following Crane (1972), strong ties (e.g., between PhDstudent and supervisor, or between co-authors) may be important for the formation ofintensive knowledge networks in which the main ideas of a new field are created. Weakties (e.g., inspiration through the written literature) may be more important for thediffusion of these ideas to a wider research community.
4
Our survey was set up specifically to identify weak and strong ties. Respondents wereasked to list people who had influenced them. Six categories of people were asked for:the respondent’s PhD supervisor, his/her PhD students, his/her co-workers (defined aspeople working in the same institution), his/her co-authors (outside the respondent’s maininstitution), his/her network contacts (defined as people who the respondent meetsregularly at conferences, workshops, etc.) and, finally, his/her sources of inspiration(important scholars whose work the respondent knows, but whom he/she has never met,an important category of this are scholars from the past who are no longer active).
Respondents were asked to list at most five people in each category, with the exception ofthe PhD supervisor, which could only be one name. Names could be based on the entirecareer of an individual, not only the state of affairs at the time of the survey. If more thanfive people qualified for a category, only the five most important persons (in terms of thequality of their contribution) were asked for. The categories were presented in the aboveorder, where our interpretation is that earlier categories imply stronger links. Ourinstructions said that if a person qualifies for one category, (s)he could no longer be filledin in a later category, even if (s)he was not listed because (s)he was not among the fivemost important people in the category. In this way, we wanted to force people to reporton a broad range of contacts in the continuum of strong links to weak links. In general,the respondents understood these instructions, and listed different people under differentcategories. However, there were also a number of respondents who did not follow theinstructions, and listed a single name in more than one category. We cleaned the databasefor this, and deleted all occurrences of people after the first time. Although this solves theimmediate inconsistencies, it does not solve for the fact that the people for whom wedeleted names did not have the opportunity to supply new names, and hence these peoplewill generally have less ‘weak links’ to other people in the database.
The survey was sent to all people who appeared in the reference list of a recent overviewpaper of the field (Dosi, Orsenigo and Sylos Labini, 2002). We asked for the emailaddress of the people listed, but indicated this was optional, and we still wanted to have aname when no email address was known or the respondent did not want to give it. Fornames that were reported without an email address, we did a search for the email addresson the Internet. Everybody mentioned in the responses was also sent an invitation to fillin the survey (this corresponds to the name generator mechanism in Lin, 1999). Thesurvey was kept running in this fashion, and the results reported in this paper correspondto the database at 3 March 2003. At this point, there were 2492 names in our database, ofwhich we had sent out invitations to fill in the survey to 1597 persons (we don’t have anemail address for the remaining persons). 580 responses were obtained (36% of theinvited people, 23% of the total).
The results reported in this paper are based on the database consisting only of the 580respondents, plus 118 additional persons. The majority of the 118 persons consist ofdeceased scholars who contributed to the area. A few (less than 10) of the 118 personsconcerns persons who indicated they did not want to participate in the survey. Byexcluding the people who did not (yet) respond to the survey, we miss an important partof the research community in the field. However, because these people did not respond,
5
they will, on average, have much less (compared to actual respondents) links to otherpeople in the database, simply because they could not list, but only could be listed. Thisis why we decided to exclude these people from the database. The consequence is thatour database does not give a complete mapping of the invisible college. However, withthe response rate of 36%/23%, we still have a good sample of the field, and there seemsto be no indication of a particular non-response bias. Thus we may consider a map of theinvisible college based on our database as a reasonable approximation of the actualresearch community.
At the beginning of the survey, we asked people to answer yes/no to the questions “Doyou consider yourself to be an evolutionary economist?”1 and “Do you consider 'theeconomics of innovation and technological change' to be a field to which you havecontributed or plan to contribute in the near future?”. If the answer to both questions wasNo, the respondent was instructed to submit the survey without further answering. Weconsider these respondents as ‘outsiders’ to the invisible college we are investigating,although they obviously did have an impact on the field. Thus, we define the boundariesof the college on the basis of this question. The ‘outsiders’ are included in the analysisbelow (unless otherwise stated), but they were not able to generate new names on the listof respondents (and thus they can only be listed, and not list other people).
3. The role of evolutionary economics in the respondents group
Table 1 reports on the answers to the two main introductory questions. Almost threequarters of the respondents (72.1%) reports to have an interest in the economics oftechnology and/or innovation. Since the survey was specifically aimed at this field, thishigh percentage is not surprising. One third of the respondents (33.8%) considerthemselves as evolutionary economists. About one quarter of the respondents (24.1) fallsin the ‘outsider’ category that we defined above.
Table 1. Interest in technology/innovation vs. evolutionary economicsInterested in technology/innovation
Evolutionary Missing No Yes TotalMissing 5 (0.9%) 9 (1.6%) 14 (2.4%)No 2 (0.3%) 140 (24.1%) 228 (39.3%) 370 (63.8%)Yes 15 (2.6%) 181 (31.2%) 196 (33.8%)Total 7 (1.2%) 155 (26.7%) 418 (72.1%) 580 (100%)
In the third column, we see that within the broad research community on the economicsof innovation and technology, the group of economists that considers themselves asevolutionary economists make up 43%. This is in fact a rather large minority. Althoughour sample of economists not particularly interested in technology (in the second column)is rather small (and biased), it is clear that evolutionary economists are well representedin the economics and ‘technology field’. On the basis of the history of the field (brieflyoutlined in the introduction above), this is not surprising. 1 We did not provide a definition of ‘evolutionary economics’, and left it to the respondent him/herself todefine the concept appropriately.
6
The lists of people in the response to the questionnaire were used to build a networkmatrix. This matrix has the individuals in our group of 698 (see above) persons in therows and columns. When a link between two people exists, i.e., they have mentionedeach other in the survey, we add a 1 in the matrix cell, otherwise there is a 0. Althoughthis matrix is in principle non-symmetric (person A may mention person B, but not viceversa), we make the matrix symmetric by taking the maximum of the cells (i,j) and (j,i).In other words, we assume that a network link between two people exists even if only oneof them reports the links.
In this way, we can build various matrices, depending on which type of links (on thescale strong to weak ties) we take into account. In this paper, we will only work withcumulative links, as in Table 2. In the last column of this table, we have results for anetwork based on only links between PhD supervisor and PhD student. The second-lastcolumn includes all links in the previous (last) column, plus links between co-workers(colleagues in the same institution). The third-last column is based on a networkincluding all links in the previous columns, plus links between co-authors (outside therespondent’s own institution), etc., until in the first column we have a network based onall types of links between respondents.
Table 2. Size of the largest connected component at various network ‘layers’All relations Excl. “Inspiration” Excl. “Network” Excl. “Co-authors” Excl. Co-workersComplete database (n=698)
673 604 518 322 63(100.0) (89.7) (77.0) (47.8) (9.4)
Only declared evolutionary scholars (n=196)179 166 144 109 28
(100.0) (92.7) (80.4) (60.9) (15.6)Declared evolutionary scholars as a percentage of total network
27 27 28 34 44Between brackets is the size of the component as a percentage of the size of the component in the firstcolumn. The last line indicates the size of the largest component in the evolutionary network as apercentage of that in the total network.
Table 2 reports a rough measure for the connectedness of the network. It starts from theconcept of a network component, which is defined as a subset of the network in whichevery network member ‘can be reached’ from every other network member by successivelinks between people. To see how this works, imagine a network respondent was asked totransmit a red piece of paper to all the people (s)he listed in our survey, plus the peoplewho listed this respondent. The receivers of the piece of paper would be asked to do thesame. The ‘largest’ component in Table 2 measures the number of people who wouldhave received the red piece of paper after it has diffused completely.
In case of the complete database (top part of the table), we use all people in the group of698. In the case of ‘only declared evolutionary scholars’, we delete from the networkeverybody who did not answer ‘yes’ to the question ‘Do you consider yourself to be anevolutionary economist’. When we move left-to-right in the table, network links in a
7
specific category of ties (weak or strong) are deleted. Naturally, this makes it harder to‘reach’ other people in the network, and hence the size of the largest componentdecreases. In fact, what happens is that the network breaks up in a number of smallercomponents. We report only the size of the largest of these. This largest component is inall cases significantly larger than the next-largest component, even in the rightmostcolumn.
For the complete database, the largest drop in the number of respondents still in thelargest component happens when we delete co-authors (outside the own institution) links(a drop from 77.0% to 47.8%) and when we delete co-workers links (47.8% to 9.4%).The size of the largest component at these levels is still rather large: of the 673 people inthe largest component based on all links, about half are linked to each other, albeit oftenindirectly, through a co-worker relation. This shows that both strong and weak ties playan important role in holding together the invisible college.
For the subgroup of evolutionary scholars, what is most notable is that strong ties arerelatively more important than weak ties, as compared to the network as a whole. At thelevel of PhD supervisor/student relations, 15% of the largest component based on all tiesis still held together, which is almost twice as much as for the total network. At the levelof co-workers, the difference is still striking: 60.9% of the evolutionary group is heldtogether by relations of this type, vs. 47.8% for the network as whole. We may thusconclude that compared to the rest of the invisible college we are analyzing, theevolutionary subgroup is a (large) minority of which the members have invested heavilyin strong links between them.
4. The network of evolutionary economics
The 698 individuals in the database together report 312 different institutions as theiraffiliation. In determining which units to choose as an institution, some arbitraryjudgment had to be made. The procedures used to standardize the affiliations aredescribed in the Appendix. We used social network analysis to determine the centers ofactivity of evolutionary economics in the invisible college. The networks that were usedfor this were constructed by aggregating links between individuals to links between theinstitutions they are affiliated to. The resulting networks are again binary (links exists ornot) and symmetric.
We concentrate in this paper on the subset of individuals who answer “Yes” to thequestion “Do you consider yourself to be an evolutionary economist?”. We take intoaccount all links reported by these individuals, i.e., we also include links to people whodid not answer “Yes” to this question. In other words, the ‘originator’ of the link isknown to be evolutionary, but the ‘target’ of the link does not necessarily have to beevolutionary. Furthermore, we aggregate the various types of links (weak-strong) intotwo main categories: all links and all links excluding “inspiration” and “networkcontacts” (the two last layers). We interpret the network based on the smallest category oflinks as the “strong ties network” and the total network as the “strong and weak ties”network.
8
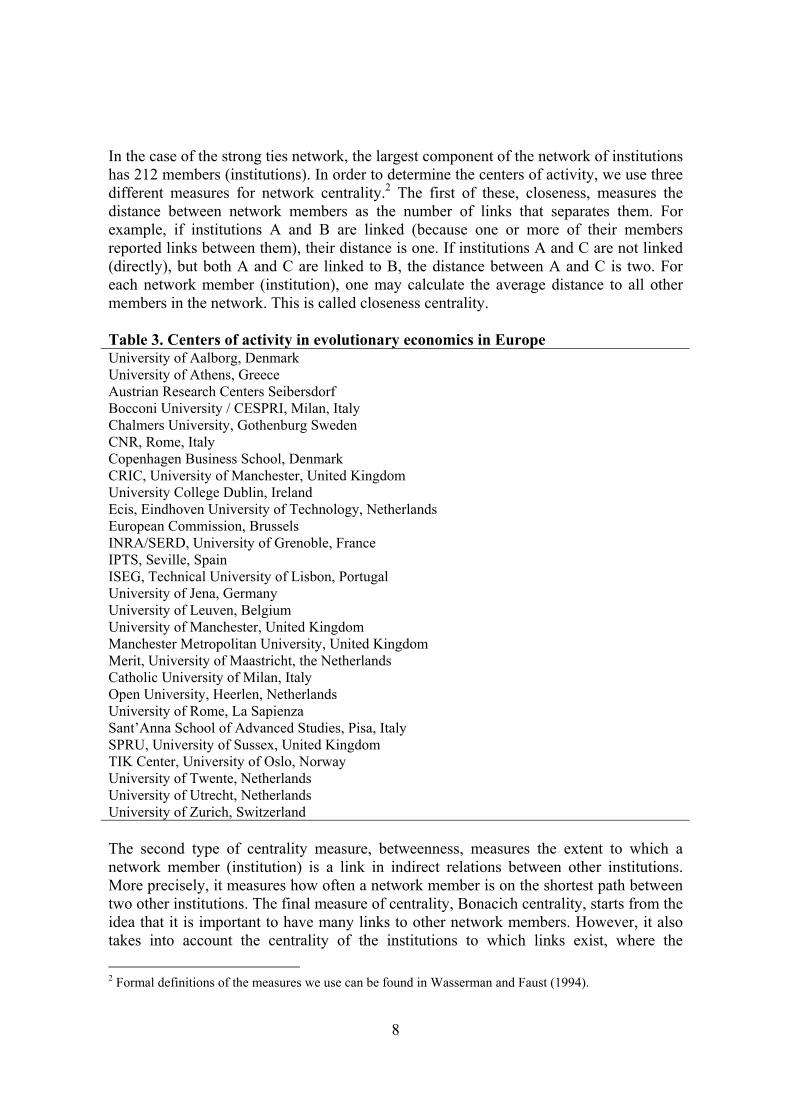
In the case of the strong ties network, the largest component of the network of institutionshas 212 members (institutions). In order to determine the centers of activity, we use threedifferent measures for network centrality.2 The first of these, closeness, measures thedistance between network members as the number of links that separates them. Forexample, if institutions A and B are linked (because one or more of their membersreported links between them), their distance is one. If institutions A and C are not linked(directly), but both A and C are linked to B, the distance between A and C is two. Foreach network member (institution), one may calculate the average distance to all othermembers in the network. This is called closeness centrality.
Table 3. Centers of activity in evolutionary economics in EuropeUniversity of Aalborg, DenmarkUniversity of Athens, GreeceAustrian Research Centers SeibersdorfBocconi University / CESPRI, Milan, ItalyChalmers University, Gothenburg SwedenCNR, Rome, ItalyCopenhagen Business School, DenmarkCRIC, University of Manchester, United KingdomUniversity College Dublin, IrelandEcis, Eindhoven University of Technology, NetherlandsEuropean Commission, BrusselsINRA/SERD, University of Grenoble, FranceIPTS, Seville, SpainISEG, Technical University of Lisbon, PortugalUniversity of Jena, GermanyUniversity of Leuven, BelgiumUniversity of Manchester, United KingdomManchester Metropolitan University, United KingdomMerit, University of Maastricht, the NetherlandsCatholic University of Milan, ItalyOpen University, Heerlen, NetherlandsUniversity of Rome, La SapienzaSant’Anna School of Advanced Studies, Pisa, ItalySPRU, University of Sussex, United KingdomTIK Center, University of Oslo, NorwayUniversity of Twente, NetherlandsUniversity of Utrecht, NetherlandsUniversity of Zurich, Switzerland
The second type of centrality measure, betweenness, measures the extent to which anetwork member (institution) is a link in indirect relations between other institutions.More precisely, it measures how often a network member is on the shortest path betweentwo other institutions. The final measure of centrality, Bonacich centrality, starts from theidea that it is important to have many links to other network members. However, it alsotakes into account the centrality of the institutions to which links exist, where the 2 Formal definitions of the measures we use can be found in Wasserman and Faust (1994).
9
hypothesis is that it is more important to have links to other central institutions. Thisleads to an eigenvalue problem on the network matrix, which is why this measure is alsoknown as eigenvalue centrality.
We calculate the centrality score of each institution on the three centrality measures, andthen rank the institutions for each of the measures. The average rank obtained for eachinstitution is then used to make an overall ranking. Table 3 reports the top-20 Europeaninstitutions derived in this way for the strong ties network, plus the first ranked institutionfor countries that do not have an institution in the top-20. The institutes are rankedalphabetically.3
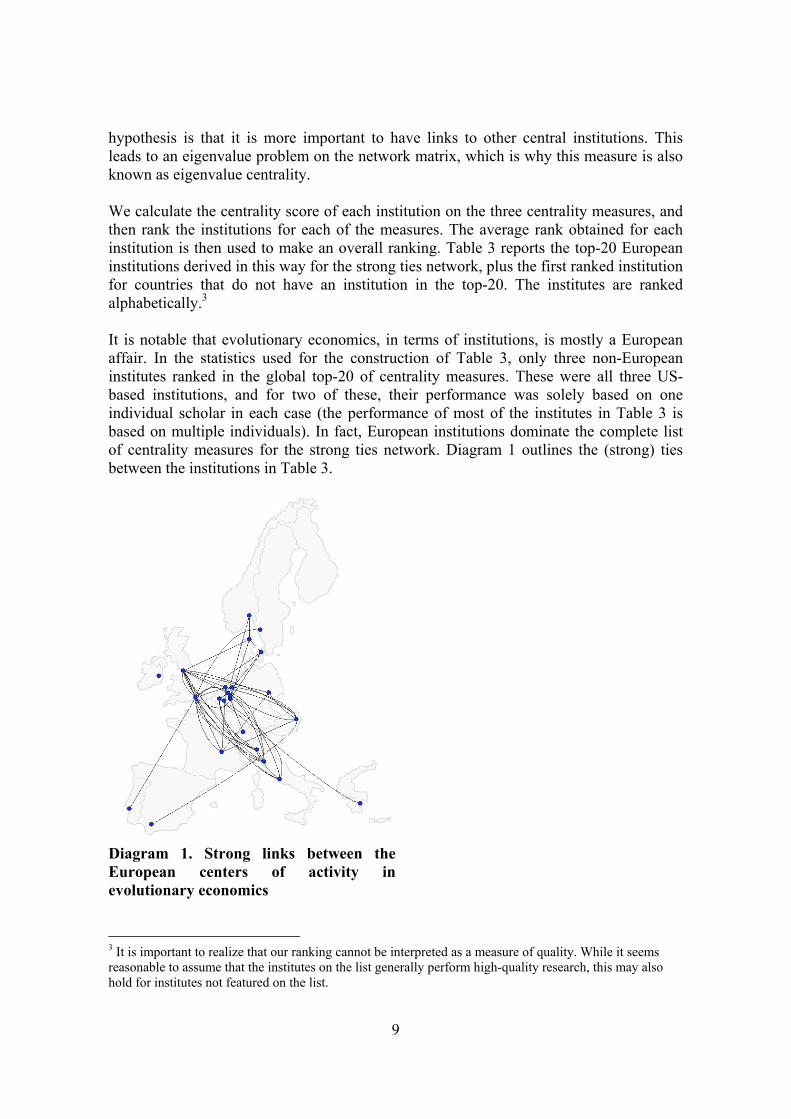
It is notable that evolutionary economics, in terms of institutions, is mostly a Europeanaffair. In the statistics used for the construction of Table 3, only three non-Europeaninstitutes ranked in the global top-20 of centrality measures. These were all three US-based institutions, and for two of these, their performance was solely based on oneindividual scholar in each case (the performance of most of the institutes in Table 3 isbased on multiple individuals). In fact, European institutions dominate the complete listof centrality measures for the strong ties network. Diagram 1 outlines the (strong) tiesbetween the institutions in Table 3.
Diagram 1. Strong links between theEuropean centers of activity inevolutionary economics
3 It is important to realize that our ranking cannot be interpreted as a measure of quality. While it seemsreasonable to assume that the institutes on the list generally perform high-quality research, this may alsohold for institutes not featured on the list.
10
However, also within Europe there is considerably concentration in certain countries.Specifically, Italy and the Netherlands (both 5 institutions), the United Kingdom (4institutions) and Denmark (2 institutions) are strongly represented. These countries seemindeed to be the ones in which evolutionary economics is strongest in Europe. Diagram 1outlines the strong links that exist between the institutions. This visual impressionconfirms the dominance of the axis Italy-Netherlands-United Kingdom as the main focusof interaction.
The selection of centers of activity in Table 3 and Diagram 1 is based on relationsbetween respondents to the survey. The survey database also allows for a differentselection of centers of activities, based on the following question: “In case you regularly(on average at least once every two years) visit other institutes (in your own country orabroad) supporting the research areas 'the economics of innovation and technologicalchange' and /or 'evolutionary economics', please list the names of the institutes(universities, research centres, etc,) and countries in which they are based (mostimportant first).”
It is quite possible that a selection of institutions based on the answers to this questiondiffers from the selection in Table 3 and Diagram 1. One possible source of differencerelates to the organization of conferences, workshops etc. If such an event is organized ata specific institution, this institution could be listed as an answer to the above question.At the same time, however, one could meet people from different places at thisconference, and these people could be listed as contacts in the survey questions that wereused in the construction of Table 3 and Diagram 1. We therefore also analyze the answersto the above question.
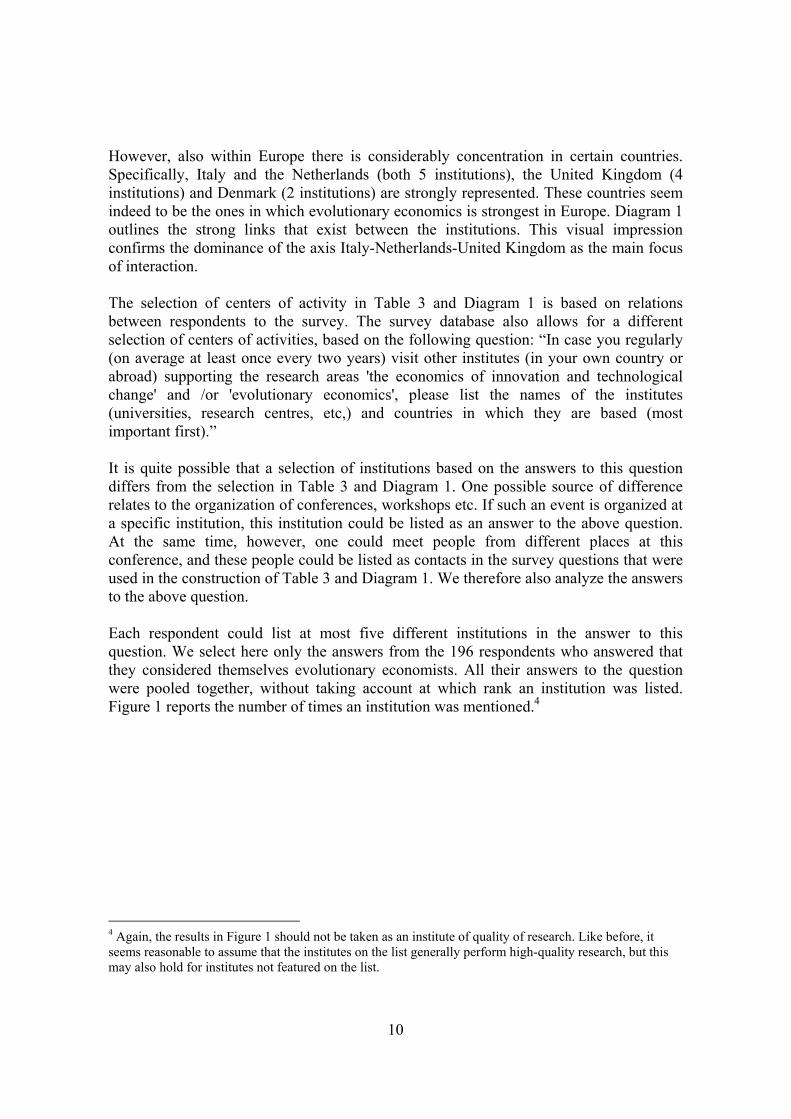
Each respondent could list at most five different institutions in the answer to thisquestion. We select here only the answers from the 196 respondents who answered thatthey considered themselves evolutionary economists. All their answers to the questionwere pooled together, without taking account at which rank an institution was listed.Figure 1 reports the number of times an institution was mentioned.4
4 Again, the results in Figure 1 should not be taken as an institute of quality of research. Like before, itseems reasonable to assume that the institutes on the list generally perform high-quality research, but thismay also hold for institutes not featured on the list.
11
0
5
10
15
20
25
30
35
40
45
SPRUMeri
t
MPI, Jen
aCRIC
St'Ann
a
Aalborg
CESPRI
DRUIDBETA
Chalmers
Fhg IS
IZEW
Ecis
PREST
Manch
ester
Reading CBS
Stanford TIK
CNR Rom
e
Figure 1. Regularly visited institutions (number of times an institution appears as ananswer by evolutionary scholars)
Many of the institutes listed in Figure 1 also featured in Table 3. European institutesdominate again. However, there are also a number of institutes in Figure 1 not present inTable 3. Interestingly, this mostly concerns a number of German institutes: the MaxPlanck Institute in Jena, the Fraunhofer Institute ISI in Karlsruhe, and the ZEW inMannheim. These are all non-university institutes (although they have close links withnearby universities), and they are indeed all known to regularly organize well-knownconferences and workshops. By these activities, they have clearly established a strongreputation. The other, non-German, institutes not on the list in Table 3 are Beta(Strasbourg, again well-known for organizing workshops and conferences in the field),PREST and the University of Reading.
Summarizing, it emerges clearly from the database that in terms of institutions, Europe isthe leading world region in terms of evolutionary economics. The European research areacontains the leading institutions in the world in this field, as measured by differentapproaches. Which approach is used (one based on network relations between scholars,or one based on the answers to the question which institutions are often visited byevolutionary economists) does not seem to matter very much for the overall picture. Amajor exception to this conclusion are a number of mostly German institutes, which areoften visited, but do not emerge so clearly as centers of activity from the network basedapproach.
12
5. The identity of evolutionary economics
Is the evolutionary economics community a homogenous research group? Based on aninformal impression of the field, the answer to this question is not straightforward.Evolutionary economics entails a broad range of research approaches and methodologies.It certainly does not (yet) have a standard toolbox that characterizes, for example,mainstream economics. In the final part of our analysis, we use the results from thesurvey to try to answer the above question.
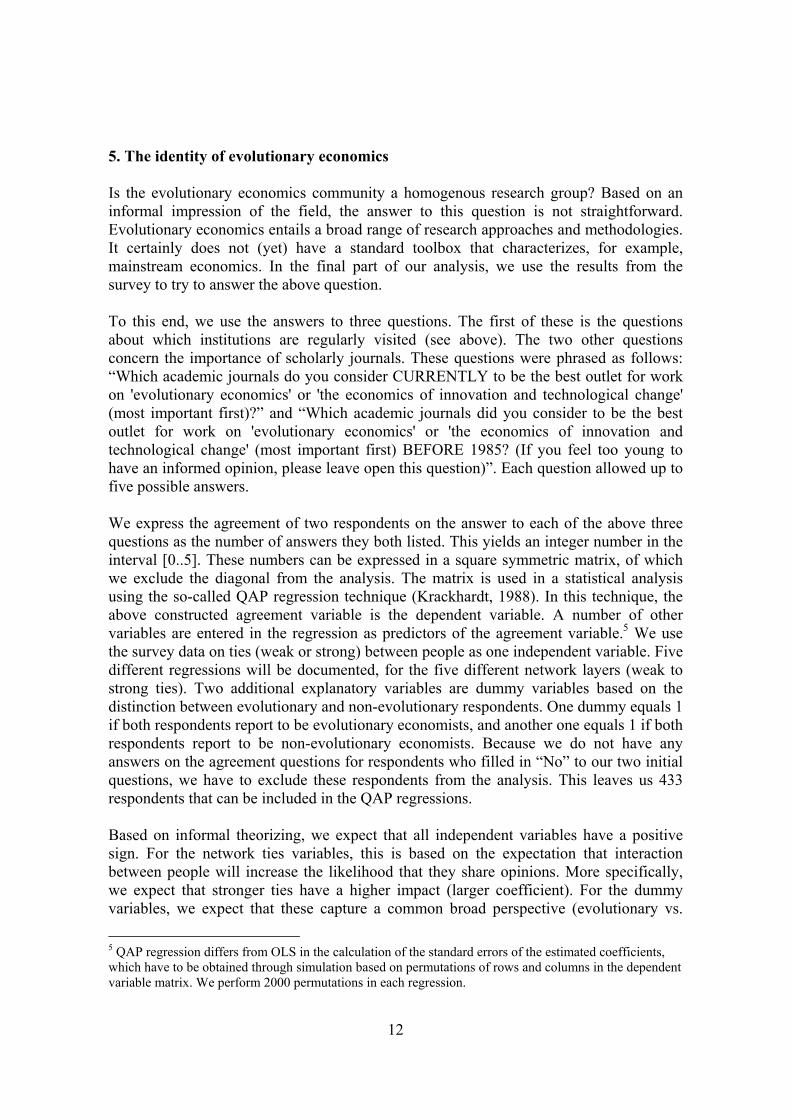
To this end, we use the answers to three questions. The first of these is the questionsabout which institutions are regularly visited (see above). The two other questionsconcern the importance of scholarly journals. These questions were phrased as follows:“Which academic journals do you consider CURRENTLY to be the best outlet for workon 'evolutionary economics' or 'the economics of innovation and technological change'(most important first)?” and “Which academic journals did you consider to be the bestoutlet for work on 'evolutionary economics' or 'the economics of innovation andtechnological change' (most important first) BEFORE 1985? (If you feel too young tohave an informed opinion, please leave open this question)”. Each question allowed up tofive possible answers.
We express the agreement of two respondents on the answer to each of the above threequestions as the number of answers they both listed. This yields an integer number in theinterval [0..5]. These numbers can be expressed in a square symmetric matrix, of whichwe exclude the diagonal from the analysis. The matrix is used in a statistical analysisusing the so-called QAP regression technique (Krackhardt, 1988). In this technique, theabove constructed agreement variable is the dependent variable. A number of othervariables are entered in the regression as predictors of the agreement variable.5 We usethe survey data on ties (weak or strong) between people as one independent variable. Fivedifferent regressions will be documented, for the five different network layers (weak tostrong ties). Two additional explanatory variables are dummy variables based on thedistinction between evolutionary and non-evolutionary respondents. One dummy equals 1if both respondents report to be evolutionary economists, and another one equals 1 if bothrespondents report to be non-evolutionary economists. Because we do not have anyanswers on the agreement questions for respondents who filled in “No” to our two initialquestions, we have to exclude these respondents from the analysis. This leaves us 433respondents that can be included in the QAP regressions.
Based on informal theorizing, we expect that all independent variables have a positivesign. For the network ties variables, this is based on the expectation that interactionbetween people will increase the likelihood that they share opinions. More specifically,we expect that stronger ties have a higher impact (larger coefficient). For the dummyvariables, we expect that these capture a common broad perspective (evolutionary vs.
5 QAP regression differs from OLS in the calculation of the standard errors of the estimated coefficients,which have to be obtained through simulation based on permutations of rows and columns in the dependentvariable matrix. We perform 2000 permutations in each regression.
13
non-evolutionary) on economics, which is also expected to increase the likelihood ofagreement.
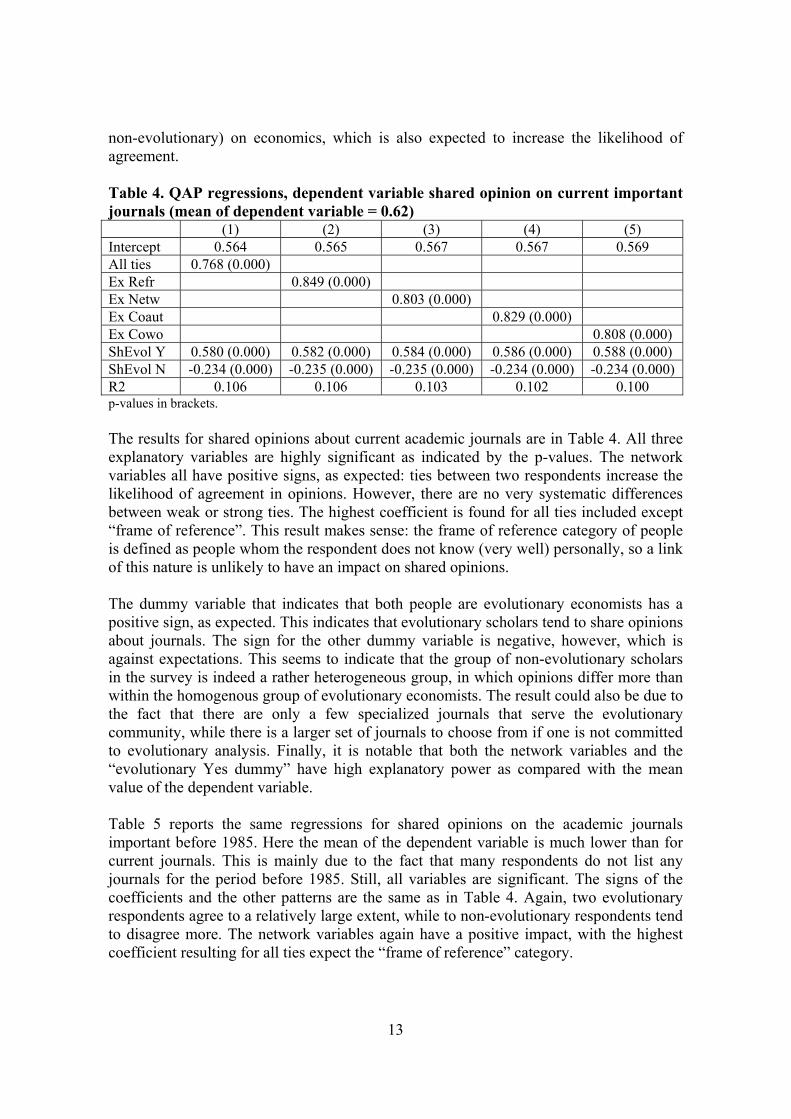
Table 4. QAP regressions, dependent variable shared opinion on current importantjournals (mean of dependent variable = 0.62)
(1) (2) (3) (4) (5)Intercept 0.564 0.565 0.567 0.567 0.569All ties 0.768 (0.000)Ex Refr 0.849 (0.000)Ex Netw 0.803 (0.000)Ex Coaut 0.829 (0.000)Ex Cowo 0.808 (0.000)ShEvol Y 0.580 (0.000) 0.582 (0.000) 0.584 (0.000) 0.586 (0.000) 0.588 (0.000)ShEvol N -0.234 (0.000) -0.235 (0.000) -0.235 (0.000) -0.234 (0.000) -0.234 (0.000)R2 0.106 0.106 0.103 0.102 0.100p-values in brackets.
The results for shared opinions about current academic journals are in Table 4. All threeexplanatory variables are highly significant as indicated by the p-values. The networkvariables all have positive signs, as expected: ties between two respondents increase thelikelihood of agreement in opinions. However, there are no very systematic differencesbetween weak or strong ties. The highest coefficient is found for all ties included except“frame of reference”. This result makes sense: the frame of reference category of peopleis defined as people whom the respondent does not know (very well) personally, so a linkof this nature is unlikely to have an impact on shared opinions.
The dummy variable that indicates that both people are evolutionary economists has apositive sign, as expected. This indicates that evolutionary scholars tend to share opinionsabout journals. The sign for the other dummy variable is negative, however, which isagainst expectations. This seems to indicate that the group of non-evolutionary scholarsin the survey is indeed a rather heterogeneous group, in which opinions differ more thanwithin the homogenous group of evolutionary economists. The result could also be due tothe fact that there are only a few specialized journals that serve the evolutionarycommunity, while there is a larger set of journals to choose from if one is not committedto evolutionary analysis. Finally, it is notable that both the network variables and the“evolutionary Yes dummy” have high explanatory power as compared with the meanvalue of the dependent variable.
Table 5 reports the same regressions for shared opinions on the academic journalsimportant before 1985. Here the mean of the dependent variable is much lower than forcurrent journals. This is mainly due to the fact that many respondents do not list anyjournals for the period before 1985. Still, all variables are significant. The signs of thecoefficients and the other patterns are the same as in Table 4. Again, two evolutionaryrespondents agree to a relatively large extent, while to non-evolutionary respondents tendto disagree more. The network variables again have a positive impact, with the highestcoefficient resulting for all ties expect the “frame of reference” category.

14
Table 5. QAP regressions, dependent variable shared opinion on important journalsbefore 1985 (mean of dependent variable = 0.02)
(1) (2) (3) (4) (5)Intercept 0.020 0.020 0.020 0.020 0.021All ties 0.081 (0.000)Ex Refr 0.088 (0.000)Ex Netw 0.068 (0.000)Ex Coaut 0.071 (0.000)Ex Cowo 0.061 (0.000)ShEvol Y 0.029 (0.000) 0.030 (0.001) 0.030 (0.000) 0.030 (0.000) 0.030 (0.000)ShEvol N -0.011 (0.005) -0.011 (0.006) -0.011 (0.006) -0.011 (0.004) -0.011 (0.004)R2 0.010 0.010 0.009 0.008 0.008p-values in brackets.
Table 6. QAP regressions, dependent variable shared opinion on places often visited(mean of dependent variable = 0.05)
(1) (2) (3) (4) (5)Intercept 0.039 0.039 0.039 0.040 0.040All ties 0.233 (0.000)Ex Refr 0.254 (0.000)Ex Netw 0.242 (0.000)Ex Coaut 0.228 (0.000)Ex Cowo 0.199 (0.000)ShEvol Y 0.064 (0.000) 0.065 (0.000) 0.066 (0.000) 0.066 (0.000) 0.067 (0.000)ShEvol N -0.020 (0.001) -0.020 (0.000) -0.021 (0.000) -0.020 (0.002) -0.020 (0.001)R2 0.027 0.026 0.023 0.021 0.018p-values in brackets.Table 6 reports the results for the question about which places are often visited. Theresults are in line with the questions on academic journals. Network variables are allpositive and significant, with the highest value again for the category of links thatexcludes the weakest links. Evolutionary economists tend to agree more, non-evolutionary economists less.
Concluding, the results indicate that the subset of evolutionary scholars in our database isa relatively homogenous group in terms of their opinions about important academicjournals, or which places are important to visit often. This indicates that there is indeedsuch a thing as an ‘identity’ of the evolutionary community within the invisible college.
6. Conclusions
In this paper, we have reported on a survey undertaken among economists interested inthe economics of innovation and technological change and/or evolutionary economics.The main aim of the survey was to outline the intellectual relations that exist betweenscholars in the field. We have used the data to describe the (European) researchcommunity of evolutionary economists from an analytical perspective. Severalconclusions emerge.
15
First, evolutionary economists emerge as a community in which the individuals haveinvested relatively strongly in strong ties between them. As compared to the non-evolutionary part of our respondents database, evolutionary economists span a relativelywide circle based on co-worker relationships.
Second, we were able to identify a number of European-wide centers of activity inevolutionary economics, based on the data on strong ties in the survey. These centerswere most often found in Italy, the United Kingdom, the Netherlands and Denmark,which emerge as the most active countries in evolutionary economics. When centers ofactivity are based on what respondents consider important places to visit, the resultschange somewhat as compared to the network-based measures. The most strikingdifference is the emergence of a number of German institutes in the list of importantplaces to visit.
Finally, we investigated what determines shared opinions on important academic journalsand important places to visit. The findings indicate that evolutionary economists have ahigher level of agreement on these matters than non-evolutionary economists. In addition,whether or not two respondents reported links with each other seems to matter for sharedopinions (having links leads to a higher agreement in opinions). Although these resultsare in accordance with our expectations, they have important implications. For example,in research assessment exercises used in various countries, the ‘quality’ of journals is stillbased on mainstream opinions. For evolutionary economists, this implies that they areassessed on the basis of journals in which they themselves may have little confidence.
References
Crane, D (1972) Invisible Colleges. Diffusion of knowledge in scientific communities.Chicago & London: The University of Chicago Press
Dosi, G, Orsenigo, L., and M. Sylos Labini, 2002, Technology and the Economy, LEMWorking Paper Series 2002/18.
Granovetter, M.S. (1973). ‘The strength of weak ties.’ American Journal of Sociology,78, pp. 1360-1380.
Heertje, A. “Neo-Schumpeterians and Economic Theory.” In: Evolutionary Approachesto Economic Theory, edited by Magnusson, 265-276. Dordrecht: Kluwer, 1993.
Krackhardt, D.(1988) .Predicting with networks: Nonparametric multiple regressionanalysis of dyadic data, Social Networks, 10, 359-381.
Thomas Kuhn (1962): The Structure of Scientific Revolutions. Chicago and London: TheUniversity of Chicago Press
Lin, N. 1999, Building a Network Theory of Social Capital, Connections, 22 (1): 28-51Wasserman, S & K. Faust (1994). Social network analysis: methods and applications,
Cambridge: Cambridge University Press

16
Appendix. Survey questionnaire (Word version, the large majority of results wasobtained through an identical online web survey)
1. YOUR BACKGROUND
We would like to know a few details about your academic background.
1a. Which country do you consider to be your native country from a SCIENTIFIC point of view (e.g., ifyou are Italian by nationality, but pursued your entire scientific career in the UK, fill in "UnitedKingdom" here)?
Country:
1b. What is your current (main) affiliation?
Affiliation:
Country:
1c. In case you hold a PhD Degree, at which academic institution did you get it, who was your (main)supervisor, what is his/her current email address, and when did you obtain the degree (year)? Incase you hold more than one PhD degree, please list the one most relevant to 'the economics ofinnovation and technological change' or 'evolutionary economics'.
Institute:
Supervisor:
Email:
Year:
1d. In case you are currently prepearing a PhD Dissertation, at which academic institution do youplan to receive the PhD degree, who is your (main) supervisor, and what is his/her current emailaddress?
Institute:
Supervisor:
Email:
Year:
1e. Do you consider yourself to be an evolutionary economist?
Answer: Yes/ No (Please delete the option that does not apply)
1f. Do you consider 'the economics of innovation and technological change' to be a field to whichyou have contributed or plan to contribute in the near future?
Answer: Yes/ No (Please delete the option that does not apply)
If you answered 'No' to both of the previous questions, you may now save the file and submit yourresults without answering the remaining questions. It is important for our research that you submityour results! You may submit your results by sending the saved file as an attachment [email protected]. Thank you for your cooperation!
2. YOUR NETWORK

17
The following questions will ask for names of people. We would like to give you a few generaldirections for answering these questions:
• Our questions refer to EXCLUSIVE groups of people. This means, for example, that a person whowould qualify as a possible answer to the first question below, is not a valid answer for any of thefollowing questions. This even holds if you decided not to fill in the name of this person in the firstquestion, because the person did not rank among the five most important people in the category.Also, never fill in your PhD supervisor as listed in Question 1.
• Only consider those people relevant to YOUR work on "the economics of innovation andtechnological change" and/or "evolutionary economics", although the people you list maythemselves not specialize in these areas.
• Always use the quality of the input of a person as a measure rather than the quantity.
• List most important people in a category highest, least important people last.
• A few directions for formatting the names. Please do not use any academic titles, so write "J.Lennon" rather than "Prof. J. Lennon" or "dr. J. Lennon". Also, please write names in the orderFIRST NAME - LAST NAME, e.g., "M. Jagger", rather than "Jagger, M.". Finally, please give us asmuch detail as you reasonably can, i.e., provide full first names (if you know them) rather thaninitials (e.g., "Elvis Presley" rather than E. Presley"), and also provide middle initials if you knowthem (e.g., "Elvis A. Presley" rather than "Elvis Presley").
• The questions will ask for current email addresses of the people you list. If you do not have theseavailable, please leave this field empty, but complete the rest of the answer.
• If there are less than five people who qualify the description given in the question, simply leavethe appropriate number of rows empty.
2a. YOUR PhD STUDENTS
In case you ever supervised PhD students, we would like to know who you consider to be the mostinfluential of these. Please list up to five PhD students from those who have completed theirdissertation.
name Email address
1
2
3
4
5

18
2b. YOUR CO-WORKERS
We would like to know who you consider to be the most important co-workers with whom you haveworked over your entire career. We define a co-worker as a person employed in the sameorganization as yourself, and who is/was a source of inspriration in the form of formal and informaldiscussions, exchange of ideas, commenting on papers, etc.
name Email address
1
2
3
4
5
2c. YOUR CO-AUTHORS
We would like to know who you consider to be the most important co-authors (working outside yourown organization at the time of the joint work) whom you have worked with over your entire career.Please include also work outside scholarly journals, such as reports for contract research, etc., inyour definition of a co-author.
name Email address
1
2
3
4
5
2d. YOUR NETWORK
We would like to know who you consider to be the most important people in your network. Defineyour network as people you are in regular contact with, by face-to-face contact, meeting atconferences, paper correspondence, email, etc.
name Email address
1
2
3
4
5
2e. YOUR FRAME OF REFERENCE
We would like to know who you consider to be the most important people in your frame of reference.We define the frame of reference as those people who have inspired your own work, but do not fit inthe above categories. A good example of this could be a classic author who lived before your time

19
(e.g., Adam Smith), but this category can also include living people, for example those authors youreference in your own work, but you have never been in contact with.
name Email address
1
2
3
4
5

20
2f. INSTITUTIONAL SETTING
In case you regularly (on average at least once every two years) visit other institutes (in your owncountry or abroad) supporting the research areas 'the economics of innovation and technologicalchange' and /or 'evolutionary economics', please list the names of the institutes (universities,research centres, etc,) and countries in which they are based (most important first).
Institute country
1
2
3
4
5
3. RESEARCH INFRASTRUCTURE
Please indicate the level of support for research in the area 'the economics of innovation andtechnological change' and /or 'evolutionary economics' you have experienced from the followinginstitutions (1=no support, 5=strong support). Indicate your answer by putting a ‘x’ under theappropriate level of support.
1. Your own institution (university, research institute, etc.)
1 2 3 4 5
2. 2. National and/or regional research funding agencies in the country you work in
1 2 3 4 5
3. 3. European research funding agencies (please answer this only if you are employed inEurope)
1 2 3 4 5
4. JOURNALS
Which academic journals do you consider CURRENTLY to be the best outlet for work on'evolutionary economics' or 'the economics of innovation and technological change' (most importantfirst)?
Journal
1
2
3
4

21
5

22
Which academic journals did you consider to be the best outlet for work on 'evolutionary economics'or 'the economics of innovation and technological change' (most important first) BEFORE 1985? (Ifyou feel too young to have an informed opinion, please leave open this question)
Journal
1
2
3
4
5
This is the end of the survey. Please save the file and submit your results by sending the saved fileas an attachment to [email protected]. Thank you for your cooperation!
23
Appendix. Rules to standardize affiliations
Some general cases emerge. The first of these is when a research institute is part of alarger institution, such as a university. In this case, the classification used was based onwhat the majority of respondents filled in. This resulted in a number of research institutesbeing listed separately, while a number of other institutes were merged into the “motherinstitutions” (university). The most important research institutes that remained separatelyare the following ones:
• Merit, Maastricht University: the majority of respondents listed “Merit”, possiblyin combination with “Maastricht University” or “Maastricht”. Almost never was“Maastricht University” mentioned without “Merit”. The few cases (<5) in whichthis happened were classified as “Merit”.
• CESPRI, Bocconi University. Most respondents mentioned “Bocconi University”,without CESPRI, a minority mentioned also “CESPRI”. We noticed, however,that a large number of the “Bocconi” respondents were indeed associated withCESPRI, and hence we label the entire category as CESPRI.
• DRUID. This Danish institute is a “join venture” between two universities:Aalborg University and the Copenhagen Business School. Many variants werefound in this case. Most often people mentioned either one of the two “motherinstitutes”. Some times this was done in combination with the word “DRUID”.Also, sometimes just “DRUID” was mentioned. We decided to treat the twomother institutes and the joint venture as three separate units. Whenever one ofthe two mother institutes was mentioned, this was used, if only DRUID wasmentioned, we used this.
• The Manchester institutes: CRIC, PREST, UMIST and their mother institute theUniversity of Manchester, and the Manchester Metropolitan University. Theseoccurred all five, in about equal numbers. This is why we treated them allseparately.