Embed Size (px)
Citation preview
Watson & Associates Economists Ltd. H:\AJAX\DC 2012-2013\dc study.docx
APPENDIX A
ANTICIPATED DEVELOPMENT IN AJAX
2013-2031

A-1
Watson & Associates Economists Ltd. H:\AJAX\DC 2012-2013\dc study.docx
APPENDIX A - ANTICIPATED DEVELOPMENT IN AJAX
2013-2031
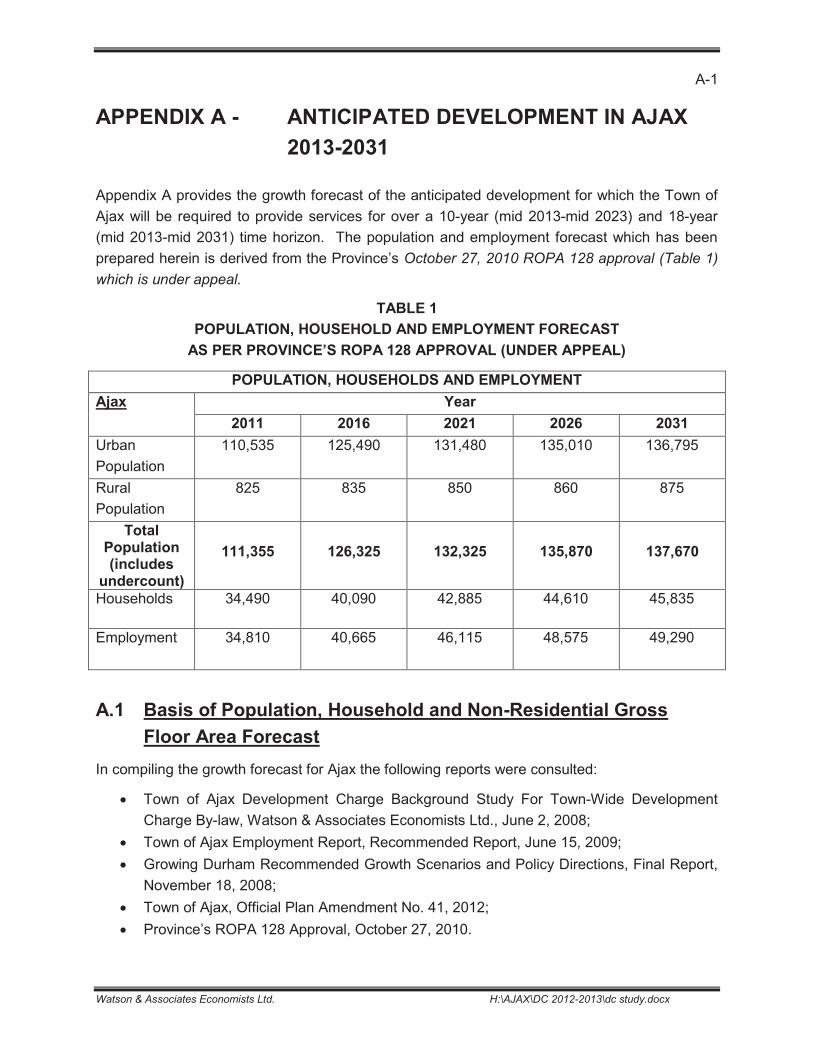
Appendix A provides the growth forecast of the anticipated development for which the Town of
Ajax will be required to provide services for over a 10-year (mid 2013-mid 2023) and 18-year
(mid 2013-mid 2031) time horizon. The population and employment forecast which has been
prepared herein is derived from the Province’s October 27, 2010 ROPA 128 approval (Table 1)
which is under appeal.
TABLE 1
POPULATION, HOUSEHOLD AND EMPLOYMENT FORECAST
AS PER PROVINCE’S ROPA 128 APPROVAL (UNDER APPEAL)
POPULATION, HOUSEHOLDS AND EMPLOYMENT
Ajax Year
2011 2016 2021 2026 2031
Urban
Population
110,535 125,490 131,480 135,010 136,795
Rural
Population
825 835 850 860 875
TotalPopulation(includesundercount)
111,355 126,325 132,325 135,870 137,670
Households 34,490 40,090 42,885 44,610 45,835
Employment 34,810 40,665 46,115 48,575 49,290
A.1 Basis of Population, Household and Non-Residential Gross
Floor Area Forecast
In compiling the growth forecast for Ajax the following reports were consulted:
Town of Ajax Development Charge Background Study For Town-Wide Development
Charge By-law, Watson & Associates Economists Ltd., June 2, 2008;
Town of Ajax Employment Report, Recommended Report, June 15, 2009;
Growing Durham Recommended Growth Scenarios and Policy Directions, Final Report,
November 18, 2008;
Town of Ajax, Official Plan Amendment No. 41, 2012;
Province’s ROPA 128 Approval, October 27, 2010.
A-2
Watson & Associates Economists Ltd. H:\AJAX\DC 2012-2013\dc study.docx
In addition to reviewing the above-mentioned documents, the following key indicators were also
considered in generating the population, household and non-residential forecast;
1996, 2001, 2006 and available 2011 Census data;1
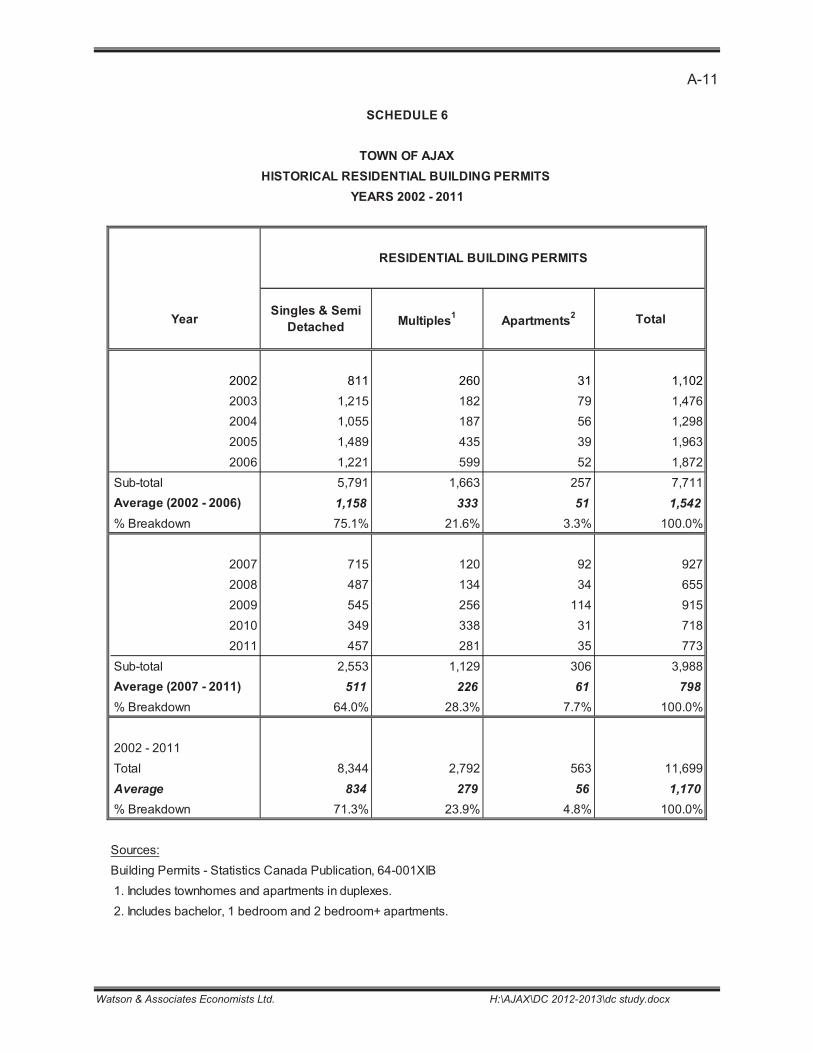
historical residential and non-residential building permit activity;
proposed residential units in the development approvals process by dwelling type and
location; and
1996, 2001 and 2006 Census employment data.
A.2 Summary of Growth Forecast
The discussion provided herein, summarizes the anticipated growth for Ajax and describes the
basis for the forecast. The result of the growth forecast analysis is summarized in Schedule 1.
The population is anticipated to reach 128,983 by mid 2023 and 131,697 by mid 2031 (which is
134,860 and 137,700, respectively, including the undercount estimated at 4.55%). This results
in an increase of 14,859 persons over the 10-year period and 17,573 over the 18-year period.
1. Unit Mix (Schedules 1 and 2)
The unit mix for Ajax was derived from historical development activity, units in the
development approvals process (as per Schedule 5), as well as discussions with
staff, regarding anticipated development trends for the Town.
Based on the above indicators, the long-term growth forecast is premised upon a
unit mix of 24% low density (single family and semi-detached), 16% medium
density (multiples except apartments) and 60% high density (apartments). This
allocation varies slightly from the allocation from “Growing Durham”, in that the
current inventory of housing identifies more low density dwellings. The increase
in low density dwellings is offset by a decrease in medium density dwellings, and
does not significantly change the long-term weighted density of approximately 60
units per net hectare.
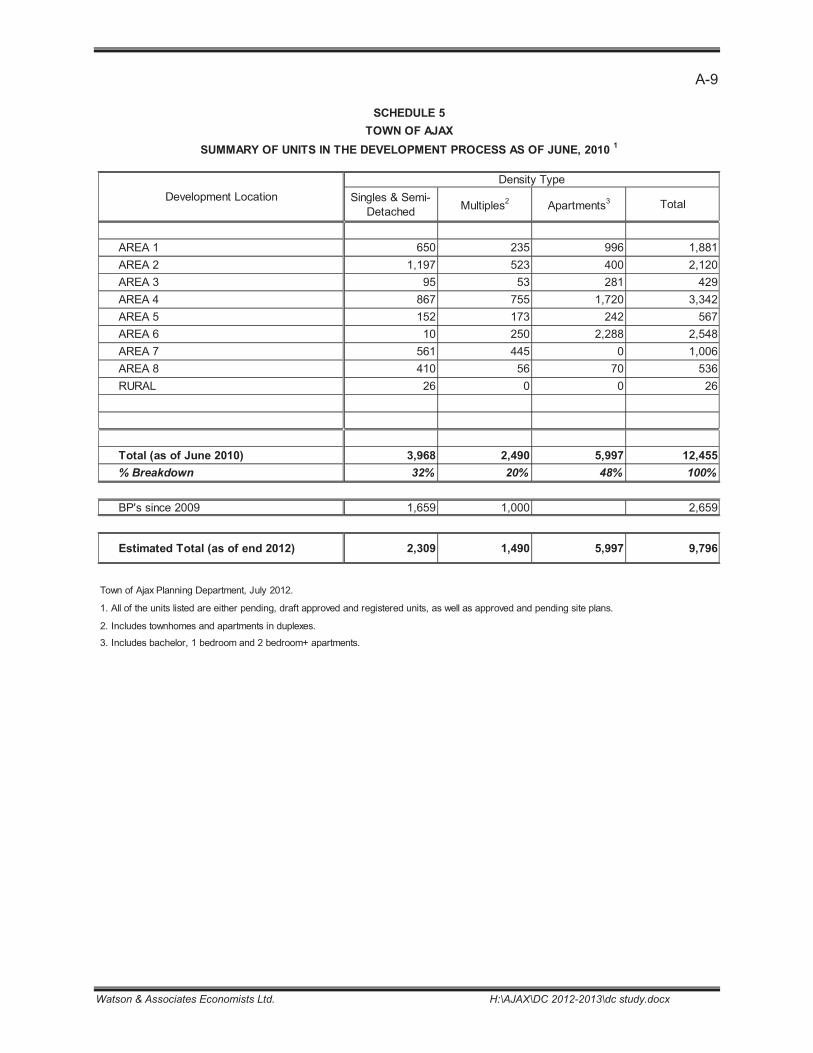
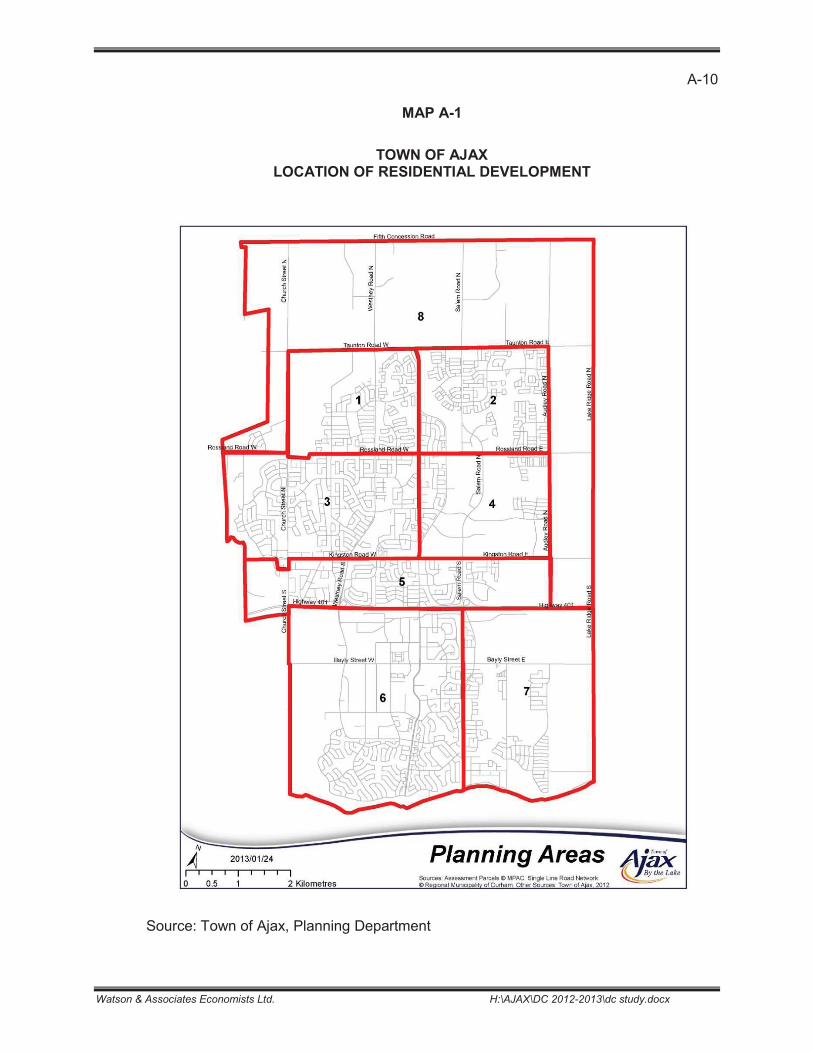
2. Geographic Location (Schedule 5 and Map A-1)
Appendix A, Schedule 5 summarizes the supply of future housing within Ajax,
which are either pending, draft approved and registered units, as well as
approved and pending site plans. In terms of the geographic location (Map A-1)
of the residential inventory for new development, 59% of the supply is located
within Areas 1, 2, and 4, 20% is located in the Southwest (Area 6), and the
remaining 21% is located within Areas 3, 5, 7, 8, and Rural Ajax.
3. Planning Period
Short and longer-term time horizons are required for the DC process. The DCA
limits the planning horizon for certain services, such as parks, recreation and
1The 2011 Census regarding total population and total number of occupied private dwellings by structuraltype of dwelling has been incorporated into the 2013 DC growth forecast.
A-3
Watson & Associates Economists Ltd. H:\AJAX\DC 2012-2013\dc study.docx
libraries, to a 10-year planning horizon. Roads and related services and
stormwater management are able to utilize a longer planning period.
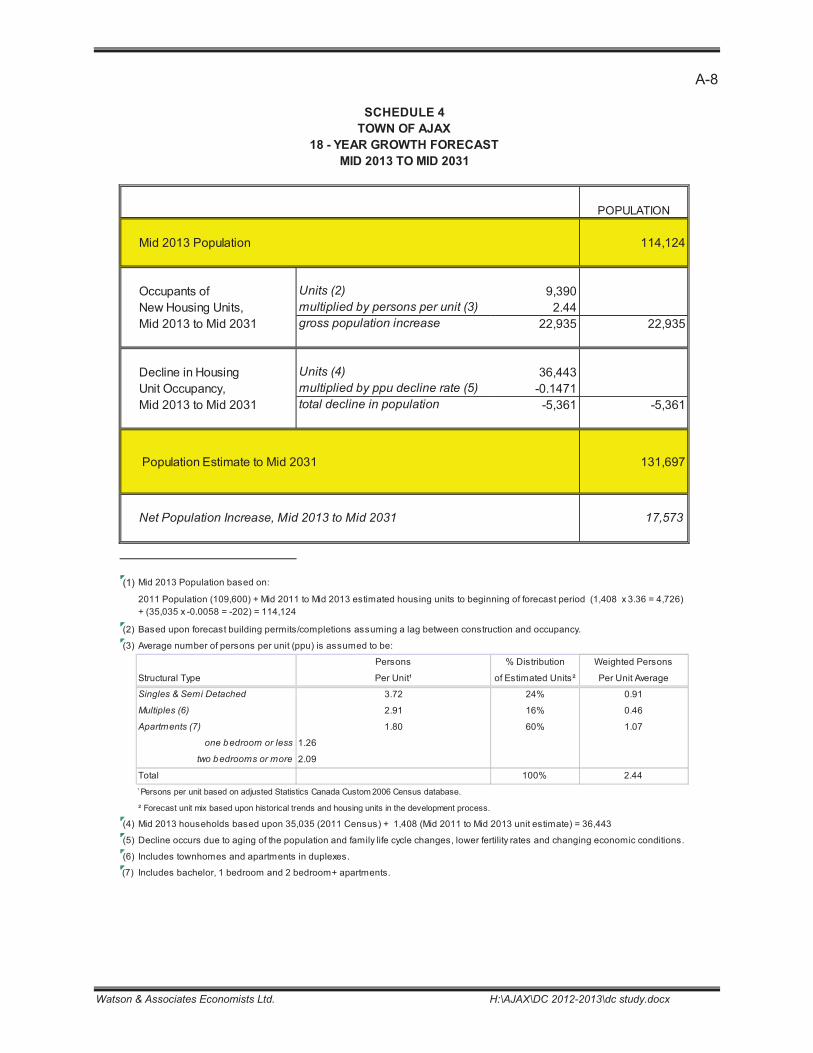
4. Population in New Units (Schedules 2, 3 and 4)
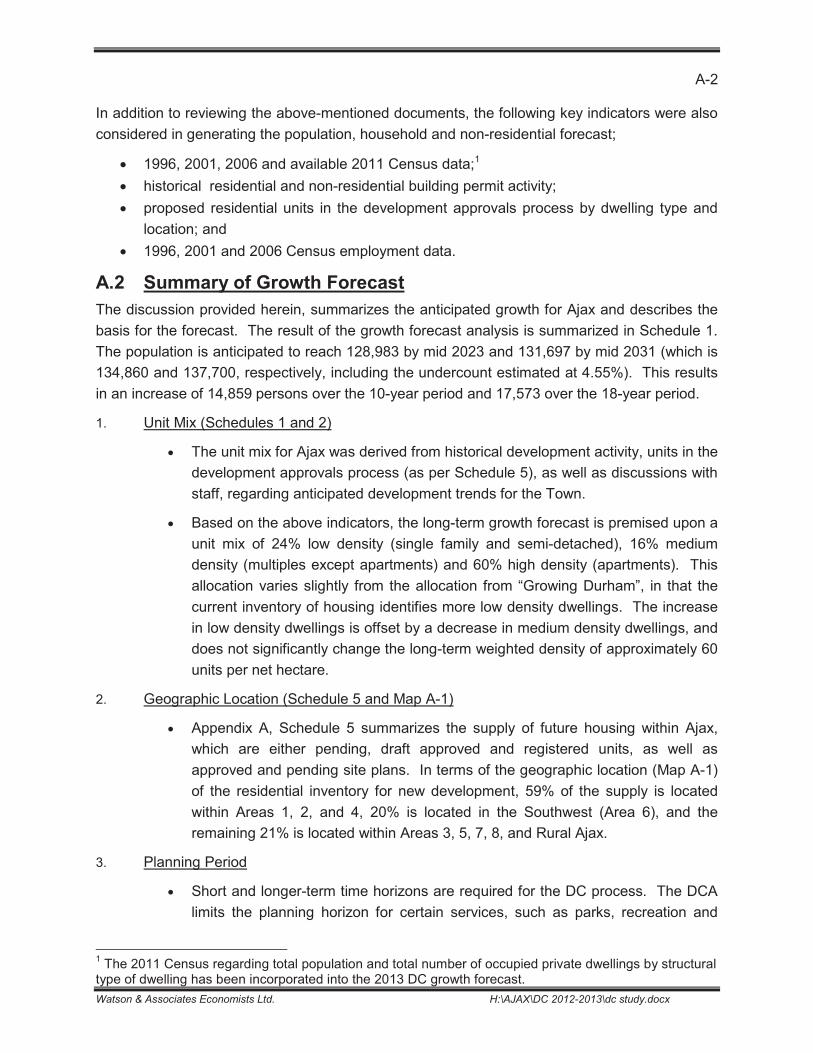
The number of housing units to be constructed in Ajax during the short, medium and long term
period is presented on Schedule 1 (average of approximately 521 units per annum over the 18-
year time horizon).1 As well, this schedule graphically illustrates the forecast unit development
for the 18-year forecast period in comparison to building activity over the past 10 years.
Population in new units is derived from Schedules 2, 3 and 4, which incorporate
historical development activity, anticipated units (see unit mix discussion), and 1996,
2001 and 2006 Census data.
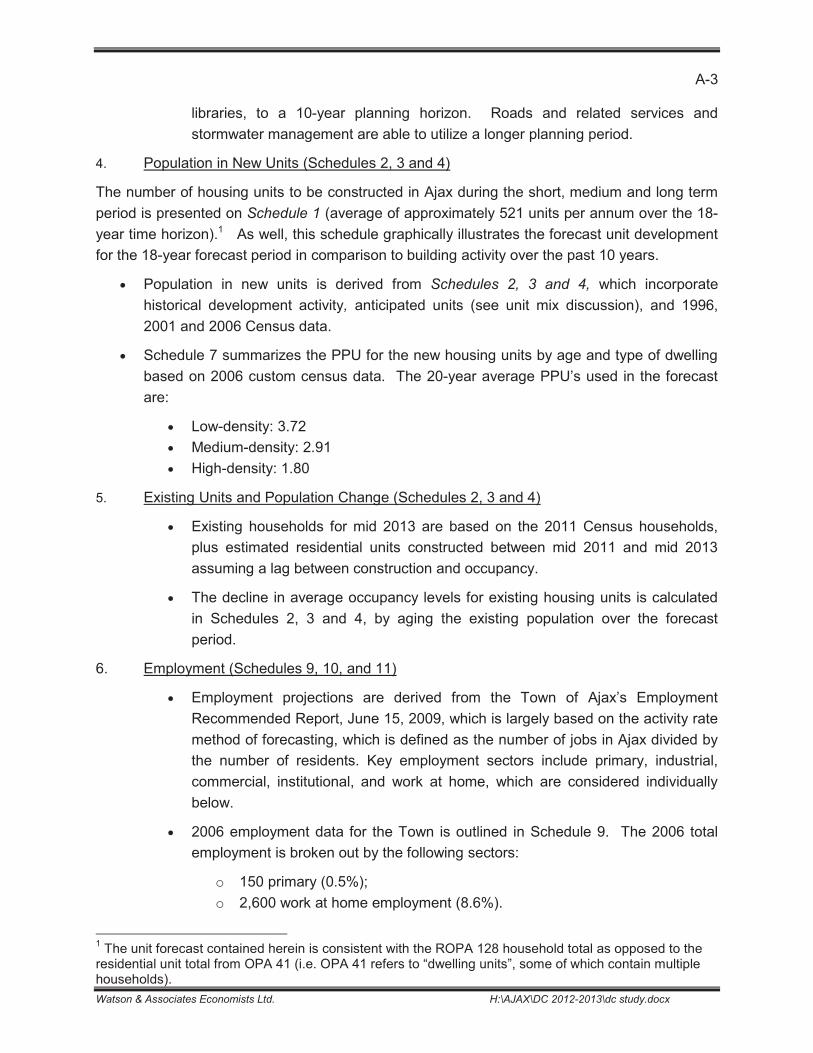
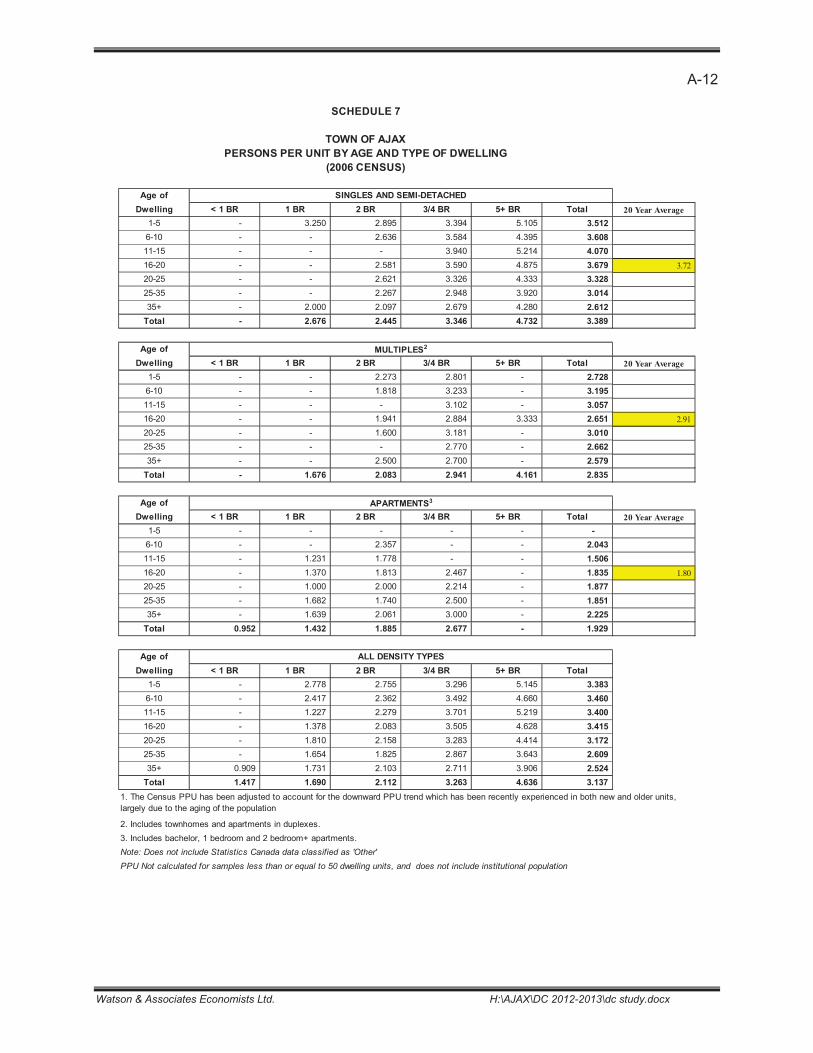
Schedule 7 summarizes the PPU for the new housing units by age and type of dwelling
based on 2006 custom census data. The 20-year average PPU’s used in the forecast
are:
Low-density: 3.72
Medium-density: 2.91
High-density: 1.80
5. Existing Units and Population Change (Schedules 2, 3 and 4)
Existing households for mid 2013 are based on the 2011 Census households,
plus estimated residential units constructed between mid 2011 and mid 2013
assuming a lag between construction and occupancy.
The decline in average occupancy levels for existing housing units is calculated
in Schedules 2, 3 and 4, by aging the existing population over the forecast
period.
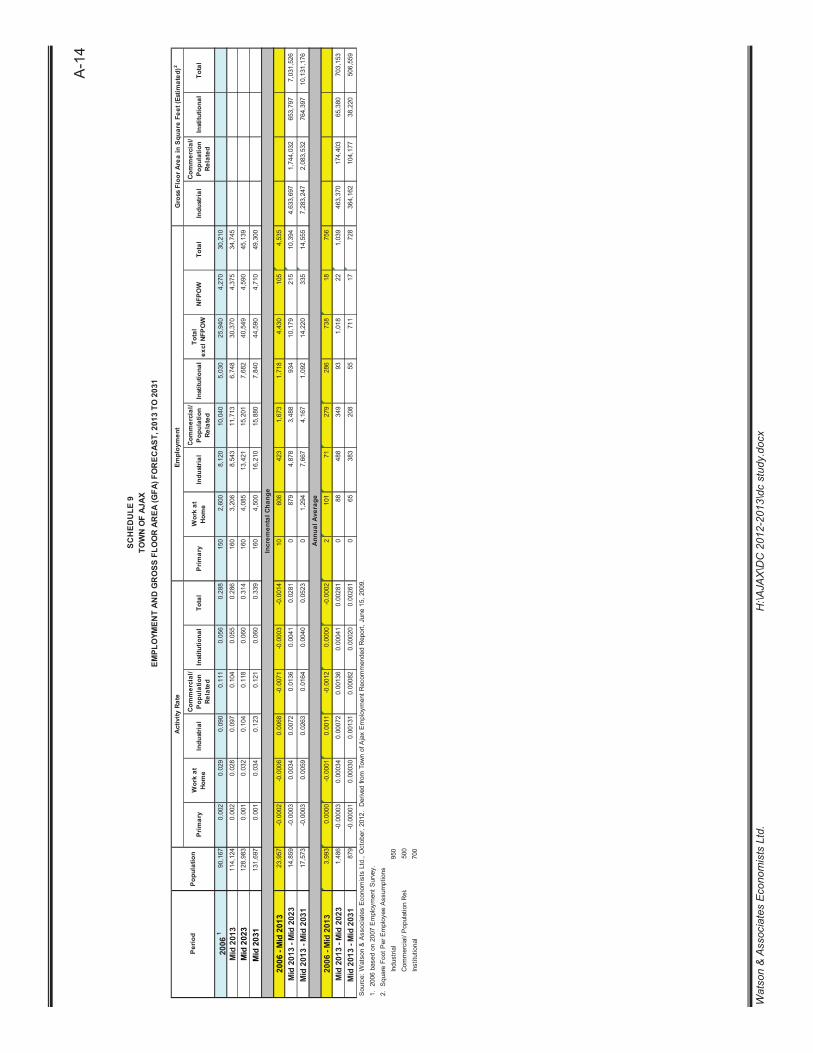
6. Employment (Schedules 9, 10, and 11)
Employment projections are derived from the Town of Ajax’s Employment
Recommended Report, June 15, 2009, which is largely based on the activity rate
method of forecasting, which is defined as the number of jobs in Ajax divided by
the number of residents. Key employment sectors include primary, industrial,
commercial, institutional, and work at home, which are considered individually
below.
2006 employment data for the Town is outlined in Schedule 9. The 2006 total
employment is broken out by the following sectors:
o 150 primary (0.5%);
o 2,600 work at home employment (8.6%).
1The unit forecast contained herein is consistent with the ROPA 128 household total as opposed to theresidential unit total from OPA 41 (i.e. OPA 41 refers to “dwelling units”, some of which contain multiplehouseholds).
A-4
Watson & Associates Economists Ltd. H:\AJAX\DC 2012-2013\dc study.docx
o 8,120 industrial (26.9%);
o 10,040 commercial/population-related (33.2%);
o 5,030 institutional (16.7%);
o 4,270 no fixed place of work1 (14.1%).
This provides a total employment (including NFPOW and work at home) figure of
30,210 based on the Town’s 2007 Employment Survey. Additional details
regarding historical employment trends by sub-sector based on the 2006 Census
are summarized in Schedule 11.
Total employment for the Town is anticipated to reach approximately 45,139 by
mid 2023 and 49,300 by mid 2031. The employment increase for the 10-year
period is 10,394 and 14,555 for the 18-year period.
7. Non-Residential Sq. Ft. Estimates (Gross Floor Area (GFA), Schedule 9)
Square footage estimates were calculated in Schedule 9 based on the following
employee density assumptions;
O 950 sq. ft. per employee for industrial;
O 500 sq. ft. per employee for commercial/population-related; and
O 700 sq. ft. per employee for institutional.
The incremental Gross Floor Area (GFA) increase for the Town is approximately
7,031,526 sq. ft. over the 10-year projection period and 10,131,176 over the 18-
year projection period.
The 18-year forecast incremental GFA by sector is as follows:
o industrial 71.9%;
o commercial/population-related 20.6%; and
o institutional 7.5%.
1Statistics Canada defines “No Fixed Place of Work” (NFPOW) employees as “persons who do not gofrom home to the same work place location at the beginning of each shift. Such persons include buildingand landscape contractors, travelling salespersons, independent truck drivers, etc.
A-5
Watson & Associates Economists Ltd. H:\AJAX\DC 2012-2013\dc study.docx
Singles & Semi-
Detached
Multiple
Dwellings2 Apartments
3 OtherTotal
Households
Person Per
Unit (PPU)
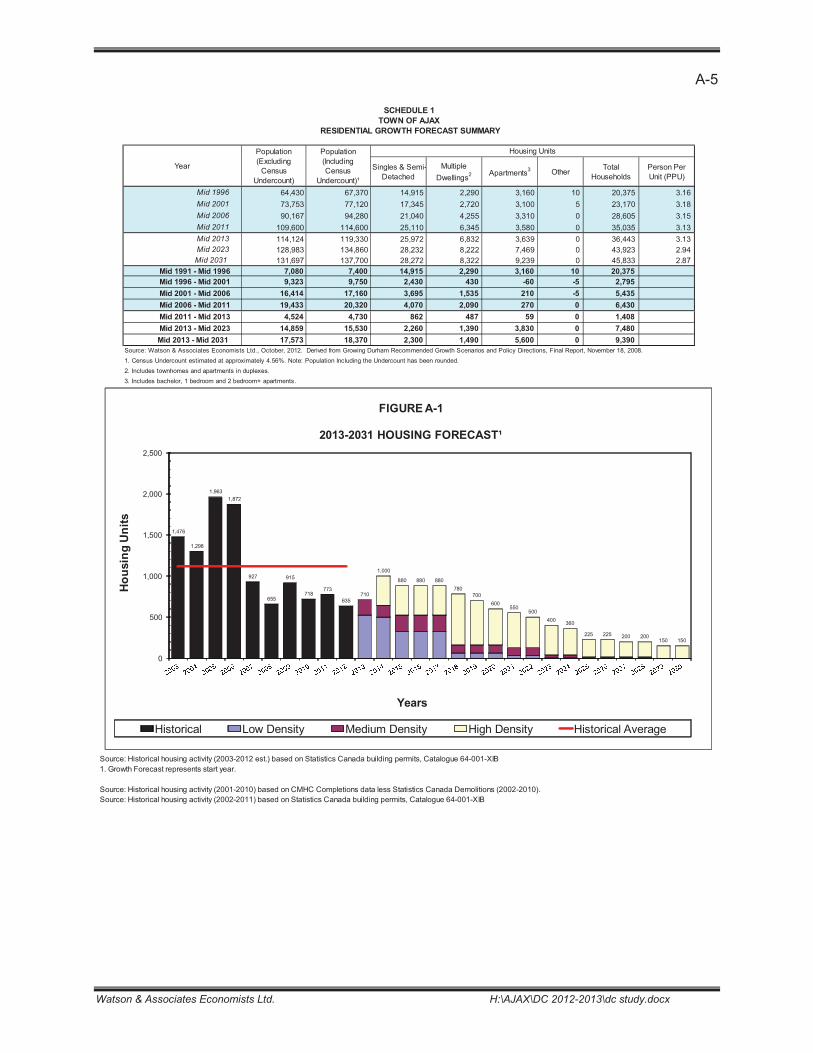
Mid 1996 64,430 67,370 14,915 2,290 3,160 10 20,375 3.16
Mid 2001 73,753 77,120 17,345 2,720 3,100 5 23,170 3.18
Mid 2006 90,167 94,280 21,040 4,255 3,310 0 28,605 3.15
Mid 2011 109,600 114,600 25,110 6,345 3,580 0 35,035 3.13
Mid 2013 114,124 119,330 25,972 6,832 3,639 0 36,443 3.13
Mid 2023 128,983 134,860 28,232 8,222 7,469 0 43,923 2.94
Mid 2031 131,697 137,700 28,272 8,322 9,239 0 45,833 2.87
Mid 1991 - Mid 1996 7,080 7,400 14,915 2,290 3,160 10 20,375
Mid 1996 - Mid 2001 9,323 9,750 2,430 430 -60 -5 2,795
Mid 2001 - Mid 2006 16,414 17,160 3,695 1,535 210 -5 5,435
Mid 2006 - Mid 2011 19,433 20,320 4,070 2,090 270 0 6,430
Mid 2011 - Mid 2013 4,524 4,730 862 487 59 0 1,408
Mid 2013 - Mid 2023 14,859 15,530 2,260 1,390 3,830 0 7,480
Mid 2013 - Mid 2031 17,573 18,370 2,300 1,490 5,600 0 9,390
Source: Watson & Associates Economists Ltd., October, 2012. Derived from Growing Durham Recommended Growth Scenarios and Policy Directions, Final Report, November 18, 2008.
1. Census Undercount estimated at approximately 4.56%. Note: Population Including the Undercount has been rounded.
2. Includes townhomes and apartments in duplexes.
3. Includes bachelor, 1 bedroom and 2 bedroom+ apartments.
Source: Historical housing activity (2003-2012 est.) based on Statistics Canada building permits, Catalogue 64-001-XIB
1. Growth Forecast represents start year.
Source: Historical housing activity (2001-2010) based on CMHC Completions data less Statistics Canada Demolitions (2002-2010).
Source: Historical housing activity (2002-2011) based on Statistics Canada building permits, Catalogue 64-001-XIB
SCHEDULE 1
TOWN OF AJAX
RESIDENTIAL GROWTH FORECAST SUMMARY
Population
(Excluding
Census
Undercount)
Population
(Including
Census
Undercount)¹
Year
Housing Units
1,476
1,298
1,963
1,872
927
655
915
718773
635710
1,000
880 880 880
780
700
600550
500
400360
225 225 200 200150 150
0
500
1,000
1,500
2,000
2,500
HousingUnits
Years
FIGUREA-1
2013-2031 HOUSING FORECAST¹
Historical Low Density Medium Density High Density Historical Average
A-6
Watson & Associates Economists Ltd. H:\AJAX\DC 2012-2013\dc study.docx
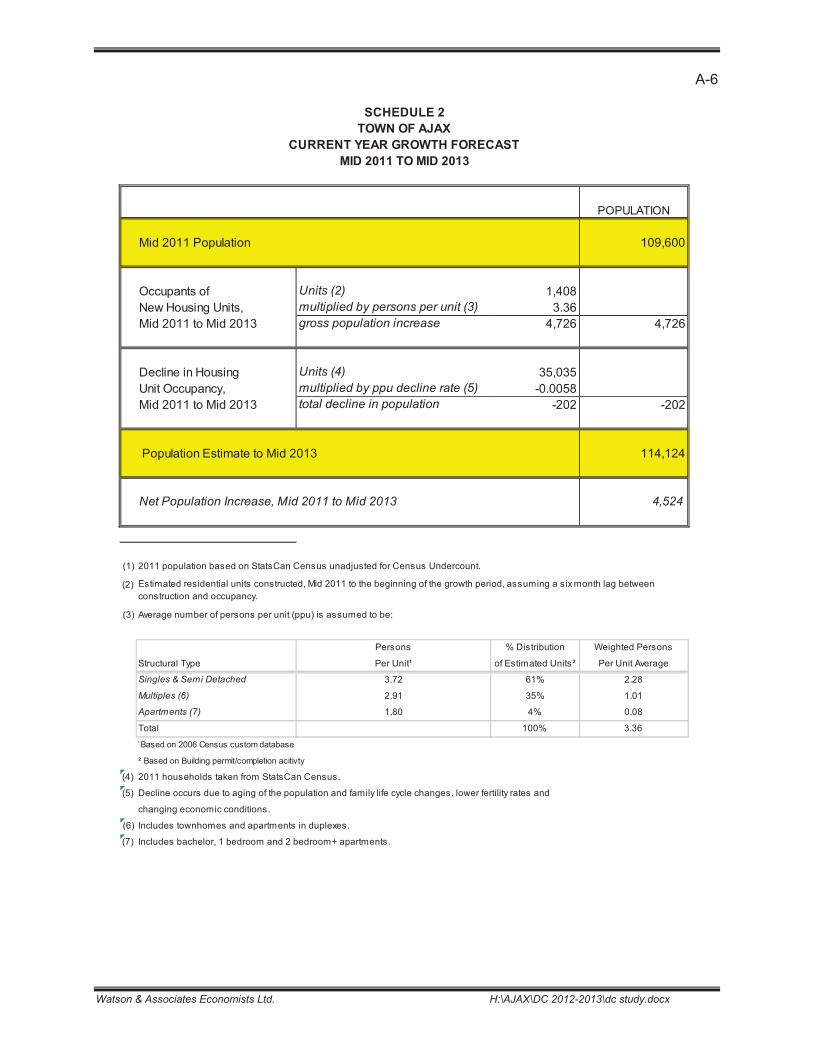
POPULATION
Mid 2011 Population 109,600
Occupants of Units (2) 1,408
New Housing Units, multiplied by persons per unit (3) 3.36
Mid 2011 to Mid 2013 gross population increase 4,726 4,726
Decline in Housing Units (4) 35,035
Unit Occupancy, multiplied by ppu decline rate (5) -0.0058
Mid 2011 to Mid 2013 total decline in population -202 -202
Population Estimate to Mid 2013 114,124
Net Population Increase, Mid 2011 to Mid 2013 4,524
(1) 2011 population based on StatsCan Census unadjusted for Census Undercount.
(2)
(3) Average number of persons per unit (ppu) is assumed to be:
Persons % Distribution Weighted Persons
Structural Type Per Unit¹ of Estimated Units² Per Unit Average
Singles & Semi Detached 3.72 61% 2.28
Multiples (6) 2.91 35% 1.01
Apartments (7) 1.80 4% 0.08
Total 100% 3.36
¹Based on 2006 Census custom database
² Based on Building permit/completion acitivty
(4) 2011 households taken from StatsCan Census.
(5) Decline occurs due to aging of the population and family life cycle changes, lower fertility rates and
changing economic conditions.
(6) Includes townhomes and apartments in duplexes.
(7) Includes bachelor, 1 bedroom and 2 bedroom+ apartments.
SCHEDULE 2
TOWN OF AJAX
CURRENT YEAR GROWTH FORECAST
MID 2011 TO MID 2013
Estimated residential units constructed, Mid 2011 to the beginning of the growth period, assuming a sixmonth lag between
construction and occupancy.
A-7
Watson & Associates Economists Ltd. H:\AJAX\DC 2012-2013\dc study.docx
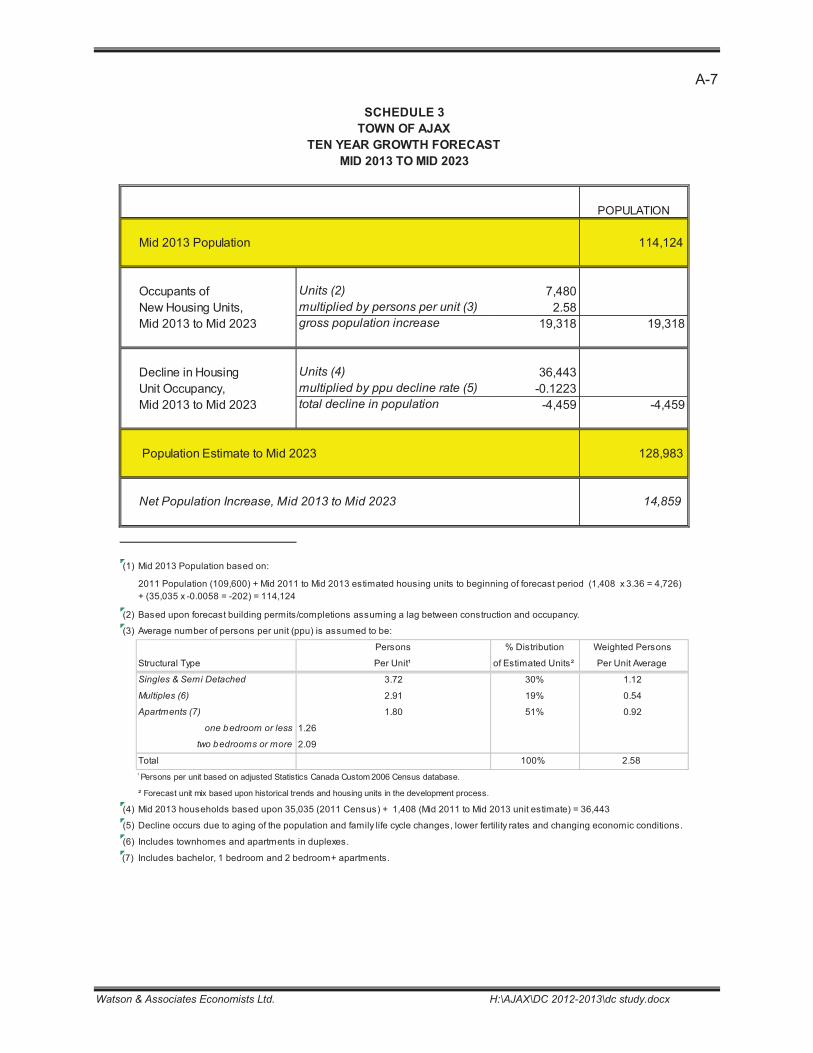
POPULATION
Mid 2013 Population 114,124
Occupants of Units (2) 7,480
NewHousing Units, multiplied by persons per unit (3) 2.58
Mid 2013 to Mid 2023 gross population increase 19,318 19,318
Decline in Housing Units (4) 36,443
Unit Occupancy, multiplied by ppu decline rate (5) -0.1223
Mid 2013 to Mid 2023 total decline in population -4,459 -4,459
Population Estimate to Mid 2023 128,983
Net Population Increase, Mid 2013 to Mid 2023 14,859
(1) Mid 2013 Population based on:
(2) Based upon forecast building permits/completions assuming a lag between construction and occupancy.
(3) Average number of persons per unit (ppu) is assumed to be:
Persons % Distribution Weighted Persons
Structural Type Per Unit¹ of Estimated Units² Per Unit Average
Singles & Semi Detached 3.72 30% 1.12
Multiples (6) 2.91 19% 0.54
Apartments (7) 1.80 51% 0.92
one bedroom or less 1.26
two bedrooms or more 2.09
Total 100% 2.58
¹Persons per unit based on adjusted Statistics Canada Custom2006 Census database.
² Forecast unit mix based upon historical trends and housing units in the development process.
(4) Mid 2013 households based upon 35,035 (2011 Census) + 1,408 (Mid 2011 to Mid 2013 unit estimate) = 36,443
(5) Decline occurs due to aging of the population and family life cycle changes, lower fertility rates and changing economic conditions.
(6) Includes townhomes and apartments in duplexes.
(7) Includes bachelor, 1 bedroom and 2 bedroom+ apartments.
MID 2013 TOMID 2023
2011 Population (109,600) + Mid 2011 to Mid 2013 estimated housing units to beginning of forecast period (1,408 x 3.36 = 4,726)
+ (35,035 x -0.0058 = -202) = 114,124
SCHEDULE 3
TOWN OF AJAX
TEN YEAR GROWTH FORECAST
A-8
Watson & Associates Economists Ltd. H:\AJAX\DC 2012-2013\dc study.docx
POPULATION
Mid 2013 Population 114,124
Occupants of Units (2) 9,390
New Housing Units, multiplied by persons per unit (3) 2.44
Mid 2013 to Mid 2031 gross population increase 22,935 22,935
Decline in Housing Units (4) 36,443
Unit Occupancy, multiplied by ppu decline rate (5) -0.1471
Mid 2013 to Mid 2031 total decline in population -5,361 -5,361
Population Estimate to Mid 2031 131,697
Net Population Increase, Mid 2013 to Mid 2031 17,573
(1) Mid 2013 Population based on:
(2) Based upon forecast building permits/completions assuming a lag between construction and occupancy.
(3) Average number of persons per unit (ppu) is assumed to be:
Persons % Distribution Weighted Persons
Structural Type Per Unit¹ of Estimated Units² Per Unit Average
Singles & Semi Detached 3.72 24% 0.91
Multiples (6) 2.91 16% 0.46
Apartments (7) 1.80 60% 1.07
one bedroom or less 1.26
two bedrooms or more 2.09
Total 100% 2.44
¹Persons per unit based on adjusted Statistics Canada Custom2006 Census database.
² Forecast unit mix based upon historical trends and housing units in the development process.
(4) Mid 2013 households based upon 35,035 (2011 Census) + 1,408 (Mid 2011 to Mid 2013 unit estimate) = 36,443
(5) Decline occurs due to aging of the population and family life cycle changes, lower fertility rates and changing economic conditions.
(6) Includes townhomes and apartments in duplexes.
(7) Includes bachelor, 1 bedroom and 2 bedroom+ apartments.
MID 2013 TO MID 2031
2011 Population (109,600) + Mid 2011 to Mid 2013 estimated housing units to beginning of forecast period (1,408 x 3.36 = 4,726)
+ (35,035 x -0.0058 = -202) = 114,124
SCHEDULE 4
TOWN OF AJAX
18 - YEAR GROWTH FORECAST
A-9
Watson & Associates Economists Ltd. H:\AJAX\DC 2012-2013\dc study.docx
Singles & Semi-
DetachedMultiples
2Apartments
3 Total
AREA 1 650 235 996 1,881
AREA 2 1,197 523 400 2,120
AREA 3 95 53 281 429
AREA 4 867 755 1,720 3,342
AREA 5 152 173 242 567
AREA 6 10 250 2,288 2,548
AREA 7 561 445 0 1,006
AREA 8 410 56 70 536
RURAL 26 0 0 26
Total (as of June 2010) 3,968 2,490 5,997 12,455
% Breakdown 32% 20% 48% 100%
BP's since 2009 1,659 1,000 2,659
Estimated Total (as of end 2012) 2,309 1,490 5,997 9,796
Town of Ajax Planning Department, July 2012.
1. All of the units listed are either pending, draft approved and registered units, as well as approved and pending site plans.
2. Includes townhomes and apartments in duplexes.
3. Includes bachelor, 1 bedroom and 2 bedroom+ apartments.
TOWN OF AJAX
SUMMARY OF UNITS IN THE DEVELOPMENT PROCESS AS OF JUNE, 20101
SCHEDULE 5
Development Location
Density Type
A-10
Watson & Associates Economists Ltd. H:\AJAX\DC 2012-2013\dc study.docx
MAP A-1
TOWN OF AJAXLOCATION OF RESIDENTIAL DEVELOPMENT
Source: Town of Ajax, Planning Department
A-11
Watson & Associates Economists Ltd. H:\AJAX\DC 2012-2013\dc study.docx
RESIDENTIAL BUILDING PERMITS
Year Total
562 49 0 611
2002 811 260 31 1,102
2003 1,215 182 79 1,476
2004 1,055 187 56 1,298
2005 1,489 435 39 1,963
2006 1,221 599 52 1,872
Sub-total 5,791 1,663 257 7,711
Average (2002 - 2006) 1,158 333 51 1,542
% Breakdown 75.1% 21.6% 3.3% 100.0%
2007 715 120 92 927
2008 487 134 34 655
2009 545 256 114 915
2010 349 338 31 718
2011 457 281 35 773
Sub-total 2,553 1,129 306 3,988
Average (2007 - 2011) 511 226 61 798
% Breakdown 64.0% 28.3% 7.7% 100.0%
2002 - 2011
Total 8,344 2,792 563 11,699
Average 834 279 56 1,170
% Breakdown 71.3% 23.9% 4.8% 100.0%
Sources:
Building Permits - Statistics Canada Publication, 64-001XIB
1. Includes townhomes and apartments in duplexes.
2. Includes bachelor, 1 bedroom and 2 bedroom+ apartments.
SCHEDULE 6
TOWN OF AJAX
HISTORICAL RESIDENTIAL BUILDING PERMITS
YEARS 2002 - 2011
Singles & Semi
DetachedMultiples
1Apartments
2
A-12
Watson & Associates Economists Ltd. H:\AJAX\DC 2012-2013\dc study.docx
Age of SINGLES AND SEMI-DETACHED
Dwelling < 1 BR 1 BR 2 BR 3/4 BR 5+ BR Total 20 Year Average
1-5 - 3.250 2.895 3.394 5.105 3.512
6-10 - - 2.636 3.584 4.395 3.608
11-15 - - - 3.940 5.214 4.070
16-20 - - 2.581 3.590 4.875 3.679 3.72
20-25 - - 2.621 3.326 4.333 3.328
25-35 - - 2.267 2.948 3.920 3.014
35+ - 2.000 2.097 2.679 4.280 2.612
Total - 2.676 2.445 3.346 4.732 3.389
Age of MULTIPLES2
Dwelling < 1 BR 1 BR 2 BR 3/4 BR 5+ BR Total 20 Year Average
1-5 - - 2.273 2.801 - 2.728
6-10 - - 1.818 3.233 - 3.195
11-15 - - - 3.102 - 3.057
16-20 - - 1.941 2.884 3.333 2.651 2.91
20-25 - - 1.600 3.181 - 3.010
25-35 - - - 2.770 - 2.662
35+ - - 2.500 2.700 - 2.579
Total - 1.676 2.083 2.941 4.161 2.835
Age of APARTMENTS3
Dwelling < 1 BR 1 BR 2 BR 3/4 BR 5+ BR Total 20 Year Average
1-5 - - - - - -
6-10 - - 2.357 - - 2.043
11-15 - 1.231 1.778 - - 1.506
16-20 - 1.370 1.813 2.467 - 1.835 1.80
20-25 - 1.000 2.000 2.214 - 1.877
25-35 - 1.682 1.740 2.500 - 1.851
35+ - 1.639 2.061 3.000 - 2.225
Total 0.952 1.432 1.885 2.677 - 1.929
Age of ALL DENSITY TYPES
Dwelling < 1 BR 1 BR 2 BR 3/4 BR 5+ BR Total
1-5 - 2.778 2.755 3.296 5.145 3.383
6-10 - 2.417 2.362 3.492 4.660 3.460
11-15 - 1.227 2.279 3.701 5.219 3.400
16-20 - 1.378 2.083 3.505 4.628 3.415
20-25 - 1.810 2.158 3.283 4.414 3.172
25-35 - 1.654 1.825 2.867 3.643 2.609
35+ 0.909 1.731 2.103 2.711 3.906 2.524
Total 1.417 1.690 2.112 3.263 4.636 3.137
2. Includes townhomes and apartments in duplexes.
3. Includes bachelor, 1 bedroom and 2 bedroom+ apartments.
Note: Does not include Statistics Canada data classified as 'Other'
PPU Not calculated for samples less than or equal to 50 dwelling units, and does not include institutional population
(2006 CENSUS)
1. The Census PPU has been adjusted to account for the downward PPU trend which has been recently experienced in both new and older units,
largely due to the aging of the population
TOWN OF AJAX
SCHEDULE 7
PERSONS PER UNIT BYAGE AND TYPE OF DWELLING
A-13
Watson&AssociatesEconomistsLtd.
H:\AJAX\DC2012-2013\dcstudy.docx
3.51
3.61
4.07
3.68
3.33
3.01
2.61
2.73
3.20
3.06
2.65
3.01
2.66
2.58
0.00
2.04
1.51
1.84
1.88
1.85
2.23
0.00
0.50
1.00
1.50
2.00
2.50
3.00
3.50
4.00
4.50
1-5
6-10
11-15
16-20
20-25
25-35
35+
PersonsPerDwelling
AgeofDwelling
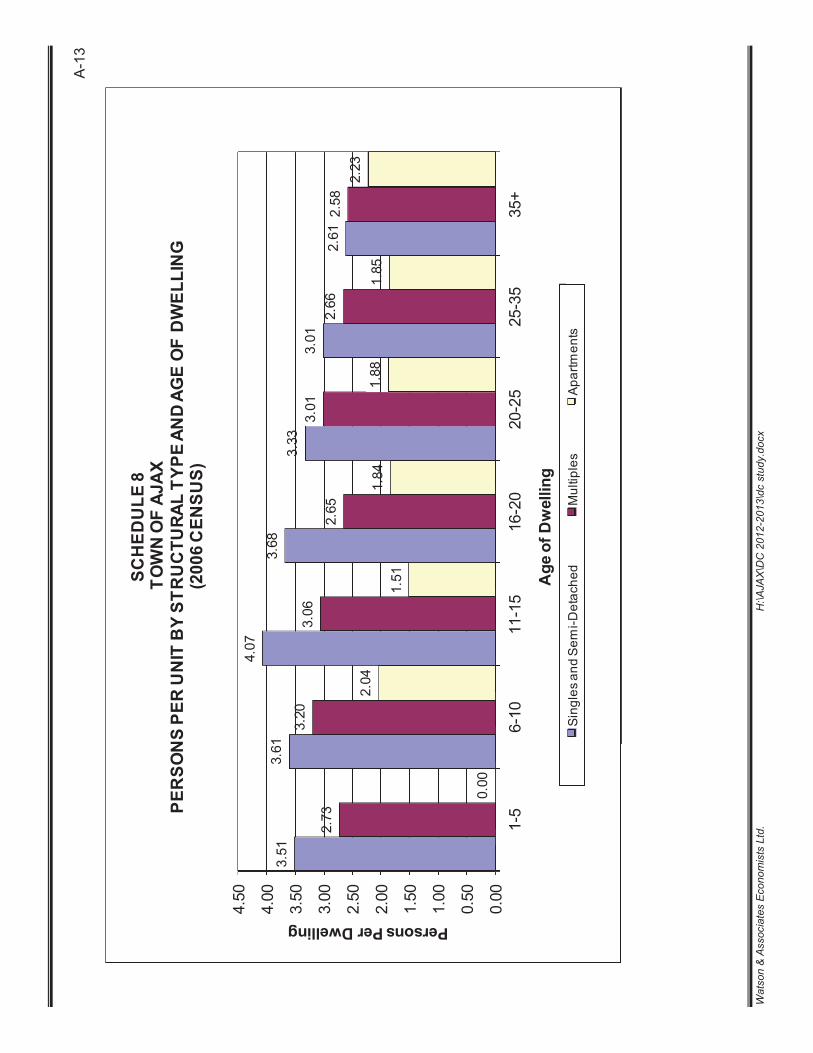
SCHEDULE8
PERSONSPERUNITBYSTRUCTURALTYPEANDAGEOFDWELLING
(2006CENSUS)
SinglesandSemi-Detached
Multiples
Apartments
TOWNOFAJAX
A-14
Watson&AssociatesEconomistsLtd.
H:\AJAX\DC2012-2013\dcstudy.docx
20061
90,167
0.002
0.029
0.090
0.111
0.056
0.288
150
2,600
8,120
10,040
5,030
25,940
4,270
30,210
Mid2013
114,124
0.002
0.028
0.097
0.104
0.055
0.286
160
3,206
8,543
11,713
6,748
30,370
4,375
34,745
8,116,253
5,856,468
4,723,603
18,696,324
Mid2023
128,983
0.001
0.032
0.104
0.118
0.060
0.314
160
4,085
13,421
15,201
7,682
40,549
4,590
45,139
12,749,950
7,600,500
5,377,400
25,727,850
Mid2031
131,697
0.001
0.034
0.123
0.121
0.060
0.339
160
4,500
16,210
15,880
7,840
44,590
4,710
49,300
15,399,500
7,940,000
5,488,000
28,827,500
2006-Mid2013
23,957
-0.0002
-0.0006
0.0068
-0.0071
-0.0003
-0.0014
10
606
423
1,673
1,718
4,430
105
4,535
Mid2013-Mid2023
14,859
-0.0003
0.0034
0.0072
0.0136
0.0041
0.0281
0879
4,878
3,488
934
10,179
215
10,394
4,633,697
1,744,032
653,797
7,031,526
Mid2013-Mid2031
17,573
-0.0003
0.0059
0.0263
0.0164
0.0040
0.0523
01,294
7,667
4,167
1,092
14,220
335
14,555
7,283,247
2,083,532
764,397
10,131,176
2006-Mid2013
3,993
0.0000
-0.0001
0.0011
-0.0012
0.0000
-0.0002
2101
71
279
286
738
18
756
Mid2013-Mid2023
1,486
-0.00003
0.00034
0.00072
0.00136
0.00041
0.00281
088
488
349
93
1,018
22
1,039
463,370
174,403
65,380
703,153
Mid2013-Mid2031
879
-0.00001
0.00030
0.00131
0.00082
0.00020
0.00261
065
383
208
55
711
17
728
364,162
104,177
38,220
506,559
Source:Watson&AssociatesEconomistsLtd.,October,2012.DerivedfromTownofAjaxEmploymentRecommendedReport,June15,2009.
1.2006basedon2007EmploymentSurvey.
2.SquareFootPerEmployeeAssumptions
Industrial
950
Commercial/PopulationRelated
500
Institutional
700
EMPLOYMENTANDGROSSFLOORAREA(GFA)FORECAST,2013TO2031
IncrementalChange
AnnualAverage
Employment
Industrial
Commercial/
Population
Related
Institutional
Workat
Home
Industrial
Commercial/
Population
Related
Institutional
Total
exclNFPOW
SCHEDULE9
TOWNOFAJAX
GrossFloorAreainSquareFeet(Estimated)2
Total
Period
Population
Primary
Workat
Home
Industrial
Commercial/
Population
Related
Institutional
Total
Primary
NFPOW
Total
ActivityRate
A-15
Watson&AssociatesEconomistsLtd.
H:\AJAX\DC2012-2013\dcstudy.docx
2001
42,066
Sub-total
Average
New
ImproveAdditions
Total
New
Improve
Additions
Total
New
Improve
Additions
Total
New
Improve
Additions
Total
2002
607
503
01,110
11,135
3,894
015,029
427
3,953
28,804
33,184
12,169
8,350
28,804
49,323
2003
164
290
0454
2,756
7,505
532
10,793
16,497
546
017,043
19,417
8,341
532
28,290
2004
392
847
01,239
4,420
4,740
09,160
8,570
89
08,660
13,382
5,676
019,058
2005
2,228
1,484
03,712
54,723
2,938
057,662
11,482
869
2,905
15,256
68,433
5,291
2,905
76,629
2006
549
329
0878
126,181
10,427
0136,608
9,430
784
010,214136,160
11,540
0147,700
2007
205
845
1,231
2,281
24,925
4,461
029,386
328
595
62,219
63,143
25,458
5,901
63,450
94,809
2008
616
1,904
02,521
28,018
4,956
1,485
34,460
25,965
743
026,709
54,600
7,604
1,485
63,689
2009
20,752
47
020,799
22,790
9,099
2,185
34,074
380
1,010
4,760
6,150
43,923
10,156
6,945
61,023
2010
1,708
292
02,000
12,570
11,455
35,835
59,861
176
1,401
1,854
3,431
14,454
13,148
37,690
65,292
2011
00
00
00
00
00
00
00
00
Subtotal
27,221
6,541
1,231
34,993
287,519
59,475
40,037
387,032
73,256
9,991
100,542
183,789387,996
76,007
141,811
605,814
PercentofTotal
78%
19%
4%
100%
74%
15%
10%
100%
40%
5%
55%
100%
64%
13%
23%
100%
Average
3,025
727
137
3,888
31,947
6,608
4,449
43,004
8,140
1,110
11,171
20,421
43,111
8,445
15,757
67,313
2001-2010
10YearTotal
39,887
392,387
215,606
605,814
10YearAverage
3,989
39,239
21,561
60,581
%Breakdown
6.6%
64.8%
35.6%
100.0%
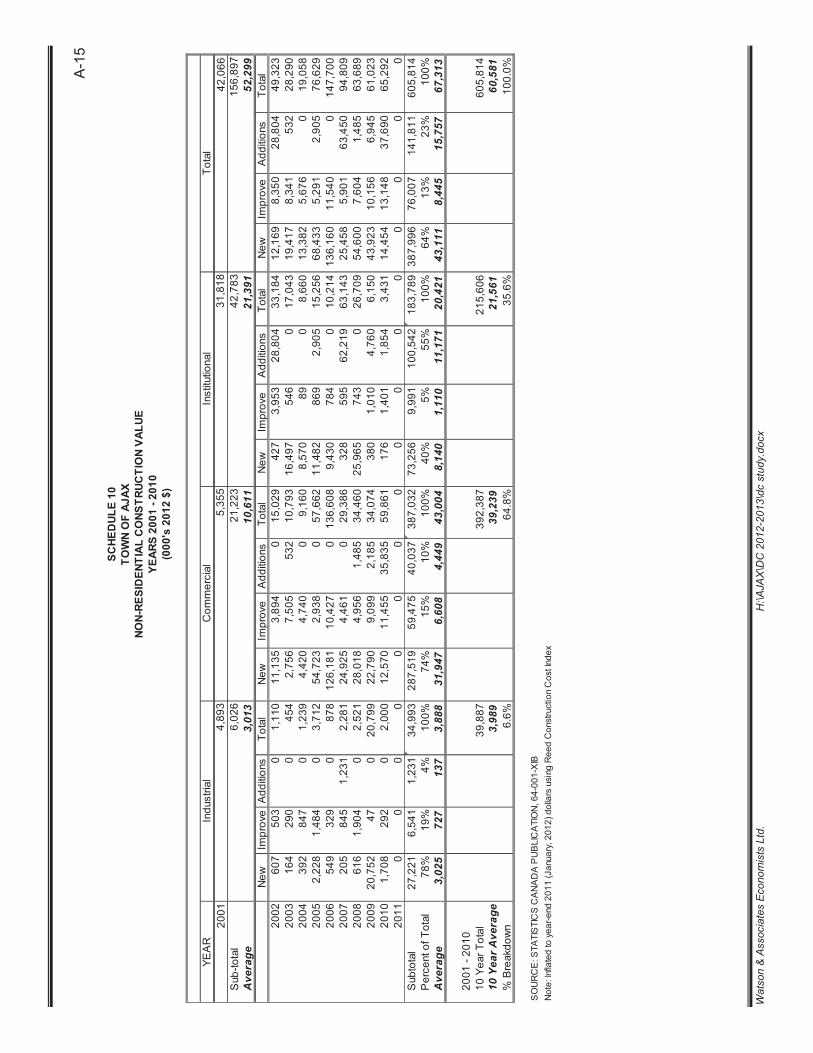
SOURCE:STATISTICSCANADAPUBLICATION,64-001-XIB
Note:Inflatedtoyear-end2011(January,2012)dollarsusingReedConstructionCostIndex
Commercial
4,893
6,026
3,013
Industrial
5,355
21,223
10,611
YEAR
52,299
Total
156,897
21,391
31,818
Institutional
42,783
SCHEDULE10
TOWNOFAJAX
NON-RESIDENTIALCONSTRUCTIONVALUE
YEARS2001-2010
(000's2012$)
A-16
Watson & Associates Economists Ltd. H:\AJAX\DC 2012-2013\dc study.docx
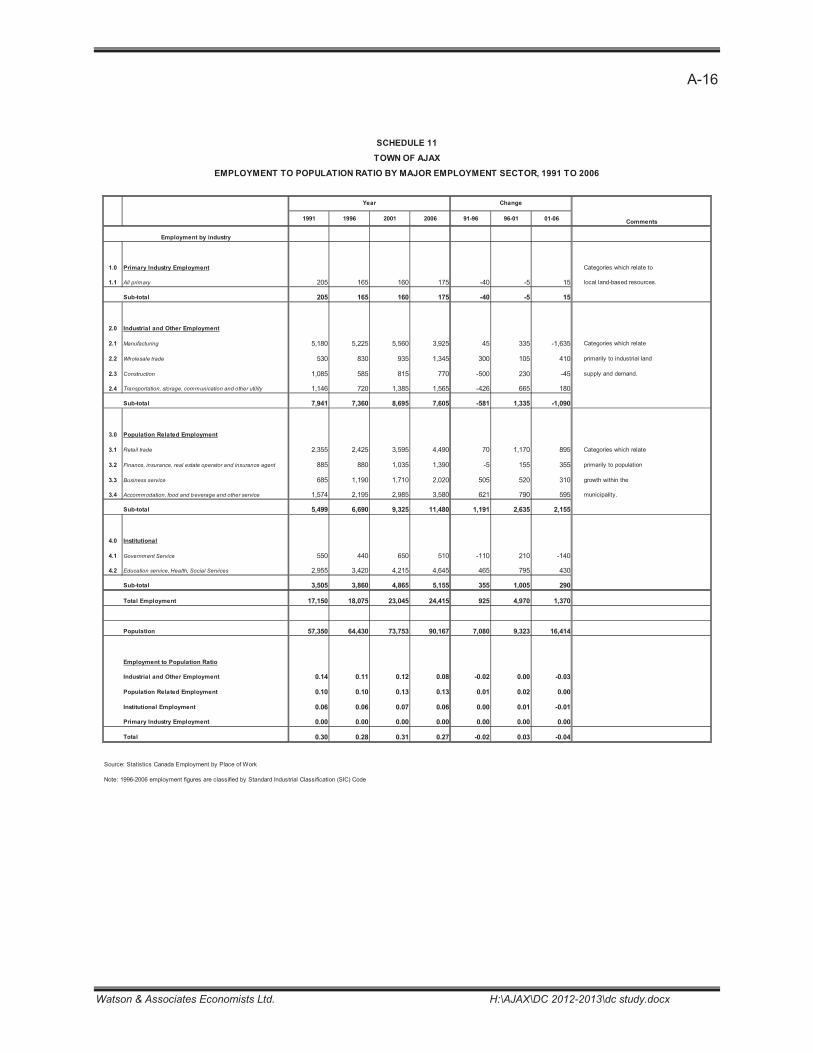
1991 1996 2001 2006 91-96 96-01 01-06Comments
Employment by industry
1.0 Primary Industry Employment Categories which relate to
1.1 All primary 205 165 160 175 -40 -5 15 local land-based resources.
Sub-total 205 165 160 175 -40 -5 15
2.0 Industrial and Other Employment
2.1 Manufacturing 5,180 5,225 5,560 3,925 45 335 -1,635 Categories which relate
2.2 Wholesale trade 530 830 935 1,345 300 105 410 primarily to industrial land
2.3 Construction 1,085 585 815 770 -500 230 -45 supply and demand.
2.4 Transportation, storage, communication and other utility 1,146 720 1,385 1,565 -426 665 180
Sub-total 7,941 7,360 8,695 7,605 -581 1,335 -1,090
3.0 Population Related Employment
3.1 Retail trade 2,355 2,425 3,595 4,490 70 1,170 895 Categories which relate
3.2 Finance, insurance, real estate operator and insurance agent 885 880 1,035 1,390 -5 155 355 primarily to population
3.3 Business service 685 1,190 1,710 2,020 505 520 310 growth within the
3.4 Accommodation, food and beverage and other service 1,574 2,195 2,985 3,580 621 790 595 municipality.
Sub-total 5,499 6,690 9,325 11,480 1,191 2,635 2,155
4.0 Institutional
4.1 Government Service 550 440 650 510 -110 210 -140
4.2 Education service, Health, Social Services 2,955 3,420 4,215 4,645 465 795 430
Sub-total 3,505 3,860 4,865 5,155 355 1,005 290
Total Employment 17,150 18,075 23,045 24,415 925 4,970 1,370
Population 57,350 64,430 73,753 90,167 7,080 9,323 16,414
Employment to Population Ratio
Industrial and Other Employment 0.14 0.11 0.12 0.08 -0.02 0.00 -0.03
Population Related Employment 0.10 0.10 0.13 0.13 0.01 0.02 0.00
Institutional Employment 0.06 0.06 0.07 0.06 0.00 0.01 -0.01
Primary Industry Employment 0.00 0.00 0.00 0.00 0.00 0.00 0.00
Total 0.30 0.28 0.31 0.27 -0.02 0.03 -0.04
Source: Statistics Canada Employment by Place of Work
Note: 1996-2006 employment figures are classified by Standard Industrial Classification (SIC) Code
Change
SCHEDULE 11
TOWNOF AJAX
EMPLOYMENT TO POPULATION RATIO BY MAJOR EMPLOYMENT SECTOR, 1991 TO 2006
Year