Embed Size (px)
Citation preview

www.concerto.uk.com www.concerto.uk.com
Page 1 of 85
Appendix – Table of Contents
Appendix – Table of Contents ....................................................................................................................................... 1
Appendix 1 – List of Meetings ....................................................................................................................................... 2
Appendix 2 – Property Asset Management Delivery Plan current position and potential resource implications 5
Appendix 3 - Surveys ................................................................................................................................................... 17
Client Questionnaire – Results ....................................................................................................................................... 18
Staff Questionnaire – Results ......................................................................................................................................... 27
Appendix 4 – International Comparators .................................................................................................................... 60

www.concerto.uk.com www.concerto.uk.com
Page 2 of 85
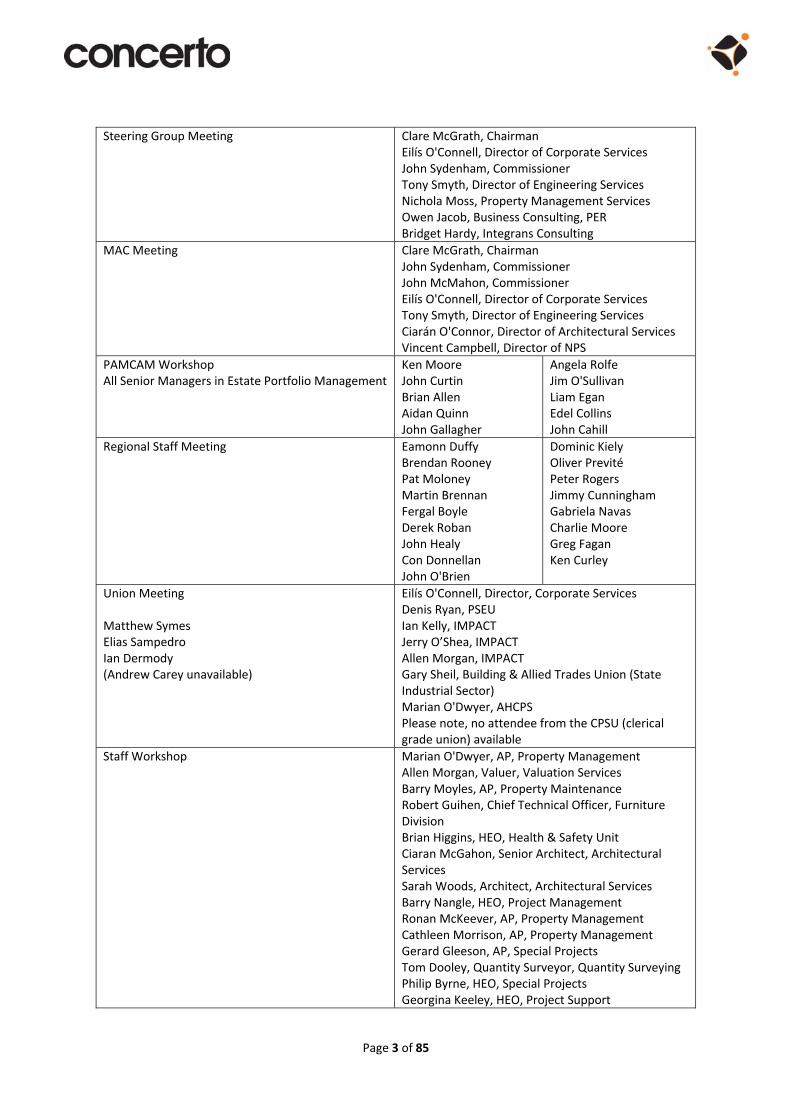
Appendix 1 – List of Meetings This Appendix includes the list of internal and external meetings carried by the project team both with OPW
staff, clients and stakeholders.
List of Internal Meetings
Board Clare McGrath, Chairman
Board John Sydenham, Commissioner
Board John McMahon, Commissioner
Corporate Services Eilís O'Connell, Director
Engineering Services Tony Smyth, Director
Accounts Mick Long, Principal Officer
Accounts Bernie O'Brien, Assistant Principal
Architectural Services Ciarán O'Connor, Principal Architect
Architectural Services Liam Egan, Assistant Principal Architect
Architectural Services Edel Collins, Assistant Principal Architect
Architectural Services ‐ Conservation John Cahill, Senior Architect
Civil and Structural Engineering Services John Gallagher, Assistant Chief Engineer
FRM Data Management Section Vincent Hussey, Engineer
Internal Audit Úna Ní Fhaircheallaigh, Assistant Principal Officer
IT Unit Liam Stewart, Principal Officer
Mechanical & Engineering Services Jim O'Sullivan, Chief Engineer
National Procurement Service (NPS) (now Office of Government Procurement ‐ OGP)
Vincent Campbell, Director
Personnel and Development Services Eileen Leahy, Principal Officer
Project Management Brian Allen, Principal Officer
Property Maintenance Angela Rolfe, Assistant Principal Architect
Property Maintenance Barry Moyles, Assistant Principal Officer
Property Management John Curtin, Principal Officer
Property Management Ken Moore, Principal Officer
Property Management Catherine Eddery, Assistant Principal Officer
Property Management Marian O’Dwyer, Assistant Principal Officer
Property Management Martin Connolly, Valuer
Quantity Surveying Aidan Quinn, Head of Quantity Surveying
Special Projects Mary Cannon, Assistant Principal Officer
Page 3 of 85
Steering Group Meeting Clare McGrath, ChairmanEilís O'Connell, Director of Corporate Services John Sydenham, Commissioner Tony Smyth, Director of Engineering Services Nichola Moss, Property Management Services Owen Jacob, Business Consulting, PER Bridget Hardy, Integrans Consulting
MAC Meeting Clare McGrath, ChairmanJohn Sydenham, Commissioner John McMahon, Commissioner Eilís O'Connell, Director of Corporate Services Tony Smyth, Director of Engineering Services Ciarán O'Connor, Director of Architectural Services Vincent Campbell, Director of NPS
PAMCAM Workshop All Senior Managers in Estate Portfolio Management
Ken MooreJohn Curtin Brian Allen Aidan Quinn John Gallagher
Angela Rolfe Jim O'Sullivan Liam Egan Edel Collins John Cahill
Regional Staff Meeting Eamonn Duffy Brendan Rooney Pat Moloney Martin Brennan Fergal Boyle Derek Roban John Healy Con Donnellan John O'Brien
Dominic Kiely Oliver Previté Peter Rogers Jimmy Cunningham Gabriela Navas Charlie Moore Greg Fagan Ken Curley
Union Meeting Matthew Symes Elias Sampedro Ian Dermody (Andrew Carey unavailable)
Eilís O'Connell, Director, Corporate Services Denis Ryan, PSEU Ian Kelly, IMPACT Jerry O’Shea, IMPACT Allen Morgan, IMPACT Gary Sheil, Building & Allied Trades Union (State Industrial Sector) Marian O'Dwyer, AHCPS Please note, no attendee from the CPSU (clerical grade union) available
Staff Workshop Marian O'Dwyer, AP, Property Management Allen Morgan, Valuer, Valuation Services Barry Moyles, AP, Property Maintenance Robert Guihen, Chief Technical Officer, Furniture Division Brian Higgins, HEO, Health & Safety Unit Ciaran McGahon, Senior Architect, Architectural Services Sarah Woods, Architect, Architectural Services Barry Nangle, HEO, Project Management Ronan McKeever, AP, Property Management Cathleen Morrison, AP, Property Management Gerard Gleeson, AP, Special Projects Tom Dooley, Quantity Surveyor, Quantity Surveying Philip Byrne, HEO, Special Projects Georgina Keeley, HEO, Project Support

Page 4 of 85
Kieran Walsh, Engineer, Civil & Structural Engineering Services
List of External Meetings
Brian Hayes, Minister of State
An Garda Síochána Mr. Sean Murphy, Head of Garda Housing
An Garda Síochána Mr. Michael Culhane, Executive Director of Finance
Chief State Solicitors Office (CSSO) Eileen Creedon, Chief State Solicitor
Chief State Solicitors Office (CSSO) Eimear Codd, Principal Solicitor
Department of Public Expenditure & Reform Owen Jacob, Business Consulting & Corporate Support
Department of Public Expenditure and Reform Paul Reid, Chief Operations Officer
Department of Public Expenditure and Reform Frank Griffin, AP, Expenditure Management Division
Department of Public Expenditure and Reform Dermot Quigley, PO, Expenditure Management Division
Department of Public Expenditure and Reform David Feeney, PO, Public Service Reform and Delivery
Department of Public Expenditure and Reform Robert Watt, Secretary General
Department of Revenue Liam Ryan, Assistant Secretary
Department of Social Protection John Conlon, Assistant Secretary
Department of Social Protection Eoghan Ryan, Principal
House of Oireachtas Paul Conway, Superintendent of the Houses
Future Property Owners Workshop Breffini Carpenter, Department of Agriculture, Food & the MarinePaul Dowling, Revenue Commissioners Tom O'Malley, Revenue Commissioners Sean McCormack, Department of Health Jarlath Fallon, Department of Education & Skills Conor O’Leary, Department of Transport, Tourism & Sport Seán O'Suilleabháin, Department of Environment, Community & Local Government Denis Maher, Communications, Energy & Natural Resources John Roycroft, Department of Justice & Equality Eimear Codd, Chief State Solicitors Office Cliodhna Dullea, Chief State Solicitors Office John Curtin, Office of Public Works Catherine Eddery, Office of Public Works
Page 5 of 85
Appendix 2 – Property Asset Management Delivery Plan current position and potential resource implications

Page 6 of 85
Extract from ‘Accommodating Change – Measuring Success’ Property Asset Management Delivery Plan
Response on current position and potential resource implications
(prepared for C&C Review on 14 January 2014)
1.8 Outline of actions proposed (i) Governance Recommended Actions:
Public property holders will nominate representatives to a Property Managers Network led by the OPW (including Departmental property professionals) (Target date Q3 2013)
The OPW will provide regular reports on progressing the implementation of the reform recommendations (Ongoing)
(ii) Business Planning and Common Strategies. Recommended Actions:
The OPW in consultation with the Department of Public Expenditure and Reform will prepare a template for Departments/Offices to use in preparing the property‐related section of their future Strategy Statements/Business Plans to facilitate strategic planning (Target date Q4 2013)
Response: We have received nominations for up to 40% of appointees in this area. On receipt of all nominations, the next steps will involve information seminars on the Plan on a regional basis. Significant resources will be required for the ongoing management of the Network, from its establishment and undertaking public sector wide workshops to longer term chairing the Network. It is envisaged that the Network will be chaired and facilitated by the OPW on a regional basis and will include coordinating and monitoring role in addition to regular reporting to the Steering Group. See draft organisation chart.
Response: This is ongoing. Monitoring will increase as the actions progress, which will increase work demands on Property Management personnel.
Response: This action target date has moved to Q1 2014. A first draft of the template is being generated at present. Once the template has been agreed, the resource implications for the OPW will involve considerable interaction with Departments, coordinating responses, analytical and analysis skills to assess the detailed property requirements by Departments aligned with their Business Plans.

Page 7 of 85
The OPW will assess office accommodation requirements for the Civil Service, as set out in Strategy Statements, and make recommendations on future property requirements, in conjunction with sectoral stakeholders (Ongoing)
(iii) Communications Strategy Recommended Actions:
The OPW in consultation with other public property holders will develop a communications strategy around the phased implementation of the property asset management reform actions (Target date Q4 2013)
(iv) Adopting ISEN 15221 Standard for Facility Management Recommended Actions:
Public property holders will implement the ISEN 15221 standard on a phased basis. Relevant Departments are to ensure that the standard is adopted across their areas of responsibility. The Standard will define financial, spatial and environmental KPIs to assess asset performance (Target date Q4 2013)*
Response: This will be an annual process involving coordinating responses, intensive interaction with Departments and detailed assessments of returns. This will require resources and analytical skillsets over and above those currently available in Property Management, such as space planners, property economists, analysts, etc.
Response: A Communications Strategy was developed and circulated to the Steering Group, awaiting sign-off. The strategy identifies the various elements required for actions in the Plan (mapping, Property Managers’ Network, protocols/policies, ISEN Standards). It sets out how intra public service engagement will take place around property management. Workshops have been developed and presentations on the Plan made to OPW personnel, including regional staff. Presentations have taken place with the City and County Managers’ Association (CCMA), which represents the local authorities.
There is a significant resource requirement in this area to cover ongoing effective public service wide coordination, communications, monitoring and reporting roles. An assessment is required of the resources to be assigned in the regions to assist the process on a regional basis.
Response: The OPW is drafting contracts for outsourcing surveys to implement the acquisition of datasets to ISEN Standard for all office accommodation. This action will involve developing contract specifications with a view to putting in place a framework for all public bodies. The OPW will have a coordinating and monitoring role in the process.
Page 8 of 85
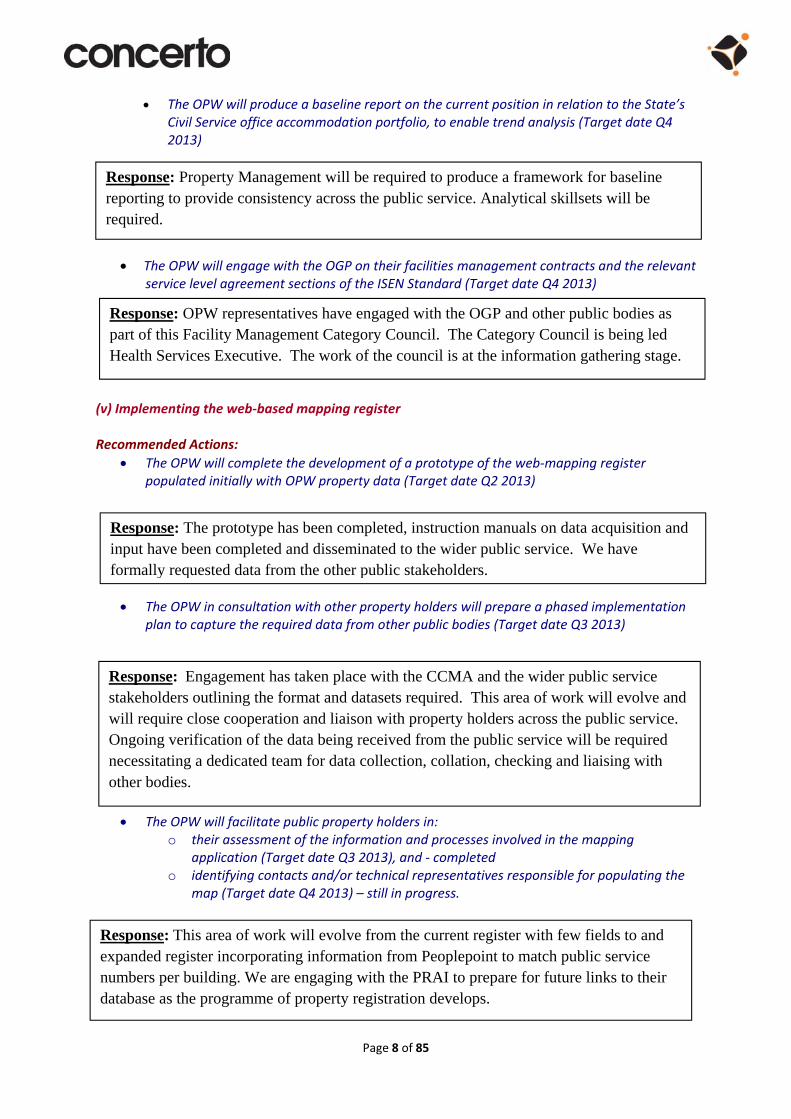
The OPW will produce a baseline report on the current position in relation to the State’s Civil Service office accommodation portfolio, to enable trend analysis (Target date Q4 2013)
The OPW will engage with the OGP on their facilities management contracts and the relevant service level agreement sections of the ISEN Standard (Target date Q4 2013)
(v) Implementing the web‐based mapping register Recommended Actions:
The OPW will complete the development of a prototype of the web‐mapping register populated initially with OPW property data (Target date Q2 2013)
The OPW in consultation with other property holders will prepare a phased implementation plan to capture the required data from other public bodies (Target date Q3 2013)
The OPW will facilitate public property holders in: o their assessment of the information and processes involved in the mapping
application (Target date Q3 2013), and ‐ completed o identifying contacts and/or technical representatives responsible for populating the
map (Target date Q4 2013) – still in progress.
Response: Property Management will be required to produce a framework for baseline reporting to provide consistency across the public service. Analytical skillsets will be required.
Response: OPW representatives have engaged with the OGP and other public bodies as part of this Facility Management Category Council. The Category Council is being led Health Services Executive. The work of the council is at the information gathering stage.
Response: The prototype has been completed, instruction manuals on data acquisition and input have been completed and disseminated to the wider public service. We have formally requested data from the other public stakeholders.
Response: Engagement has taken place with the CCMA and the wider public service stakeholders outlining the format and datasets required. This area of work will evolve and will require close cooperation and liaison with property holders across the public service. Ongoing verification of the data being received from the public service will be required necessitating a dedicated team for data collection, collation, checking and liaising with other bodies.
Response: This area of work will evolve from the current register with few fields to and expanded register incorporating information from Peoplepoint to match public service numbers per building. We are engaging with the PRAI to prepare for future links to their database as the programme of property registration develops.

Page 9 of 85
Public property holders will undertake a process of data validation (prioritising office accommodation) in accordance with the data attributes required for the mapping application (Target date Q2 2014)*
(vi) Standardising (i) property asset transfer and (ii) property asset sharing arrangements Recommended Actions:
The Chief State Solicitor’s Office in consultation with public property holders will draft and circulate agreed set of standard protocols (and/or statutory declaration, where appropriate) for intra public service property asset transfer and sharing (Ongoing)
The Department of Public Expenditure and Reform will communicate the standard protocols across the public service by way of Departmental circulars (Target date subject to above)
Agreed valuation methodology will be developed as part of the asset transfer policy. This may include the use of a single independent valuer (instead of each party hiring their own valuer) (Target date Q1 2014)
(vii) Streamlining legal administration Recommended Actions:
The Chief State Solicitor’s Office (CSSO), in consultation with public property holders, will draft pro forma terms acceptable to the State when leasing commercial office
Response: The OPW has commenced this data cleansing/validation process with our regional network in relation to our properties. As stated above, the register will evolve to include information on numbers per building and link to the property registration programme. Ongoing verification of the data being received from the public service will be required to prevent duplication e.g. where one body leases from another, the property may be recorded under both bodies. This verification work will be time-consuming and a drain on resources. It will also require IT development and technician skills.
Response: This work is near completion by the CSSO under the direction of the OPW. The draft protocols will be presented to the Steering Group in the near future.
Response: Subject to agreement, the protocols will be submitted to D/PER for transmission.
Response: This work forms part of the protocols above. Asset valuation will involve greater evaluation of issues arising as the intra public service transfer policy evolves. There will be increasing demand on Property Management to coordinate and implement this action as it develops.

Page 10 of 85
accommodation. (This will include an approval process where there is a derogation sought from the above) (Target date Q4 2013)*
The CSSO, in consultation with public property holders, will draft pro forma terms for inclusion in leases and licences granted to third parties (office accommodation) (Target date Q4 2013)*
(viii) Setting targets for registration/perfecting title on State‐owned properties Recommended Actions:
Public property holders will identify the State’s portfolio of properties that require PRAI registration and set annual targets to register these properties. Prioritise each year – linked to the State’s disposal programme (Target date Q1 2014).
Public property holders will identify a programme of work to acquire the freehold interest on properties held under long leaseholds, having regard to statutory provisions (Ongoing).
(ix) Revise office space allocation per person
Recommended Actions:
The OPW will set targets for Civil Service space norms (Target date Q4 2013)
Response: This work is being advanced by the CSSO.
Response: As above.
Response: In relation to the properties owned by the OPW, this is being prioritised in conjunction with the programme of identifying non-operational properties.
We have engaged with the PRAI and the CSSO on the process that will apply. Further meetings will be scheduled.
We have very limited resources in the OPW for this work. A dedicated legal research expertise will be required. This is a huge undertaking for Property Management and is also an important element in the evolution of the mapping register.
Response: No resources have been available to progress this action.
Response: Setting targets for Civil Service space norms is part of the work around the OPW Standards and Policies document currently being finalised. This action may involve consideration of some HR issues for discussion with D/PER

Page 11 of 85
The OPW will define modern, flexible workplace design and more innovative working environment as the norm for Civil Service accommodation (subject to building type) (Target date Q1 2014)
Government Departments/Offices will examine the potential to move to electronic storage in order to reduce record management space requirements (Ongoing)
(x) Building property management expertise and capacity Recommended Actions:
The OPW and public property holders will identify the professional and administrative skills and competencies required in the property management area (Target date Q4 2013)
The OPW will engage external expertise to undertake a capacity and capability review of its activities in relation to the property asset management reform commitments across the public service (Target date Q4 2013)
The OPW and public property holders will identify an accredited qualification for staff in property management and implement a programme to achieve the required standard (Target date Q1 2014)
Each public service sector will ensure the sustainability of professional expertise in the property management area, including professional collaboration across the public service (Ongoing)
Response: This action is being developed through the OPW Standards and Policies document currently being finalised.
Response: This action will be progressed as part of accommodation requests from Departments. It is part of a Government initiative to encourage greater use of electronic storage. The OPW’s role will be to set guidelines and standards to encourage the public service to reduce paper storage. It forms part of the work included in the OPW Standards and Policies document. It will be part of the assessment process once Departments include property related requirements in their Strategy Statements and Business Plans.
Response: We have engaged with the Institute of Chartered Surveyors who have submitted draft proposals for suitable training/educational qualifications courses for administrative staff in the property management area.
Response: This action is almost complete
Response: We have engaged with the Institute of Chartered Surveyors who have submitted draft proposals for suitable training/educational qualifications courses for administrative staff in the property management area.
Page 12 of 85
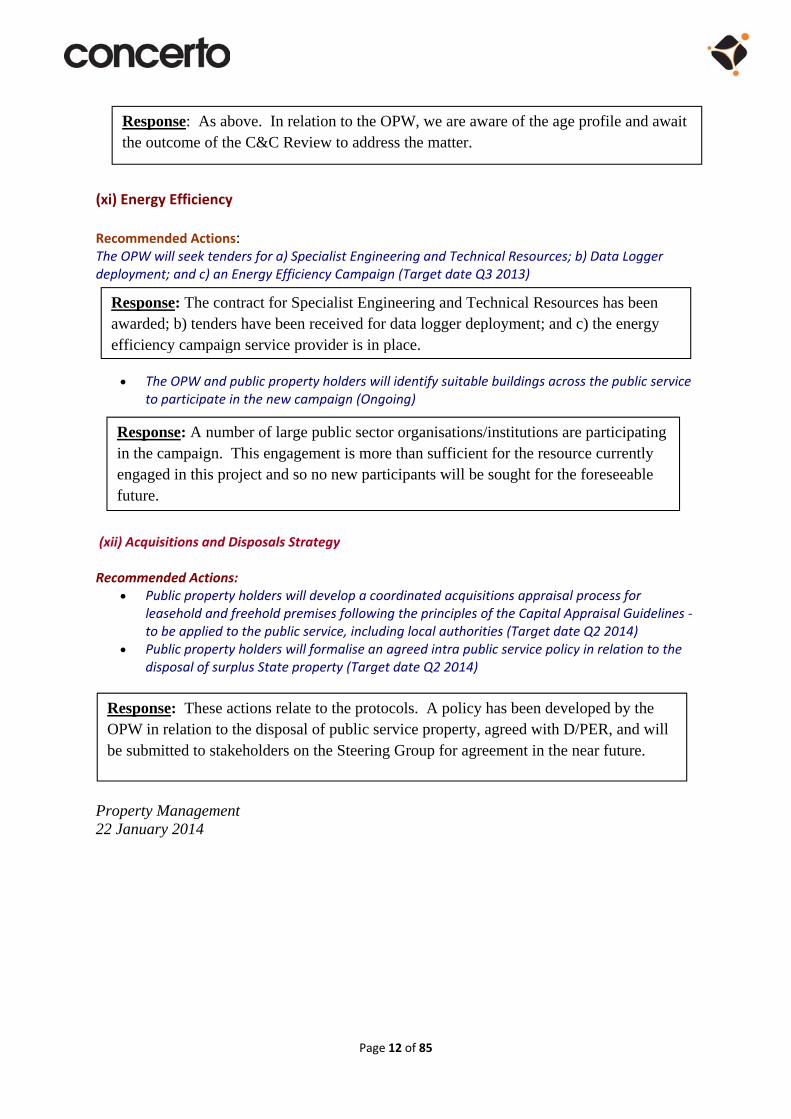
(xi) Energy Efficiency Recommended Actions: The OPW will seek tenders for a) Specialist Engineering and Technical Resources; b) Data Logger deployment; and c) an Energy Efficiency Campaign (Target date Q3 2013)
The OPW and public property holders will identify suitable buildings across the public service
to participate in the new campaign (Ongoing)
(xii) Acquisitions and Disposals Strategy Recommended Actions:
Public property holders will develop a coordinated acquisitions appraisal process for leasehold and freehold premises following the principles of the Capital Appraisal Guidelines ‐ to be applied to the public service, including local authorities (Target date Q2 2014)
Public property holders will formalise an agreed intra public service policy in relation to the disposal of surplus State property (Target date Q2 2014)
Property Management 22 January 2014
Response: As above. In relation to the OPW, we are aware of the age profile and await the outcome of the C&C Review to address the matter.
Response: The contract for Specialist Engineering and Technical Resources has been awarded; b) tenders have been received for data logger deployment; and c) the energy efficiency campaign service provider is in place.
Response: A number of large public sector organisations/institutions are participating in the campaign. This engagement is more than sufficient for the resource currently engaged in this project and so no new participants will be sought for the foreseeable future.
Response: These actions relate to the protocols. A policy has been developed by the OPW in relation to the disposal of public service property, agreed with D/PER, and will be submitted to stakeholders on the Steering Group for agreement in the near future.

Page 13 of 85
Section Milestone Current Status Conclusion
1 Governance Public property holders will nominate representatives to a Property Managers Network led by the OPW (including Departmental property professionals) (Target date Q3 2013)
Nominations received, the next steps will involve information seminars on a regional basis
Partially complete
2 Governance The OPW will provide regular reports on progressing the implementation of the reform recommendations (Ongoing)
Ongoing Complete
3 Business Planning and Common Strategies
The OPW in consultation with the Department of Public Expenditure and Reform will prepare a template for Departments/Offices to use in preparing the property‐related section of their future Strategy Statements/Business Plans to facilitate strategic planning (Target date Q4 2013)
Target date moved to Q1 2014. Draft of the template generated at present
To be complete in 2014
4 Business Planning and Common Strategies
The OPW will assess office accommodation requirements for the Civil Service, as set out in Strategy Statements, and make recommendations on future property requirements, in conjunction with sectoral stakeholders (Ongoing)
Target date moved to Q1 2014. This will be an annual process involving coordinating responses, interaction with Departments and assessment of returns.
To be complete in 2014
5 Communications
Strategy
The OPW in consultation with other public property holders will develop a communications strategy around the phased implementation of the property asset management reform actions (Target date Q4 2013)
Communications strategy developed and circulated to the Steering Group, awaiting sign‐off
Partially complete
6
Adopting ISEN 15221 Standard
for Facility Management
Public property holders will implement the ISEN 15221 standard on a phased basis. Relevant Departments are to ensure that the standard is adopted across their areas of responsibility. The Standard will define financial, spatial and environmental KPIs to assess asset performance (Target date Q4 2013)*
OPW is drafting contracts for outsourcing surveys to implement the acquisition of datasets to ISEN Standard
Not complete
7
Adopting ISEN 15221 Standard
for Facility Management
The OPW will produce a baseline report on the current position in relation to the State’s Civil Service office accommodation portfolio, to enable trend analysis (Target date Q4 2013)
Property Management to produce a framework for baseline reporting
Not complete
8
Adopting ISEN 15221 Standard
for Facility Management
The OPW will engage with the OGP on their facilities management contracts and the relevant service level agreement sections of the ISEN Standard (Target date Q4 2013)
OPW engaged with the OGP and other public bodies as part of the Facility Management Category Council
Partially complete

Page 14 of 85
Section Milestone Current Status Conclusion
9 Implementing the
web‐based mapping register
The OPW will complete the development of a prototype of the web‐mapping register populated initially with OPW property data (Target date Q2 2013)
Prototype and instructions completed and sent to the wider public service
Complete
10 Implementing the
web‐based mapping register
The OPW in consultation with other property holders will prepare a phased implementation plan to capture the required data from other public bodies (Target date Q3 2013)
Engagement with the CCMA and other stakeholders outlining format and datasets required
Not complete
11 Implementing the
web‐based mapping register
The OPW will facilitate public property holders in: ‐ their assessment of the information and processes involved in the mapping application (Target date Q3 2013), and – completed
‐ identifying contacts and/or technical representatives responsible for populating the map (Target date Q4 2013) – still in progress
Engagement with the PRAI needed to prepare for future links to their database as the programme of property registration develops
Not complete
12 Implementing the
web‐based mapping register
Public property holders will undertake a process of data validation (prioritising office accommodation) in accordance with the data attributes required for the mapping application (Target date Q2 2014)*
Data cleansing/validation process started with the regional network
To be complete in 2014
13
Standardising (i) property asset transfer and (ii) property asset
sharing arrangements
The Chief State Solicitor’s Office in consultation with public property holders will draft and circulate agreed set of standard protocols (and/or statutory declaration, where appropriate) for intra public service property asset transfer and sharing (Ongoing)
Near completion by the CSSO under the direction of the OPW
Partially complete
14
Standardising (i) property asset transfer and (ii) property asset
sharing arrangements
The Department of Public Expenditure and Reform will communicate the standard protocols across the public service by way of Departmental circulars (Target date subject to above)
Subject to agreement, protocols to be submitted to DPER
Not complete
15
Standardising (i) property asset transfer and (ii) property asset
Agreed valuation methodology will be developed as part of the asset transfer policy. This may include the use of a single independent valuer (instead of each party hiring their own valuer) (Target date Q1 2014)
This work forms part of the protocols above
To be complete in 2014

Page 15 of 85
Section Milestone Current Status Conclusion
sharing arrangements
16 Streamlining
legal administration
The Chief State Solicitor’s Office (CSSO), in consultation with public property holders, will draft pro forma terms acceptable to the State when leasing commercial office accommodation. (This will include an approval process where there is a derogation sought from the above) (Target date Q4 2013)*
Work being advanced by CSSO Partially complete
17 Streamlining legal administration
The CSSO, in consultation with public property holders, will draft pro forma terms for inclusion in leases and licences granted to third parties (office accommodation) (Target date Q4 2013)*
Work being advanced by CSSO Partially complete
18
Setting targets for registration/perfe
cting title on State‐owned properties
Public property holders will identify the State’s portfolio of properties that require PRAI registration and set annual targets to register these properties. Prioritise each year – linked to the State’s disposal programme (Target date Q1 2014).
Engagement with PRAI and CSSO on the process, very limited resources in the OPW
To be complete in 2014
19
Setting targets for registration/perfe
cting title on State‐owned properties
Public property holders will identify a programme of work to acquire the freehold interest on properties held under long leaseholds, having regard to statutory provisions (Ongoing).
No resources available to progress the action
Not complete
20 Revise office
space allocation per person
The OPW will set targets for Civil Service space norms (Target date Q4 2013)
Part of the Standards and Policies document (to be finalised)
Partially complete
21 Revise office
space allocation per person
The OPW will define modern, flexible workplace design and more innovative working environment as the norm for Civil Service accommodation (subject to building type) (Target date Q1 2014)
Part of the Standards and Policies document (to be finalised)
To be complete in 2014
22 Revise office
space allocation per person
Government Departments/Offices will examine the potential to move to electronic storage in order to reduce record management space requirements (Ongoing)
Action to be progressed as part of accommodation requests from Departments
Not complete
23 Building property management
The OPW and public property holders will identify the professional and administrative skills and competencies required in the property management area (Target date Q4 2013)
Institute of Chartered Surveyors submitted draft proposals for suitable qualification courses
Partially completed

Page 16 of 85
Section Milestone Current Status Conclusion
expertise and capacity
24
Building property management expertise and
capacity
The OPW will engage external expertise to undertake a capacity and capability review of its activities in relation to the property asset management reform commitments across the public service (Target date Q4 2013)
Almost complete Complete
25
Building property management expertise and
capacity
The OPW and public property holders will identify an accredited qualification for staff in property management and implement a programme to achieve the required standard (Target date Q1 2014)
Institute of Chartered Surveyors submitted draft proposals for suitable qualification courses
To be complete in 2014
26
Building property management expertise and
capacity
Each public service sector will ensure the sustainability of professional expertise in the property management area, including professional collaboration across the public service (Ongoing)
Institute of Chartered Surveyors submitted draft proposals for suitable qualification courses
Partially complete
27 Energy efficiency The OPW will seek tenders for a) Specialist Engineering and Technical Resources; b) Data Logger deployment; and c) an Energy Efficiency Campaign (Target date Q3 2013)
Contract awarded for Specialist Engineering & Technical resources, tenders received for data logger deployment and energy efficiency campaign in place
Complete
28 Energy efficiency The OPW and public property holders will identify suitable buildings across the public service to participate in the new campaign (Ongoing)
More than sufficient engagement from organisations
Complete
29 Acquisitions and disposals strategy
Public property holders will develop a coordinated acquisitions appraisal process for leasehold and freehold premises following the principles of the Capital Appraisal Guidelines ‐ to be applied to the public service, including local authorities (Target date Q2 2014)
Related to protocols To be complete in 2014
30 Acquisitions and disposals strategy
Public property holders will formalise an agreed intra public service policy in relation to the disposal of surplus State property (Target date Q2 2014)
Policy developed in relation to the disposal of public service property, to be submitted to the Steering Group
To be complete in 2014

Page 17 of 85
Appendix 3 ‐ Surveys In this Appendix we include the graphs from the client and staff questionnaires. As part of our work, we have
carried two online surveys. The first one was addressed to 49 present OPW clients, achieving a 49% response
rate. The second one was sent to 611 OPW staff, both online and in hard copy, and achieved a 41% response
rate. We present below the results, excluding comments to keep confidentiality.
Common themes from Client Questionnaire
Generally speaking, the OPW delivers services in a satisfactory manner on a daily basis.
There is inconsistency in the delivery of some services which would suggest either communication and management issues or capacity issues.
As an organisation it needs to demonstrate an enhanced capability that supports its client's service and delivery demands, understanding what clients need and anticipating client’s demand for services.
There are communication problems as it is difficult for clients to know who deals with every issue. Many times clients even escalate to Commissioner level to request simple services.
Common themes from Staff Questionnaire
An updated property management system, better Internet connections and using Microsoft Office and web‐based software would help staff be more effective. There is a lack of data and shared information about property which do not help undertake works.
Sometimes the OPW appears to operate as several distinct dysfunctional branches rather than a cohesive entity. Functions tend to work in independent silos disconnected from each other. The OPW needs to re‐focus its operation to fit the Form of the organisation to align with its present role in Property Asset Management role which it is not at present fit for purpose to do.
The OPW comprises of very capable and committed staff and the clients are overall satisfied with our services.
Significant threat to succession planning, the OPW does not recoup any long term benefit from the use of large numbers of Trainees in the Graduate Training Scheme.
Where multi disciplines and sections are involved in projects there is often a lack of ownership or single management which has led to inefficiencies and less value for money.
The Trim/Dublin dichotomy has caused imbalance in resource allocation.

Page 18 of 85
Client Questionnaire – Results
3
2
3
1
11
111
1
1
1
3
4
Q1. What Department/Office/Public Service body do you work in? (units)
An Garda Síochána
Attorney General's Office
Chief State Solicitor's Office (CSSO)
Department of Arts, Heritage and the Gaeltacht
Department of Communications, Energy and NaturalResourcesDepartment of Education and Skills
Department of Finance
Department of Health
Department of Justice and Equality
Department of Social Protection
Department of the Taoiseach
Department of Transport, Tourism and Sport
12
10
1 1
Q2. Please select your level in your organisation (units)
Middle Management
Senior Management
Executive/Clerical Level
Other

Page 19 of 85
0%
10%
20%
30%
40%
50%
60%
70%
80%
Occupier of thespace provided by
OPW
Requestor ofservices
AccommodationOfficer
Liaison at seniorlevel
Potential futureclient/stakeholder
Other (pleasespecify): Providelegal service onproperty relatedtransactions
71% 71%63%
50%
4% 4%
Q3. Please select your role when dealing with OPW (%, select as many as necessary):
% of total
0%
20%
40%
60%
80%
100%83%
79%
58%50% 50%
46%
33%
13%8% 8%
Q4. What main services do you receive from OPW? (%)
% of total
Page 20 of 85
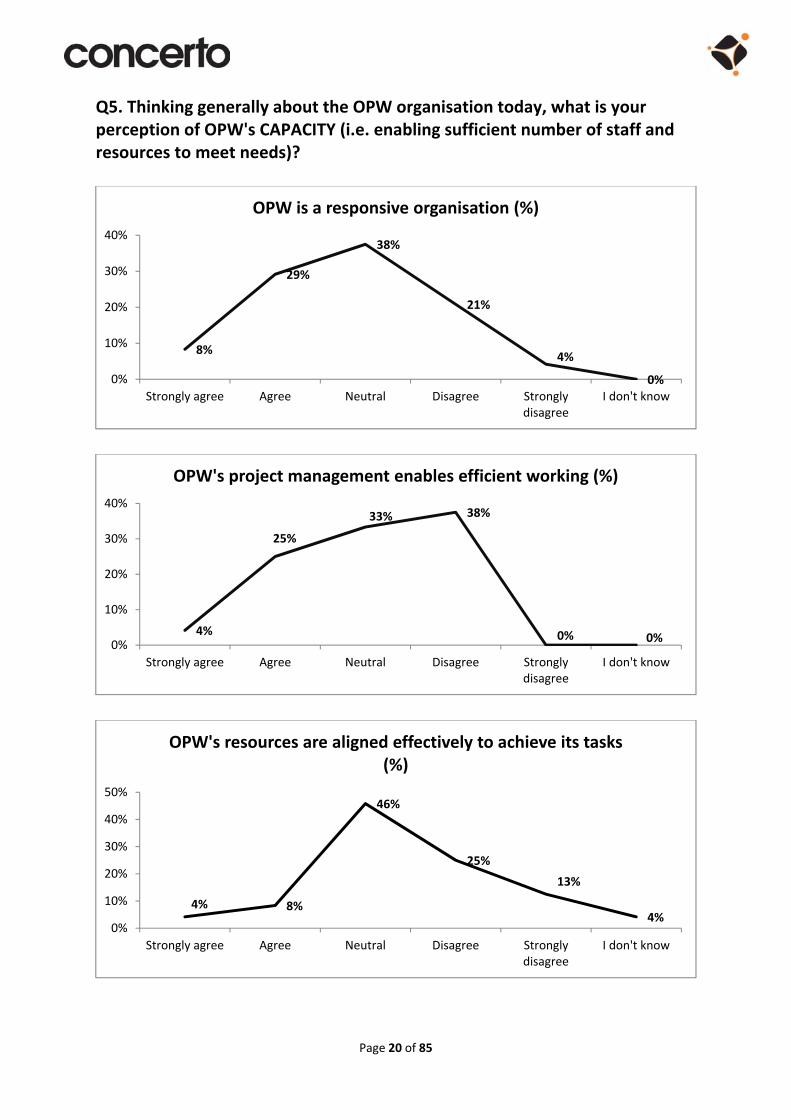
Q5. Thinking generally about the OPW organisation today, what is your perception of OPW's CAPACITY (i.e. enabling sufficient number of staff and resources to meet needs)?
8%
29%
38%
21%
4%
0%0%
10%
20%
30%
40%
Strongly agree Agree Neutral Disagree Stronglydisagree
I don't know
OPW is a responsive organisation (%)
4%
25%
33% 38%
0% 0%0%
10%
20%
30%
40%
Strongly agree Agree Neutral Disagree Stronglydisagree
I don't know
OPW's project management enables efficient working (%)
4% 8%
46%
25%
13%
4%0%
10%
20%
30%
40%
50%
Strongly agree Agree Neutral Disagree Stronglydisagree
I don't know
OPW's resources are aligned effectively to achieve its tasks (%)

Page 21 of 85
13%
25%
46%
13%
0% 4%0%
10%
20%
30%
40%
50%
Strongly agree Agree Neutral Disagree Stronglydisagree
I don't know
OPW has the right mix of skills to deliver its services (%)
4%
21%
38%
21%
13%
4%0%
10%
20%
30%
40%
Strongly agree Agree Neutral Disagree Stronglydisagree
I don't know
OPW's culture/ethos supports effective service delivery (%)
8%8%
42%
8%
17%17%
0%
10%
20%
30%
40%
50%
Strongly agree Agree Neutral Disagree Stronglydisagree
I don't know
OPW's technology supports efficient service delivery (%)

Page 22 of 85
17%
54%
8% 8% 4%8%
0%
10%
20%
30%
40%
50%
60%
Strongly agree Agree Neutral Disagree Stronglydisagree
I don't know
The OPW are effective in the delivery of building maintenance (%)
0%
42%
21%
17%
4%
17%
0%
10%
20%
30%
40%
50%
Strongly agree Agree Neutral Disagree Stronglydisagree
I don't know
The OPW are effective in the delivery of accommodation (%)
0%
25%
42%
21%
4% 8%
0%
10%
20%
30%
40%
50%
Strongly agree Agree Neutral Disagree Stronglydisagree
I don't know
OPW has sufficient resources to produce solutions that are best value‐for‐money for Government as a whole (%)

Page 23 of 85
Q7. Thinking generally about the OPW organisation today, what is your perception of OPW's CAPABILITY (i.e. experience, ability, knowledge and skills) in terms of the following factors?
0%
42%
21%29%
0%
8%
0%
10%
20%
30%
40%
50%
Strongly agree Agree Neutral Disagree Stronglydisagree
I don't know
OPW has sufficient specialist resources to meet requirements (%)
0%
17%
38%
33%
8%
4%0%
10%
20%
30%
40%
Strongly agree Agree Neutral Disagree Stronglydisagree
I don't know
OPW's organisation is agile (%)
0%
21%
29%
42%
8%
0%0%
10%
20%
30%
40%
50%
Strongly agree Agree Neutral Disagree Stronglydisagree
I don't know
OPW's organisational structure is effective for service delivery (%)

Page 24 of 85
4%
25%
42%
21%
0%8%
0%
10%
20%
30%
40%
50%
Strongly agree Agree Neutral Disagree Stronglydisagree
I don't know
OPW has the right mix of expertise to deliver (%)
0%
25%
33%
25%
13%
4%0%
10%
20%
30%
40%
Strongly agree Agree Neutral Disagree Stronglydisagree
I don't know
OPW's culture/ethos supports effective service delivery (%)
0%
33%
50%
17%
0%0%0%
10%
20%
30%
40%
50%
60%
Strongly agree Agree Neutral Disagree Stronglydisagree
I don't know
OPW knows how to deliver value‐for‐money solutions across Government (%)

Page 25 of 85
Q9. Generally speaking, how well does OPW meet your requirements?
4%
29%
38%
13%
8%8%
0%
10%
20%
30%
40%
Extremely well Very well Reasonably well Slightly Not well I don't know
OPW deliver the projects/services in a timely fashion (%)
4%
42%
29%
13%4% 8%
0%
10%
20%
30%
40%
50%
Extremely well Very well Reasonably well Slightly Not well I don't know
Provide accommodation/property services to a quality standard (%)
17%
33%33%
8%
0%
8%
0%
10%
20%
30%
40%
Extremely well Very well Reasonably well Slightly Not well I don't know
Provide maintenance and building services to a quality standard (%)
Page 26 of 85
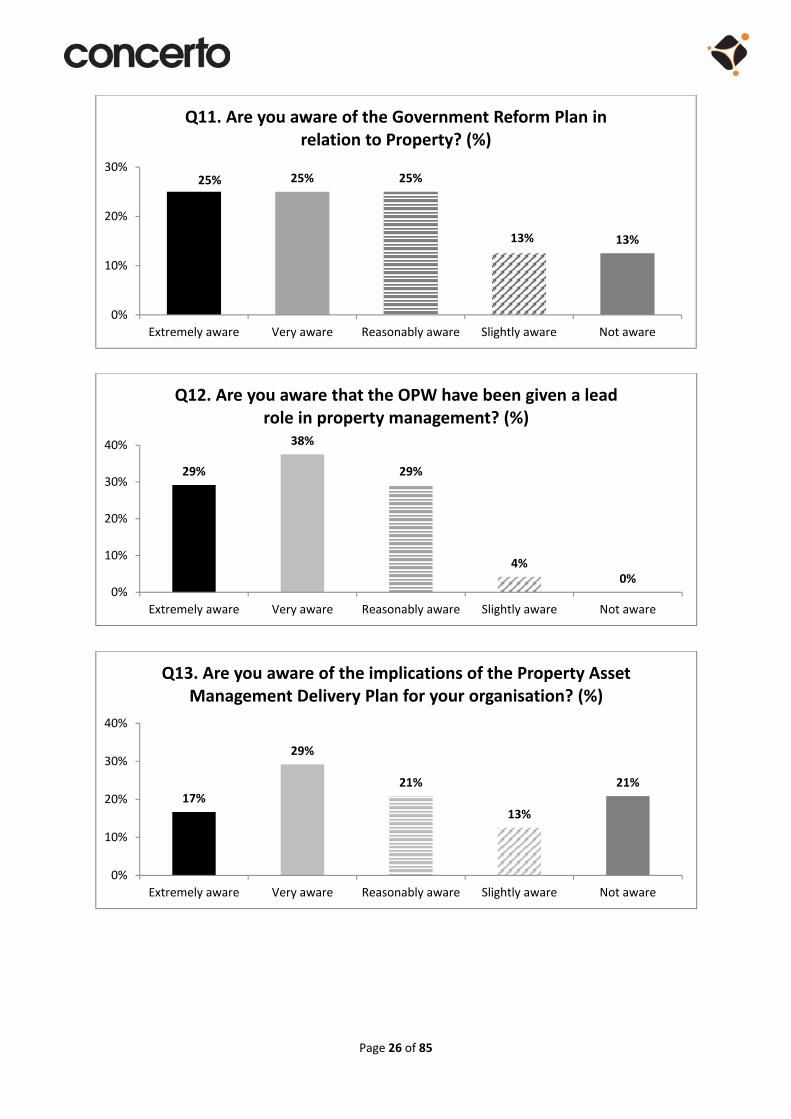
25% 25% 25%
13% 13%
0%
10%
20%
30%
Extremely aware Very aware Reasonably aware Slightly aware Not aware
Q11. Are you aware of the Government Reform Plan in relation to Property? (%)
29%
38%
29%
4%0%
0%
10%
20%
30%
40%
Extremely aware Very aware Reasonably aware Slightly aware Not aware
Q12. Are you aware that the OPW have been given a lead role in property management? (%)
17%
29%
21%
13%
21%
0%
10%
20%
30%
40%
Extremely aware Very aware Reasonably aware Slightly aware Not aware
Q13. Are you aware of the implications of the Property Asset Management Delivery Plan for your organisation? (%)

Page 27 of 85
Staff Questionnaire – Results
2%
14%18%
10%
56%
0%
10%
20%
30%
40%
50%
60%
Less than 5 years 5 ‐ 10 years 11 ‐ 15 years 16 ‐ 20 years More than 20 years
Q1. How many years have you worked in the Civil Service? (%)
12%
26%
17%
8%
36%
0%
10%
20%
30%
40%
Less than 5 years 5 ‐ 10 years 11 ‐ 15 years 16 ‐ 20 years More than 20 years
Q2. How many years have you worked in the Office of Public Works? (%)

Page 28 of 85
27%
18%
10%
8%
6%
5%
5%
5%
2%
2%1%
10%
Q3. What OPW function do you work in? (%)
Property Maintenance (including Health and Safety,Fire and Security and Furniture Services)
Architectural and Conservation Services
Property Management
Engineering Services
General Corporate Services ‐ Press & Information,Policy, Library and Internal Facilities
Finance & Accounts, Freedom of Information andLegal Services
Personnel and Development
Project Management
ICT
Valuation Services
Quantity Surveying Services
Other (please specify):
41%
37%
22%
Q4. Please select your staff category and grade (%):
Administrative/General ServicesGradeProfessional/Technical/SpecialistGradeState Industrial Employee
Page 29 of 85
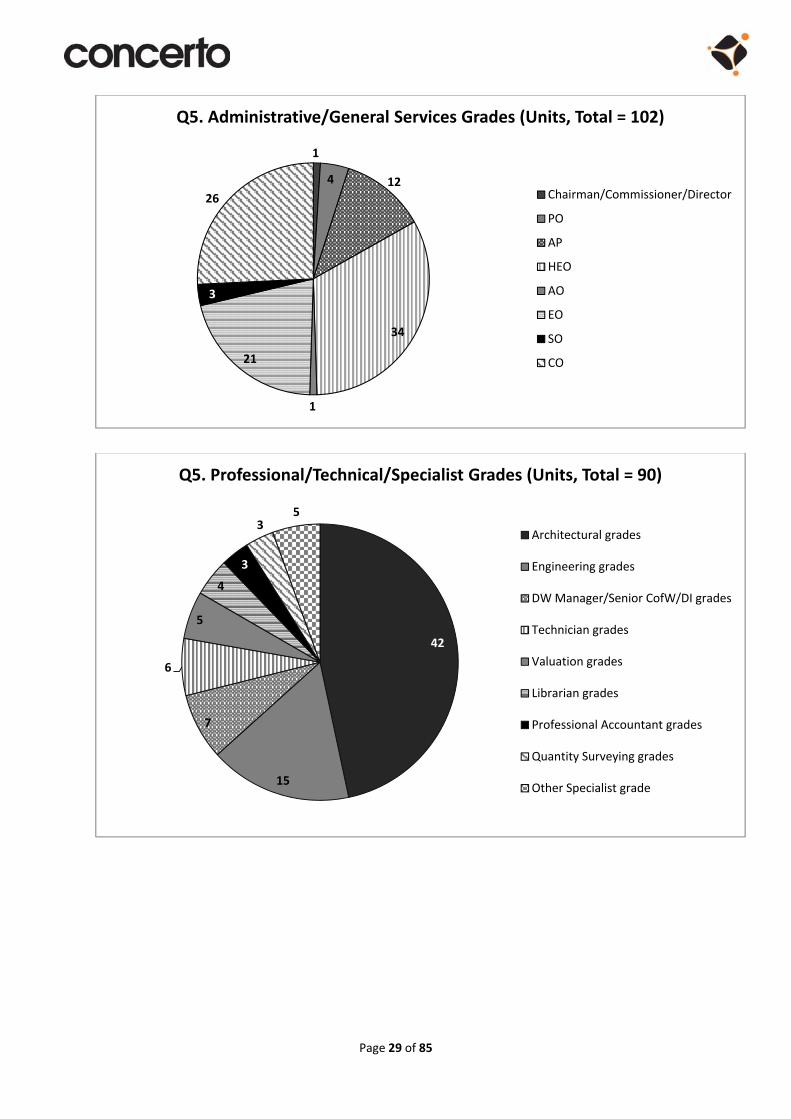
1
4 12
34
1
21
3
26
Q5. Administrative/General Services Grades (Units, Total = 102)
Chairman/Commissioner/Director
PO
AP
HEO
AO
EO
SO
CO
42
15
7
6
5
4
3
35
Q5. Professional/Technical/Specialist Grades (Units, Total = 90)
Architectural grades
Engineering grades
DW Manager/Senior CofW/DI grades
Technician grades
Valuation grades
Librarian grades
Professional Accountant grades
Quantity Surveying grades
Other Specialist grade
Page 30 of 85
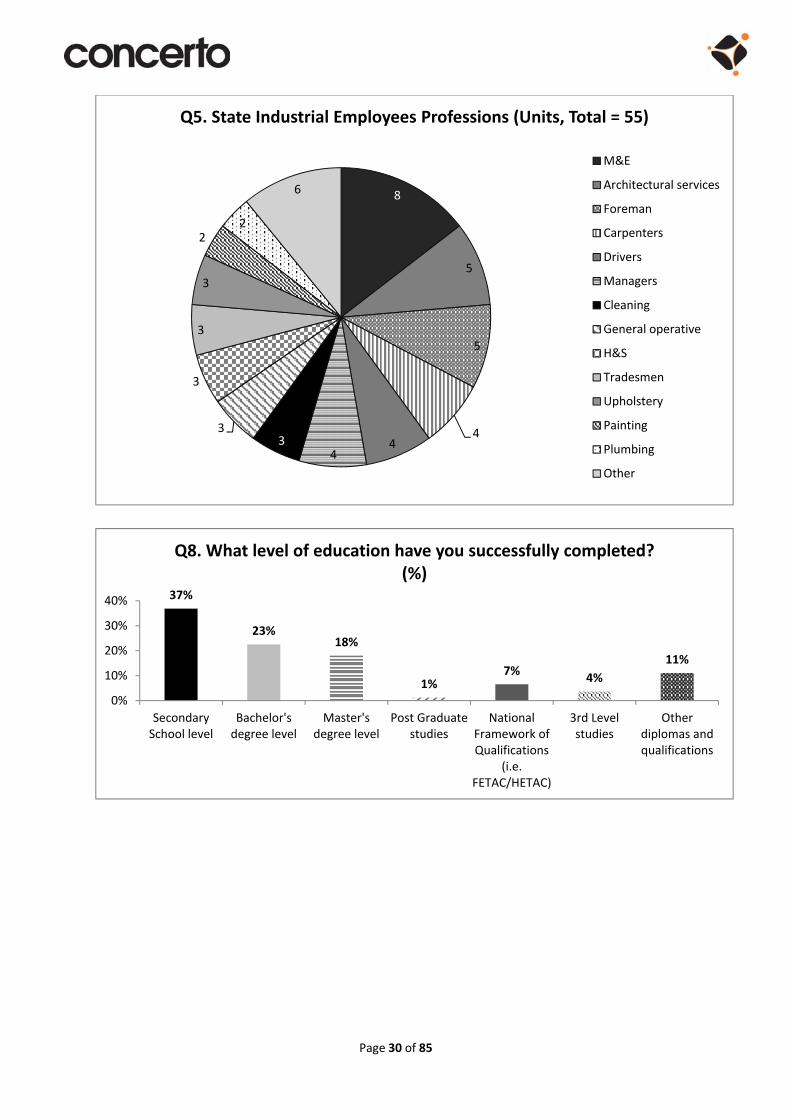
8
5
5
44
43
3
3
3
3
22
6
Q5. State Industrial Employees Professions (Units, Total = 55)
M&E
Architectural services
Foreman
Carpenters
Drivers
Managers
Cleaning
General operative
H&S
Tradesmen
Upholstery
Painting
Plumbing
Other
37%
23%18%
1%7%
4%
11%
0%
10%
20%
30%
40%
SecondarySchool level
Bachelor'sdegree level
Master'sdegree level
Post Graduatestudies
NationalFramework ofQualifications
(i.e.FETAC/HETAC)
3rd Levelstudies
Otherdiplomas andqualifications
Q8. What level of education have you successfully completed? (%)
Page 31 of 85
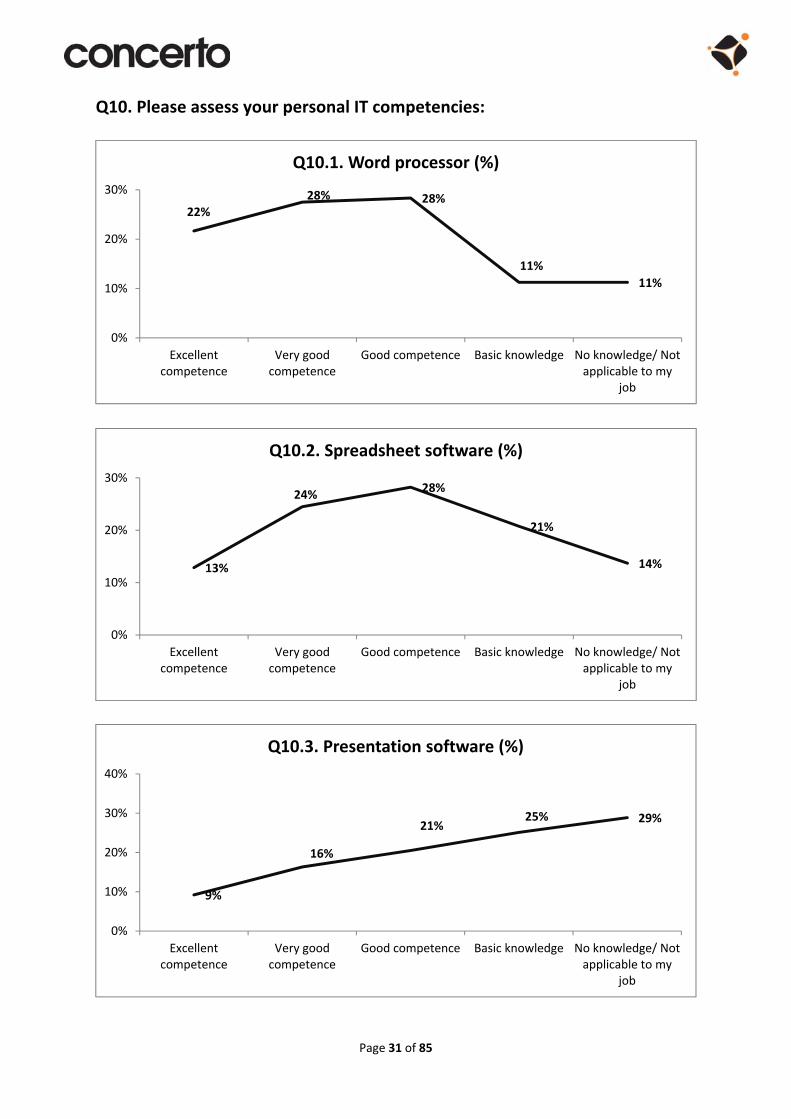
Q10. Please assess your personal IT competencies:
22%28% 28%
11%
11%
0%
10%
20%
30%
Excellentcompetence
Very goodcompetence
Good competence Basic knowledge No knowledge/ Notapplicable to my
job
Q10.1. Word processor (%)
13%
24%28%
21%
14%
0%
10%
20%
30%
Excellentcompetence
Very goodcompetence
Good competence Basic knowledge No knowledge/ Notapplicable to my
job
Q10.2. Spreadsheet software (%)
9%
16%
21%25% 29%
0%
10%
20%
30%
40%
Excellentcompetence
Very goodcompetence
Good competence Basic knowledge No knowledge/ Notapplicable to my
job
Q10.3. Presentation software (%)

Page 32 of 85
3%8%
14% 23%
52%
0%
10%
20%
30%
40%
50%
60%
Excellentcompetence
Very goodcompetence
Good competence Basic knowledge No knowledge/ Notapplicable to my
job
Q10.4. Project Management software (%)
5% 7%
18% 26%
45%
0%
10%
20%
30%
40%
50%
Excellentcompetence
Very goodcompetence
Good competence Basic knowledge No knowledge/ Notapplicable to my
job
Q10.5. Property management software (i.e. Property system/Visibility) (%)
9% 11% 8%10%
62%
0%
10%
20%
30%
40%
50%
60%
70%
Excellentcompetence
Very goodcompetence
Good competence Basic knowledge No knowledge/ Notapplicable to my
job
Q10.6. Design/CAD software (%)

Page 33 of 85
5% 5%10%
20%
59%
0%
10%
20%
30%
40%
50%
60%
70%
Excellentcompetence
Very goodcompetence
Good competence Basic knowledge No knowledge/ Notapplicable to my
job
Q10.7. Finance/Accounting software (%)
6% 11%
21% 23%
39%
0%
10%
20%
30%
40%
50%
Excellentcompetence
Very goodcompetence
Good competence Basic knowledge No knowledge/ Notapplicable to my
job
Q10.8. Web‐based applications (%)
3%
13%
13%
35%36%
0%
10%
20%
30%
40%
Excellentcompetence
Very goodcompetence
Good competence Basic knowledge No knowledge/ Notapplicable to my
job
Q10.9. Document‐sharing applications (e.g. Alfresco, Dropbox) (%)
Page 34 of 85
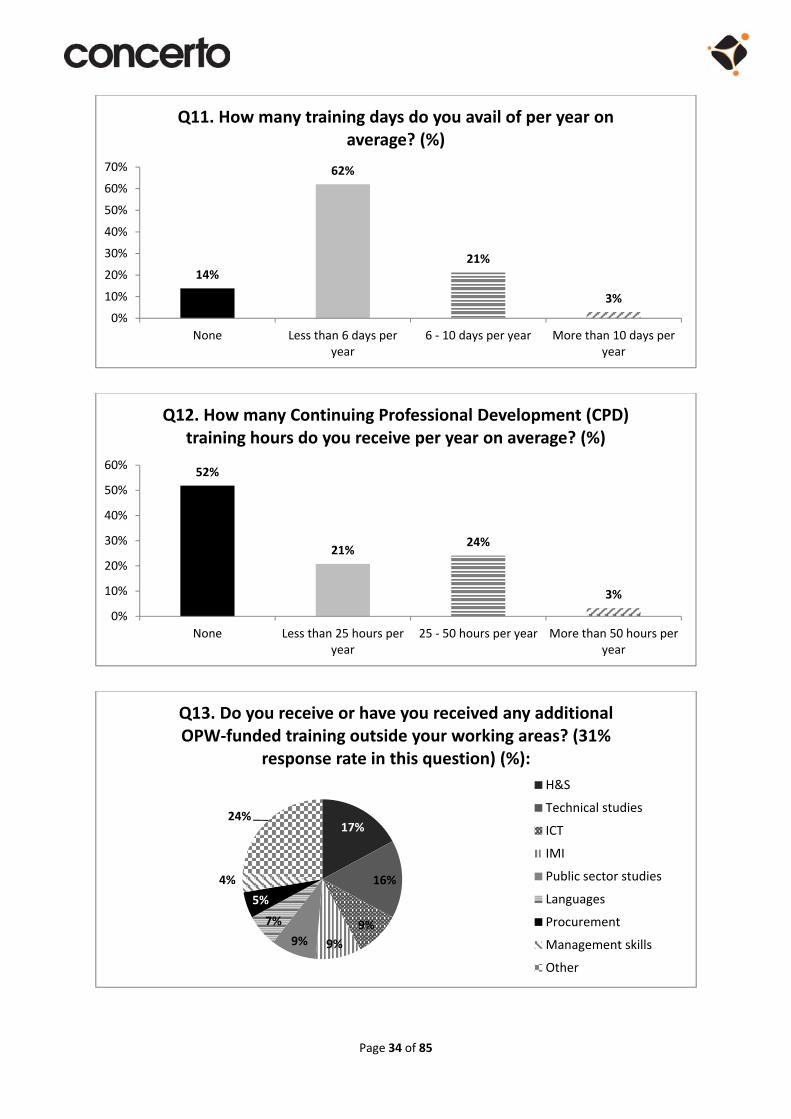
14%
62%
21%
3%
0%
10%
20%
30%
40%
50%
60%
70%
None Less than 6 days peryear
6 ‐ 10 days per year More than 10 days peryear
Q11. How many training days do you avail of per year on average? (%)
52%
21%24%
3%
0%
10%
20%
30%
40%
50%
60%
None Less than 25 hours peryear
25 ‐ 50 hours per year More than 50 hours peryear
Q12. How many Continuing Professional Development (CPD) training hours do you receive per year on average? (%)
17%
16%
9%
9%9%
7%
5%
4%
24%
Q13. Do you receive or have you received any additional OPW‐funded training outside your working areas? (31%
response rate in this question) (%):
H&S
Technical studies
ICT
IMI
Public sector studies
Languages
Procurement
Management skills
Other
Page 35 of 85
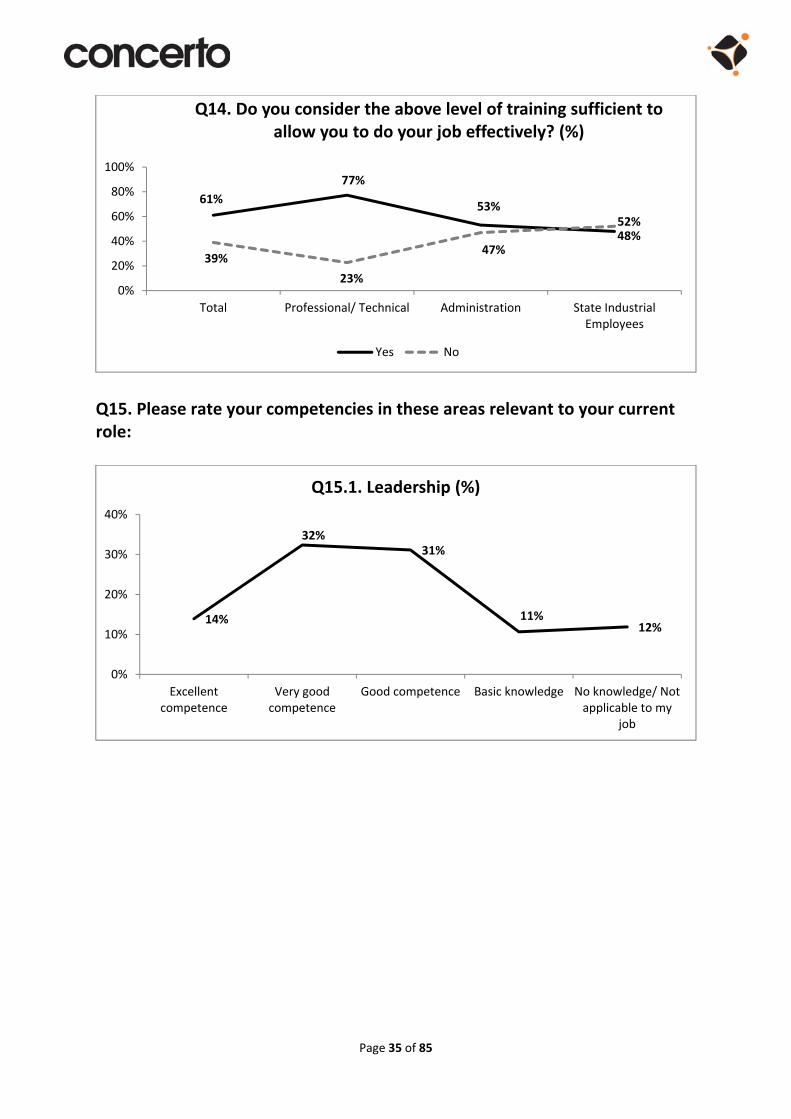
Q15. Please rate your competencies in these areas relevant to your current role:
61%
77%
53%
48%
39%
23%
47%
52%
0%
20%
40%
60%
80%
100%
Total Professional/ Technical Administration State IndustrialEmployees
Q14. Do you consider the above level of training sufficient to allow you to do your job effectively? (%)
Yes No
14%
32%31%
11%12%
0%
10%
20%
30%
40%
Excellentcompetence
Very goodcompetence
Good competence Basic knowledge No knowledge/ Notapplicable to my
job
Q15.1. Leadership (%)

Page 36 of 85
19%
32%
18%
8%
24%
0%
10%
20%
30%
40%
Excellentcompetence
Very goodcompetence
Good competence Basic knowledge No knowledge/ Notapplicable to my
job
Q15.2. Professional / Technical expertise (%)
11%
29% 31%
14%
14%
0%
10%
20%
30%
40%
Excellentcompetence
Very goodcompetence
Good competence Basic knowledge No knowledge/ Notapplicable to my
job
Q15.3. Use of ICT to support your job (%)
15%
38%
32%
6%9%
0%
10%
20%
30%
40%
Excellentcompetence
Very goodcompetence
Good competence Basic knowledge No knowledge/ Notapplicable to my
job
Q15.4. General administration (%)

Page 37 of 85
10%
33%
26%
19%
12%
0%
10%
20%
30%
40%
Excellentcompetence
Very goodcompetence
Good competence Basic knowledge No knowledge/ Notapplicable to my
job
Q15.5. Understanding of the legal aspects relevant to your role (e.g. Procurement Law, Health & Safety, building
regulations...) (%)
7%
24% 23%
20%
26%
0%
10%
20%
30%
Excellentcompetence
Very goodcompetence
Good competence Basic knowledge No knowledge/ Notapplicable to my
job
Q15.6. Procurement (%)
20%
34%
24%
12%
11%
0%
10%
20%
30%
40%
Excellentcompetence
Very goodcompetence
Good competence Basic knowledge No knowledge/ Notapplicable to my
job
Q15.7. Client/Customer Service and Relationship Management (%)

Page 38 of 85
13%
26%
21%
15%
26%
0%
10%
20%
30%
Excellentcompetence
Very goodcompetence
Good competence Basic knowledge No knowledge/ Notapplicable to my
job
Q15.8. Project Management (%)
7%
13%18% 23%
39%
0%
10%
20%
30%
40%
50%
Excellentcompetence
Very goodcompetence
Good competence Basic knowledge No knowledge/ Notapplicable to my
job
Q15.9. Property Management (%)
13%19% 17%
19%
32%
0%
10%
20%
30%
40%
Excellentcompetence
Very goodcompetence
Good competence Basic knowledge No knowledge/ Notapplicable to my
job
Q15.10. Property Maintenance (%)

Page 39 of 85
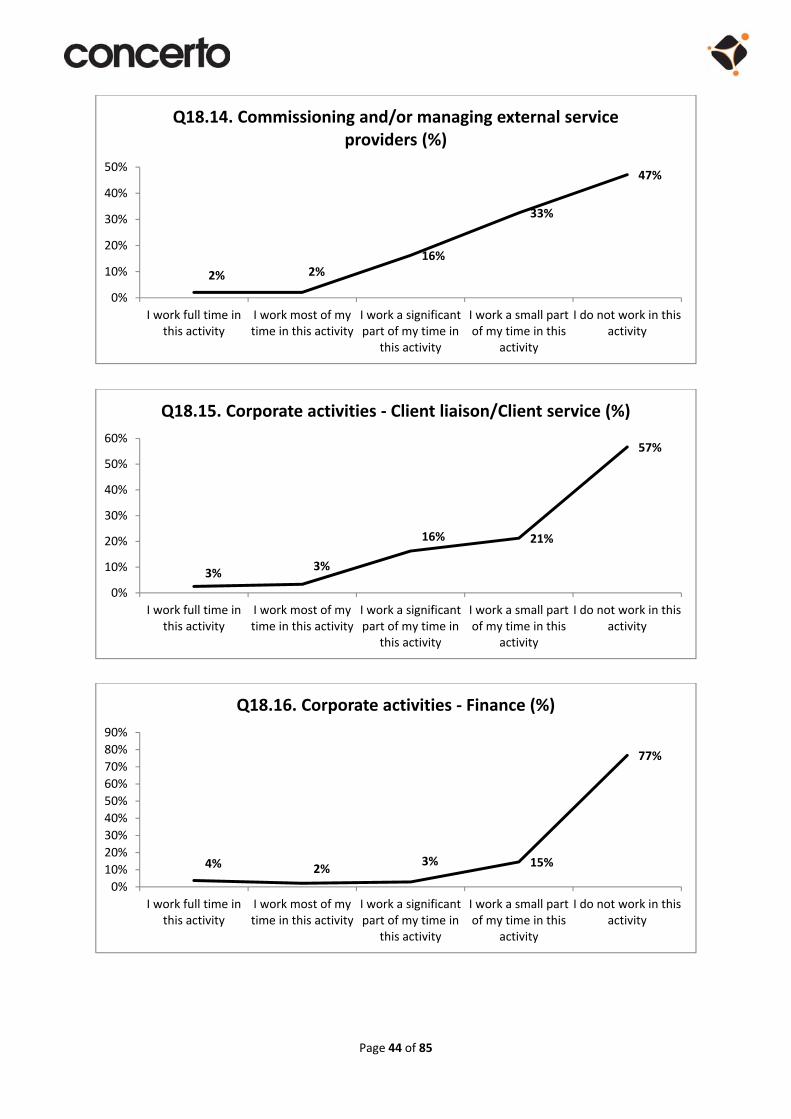
Q18. How do you generally spend your time? Please select the amount of time you spend on each activity relevant to your current role:
18%
33%
21%
11% 16%
0%
10%
20%
30%
40%
Excellentcompetence
Very goodcompetence
Good competence Basic knowledge No knowledge/ Notapplicable to my
job
Q15.11. People Management (%)
32%
49%
13%
6%
0%
10%
20%
30%
40%
50%
60%
Completely reliant Mostly reliant Slightly reliant Not reliant
Q16. How reliant are you on technology to do your job? (%)
5%5%
28%29% 33%
0%
10%
20%
30%
40%
I work full time inthis activity
I work most of mytime in this activity
I work a significantpart of my time in
this activity
I work a small partof my time in this
activity
I do not work in thisactivity
Q18.1. Planning specific projects (%)

Page 40 of 85
1%
6%
18%20%
55%
0%
10%
20%
30%
40%
50%
60%
I work full time inthis activity
I work most of mytime in this activity
I work a significantpart of my time in
this activity
I work a small partof my time in this
activity
I do not work in thisactivity
Q18.2. Designing specific projects (%)
3% 5%
17%18%
57%
0%
10%
20%
30%
40%
50%
60%
70%
I work full time inthis activity
I work most of mytime in this activity
I work a significantpart of my time in
this activity
I work a small partof my time in this
activity
I do not work in thisactivity
Q18.3. On site managing/supervising specific projects (%)
2% 3%
10%16%
69%
0%10%
20%
30%
40%
50%
60%
70%80%
I work full time inthis activity
I work most of mytime in this activity
I work a significantpart of my time in
this activity
I work a small partof my time in this
activity
I do not work in thisactivity
Q18.4. Managing assets and maintenance/Facilities management (%)
Page 41 of 85
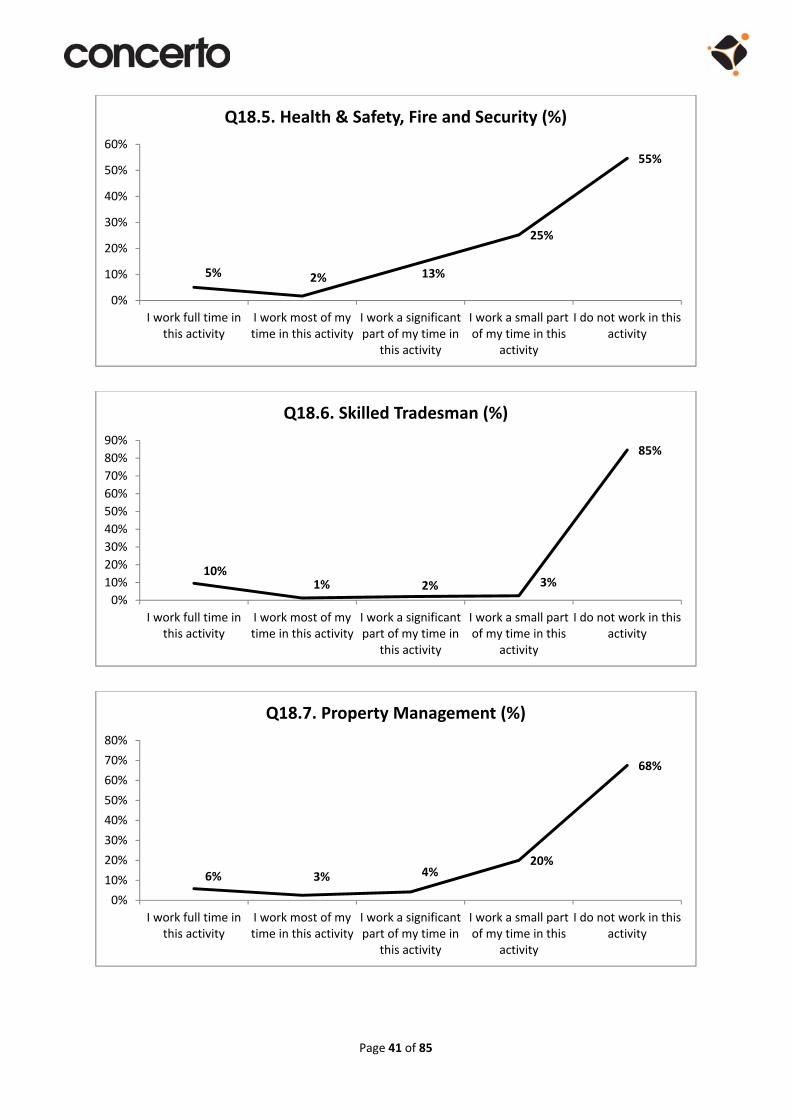
5% 2% 13%
25%
55%
0%
10%
20%
30%
40%
50%
60%
I work full time inthis activity
I work most of mytime in this activity
I work a significantpart of my time in
this activity
I work a small partof my time in this
activity
I do not work in thisactivity
Q18.5. Health & Safety, Fire and Security (%)
10%1% 2% 3%
85%
0%
10%
20%
30%
40%
50%
60%
70%
80%
90%
I work full time inthis activity
I work most of mytime in this activity
I work a significantpart of my time in
this activity
I work a small partof my time in this
activity
I do not work in thisactivity
Q18.6. Skilled Tradesman (%)
6% 3% 4%20%
68%
0%
10%
20%
30%
40%
50%
60%
70%
80%
I work full time inthis activity
I work most of mytime in this activity
I work a significantpart of my time in
this activity
I work a small partof my time in this
activity
I do not work in thisactivity
Q18.7. Property Management (%)

Page 42 of 85
0% 1%
7%12%
80%
0%
10%
20%
30%
40%
50%
60%
70%
80%
90%
I work full time inthis activity
I work most of mytime in this activity
I work a significantpart of my time in
this activity
I work a small partof my time in this
activity
I do not work in thisactivity
Q18.8. Property Transactions (%)
1%3%
16%
29%
51%
0%
10%
20%
30%
40%
50%
60%
I work full time inthis activity
I work most of mytime in this activity
I work a significantpart of my time in
this activity
I work a small partof my time in this
activity
I do not work in thisactivity
Q18.9. Procurement (%)
5%
5%
20%20%
51%
0%
10%
20%
30%
40%
50%
60%
I work full time inthis activity
I work most of mytime in this activity
I work a significantpart of my time in
this activity
I work a small partof my time in this
activity
I do not work in thisactivity
Q18.10. Project Management (%)

Page 43 of 85
0% 0% 4% 13%
83%
0%
10%
20%
30%
40%
50%
60%
70%
80%
90%
I work full time inthis activity
I work most of mytime in this activity
I work a significantpart of my time in
this activity
I work a small partof my time in this
activity
I do not work in thisactivity
Q18.11. Valuations (%)
4% 3%
17%21%
56%
0%
10%
20%
30%
40%
50%
60%
I work full time inthis activity
I work most of mytime in this activity
I work a significantpart of my time in
this activity
I work a small partof my time in this
activity
I do not work in thisactivity
Q18.12. Professional Advice (%)
7% 7%
18%21%
47%
0%
10%
20%
30%
40%
50%
I work full time inthis activity
I work most of mytime in this activity
I work a significantpart of my time in
this activity
I work a small partof my time in this
activity
I do not work in thisactivity
Q18.13. Managing OPW staff to deliver projects or services (%)
Page 44 of 85
2% 2%16%
33%
47%
0%
10%
20%
30%
40%
50%
I work full time inthis activity
I work most of mytime in this activity
I work a significantpart of my time in
this activity
I work a small partof my time in this
activity
I do not work in thisactivity
Q18.14. Commissioning and/or managing external service providers (%)
3%3%
16% 21%
57%
0%
10%
20%
30%
40%
50%
60%
I work full time inthis activity
I work most of mytime in this activity
I work a significantpart of my time in
this activity
I work a small partof my time in this
activity
I do not work in thisactivity
Q18.15. Corporate activities ‐ Client liaison/Client service (%)
4% 2%3% 15%
77%
0%
10%
20%
30%
40%
50%
60%
70%
80%
90%
I work full time inthis activity
I work most of mytime in this activity
I work a significantpart of my time in
this activity
I work a small partof my time in this
activity
I do not work in thisactivity
Q18.16. Corporate activities ‐ Finance (%)

Page 45 of 85
2% 0%3% 14%
81%
0%
10%
20%
30%
40%
50%
60%
70%
80%
90%
I work full time inthis activity
I work most of mytime in this activity
I work a significantpart of my time in
this activity
I work a small partof my time in this
activity
I do not work in thisactivity
Q18.17. Corporate activities ‐ ICT (%)
3% 1% 1% 12%
82%
0%
10%
20%
30%
40%
50%
60%
70%
80%
90%
I work full time inthis activity
I work most of mytime in this activity
I work a significantpart of my time in
this activity
I work a small partof my time in this
activity
I do not work in thisactivity
Q18.18. Corporate activities ‐ HR/Personnel (%)
0% 0%3% 12%
85%
0%
10%
20%
30%
40%
50%
60%
70%
80%
90%
I work full time inthis activity
I work most of mytime in this activity
I work a significantpart of my time in
this activity
I work a small partof my time in this
activity
I do not work in thisactivity
Q18.19. Corporate activities ‐ Legal (%)

Page 46 of 85
2% 3%5% 15%
76%
0%
10%
20%
30%
40%
50%
60%
70%
80%
I work full time inthis activity
I work most of mytime in this activity
I work a significantpart of my time in
this activity
I work a small partof my time in this
activity
I do not work in thisactivity
Q18.20. Corporate activities ‐Management (%)
9%
36%
52%
2% 0%0%
10%
20%
30%
40%
50%
60%
Far too high Too high About right Too light Far too light
Q20. How would you describe your current workload? (%)

Page 47 of 85
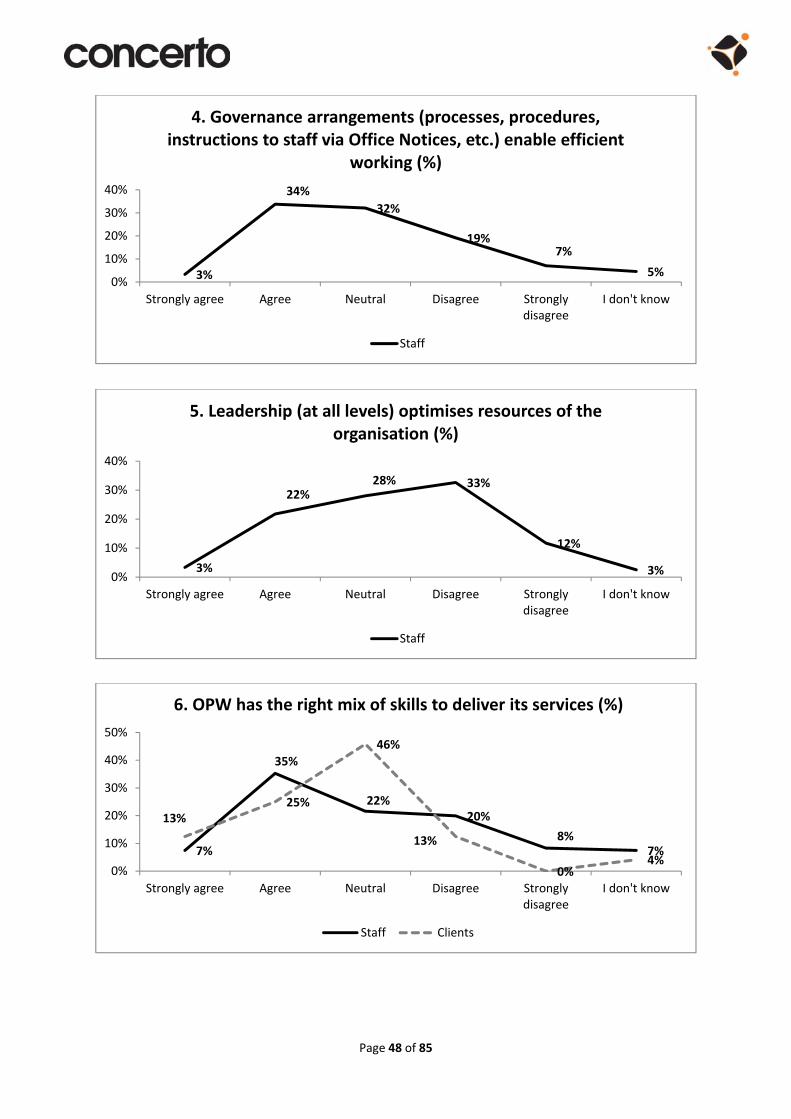
Q21. Thinking generally about the OPW organisation today, how would you describe OPW's CAPACITY (i.e. enabling sufficient number of staff and resources to meet needs)?
19%
48%
21%
7%2%
3%8%
29%
38%
21%
4%
0%0%
10%
20%
30%
40%
50%
60%
Strongly agree Agree Neutral Disagree Stronglydisagree
I don't know
1. OPW is a responsive organisation (%)
Staff Clients
3%
31%29%
18%
6%
13%
4%
25%
33% 38%
0% 0%0%
10%
20%
30%
40%
Strongly agree Agree Neutral Disagree Stronglydisagree
I don't know
2. OPW's project management enables efficient working (%)
Staff Clients
2%
21% 30%31%
9%7%4% 8%
46%
25%13%
4%0%
10%
20%
30%
40%
50%
Strongly agree Agree Neutral Disagree Stronglydisagree
I don't know
3. OPW's resources are aligned effectively to achieve its tasks (%)
Staff Clients
Page 48 of 85
3%
34%
32%
19%7%
5%0%
10%
20%
30%
40%
Strongly agree Agree Neutral Disagree Stronglydisagree
I don't know
4. Governance arrangements (processes, procedures, instructions to staff via Office Notices, etc.) enable efficient
working (%)
Staff
3%
22%28% 33%
12%
3%0%
10%
20%
30%
40%
Strongly agree Agree Neutral Disagree Stronglydisagree
I don't know
5. Leadership (at all levels) optimises resources of the organisation (%)
Staff
7%
35%
22%20%
8%7%
13%25%
46%
13%
0%4%
0%
10%
20%
30%
40%
50%
Strongly agree Agree Neutral Disagree Stronglydisagree
I don't know
6. OPW has the right mix of skills to deliver its services (%)
Staff Clients

Page 49 of 85
8%
41%
26%15%
7%4%4%
21%
38%
21%
13%
4%0%
10%
20%
30%
40%
50%
Strongly agree Agree Neutral Disagree Stronglydisagree
I don't know
7. OPW's culture/ethos supports effective service delivery (%)
Staff Clients
2%
28% 27%26%
13%
5%
8%8%
42%
8%
17%17%
0%
10%
20%
30%
40%
50%
Strongly agree Agree Neutral Disagree Stronglydisagree
I don't know
8. OPW's technology supports efficient service delivery (%)
Staff Clients
2%
17%
32%
26%
14%
10%
0%
5%
10%
15%
20%
25%
30%
35%
Strongly agree Agree Neutral Disagree Stronglydisagree
I don't know
9. OPW’s performance management system produces positive results (%)
Staff
Page 50 of 85
3%
15%
35%
15%
4%
29%
0%
10%
20%
30%
40%
Strongly agree Agree Neutral Disagree Stronglydisagree
I don't know
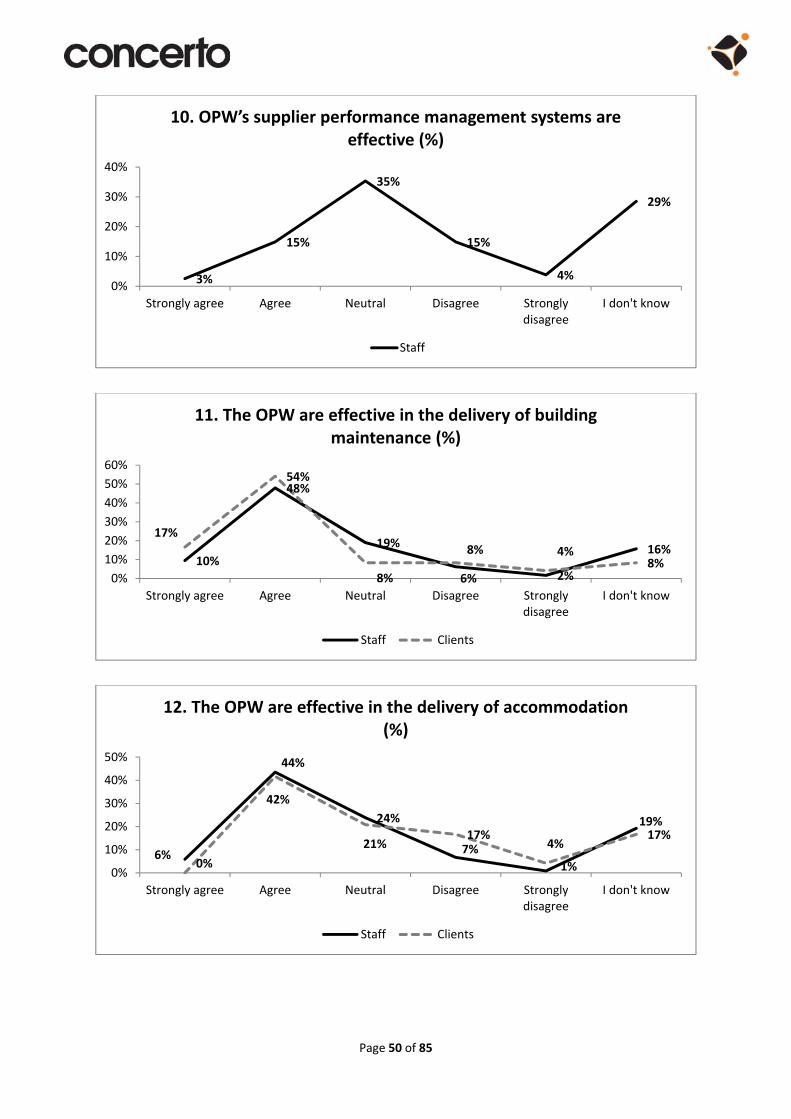
10. OPW’s supplier performance management systems are effective (%)
Staff
10%
48%
19%
6% 2%
16%
17%
54%
8%
8% 4%8%
0%
10%
20%
30%
40%
50%
60%
Strongly agree Agree Neutral Disagree Stronglydisagree
I don't know
11. The OPW are effective in the delivery of building maintenance (%)
Staff Clients
6%
44%
24%
7%
1%
19%
0%
42%
21%17%
4%17%
0%
10%
20%
30%
40%
50%
Strongly agree Agree Neutral Disagree Stronglydisagree
I don't know
12. The OPW are effective in the delivery of accommodation (%)
Staff Clients

Page 51 of 85
Q23. Thinking generally about the OPW organisation today, how would you describe OPW's CAPABILITY (i.e. experience, ability, knowledge and skills) in terms of the following factors?
7%
28%26%
23%
5% 11%
0%
25%
42%
21%
4%8%
0%
10%
20%
30%
40%
50%
Strongly agree Agree Neutral Disagree Stronglydisagree
I don't know
13. OPW has sufficient resources to produce solutions that are best value‐for‐money for Government as a whole (%)
Staff Clients
6%
23%
26%
22%10%
13%
0%
42%
21%
29%
0% 8%
0%
10%
20%
30%
40%
50%
Strongly agree Agree Neutral Disagree Stronglydisagree
I don't know
14. OPW has sufficient specialist resources to meet requirements (%)
Staff Clients
8%
37%
28%
18%
5%
5%
0%
17%
38%
33%
8%
4%0%
10%
20%
30%
40%
Strongly agree Agree Neutral Disagree Stronglydisagree
I don't know
1. OPW's organisation is agile (%)
Staff Clients

Page 52 of 85
3%
37%
23%
25%
7%5%
0%
21%
29% 42%
8%
0%0%
10%
20%
30%
40%
50%
Strongly agree Agree Neutral Disagree Stronglydisagree
I don't know
2. OPW's organisational structure is effective for service delivery (%)
Staff Clients
3%
24%
38%
22%
5%8%
0%
10%
20%
30%
40%
Strongly agree Agree Neutral Disagree Stronglydisagree
I don't know
3. Governance (i.e. delegated authorities, approval forms) optimises the use of skills (%)
Staff
9%
50%
20%
15%4%
2%0%
10%
20%
30%
40%
50%
60%
Strongly agree Agree Neutral Disagree Stronglydisagree
I don't know
4. OPW supports staff in improving their skills (%)
Staff

Page 53 of 85
8%
34%
27%
16% 7% 9%
4%
25%
42%
21%
0%
8%
0%
10%
20%
30%
40%
50%
Strongly agree Agree Neutral Disagree Stronglydisagree
I don't know
5. OPW has the right mix of skills to deliver its services (%)
Staff Clients
8%
39%
28%
15%6% 3%
0%
25%
33%25%
13%4%
0%
10%
20%
30%
40%
50%
Strongly agree Agree Neutral Disagree Stronglydisagree
I don't know
6. OPW's culture/ethos supports effective service delivery (%)
Staff Clients
3%
21%28%
31%
12%
5%0%
10%
20%
30%
40%
Strongly agree Agree Neutral Disagree Stronglydisagree
I don't know
7. OPW's management matches the best skills to tasks (%)
Staff

Page 54 of 85
2%
24%
31%
23%
13%
7%
0%
10%
20%
30%
40%
Strongly agree Agree Neutral Disagree Stronglydisagree
I don't know
8. OPW's technology supports quality solutions (%)
Staff
3%
28%
34%
17%9%
9%
0%
10%
20%
30%
40%
Strongly agree Agree Neutral Disagree Stronglydisagree
I don't know
9. OPW's processes support quality solutions (%)
Staff
2%
22%
33%
25%
12%
6%
0%
10%
20%
30%
40%
Strongly agree Agree Neutral Disagree Stronglydisagree
I don't know
10. Internal performance management systems foster skills development (%)
Staff

Page 55 of 85
2%
11%
37%
14%
8%
29%
0%
10%
20%
30%
40%
Strongly agree Agree Neutral Disagree Stronglydisagree
I don't know
11. OPW's supplier performance management system drive knowledge transfer (%)
Staff
7%
38%
30%
9%
6% 10%
0%
33%
50%
17%
0% 0%0%
10%
20%
30%
40%
50%
60%
Strongly agree Agree Neutral Disagree Stronglydisagree
I don't know
12. OPW knows how to deliver value‐for‐money solutions across Government (%)
Staff Clients
21%
33%30%
10%
5%
0%
10%
20%
30%
40%
Completely aware Mostly aware Reasonably aware Slightly aware Unaware
Q25. How aware are you of OPW's mission and objectives? (%)

Page 56 of 85
Q27. How effective do you find OPW's Internal Communications?
3%
32%29%
31%
5%
0%
5%
10%
15%
20%
25%
30%
35%
Full High Neutral Low Unmotivated
Q26. How would you rate the level of motivation across OPW's staff? (%)
14%
37%34%
11%
4%
0%
5%
10%
15%
20%
25%
30%
35%
40%
Completely Highly Moderately Barely Irrelevant
1. Communications within your Business Unit (%)
2%
16%
49%
28%
5%
0%
10%
20%
30%
40%
50%
60%
Completely Highly Moderately Barely Irrelevant
2. Communications across multiple Business Units (%)

Page 57 of 85
3%
20%
50%
24%
4%
0%
10%
20%
30%
40%
50%
60%
Completely Highly Moderately Barely Irrelevant
3. Communications directed across the whole organisation (%)
20%
63%
18%
0%
10%
20%
30%
40%
50%
60%
70%
Fully empowered Sufficiently Insufficiently
Q28. Are you empowered to do your job? (%)
19%
66%
9% 7%
0%
10%
20%
30%
40%
50%
60%
70%
Yes, significant scope Yes, some scope None I don't know
Q29. Is there a scope to improve your effectiveness in delivering your goals? (%)

Page 58 of 85
8%
65%
18%
8%2%
0%
10%
20%
30%
40%
50%
60%
70%
Completely Mostly About right Slightly Not
Q31. Do you think OPW's clients are satisfied with the services provided by the Office? (%)
25%
46%
11% 9%6% 3%
0%
10%
20%
30%
40%
50%
None Up to 20% of mytime
Up to 40% of mytime
Up to 60% of mytime
Up to 80% of mytime
Up to 100% ofmy time
Q33. What percentage of time do you spend with OPW's clients? (%)
15%
22%
29%
18%16%
0%
5%
10%
15%
20%
25%
30%
35%
Extremely aware Very aware Reasonably aware Slightly aware Not aware
Q34. Are you aware of the Government Reform Plan in relation to Property? (%)

Page 59 of 85
27%
31%
24%
9% 9%
0%
10%
20%
30%
40%
Extremely aware Very aware Reasonably aware Slightly aware Not aware
Q35. Are you aware that the OPW have been given a lead role in property management? (%)
13%
20%23%
15%
29%
0%
10%
20%
30%
40%
Extremely aware Very aware Reasonably aware Slightly aware Not aware
Q36. Are you aware of any implications of the Property Asset Management Delivery Plan for your area within OPW? (%)

Page 60 of 85
Appendix 4 – International Comparators
1. Summary
1.1. Research This analysis was completed by face to face interviews by senior JLL staff with senior staff in the relevant
bodies, (with the exception of Finland conducted by telephone from UK after an appropriate introduction
from JLL Finland). In many cases the interviewee him/herself referred to their own website to address the
questions and website data has been used to complete the picture. A structured aide memoire was used as
a guide to conversation in order to secure a qualitative picture of the model applied and its success, rather
than a tick box high volume survey approach. Countries were picked in order to indicate a range of models,
a geographic and political/economic spread, and are generally those where JLL has some form of relationship
which would open doors to the right senior contacts. Owing to different country approaches to capturing
data the same metrics are not always consistently available but we have used what we can to give a picture
of portfolio scale. Data in local currencies has been converted to € at the rate prevailing on 1st January 2014.
Key themes emerging are picked out below.
1.2. Models Broadly there are two very different models:
A centralised approach where a single agency (or agencies e.g. Holland) is responsible for
some or all of the estate; and
A decentralised approach where occupying departments lead on estate management, and
are guided by a central policy / monitoring body.
Further variations and nuances are summarised in the country profiles following.
1.3. Funding The centralised agencies are all funded by recharging users for volume of space occupied (either rent or
headcount) and fees for services. In some cases the organisation functions as a government owned property
company taking a degree of risk e.g. Holland and Finland. In New Zealand even the central
policy/performance body is funded by the departments. The detail of the recharge mechanisms can be
complex but where available we have set out the headlines under each country.
1.4. Services The key emerging themes are:

Page 61 of 85
A shift toward outsourcing non policy functions with several having recently achieved this or in the
process of making this change; and
Attempts to shift positioning to a “customer facing” client service arrangement, particularly
exemplified by Finland and Canada, who have consciously pursued this model.

Page 62 of 85
1.5. Summary table The chapters following describe each country in more detail. The broad picture is summarised below and shows some close commonalities in the services
offered by each of the two main models, and the way their performance is measured. The analysis columns are a crude way of seeking to compare countries.
They show as expected that the decentralised models involve a proportionately much smaller establishment but also some large variations amongst the
central models. These reflect the detailed scope and model of the operation‐ for example in Canada the organisation is sized to manage a selected portfolio
of government assets but also provide services to other departments managing their own assets, hence the relatively low ratios in the analysis columns.
Notes
[1] Transactions in Holland are undertaken by another government agency.
[2] Department of Finance in Australia sets guidance for all government buildings and manages its own estate; the table is completed for the guidance
function. This split role also skews the analysis the columns which are best disregarded for Australia.
[3] The headcount data for Ireland relates to Estates Management staff only, not Heritage and Flood Relief
Analysis
Model
Country
property portfolioFunding Services KPI's Staff
Rent
Fee
Strategy
property
management
FM Advice
Transactions
Project delivery
project approval
workplace
financial
utilisation
portfolio size
/location
FTE
% professionally
qualified
offices only
office and
specialist
million sqm
# of buildings
value €bn
000 sqm /staff
buildings/staff
Model
Country
Finland Central Market on services 270 c70 6.5 11,000 4.6 24.0 41
Netherlands Central Formula on services [1] 760 80 6.94 2,000 5.9 9.1 2.6
Canada Central Headcount on services 3,419 30 7.4 1,795 5 2.1 0.5
USA Central Market /RoI 6,479 c30 34.8 9,184 3.7‐7.4 5.4 1.4
Australia Mixed [2] 140 c30 2.9 562 NA 20.7 4
NZ Devolved on savings 18 50 1.7 1129 NA 94.4 63
UK Devolved 60 30 9.2 5500 157 153.3 92
Singapore Devolved NA NA NA NA NA NA NA NA NA
Ireland Central 481 [3] 36 0.9 2,500 2.8 1.9 5.2

Page 63 of 85
2. Finland
2.1. Role Senate Properties is a government owned property company, created in its present form in 1999 and set
within the Ministry of Finance: “Finland’s largest and most diverse owner of commercial property”. Its role is
to let space to the government, develop its services, and make investments as necessary to develop the
portfolio.
2.2. Model This is a centralised model but Senate is run on commercial lines as a government owned property company.
Government departments do not have to deal with Senate but are encouraged to do so. EU law prevents
them competing with other property companies in the general market, so they have to let the vast majority
of their space to government (the exceptions are usually ground floor retail units in government buildings).
2.3. Funding Senate is a self‐funded state enterprise, funded by rental and fee income from occupying departments, by
external finance (e.g. debt for projects), and by sales of surplus properties. It pays a dividend to its
shareholder, the government. When securing space from the market they back to back a lease with the
government department filling it.
Rents are set to market and cover all buildings i.e. specialist as well as office, in a deliberate attempt to make
the cost of government property transparent to all including the occupying departments and the taxpayer.
Senate consider this all‐encompassing market rent to be their unique differentiator, and whilst it has its
detractors they consider it the best way to achieve transparency and govern behaviour in utilisation of space.
Property sits on Senate’s balance sheet but is legally owned by the government for practical and security
reasons.
2.4. Structure and Services “Service, client relationship and partnership” are central to the Senate model which is designed around a
series of client facing business lines:
Premises provision;
User services (FM, outsourced); and
Expert services (workplace, portfolio management, leasing, procurement, environment, and
data) for which users pay fees.
Leasing they do themselves (they are trying to focus on no new hires from the market but instead using their
own existing portfolio) but other services are generally outsourced via framework/panel appointments.
Workplace advice is increasingly important for them, for which they go outhouse to appropriate consultancy
support.

Page 64 of 85
Services are delivered in a matrix: specialised by type of real estate (e.g. defence, offices) and by region (from
11 regional locations), with a separate projects and investments division.
2.5. Performance measures KPI’s include a series of financial and risk metrics linked to government governance of the company e.g.
profit/dividend target; cap on investment commitments; plus portfolio metrics such as a cap on total cost of
ownership, and utilisation standards due to be reviewed shortly to 15 sqm/FTE from 18. Senate has to deliver
to a government real estate and space utilisation strategy to which a workspace programme is a key
contributor.
2.6. Scale There are 270 staff in total including 30 project managers and 40 property managers.
2.7. Skills Staff are typically well qualified professional staff educated to degree level and including engineers, project
managers, surveyors, architects; also estate management staff professionally qualified but generally not
educated to degree level.
2.8. Property The portfolio includes the whole government estate in order to try to secure economies of scale‐ prisons,
border posts, defence, offices, police and heritage.
Area 6.5m sqm
Number of buildings 11,000
Value €4.6bn
Running cost €560m (rent)
Maintenance spend
Capital programme €196m
Freehold
Leasehold
PFI
3. Netherlands

Page 65 of 85
3.1. Role The Government Buildings Agency (or in Dutch Rijksgebouwendienst‐ RGD) manage and develop the State's
largest property portfolio including guidance and tendering of management and the daily maintenance of
the buildings in their stock. They also maintain monuments / heritage assets. RGD is part of the Ministry of
Interior and Kingdom Relations.
3.2. Model RGD use a centralised model whereby they provide a service which the various government departments
and ministries consume.
3.3. Funding RGD is funded by customer departments paying rent. For offices each agrees on a 2‐year ‘lease’ contract with
RGD. The investment / property risks sit with the RGD which operates on a commercial basis but is ultimately
backed by government. RGD has developed a calculation method named RMR (Reken Methodiek RGD /
calculation method RGD) to set the rent. This is an excel sheet with a usage fee (rent) calculated by reference
to investment values, depreciation periods, residual value. For specialist properties (non‐office) recovery is
based on actual costs.
3.4. Services and structure Services are delivered by four main operational directorates:
Real estate (portfolio optimisation);
Capital projects;
Management; and
Advice and architecture.
These are supported by business and administrative affairs and there is also a small Chief Government
Architect office responsible for design norms and quality.
The main office is located in The Hague. In addition, the Government Buildings Agency has branch offices in
Arnhem, Eindhoven, Haarlem and Groningen.
The Agency serves the Departments by advising on rent, construction and design‐related matters. In addition,
they fulfil the role of project manager, and facilities manager which includes handling maintenance. The key
focus is the guidance and tendering of management and the daily maintenance of the buildings in their stock.
Maintenance is outsourced but the majority of services are delivered in house.
Transactions are dealt with at present by another body: Rijksvastgoed‐ en ontwikkelingsbedrijf (RVOB), (State
Property and Development Agency). This Agency is the broker of the state and charged with selling surplus
real estate and land. There can be a conflict of interest between RGD and RVOB, because RGD wants to
dispose real estate as quickly as possible to avoid future management costs, whereas RVOB want to get the

Page 66 of 85
best price in the market which might involve a lengthy sale process. They will merge later in 2014 (see 3.9
below).
3.5. Performance measures These are primarily around portfolio performance and sustainability targets, for example:
Utilisation target 24.5 sqm /ws (currently 30 sqm/ws);
Vacancy rate 3% (currently 9%); and
Exit 1.5‐1.8m sqm by 2020.
Other targets include portfolio objectives such as:
Concentrate housing from 80 cities/locations to 50 cities/location;
Concentrate in less, but larger offices. 90% of offices should be at least 2,500 sq. m;
Lower annual rental costs (leasehold portfolio) from € 300 million to € 150 million through
ending lease agreements and renegotiation (on average 15% lower rent level per sqm than
current level);
Improve average quality score from 2,3 to 2,8 (based on RGB performance measurement
method);
Improve average energy label from C to B (new leases only in buildings that have at least
energy label C); and
Lower energy costs by better procurement and energy efficiency measures.
3.6. Scale Headcount is 760 broken down as follows:
Directorate of Real Estate 125
Directorate of Projects 160
Directorate of Management 250
Directorate of Advice and Architects 150
Directorate of Business and Administrative Affairs 60
Office of the Chief Government Architect 15
3.7. Skills Of these 80% are professionally skilled and generally university / degree level educated.

Page 67 of 85
3.8. Property The RGB portfolio is the largest state owned building portfolio but excludes defence, police, and certain other
state owned property e.g. roads forest etc. They are increasingly investigating innovative ways of procuring
buildings from the private sector including DBFO models akin to the PFI model previously used in UK. All in
all this involves 7 million m² of floor space, 70% of which is owned by the Agency. Of the 2,000 properties
that make up the stock, some 350 – representing 1 million m² ‐ have monument status, 3.9 million m² involve
office space, (i.e. 8% of the country’s total office market), and 1.2 million m² are used as penitentiaries.
Area 6.94m sqm
Number of buildings 2,000
Value €5.9bn
Running cost
€1.47bn
budget
Maintenance spend €140m
Capital programme
€400m in
2013
Freehold 70%
Leasehold 30%
PFI
3.9. Other observations On 1st July 2014 the RGD will merge with three other Agencies to create a National Real Estate Agency. This
is formed by:
Rijksgebouwendienst (RGD) ‐ Asset/property management organisation of ministry of
internal affairs;
Rijksvastgoed‐en ontwikkelingsbedrijf (RVOB) ‐ Broker of the state;
Dienst Vastgoed Defensie (DVD) ‐ Asset/property management organisation of ministry of
defence; and
Directie Rijksvastgoed ‐ Policy maker for real estate.
With the establishment of the National Real Estate Agency, the government makes a clear choice for the
effective and efficient management of real estate from a government‐wide integrated vision. After the
merger between the four an organization is created of about 2,000 FTE, responsible for the largest (buildings)

Page 68 of 85
real estate portfolio of the Netherlands with a volume of 15.4 million m2 of gross floor area, 78,000 hectares
of land with a value of 15.5 billion euros on the state balance.

Page 69 of 85
4. Canada
4.1. Role The Public Works and Government Services Canada Real Property Branch (RPB) is mandated by Treasury
Board to act on behalf of approximately 110 departments/clients, known as tenants or custodians, to source
and acquire (lease, purchase and other means) properties/premises. RPB’s primary responsibility is to deliver
premises in base building condition to clients and manage leases on behalf of department users.
4.2. Model RPB pursues a centralised model whereby it acts on behalf of the departments consuming the space. In 2007
RPB adopted a model based on its understanding of best corporate real estate (CRE) practice in the private
sector.
4.3. Funding Funding comes through Treasury Board.
RPB is compensated by the department/client based on a set levee amount per employee for whom the
premises are leased for. This is handled by internal personnel through 6 regional offices.
Other services such as but not limited to fit‐up, IT systems, project management, furniture acquisition, move
management are provided by RPB for a fee comparable to market fees for such services. RPB is phasing out
these services and will be outsourcing them.
It is in effect a split funding model i.e. RPB is responsible for lease/acquisition budgets and the department
is responsible for fit‐up, furniture, IT (through shared services) and move costs.
4.4. Structure and services RPB has a matrix structure operating by service lines and regional geographies. Policy is centralized, service
delivery is through 6 regional offices.
Asset management, property management, leasing, maintenance project and design management, energy,
furniture standards and acquisition are currently being removed from the regions to be outsourced and
managed via a central “centre of expertise”.
Fit out, moves management, project management which are currently provided for a fee (departments pay
the capital cost) are also to be outsourced.
An important long term /strategic programme “Workplace 2.0” is seeking to achieve major efficiencies from
workplace change.
4.5. Performance measures RPB monitors its performance against:
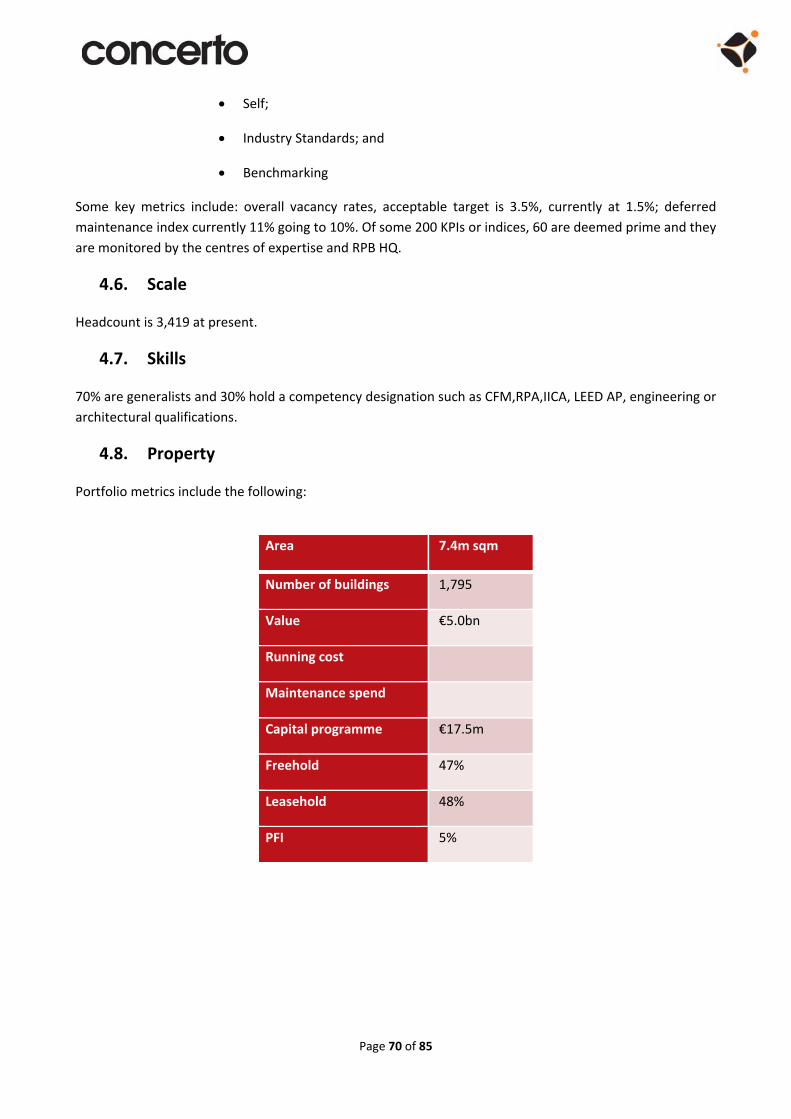
Page 70 of 85
Self;
Industry Standards; and
Benchmarking
Some key metrics include: overall vacancy rates, acceptable target is 3.5%, currently at 1.5%; deferred
maintenance index currently 11% going to 10%. Of some 200 KPIs or indices, 60 are deemed prime and they
are monitored by the centres of expertise and RPB HQ.
4.6. Scale Headcount is 3,419 at present.
4.7. Skills 70% are generalists and 30% hold a competency designation such as CFM,RPA,IICA, LEED AP, engineering or
architectural qualifications.
4.8. Property Portfolio metrics include the following:
Area 7.4m sqm
Number of buildings 1,795
Value €5.0bn
Running cost
Maintenance spend
Capital programme €17.5m
Freehold 47%
Leasehold 48%
PFI 5%

Page 71 of 85
5. Unites States of America
5.1. Role The U.S. General Services Administration (GSA) – Public Buildings Service (PBS) serves as the “Landlord” to
numerous Federal agencies throughout the U.S. Government that occupy space under GSA custody and
control (either managed Federal Buildings or private sector leases). In essence, it is the entity responsible
for centralized management of real estate for those Agencies that do not have landholding authority. The
Departments of Defence, Energy, Interior and Veterans Affairs manage their own estates. The GSA has the
second largest portfolio after the Department of Defence.
In addition to life‐cycle asset management of buildings under its custody and control, GSA provides advisory
services to its clients to assist them in solving their real estate problems. These services span the spectrum
of the real estate industry from requirements development and space design to telework and workplace
solutions to portfolio restructuring and asset disposition.
5.2. Model GSA provides a central service for occupying departments, delivered via regional geographies and a number
of different service lines.
5.3. Funding The GSA is funded through a “revolving fund” known as the Federal Buildings Fund (FBF). By law, GSA is
required to charge a user’s fee (i.e. rent) to any Federal tenant in its space. The users’ fees are collected in
the FBF, which are then used to fund GSA’s primary Budget Activity (BA) accounts. These BA accounts fund
all of the operations of the organization including new construction, renovation projects, annual recurring
operational costs and lease payments to private sector landlords. Each year GSA submits a budget proposal
to Congress for approval to spend the funds held within the FBF.
From time to time, GSA receives an additional allocation of funding from Congress (i.e. the Treasury) for
specific new construction and renovation projects. One of the most recent and well‐known of these types of
allocations was the American Recovery and Reinvestment Act, which provided an additional $5.5 billion to
the FBF to convert Federal buildings to high‐performance green buildings and build new, energy‐efficient
Federal buildings, courthouses and land ports of entry.
The charging mechanism is customised to the specific building and situation, but generally functions as
follows:
a) U.S. Government Owned Space – GSA manages 1,523 Federally owned buildings. By law, GSA is
required to charge Federal tenants “market rents” (i.e. user’s fee) whenever they occupy space
managed by GSA. Federal tenants sign an Occupancy Agreement (i.e. sublease) with GSA to establish
tenancy. Typically, existing buildings undergo a “market rent appraisal” every 5 years. The rate
quoted by GSA in the Occupancy Agreement is the prevailing appraised market rate escalated (at the
U.S. Consumer Price Index) to the current year. This rate is flat for the entire duration of the
Occupancy Agreement (usually 5 years in term).

Page 72 of 85
1. Newly Constructed and Purpose‐Built Buildings – From time to time, GSA
will construct a new Federal Building, Courthouse or other purpose‐built
building. Often, the cost to construct such a specialized building cannot be
supported by a “market rent appraisal”. In this instance, GSA will deploy a
“Return on Investment” (ROI) pricing scheme that ensures GSA receives a
6% return on the total construction cost of the building. The occupying
agency then signs an Occupancy Agreement at the calculated ROI rate. The
duration of these Occupancy Agreements is usually much longer than the
typical Occupancy Agreement term and can be up to 20 years.
b) Leased Space – GSA has a leasehold interest in approximately 7,661 leases. The leases are signed by
GSA, but occupied by its Federal tenants. Similar to owned space, an Occupancy Agreement is signed
between GSA and the Federal tenant to establish tenancy. Usually, the Occupancy Agreement is co‐
terminous with the underlying Lease. GSA negotiates a “market rent” with the private sector
landlord for the leasehold interest. In turn, the rate quoted by GSA in the Occupancy Agreement will
be the negotiated rate plus a 7% GSA management fee. The management fee is included to cover
the cost of originating and administering the lease.
5.4. Structure and Services GSA manages its portfolio across 11 Regional Offices where program execution and service delivery occur.
Central Office is primarily responsible for the development of operational policy and guidance, management
of program areas (i.e. service offerings), performance management, organizational budgetary creation, and
communication with external stakeholders and senior management of client agencies.
The 11 Regional Offices are responsible for program execution and service delivery at the field level. The
Regional Offices are geographically dispersed across the country and each region has its own unique structure
to allow for organizational structures that best align its resources with the specific demands of its client base
in that geographic region. Typically, the Regional Offices will have a limited role in performance
management, while primarily engaging in field level activities such as transaction management, facilities
management, asset / portfolio management, construction management and other client service offerings.
The Public Buildings Service has nine primary programme offices including:
1. The Office of Budget and Financial Management;
2. The Office of Organizational Resources;
3. The Office of Real Property Asset Management;
4. The Office of Client Solutions;
5. The Office of Federal High‐Performance Green;
6. The Office of Design and Construction;
7. The Office of Real Estate Acquisition;
8. The Office of Facilities Management and Services Programs; and

Page 73 of 85
9. The Project Management Office.
Primary service offerings provided by GSA to its Federal tenants include the following:
1. Portfolio / Asset Management;
a. Total Workplace Planning
b. Capital Planning
c. Space Requirements Development
d. Customer Portfolio Planning
2. Dispositions;
3. Leasing (Transaction Management);
4. Facilities Management;
5. Design and Construction Management;
6. Project Management;
7. Building Security;
8. Workplace Solutions;
9. Sustainability and Environmental; and
10. Historic Preservation and Art in Architecture.
In an effort to comply with a Government‐wide mandate to “Freeze the Footprint” (i.e. zero‐growth strategy),
PBS synthesizes many of these offerings to develop scenarios and provide solutions to its client Agencies to
assist in the management of their real estate portfolios.
5.5. Outsourcing GSA interacts closely, and partners frequently, with private sector firms to accomplish its mission. The actual
proportion of outsourcing is heavily dependent on the operational area.
For instance, there are areas of its operations that are almost entirely outsourced. GSA estimates that it
outsources Facilities Management (FM) responsibilities for approximately 50% of its Federal Buildings, and
outsources nearly all vendor services (i.e. cleaning, maintenance, etc.) to private sector firms.
Additionally, there are other areas of GSA’s operations where they have created large indefinite delivery /
indefinite quantity (IDIQ) contracts with multiple private sector firms to create an ongoing partnership with
the private sector firms where GSA gains operational knowledge / experience and additional resource
capacity. An example of this type of contract is the National Broker Contract (NBC), which has established
multi‐year contracts with four (4) private sector brokerage firms that are the exclusive providers of tenant
representation services to GSA. The firms augment the resource capacity and market knowledge of GSA’s
internal staff of leasing personnel.

Page 74 of 85
Finally, there are certain functions within GSA that are inherently governmental in nature. While they might
employ private sector consulting services as‐needed, the majority of the work is performed by Government
employees.
5.6. Performance Measures GSA’s performance measures are organized under three Strategic Goals, created by the GSA Administrator
(i.e. head of the agency), from which all KPIs are linked to ensure management activities directly relate to the
goals of the organization. Some of the KPIs are derived from Federal law and regulations, while others are
rooted in sound business practices. The following table summarizes GSA’s KPIs for 2013. As part of its
Strategic Management Plan, GSA has developed service delivery strategies, tactics and intermediate goals to
focus the agency’s resources to help it meet its performance measures.
STRATEGIC GOALS
1. SAVINGS Provide savings to federal departments and agencies
2. EFFICIENCY Improve the efficiency of
operations and service delivery
3. SERVICE Deliver excellent customer
service
STRATEGIC OBJECTIVES AND KEY PERFORMANCE GOALS
1.1 Deliver contracting solutions to generate customer savings
Generate savings through
Federal Strategic Sourcing
Initiative *
Reduce the Global Supply
blended markup
Procure lease space at
below industry market
rates
Realize savings through
Integrated Technology
Service solutions
2.1 Increase the efficiency of GSA operations
Improve the efficiency of
GSA operations
Control corporate indirect
costs
Achieve full cost recovery
in the GSA leasing program
Complete new construction
projects on schedule
3.1 Enhance relationships with our customers, suppliers and stakeholders
Improve customer
satisfaction with
government‐owned and
leased space
Achieve customer loyalty
and supplier satisfaction
for acquisitions services
Implement effective policy
initiatives
Drive greater transparency
and innovation in
government
Increase citizen
engagement with Federal
Agencies
1.2 Improve the federal utilization of space
2.2 Enhance asset management
3.2 Support small and disadvantaged business

Page 75 of 85
Reduce the federal
footprint *
Reduce vacant space in the
government‐owned and
leased inventory
Provide policy and analysis
to support freeze the
federal footprint
Achieve an appropriate
return on equity for
government‐owned assets
Provide building cleaning
and maintenance at
competitive costs
Meet small business prime
contracting and
subcontracting goals
Meet small business
targets on Multiple Award
Schedules
1.3 Reduce resource use and environmental impact
Green the federal supply
chain
Reduce total water
consumption
Reduce total energy
purchased
Reduce use of petroleum‐
based fuel
Purchase alternative fuel
vehicles
Provide useful energy
efficiency information and
tools to federal agencies
5.7. Scale The GSA 2013 budget return included the following headcount data:
Full‐Time Employees
Cleaning 40
Utilities 0
Maintenance 153
Other Building Services 1,152
Space Acquisition 1,591
Staff Support 3,431
IT Support 114
Centralized Services 0
Total 6,479

Page 76 of 85
5.8. Skills GSA is predominantly composed of generalist civil servants that oversee the program execution and service
delivery to its client Agencies. GSA does employ Architects, Planners, Engineers, Real Estate Salespeople,
Appraisers and other employees with professional designations / licenses; however, given the size and
geographic dispersion of its portfolio, it often contracts for these services on an as‐needed basis to meet
fluctuating demand.
5.9. Property GSA presently manages a domestic real estate portfolio of approximately 375 million rentable square feet
comprised of approximately 1,523 Federally‐owned assets and 7,661 leases.
No. of Buildings Rentable Square Feet
Federally‐Owned 1,523 181,600,000
Leased 7,661 194,100,000
Total 9,184 375,700,000
Source: FY2012 Portfolio Composition by Inventory Segment & Region provided by GSA at interview
While the portfolio is primarily composed of administrative office uses, GSA’s portfolio includes a wide variety
of functional uses including courts, laboratories, ports of entry, law enforcement, data centres and numerous
other uses. The following are summary statistics on the size and costs associated with GSA’s portfolio:
Area
375m sq ft
(34.8m sqm)
Number of buildings 9,184
Value $3.7‐€7.4bn
Running cost €1.77bn
Maintenance spend €251m
Capital programme $500m
Freehold 49%
Leasehold 51%
PFI
Page 77 of 85
6. Australia
6.1. Role The Commonwealth Department of Finance (DOF) Property Portfolio Branch (PPB) sets the government
property framework and acts as landlord to the other agencies in the department of Finance.
6.2. Model This is effectively a decentralised model in that individual departments are responsible for their portfolios
but required to comply with a framework laid down by DoF PPB, which therefore has a dual role as follows.
PPB is responsible for setting a Framework that agencies of the Commonwealth must abide by. The
Commonwealth Property Management Framework establishes the principles for the efficient, effective,
sustainable and ethical use of property resources and applies to property leased or owned by most
government agencies.
Finance is one of the few Departments, other than Defence, that owns a significant part of its portfolio. This
is because they have some iconic buildings (e.g. those in the Parliamentary Triangle, Law Courts, Special
Purpose buildings etc). The owned Finance Property is managed by the Property Portfolio Branch. This
branch acts like a landlord, and other business Groups within Finance will be lessees, although rather than
leases, MOU’s are generally used.
While Agencies have a fair amount of autonomy in the way they run and manage their portfolios, spending
proposals over $30 million for whole of life costs need to be signed off by the Secretary of the Department
of Finance. Below this can be signed off the respective department, at various levels, depending on delegated
authorities.
6.3. Funding DoF is funded by Budget allocations (as with most departments). Any savings generated within the
department are returned to consolidated revenues.
6.4. Structure and Services The primary service DoF provides to the rest of government is to design, maintain and operate the
government property framework. There are also policy formulation, performance monitoring, and data
gathering/analysis functions.
For its own departmental portfolio DoF is moved in the 1990’s to an outsourced model covering the following
(as per the 2012 re‐tender):

Page 78 of 85
Service Core Service
Non‐
Exclusive
Service
Optional
Service
Estate Management
Valuations
Real Estate Services
Facilities Management
Capital Works Program Management
Project Management
Land Management
Procurement and Subcontractor Management
Financial Management
Management Information Systems (MIS)
Transition Management
6.5. Performance measures The main KPI is around data collection and more specifically the requirement for tenancies over 500m2 to
have density targets of 14m2/occupied work point. Density targets were introduced in 2009 at
16m2/occupied work point, but were reduced to 14m2 in 2013. Additionally, there is a requirement for
tenancies over 2,000m2 to meet environmental and sustainability measures, including meeting minimum
energy ratings and having “Green” Leases in place.
Overall, KPIs have had a positive impact. A current example is a mid‐sized Department went to market for a
new HQ in Canberra prior to the space metrics being in place for a 36,000m2 building. They were unable to
find a new site and remained in the same site. They have recently come back to market and on the
requirements of 14m2/occupied work point; the new requirement is 24,000m2, based on a similar number
of people occupying the building. This will present savings of many millions over the life of the lease.
6.6. Scale Headcount There is around 140 staff working on Property related functions in the Department. There are
around 110 in Property and Construction Division working on service delivery for the owned estate (non‐
defence), policy (Commonwealth Property Management Framework) and on capital projects (e.g. Right now
they are refurbishing the Lodge). We estimate there are over 1000 in other departments managing their own
estates in this decentralised model.
6.7. Skills Staff are generally well qualified civil servants. The Department will bring in professionally qualified people
as required; however, they also rely on the private sector for skill sets. This can be readily brought in as most
departments (including Finance) have professional skills panels.

Page 79 of 85
6.8. Property PPB manages the Australian government non‐defence domestic property portfolio. The portfolio includes a
diverse range of property types including office buildings, law courts and other special purpose properties,
public interest properties, heritage buildings, residential properties and vacant land.
It should note noted that the far majority of all Commonwealth office buildings (ex‐Defence) are leased over
90% on a floor space basis. This is a result of Australian Government decision around 1995 to sell off the
majority of its property, except special purpose properties and buildings of significance (e.g. Commonwealth
Law Courts, Parliament House, heritage buildings, etc.).
Area 2.9m sq m
Number of buildings 562 buildings*
Value
Running cost €843m
Maintenance spend
Capital programme
Freehold
Leasehold
PFI
*Over 500m2

Page 80 of 85
7. New Zealand
7.1. Role The Property Management Centre of Expertise (PMCoE) has a mandate over office accommodation only,
not special purpose facilities. It is part of the Ministry of Social Development.
The mandate is to agree all investment decisions (acquisition and disposal), sign off agency property
strategies and to undertake centralised procurement. Agencies (60 in total) remain responsible for all lease
administration, capital works and facilities management within the bounds of the agreed strategies and
agreed tenure decisions. The exception is that major business cases and procurement of sites (5,000sqm or
larger) are run centrally by PMCoE. The agencies are required to maintain and report accommodation
information within a centrally held property management system.
7.2. Model This is a decentralised model with government agencies responsible for the management of their own
portfolios.
7.3. Funding PMCoE is fee‐funded from mandated agencies, with 60% of the fee based upon 5% of the estimated 4 year
average savings per agency; and 40% based on cost recovered (major projects).
7.4. Structure and Services The PMCoE has three areas: operational (agency liaison, signoff on plans and strategies, information
management, procurement, brokering); strategy research and reporting, and a project management office
(major projects and business cases).
Key services are strategy; procurement (accommodation related goods and services); major project business
cases and site procurement (5,000sqm +); minor brokerage (agencies sharing surplus space). Some design
services are provided on a fee‐chargeable basis.
Within PMCoE, some of the deliverables involve external consultants (e.g. research, project management)
and the remainder are insourced. The agencies are mixed, with some fully insourced and others outsourcing
lease management, FM, project management in part or whole.
7.5. Performance measures KPI’s include the following portfolio efficiency measures:
sqm per FTE, (govt target of 12‐16sqm per FTE applies, compared to 21.5 sqm average in April
2012);
Workstations per person;
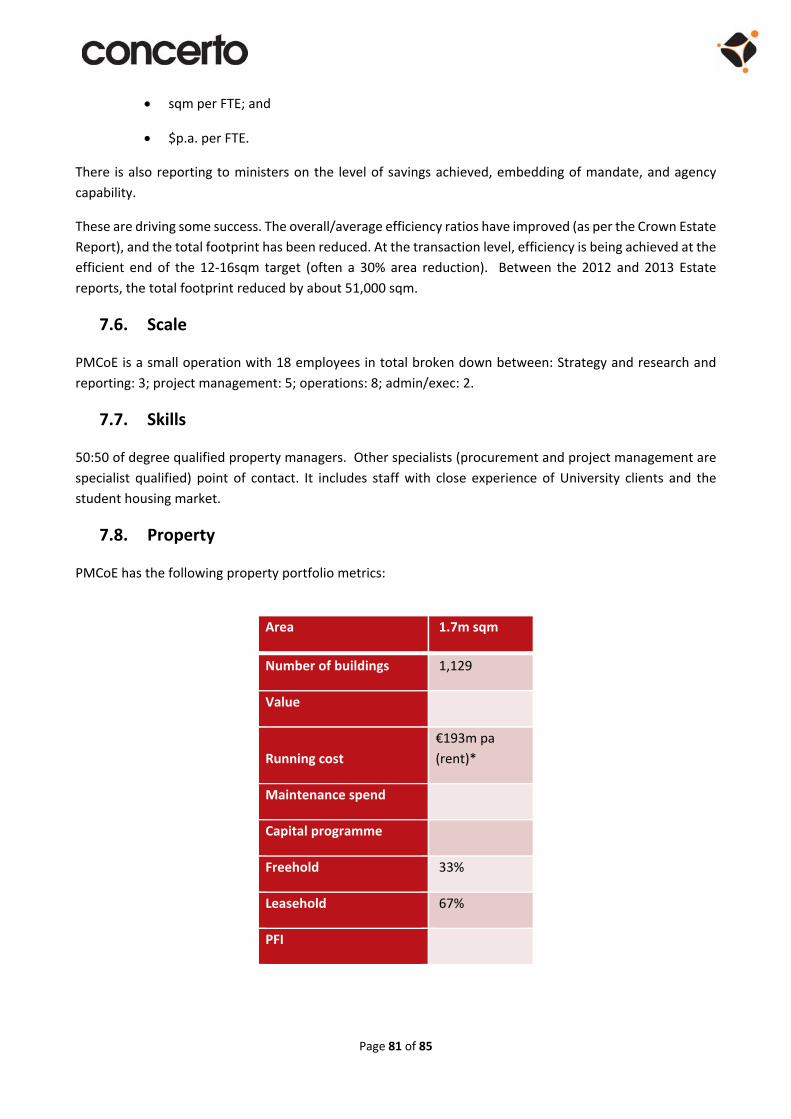
Page 81 of 85
sqm per FTE; and
$p.a. per FTE.
There is also reporting to ministers on the level of savings achieved, embedding of mandate, and agency
capability.
These are driving some success. The overall/average efficiency ratios have improved (as per the Crown Estate
Report), and the total footprint has been reduced. At the transaction level, efficiency is being achieved at the
efficient end of the 12‐16sqm target (often a 30% area reduction). Between the 2012 and 2013 Estate
reports, the total footprint reduced by about 51,000 sqm.
7.6. Scale PMCoE is a small operation with 18 employees in total broken down between: Strategy and research and
reporting: 3; project management: 5; operations: 8; admin/exec: 2.
7.7. Skills 50:50 of degree qualified property managers. Other specialists (procurement and project management are
specialist qualified) point of contact. It includes staff with close experience of University clients and the
student housing market.
7.8. Property PMCoE has the following property portfolio metrics:
Area 1.7m sqm
Number of buildings 1,129
Value
Running cost
€193m pa
(rent)*
Maintenance spend
Capital programme
Freehold 33%
Leasehold 67%
PFI

Page 82 of 85
8. United Kingdom
8.1. Role The Government Property Unit (GPU) is part of the Efficiency & Reform Group in the Cabinet Office. GPU
provide place based strategies for government, a co‐ordination function to help share space particularly in
London and administer a series of National Property controls. These are particularly focussed on the non‐
operational central civil estate (generally offices) but GPU is increasingly involved in initiatives to secure more
efficient use of the wider public estate including defence, health, and the local authority estate, government
land release for development or re‐use, and a workplace change programme.
8.2. Model Day to day management of the estate is in the hands of departments and their arm’s length bodies. So UK
govt. estate is run on a heavily decentralised basis, but with increasing co‐ordination and strategic direction
from GPU.
8.3. Funding GPU is funded by the Cabinet Office budget.
8.4. Services
a) Strategy, policy, secretariat and programme offices for strategic projects;
b) Estate rationalisation and property controls;
c) Shared services;
d) Smarter working;
e) Data, EPIMS, finance benchmarking;
f) Links to wider public sector (One Public Estate);
g) Vacant and surplus land; and
h) (FM has now left GPU to join the Crown Commercial agent programme elsewhere in Cabinet
office).
GPU are also increasingly called on to help prepare business cases for approval for capital projects e.g. where
departments are sharing space and CO funding is needed to help cover cost.
Approximately 95% plus is done in house. There is little or no budget for consultancy input. Some resources
are “borrowed” on secondment from departments.
8.5. Performance measures KPI’s include:
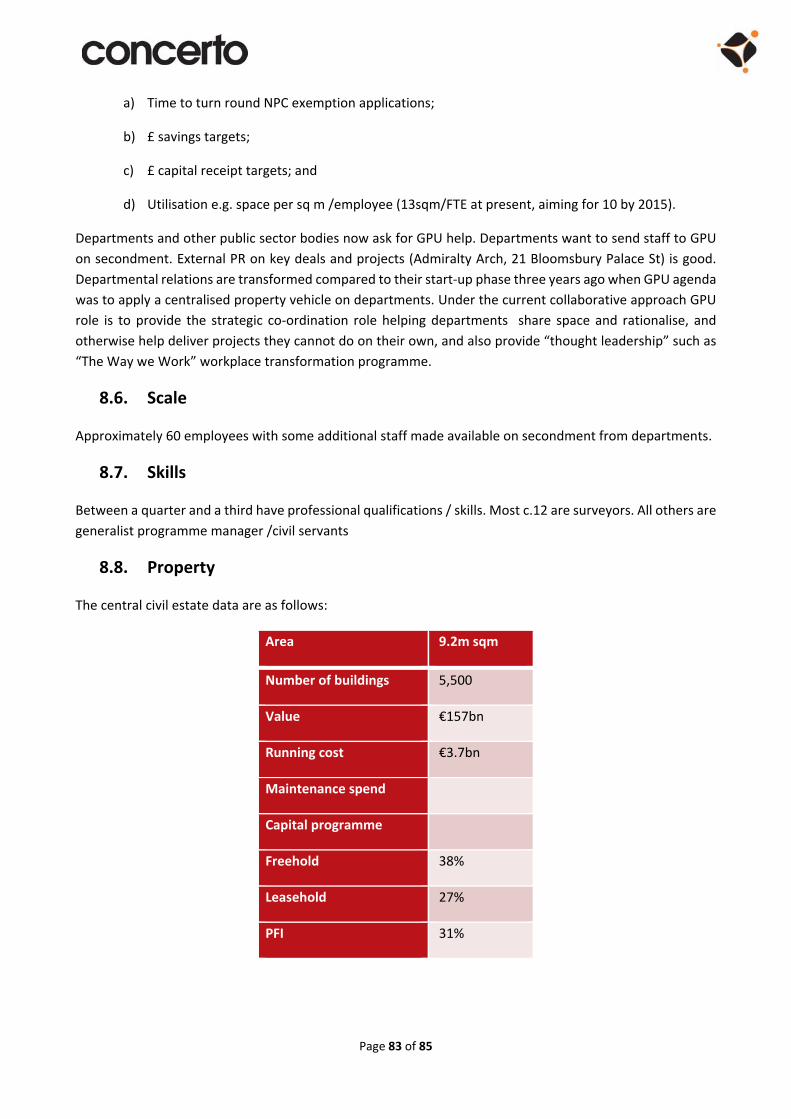
Page 83 of 85
a) Time to turn round NPC exemption applications;
b) £ savings targets;
c) £ capital receipt targets; and
d) Utilisation e.g. space per sq m /employee (13sqm/FTE at present, aiming for 10 by 2015).
Departments and other public sector bodies now ask for GPU help. Departments want to send staff to GPU
on secondment. External PR on key deals and projects (Admiralty Arch, 21 Bloomsbury Palace St) is good.
Departmental relations are transformed compared to their start‐up phase three years ago when GPU agenda
was to apply a centralised property vehicle on departments. Under the current collaborative approach GPU
role is to provide the strategic co‐ordination role helping departments share space and rationalise, and
otherwise help deliver projects they cannot do on their own, and also provide “thought leadership” such as
“The Way we Work” workplace transformation programme.
8.6. Scale Approximately 60 employees with some additional staff made available on secondment from departments.
8.7. Skills Between a quarter and a third have professional qualifications / skills. Most c.12 are surveyors. All others are
generalist programme manager /civil servants
8.8. Property The central civil estate data are as follows:
Area 9.2m sqm
Number of buildings 5,500
Value €157bn
Running cost €3.7bn
Maintenance spend
Capital programme
Freehold 38%
Leasehold 27%
PFI 31%
Page 84 of 85
9. Singapore
9.1. Role Singapore has no centralised agency to coordinate the management of the government’s occupational
estate. The state’s central role in relation to government property is to regulate the built environment
as for all property through various Acts, policies and regulations including for example the Fire Safety
Act; the Building Maintenance and Strata Management Act (Chap 30C). The latter appoints a
Commissioner of Buildings and other officers within the government to administer this Act which
essentially stipulates the management of buildings and common areas.
The Singapore Land Authority is the custodian of state land and state buildings not owned or occupied
by a statutory board or ministry, and it is responsible for selling or leasing these facilities many of
which are residential. This does not appear to be an entity analogous to OPW.
9.2. Model Singapore’s model is therefore decentralised. Individual agencies/statutory boards manage their own
portfolio. To that end, many of them outsource to third party property/facility firms such as JLL, DTZ,
CBRE etc.
The centralised element is that each agency is required to publish in GeBiz which is the Singapore
government's one‐stop e‐procurement portal. All the public sector's invitations for quotations and
tenders are posted on GeBiz. Suppliers can search for government procurement opportunities,
download tender documents, and submit their bids online.
9.3. Funding Departmental real estate is essentially publicly funded through one of two mechanisms depending on
the status, of the body: if the property owning body is a “statutory board”, they have their own budget,
but in the case of a ministry, they have an allocated budget for property maintenance.
9.4. Services Almost all the services required by these bodies to manage their real estate are outsourced by tender
to third party providers. The range extends from strategic engagements such as financial, portfolio
and facilities management through to programmes such as planned maintenance, individual tasks for
construction, fit out and so forth.
This reflects the Singapore government‘s wider business/economic/political model which is to use a
pro‐business market structure when it comes to state operations. As far as they can, the state has
been moving away from central control to depend more on localised, private operators so as to not
“interfere” in the private market whenever it can. The state agencies have moved on to take on a
more regulatory function rather than control. Outsourcing government real estate management to
the private sector, is intended to support the development of local private sector expertise and the
economy generally. By devolving management of buildings to those occupying them they hope to
reduce the need for expensive central bureaucracy.

Page 85 of 85
9.5. Performance measures These are set by the department in the tender specification when outsourcing.
9.6. Scale and skills With this outsourcing model government bodies need only a limited staff capable of running the
contracts and determining policy /strategic direction.
9.7. Property The decentralised model means little overall information on the government portfolio is available.
For information the Singapore Land Authority portfolio described as c. 5,000 government properties
totalling 4.25m sq. m including residential, commercial, industrial and institutional property as
follows:
Residential 800,000 sqm
Commercial 830,000 sqm
Industrial 200,000 sqm
Social/Civic (incl. open space) 2,000,000 sqm
Vacant 420,000 sqm