Embed Size (px)
Citation preview

Appendix TAA1-J
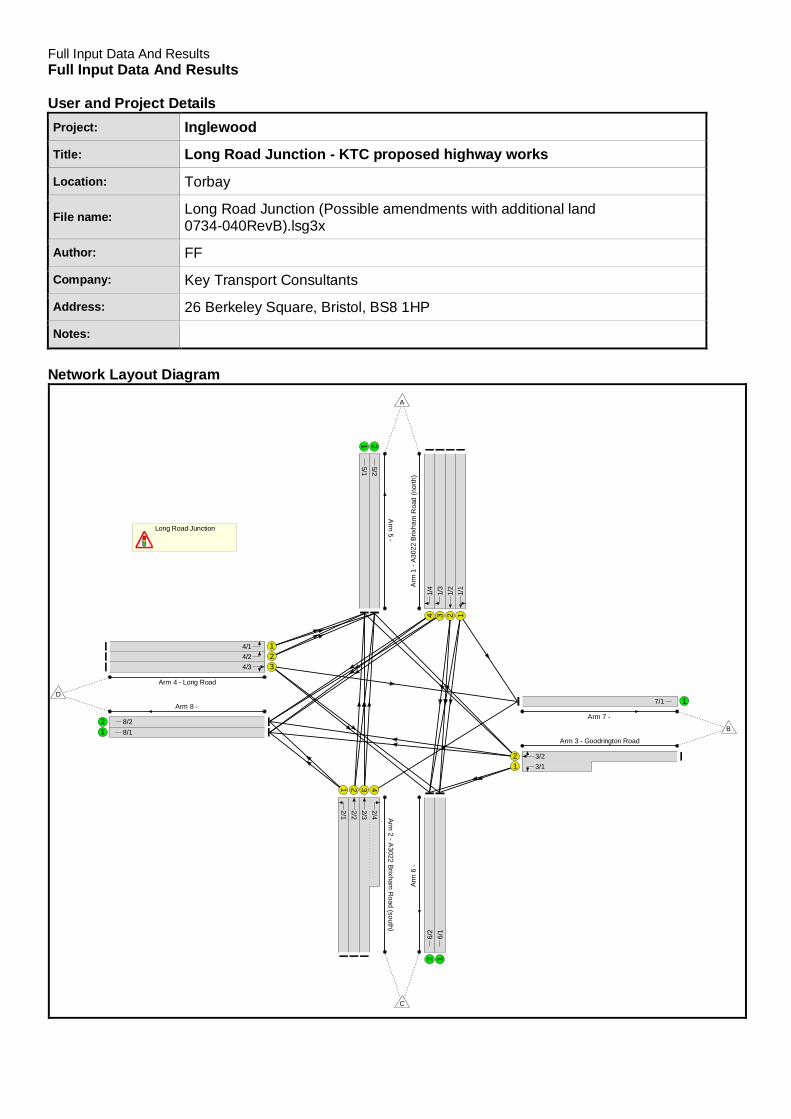
Full Input Data And ResultsFull Input Data And Results
User and Project DetailsProject: Inglewood
Title: Long Road Existing Junction
Location: Torbay
File name: Long Road Junction.lsg3x
Author: FF
Company: Key Transport Consultants
Address: 26 Berkeley Square, Bristol, BS8 1HP
Notes:
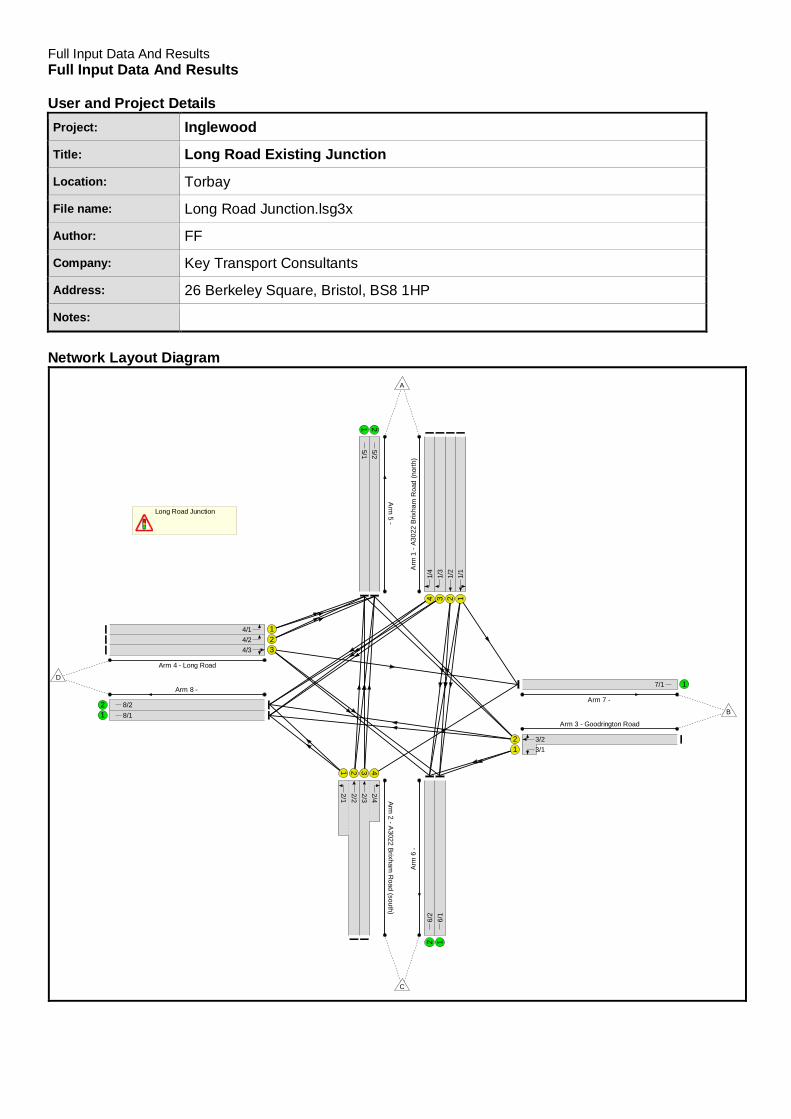
Network Layout Diagram
Long Road Junction
Arm
1-A
3022
Brix
ham
Roa
d(n
orth
)
1234
1/1
1/2
1/3
1/4
Arm2
-A3022
BrixhamR
oad(south )
1 2 3 4
2/12/22/32/4
Arm 3 - Goodrington Road
12
3/13/2
Arm 4 - Long Road
123
4/14/24/3
Arm
5-
1 25/15/2
Arm
6-
126/
16/
2
Arm 7 -
17/1Arm 8 -
12
8/18/2
A
B
C
D

Full Input Data And Results
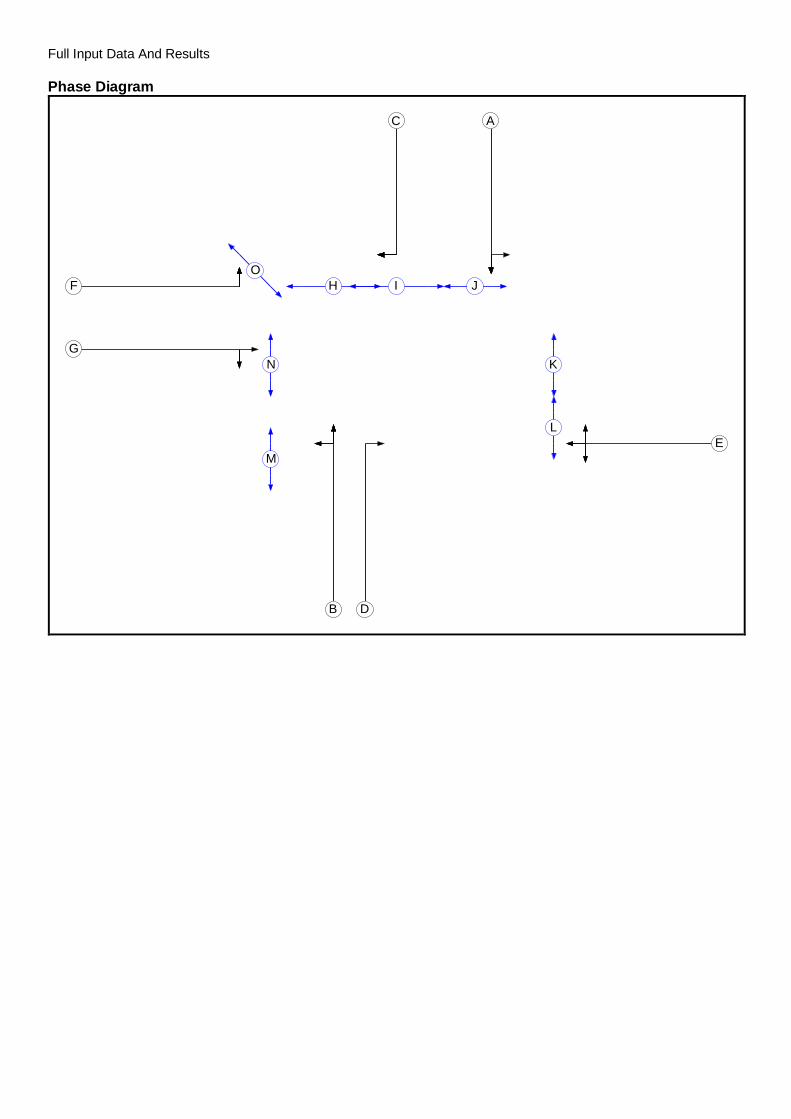
Phase Diagram
A
B
C
D
E
F
G
H I J
K
L
M
N
O
Full Input Data And Results
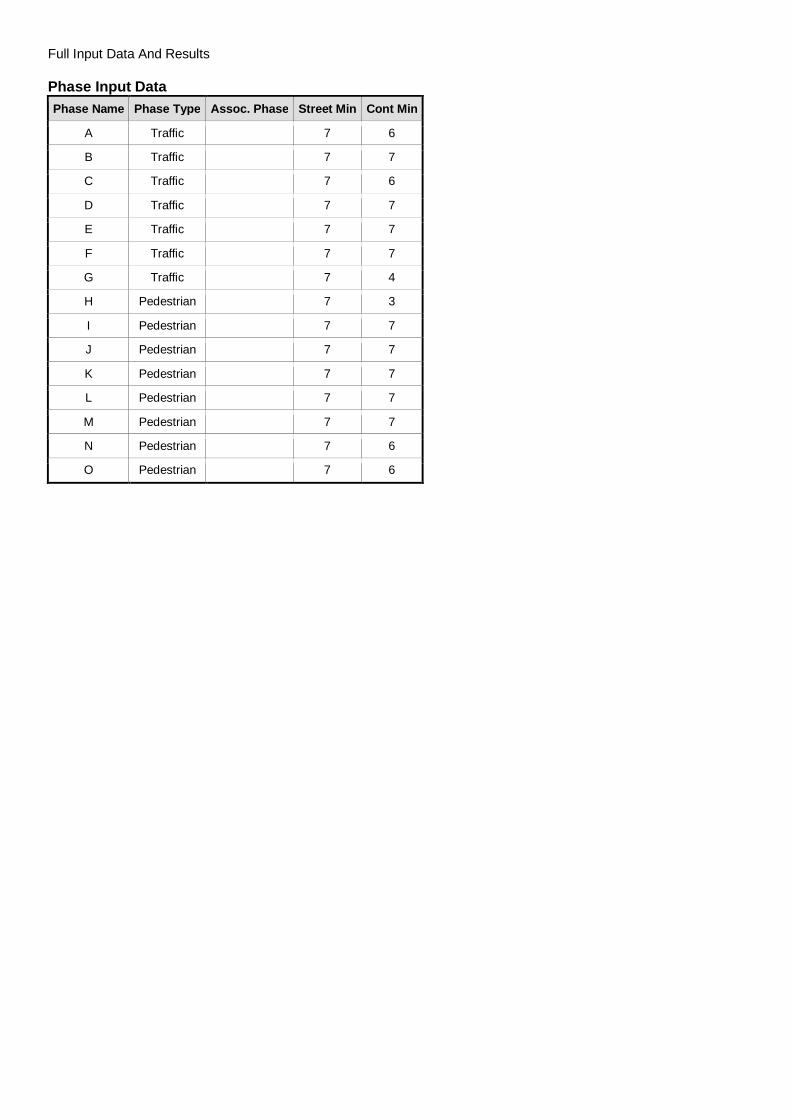
Phase Input DataPhase Name Phase Type Assoc. Phase Street Min Cont Min
A Traffic 7 6
B Traffic 7 7
C Traffic 7 6
D Traffic 7 7
E Traffic 7 7
F Traffic 7 7
G Traffic 7 4
H Pedestrian 7 3
I Pedestrian 7 7
J Pedestrian 7 7
K Pedestrian 7 7
L Pedestrian 7 7
M Pedestrian 7 7
N Pedestrian 7 6
O Pedestrian 7 6

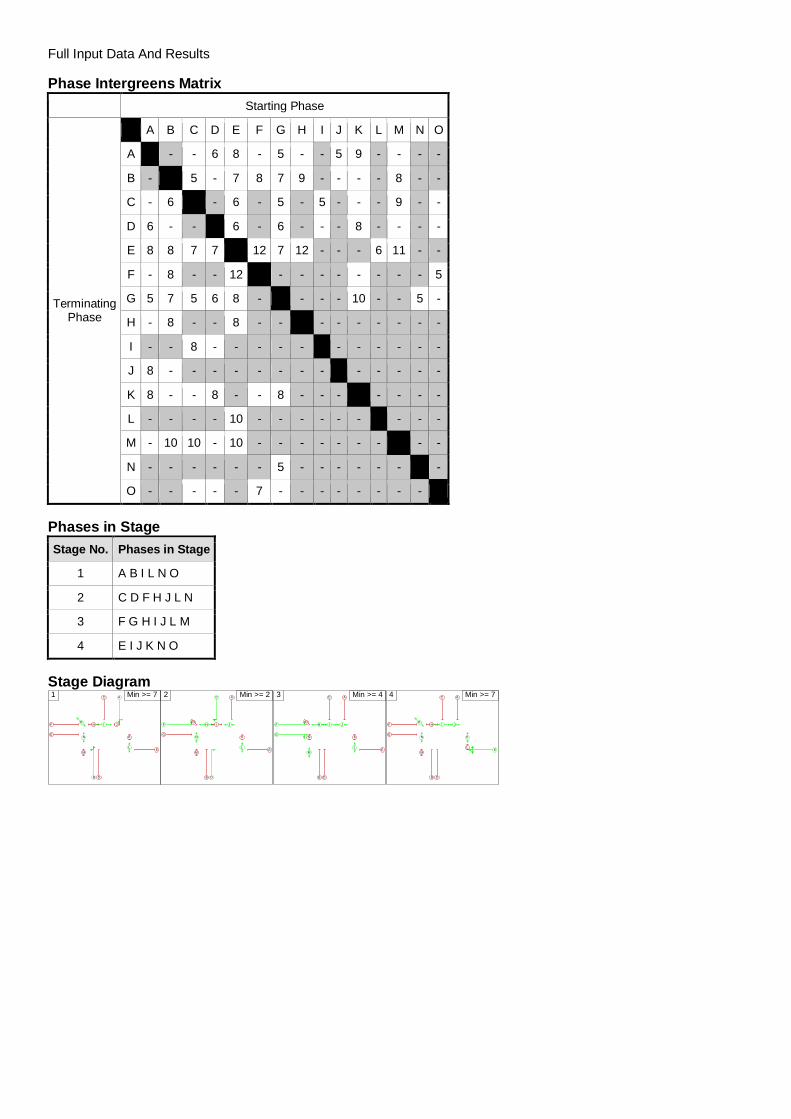
Full Input Data And Results
Phase Intergreens MatrixStarting Phase
TerminatingPhase
A B C D E F G H I J K L M N O
A - - - 6 8 - 5 - - 5 9 - - - -
B - - 5 - 7 8 7 9 - - - - 8 - -
C - 6 - - 6 - 5 - 5 - - - 9 - -
D 6 - - - 6 - 6 - - - 8 - - - -
E 8 8 7 7 - 12 7 12 - - - 6 11 - -
F - 8 - - 12 - - - - - - - - - 5
G 5 7 5 6 8 - - - - - 10 - - 5 -
H - 8 - - 8 - - - - - - - - - -
I - - 8 - - - - - - - - - - - -
J 8 - - - - - - - - - - - - - -
K 8 - - 8 - - 8 - - - - - - - -
L - - - - 9 - - - - - - - - - -
M - 10 10 - 10 - - - - - - - - - -
N - - - - - - 5 - - - - - - - -
O - - - - - 7 - - - - - - - - -
Phases in StageStage No. Phases in Stage
1 A B I L N O
2 C D F H J L N
3 F G H I J L M
4 E I J K N O
Stage DiagramA
B
C
D
E
F
G
H I J
K
LM
N
O
1 Min >= 7 A
B
C
D
E
F
G
H I J
K
LM
N
O
2 Min >= 2 A
B
C
D
E
F
G
H I J
K
LM
N
O
3 Min >= 4 A
B
C
D
E
F
G
H I J
K
LM
N
O
4 Min >= 7
Full Input Data And Results
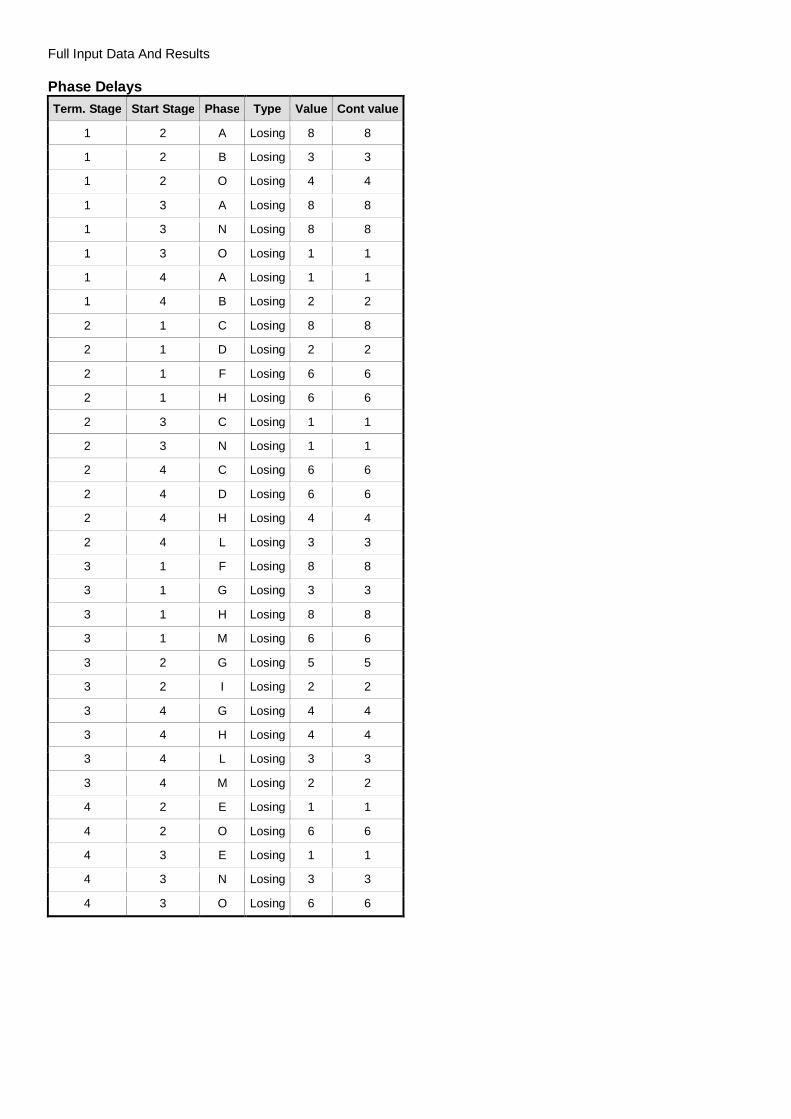
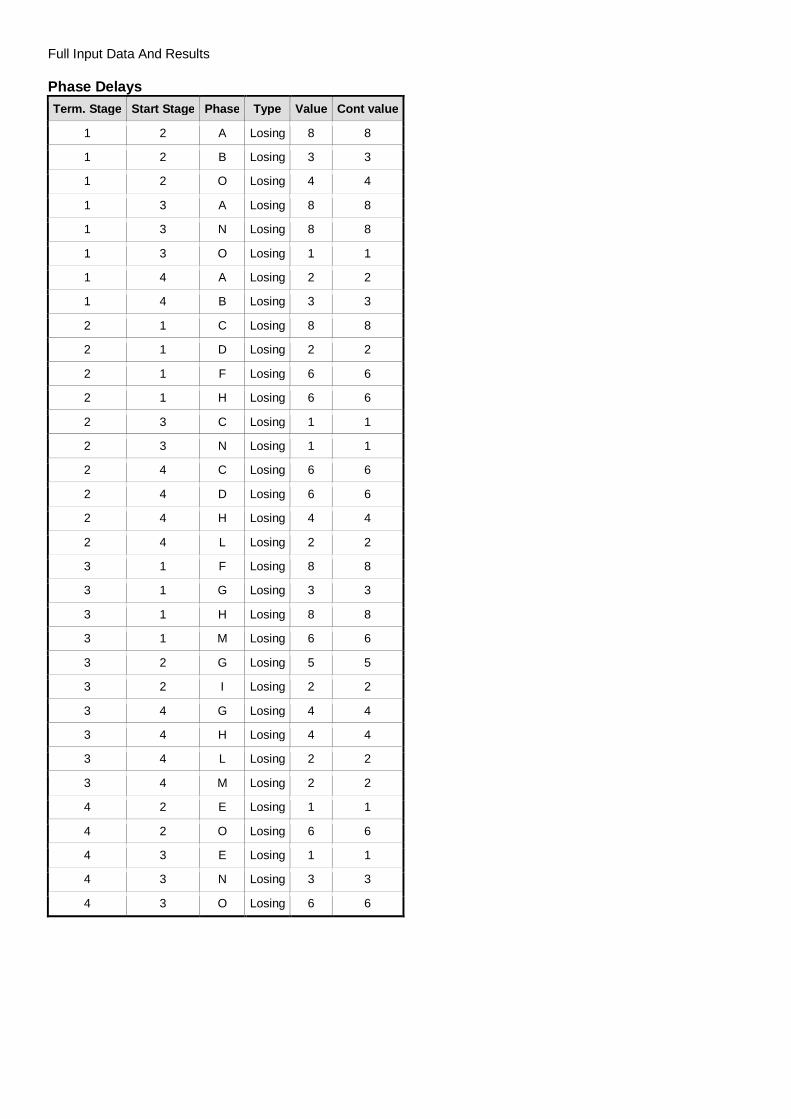
Phase DelaysTerm. Stage Start Stage Phase Type Value Cont value
1 2 A Losing 8 8
1 2 B Losing 3 3
1 2 O Losing 4 4
1 3 A Losing 8 8
1 3 N Losing 8 8
1 3 O Losing 1 1
1 4 A Losing 1 1
1 4 B Losing 2 2
2 1 C Losing 8 8
2 1 D Losing 2 2
2 1 F Losing 6 6
2 1 H Losing 6 6
2 3 C Losing 1 1
2 3 N Losing 1 1
2 4 C Losing 6 6
2 4 D Losing 6 6
2 4 H Losing 4 4
2 4 L Losing 3 3
3 1 F Losing 8 8
3 1 G Losing 3 3
3 1 H Losing 8 8
3 1 M Losing 6 6
3 2 G Losing 5 5
3 2 I Losing 2 2
3 4 G Losing 4 4
3 4 H Losing 4 4
3 4 L Losing 3 3
3 4 M Losing 2 2
4 2 E Losing 1 1
4 2 O Losing 6 6
4 3 E Losing 1 1
4 3 N Losing 3 3
4 3 O Losing 6 6

Full Input Data And Results
Prohibited Stage ChangeTo Stage
FromStage
1 2 3 4
1 14 13 10
2 14 10 14
3 16 11 14
4 8 13 13

Full Input Data And ResultsGive-Way Lane Input DataJunction: Long Road Junction
There are no Opposed Lanes in this Junction
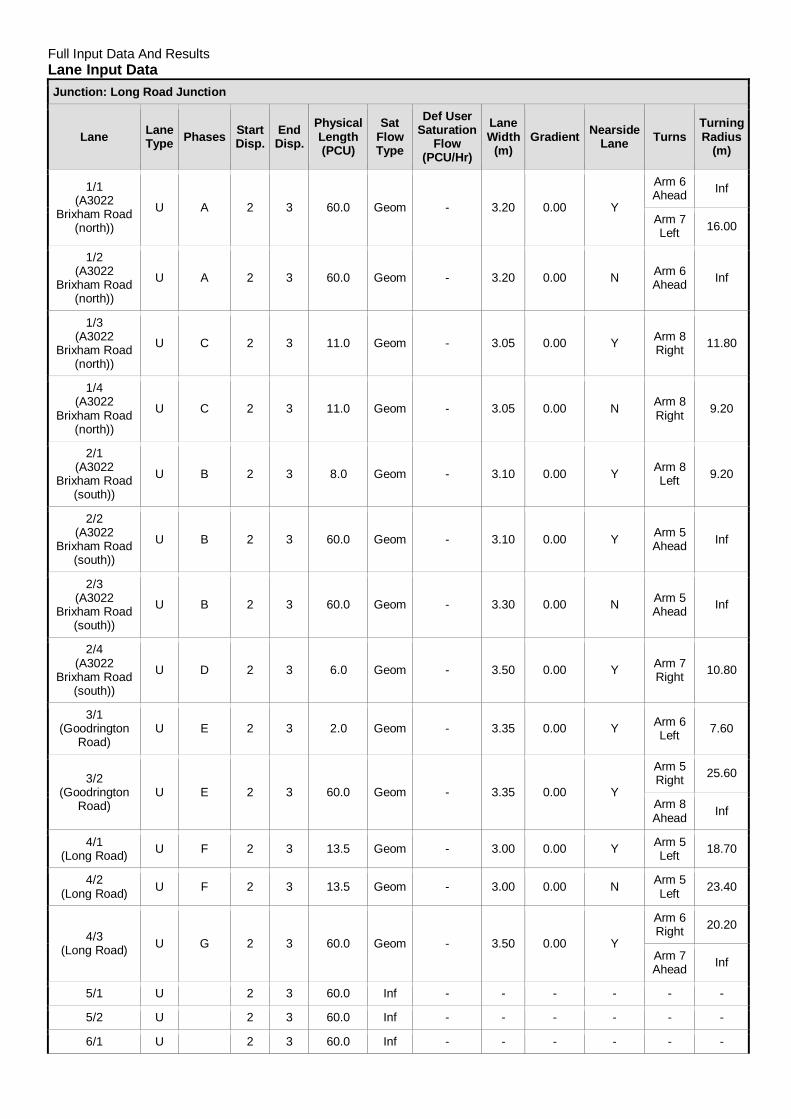
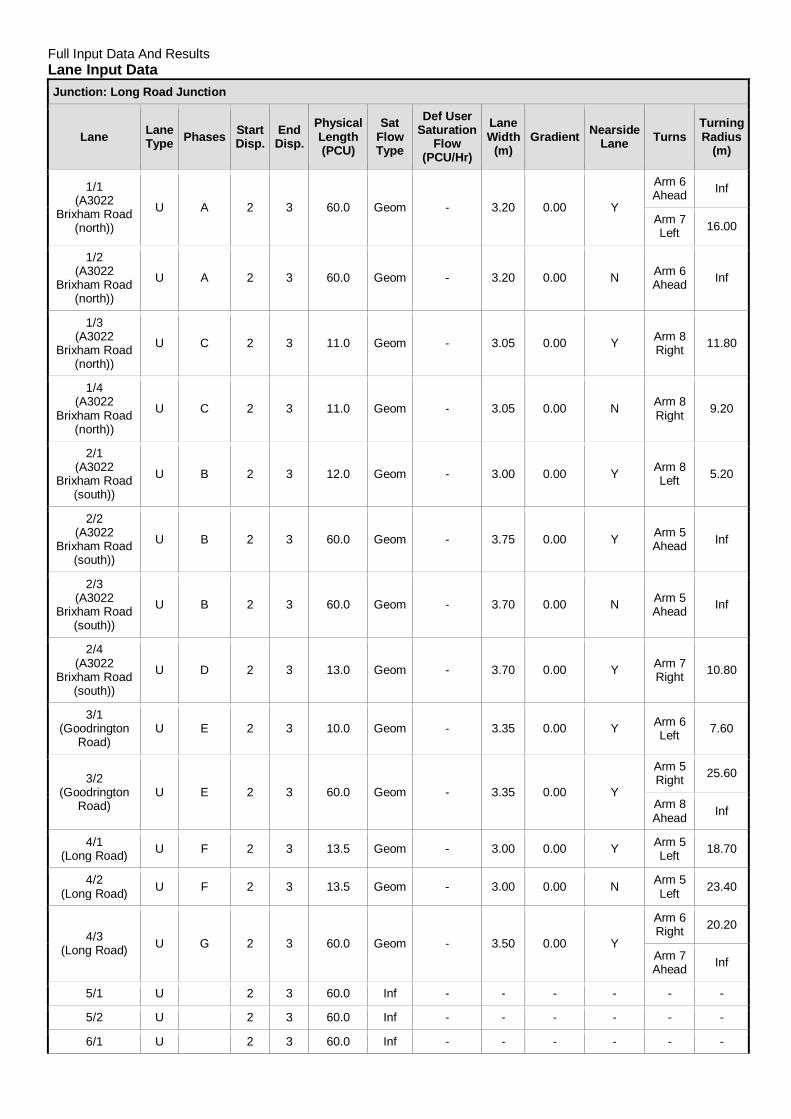
Full Input Data And ResultsLane Input DataJunction: Long Road Junction
Lane LaneType Phases Start
Disp.EndDisp.
PhysicalLength(PCU)
SatFlowType
Def UserSaturation
Flow(PCU/Hr)
LaneWidth
(m)Gradient Nearside
Lane TurnsTurningRadius
(m)
1/1(A3022
Brixham Road(north))
U A 2 3 60.0 Geom - 3.20 0.00 Y
Arm 6Ahead Inf
Arm 7Left 16.00
1/2(A3022
Brixham Road(north))
U A 2 3 60.0 Geom - 3.20 0.00 N Arm 6Ahead Inf
1/3(A3022
Brixham Road(north))
U C 2 3 11.0 Geom - 3.05 0.00 Y Arm 8Right 11.80
1/4(A3022
Brixham Road(north))
U C 2 3 11.0 Geom - 3.05 0.00 N Arm 8Right 9.20
2/1(A3022
Brixham Road(south))
U B 2 3 8.0 Geom - 3.10 0.00 Y Arm 8Left 9.20
2/2(A3022
Brixham Road(south))
U B 2 3 60.0 Geom - 3.10 0.00 Y Arm 5Ahead Inf
2/3(A3022
Brixham Road(south))
U B 2 3 60.0 Geom - 3.30 0.00 N Arm 5Ahead Inf
2/4(A3022
Brixham Road(south))
U D 2 3 6.0 Geom - 3.50 0.00 Y Arm 7Right 10.80
3/1(Goodrington
Road)U E 2 3 2.0 Geom - 3.35 0.00 Y Arm 6
Left 7.60
3/2(Goodrington
Road)U E 2 3 60.0 Geom - 3.35 0.00 Y
Arm 5Right 25.60
Arm 8Ahead Inf
4/1(Long Road) U F 2 3 13.5 Geom - 3.00 0.00 Y Arm 5
Left 18.70
4/2(Long Road) U F 2 3 13.5 Geom - 3.00 0.00 N Arm 5
Left 23.40
4/3(Long Road) U G 2 3 60.0 Geom - 3.50 0.00 Y
Arm 6Right 20.20
Arm 7Ahead Inf
5/1 U 2 3 60.0 Inf - - - - - -
5/2 U 2 3 60.0 Inf - - - - - -
6/1 U 2 3 60.0 Inf - - - - - -
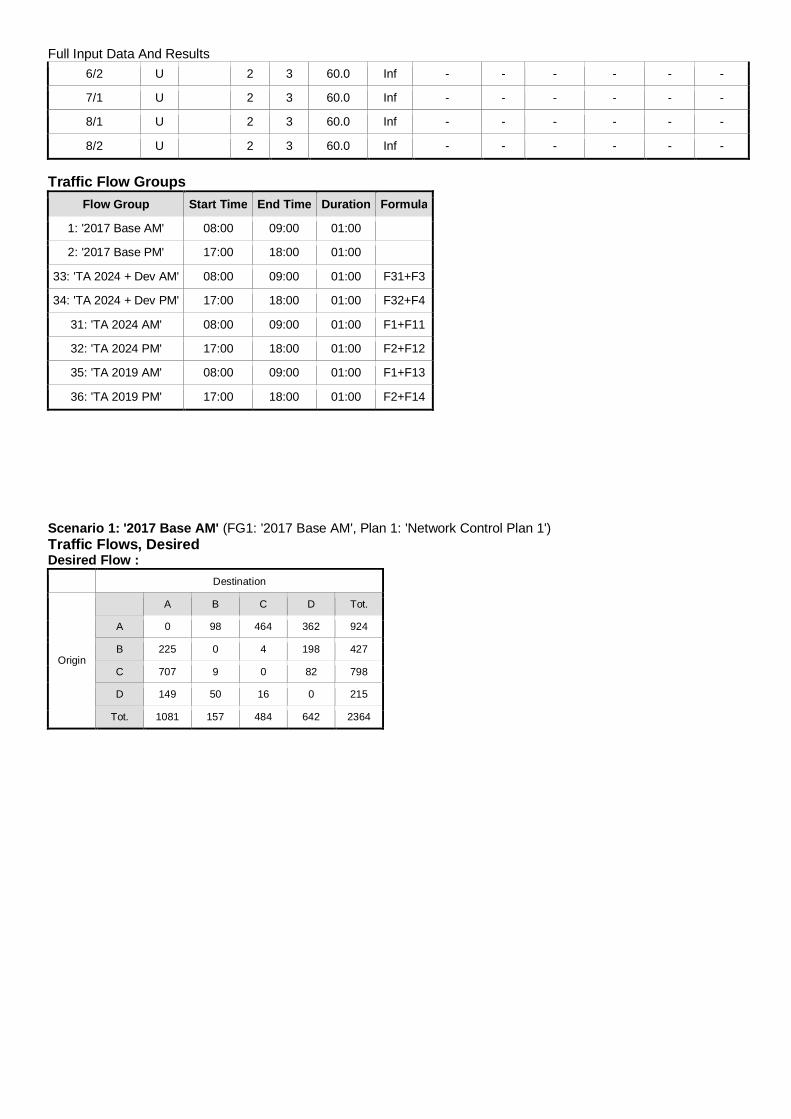
Full Input Data And Results6/2 U 2 3 60.0 Inf - - - - - -
7/1 U 2 3 60.0 Inf - - - - - -
8/1 U 2 3 60.0 Inf - - - - - -
8/2 U 2 3 60.0 Inf - - - - - -
Traffic Flow GroupsFlow Group Start Time End Time Duration Formula
1: '2017 Base AM' 08:00 09:00 01:00
2: '2017 Base PM' 17:00 18:00 01:00
33: 'TA 2024 + Dev AM' 08:00 09:00 01:00 F31+F3
34: 'TA 2024 + Dev PM' 17:00 18:00 01:00 F32+F4
31: 'TA 2024 AM' 08:00 09:00 01:00 F1+F11
32: 'TA 2024 PM' 17:00 18:00 01:00 F2+F12
35: 'TA 2019 AM' 08:00 09:00 01:00 F1+F13
36: 'TA 2019 PM' 17:00 18:00 01:00 F2+F14
Scenario 1: '2017 Base AM' (FG1: '2017 Base AM', Plan 1: 'Network Control Plan 1')Traffic Flows, DesiredDesired Flow :
Destination
Origin
A B C D Tot.
A 0 98 464 362 924
B 225 0 4 198 427
C 707 9 0 82 798
D 149 50 16 0 215
Tot. 1081 157 484 642 2364
Full Input Data And Results
Traffic Lane Flows
Lane Scenario 1:2017 Base AM
Junction: Long Road Junction
1/1 258
1/2 304
1/3 176
1/4 186
2/1(short) 82
2/2(with short)
404(In)322(Out)
2/3(with short)
394(In)385(Out)
2/4(short) 9
3/1(short) 4
3/2(with short)
427(In)423(Out)
4/1 64
4/2 85
4/3 66
5/1 540
5/2 541
6/1 244
6/2 240
7/1 157
8/1 321
8/2 321

Full Input Data And Results
Lane Saturation FlowsJunction: Long Road Junction
LaneLaneWidth
(m)Gradient Nearside
LaneAllowedTurns
TurningRadius
(m)Turning
Prop.Sat Flow(PCU/Hr)
Flared Sat Flow(PCU/Hr)
1/1(A3022 Brixham Road (north)) 3.20 0.00 Y
Arm 6 Ahead Inf 62.0 %1868 1868
Arm 7 Left 16.00 38.0 %
1/2(A3022 Brixham Road (north)) 3.20 0.00 N Arm 6 Ahead Inf 100.0 % 2075 2075
1/3(A3022 Brixham Road (north)) 3.05 0.00 Y Arm 8 Right 11.80 100.0 % 1703 1703
1/4(A3022 Brixham Road (north)) 3.05 0.00 N Arm 8 Right 9.20 100.0 % 1771 1771
2/1(A3022 Brixham Road (south)) 3.10 0.00 Y Arm 8 Left 9.20 100.0 % 1655 1655
2/2(A3022 Brixham Road (south)) 3.10 0.00 Y Arm 5 Ahead Inf 100.0 % 1925 1925
2/3(A3022 Brixham Road (south)) 3.30 0.00 N Arm 5 Ahead Inf 100.0 % 2085 2085
2/4(A3022 Brixham Road (south)) 3.50 0.00 Y Arm 7 Right 10.80 100.0 % 1725 1725
3/1(Goodrington Road) 3.35 0.00 Y Arm 6 Left 7.60 100.0 % 1629 1629
3/2(Goodrington Road) 3.35 0.00 Y
Arm 5 Right 25.60 53.2 %1891 1891
Arm 8 Ahead Inf 46.8 %
4/1(Long Road) 3.00 0.00 Y Arm 5 Left 18.70 100.0 % 1773 1773
4/2(Long Road) 3.00 0.00 N Arm 5 Left 23.40 100.0 % 1931 1931
4/3(Long Road) 3.50 0.00 Y
Arm 6 Right 20.20 24.2 %1930 1930
Arm 7 Ahead Inf 75.8 %
5/1 Infinite Saturation Flow Inf Inf
5/2 Infinite Saturation Flow Inf Inf
6/1 Infinite Saturation Flow Inf Inf
6/2 Infinite Saturation Flow Inf Inf
7/1 Infinite Saturation Flow Inf Inf
8/1 Infinite Saturation Flow Inf Inf
8/2 Infinite Saturation Flow Inf Inf

Full Input Data And Results
Scenario 2: '2017 Base PM' (FG2: '2017 Base PM', Plan 1: 'Network Control Plan 1')Traffic Flows, DesiredDesired Flow :
Destination
Origin
A B C D Tot.
A 0 218 741 194 1153
B 133 0 13 88 234
C 620 20 0 33 673
D 431 166 63 0 660
Tot. 1184 404 817 315 2720
Traffic Lane Flows
Lane Scenario 2:2017 Base PM
Junction: Long Road Junction
1/1 444
1/2 515
1/3 94
1/4 100
2/1(short) 33
2/2(with short)
323(In)290(Out)
2/3(with short)
350(In)330(Out)
2/4(short) 20
3/1(short) 13
3/2(with short)
234(In)221(Out)
4/1 200
4/2 231
4/3 229
5/1 592
5/2 592
6/1 416
6/2 401
7/1 404
8/1 157
8/2 158

Full Input Data And Results
Lane Saturation FlowsJunction: Long Road Junction
LaneLaneWidth
(m)Gradient Nearside
LaneAllowedTurns
TurningRadius
(m)Turning
Prop.Sat Flow(PCU/Hr)
Flared Sat Flow(PCU/Hr)
1/1(A3022 Brixham Road (north)) 3.20 0.00 Y
Arm 6 Ahead Inf 50.9 %1850 1850
Arm 7 Left 16.00 49.1 %
1/2(A3022 Brixham Road (north)) 3.20 0.00 N Arm 6 Ahead Inf 100.0 % 2075 2075
1/3(A3022 Brixham Road (north)) 3.05 0.00 Y Arm 8 Right 11.80 100.0 % 1703 1703
1/4(A3022 Brixham Road (north)) 3.05 0.00 N Arm 8 Right 9.20 100.0 % 1771 1771
2/1(A3022 Brixham Road (south)) 3.10 0.00 Y Arm 8 Left 9.20 100.0 % 1655 1655
2/2(A3022 Brixham Road (south)) 3.10 0.00 Y Arm 5 Ahead Inf 100.0 % 1925 1925
2/3(A3022 Brixham Road (south)) 3.30 0.00 N Arm 5 Ahead Inf 100.0 % 2085 2085
2/4(A3022 Brixham Road (south)) 3.50 0.00 Y Arm 7 Right 10.80 100.0 % 1725 1725
3/1(Goodrington Road) 3.35 0.00 Y Arm 6 Left 7.60 100.0 % 1629 1629
3/2(Goodrington Road) 3.35 0.00 Y
Arm 5 Right 25.60 60.2 %1884 1884
Arm 8 Ahead Inf 39.8 %
4/1(Long Road) 3.00 0.00 Y Arm 5 Left 18.70 100.0 % 1773 1773
4/2(Long Road) 3.00 0.00 N Arm 5 Left 23.40 100.0 % 1931 1931
4/3(Long Road) 3.50 0.00 Y
Arm 6 Right 20.20 27.5 %1926 1926
Arm 7 Ahead Inf 72.5 %
5/1 Infinite Saturation Flow Inf Inf
5/2 Infinite Saturation Flow Inf Inf
6/1 Infinite Saturation Flow Inf Inf
6/2 Infinite Saturation Flow Inf Inf
7/1 Infinite Saturation Flow Inf Inf
8/1 Infinite Saturation Flow Inf Inf
8/2 Infinite Saturation Flow Inf Inf
Full Input Data And Results
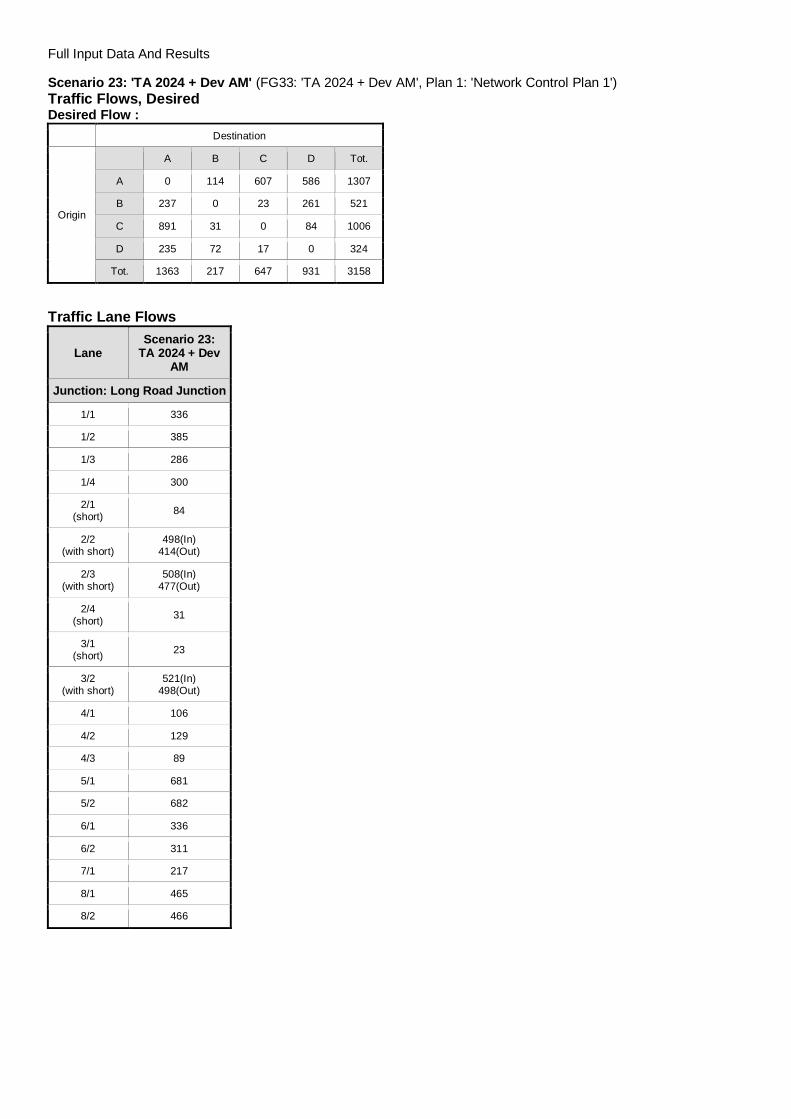
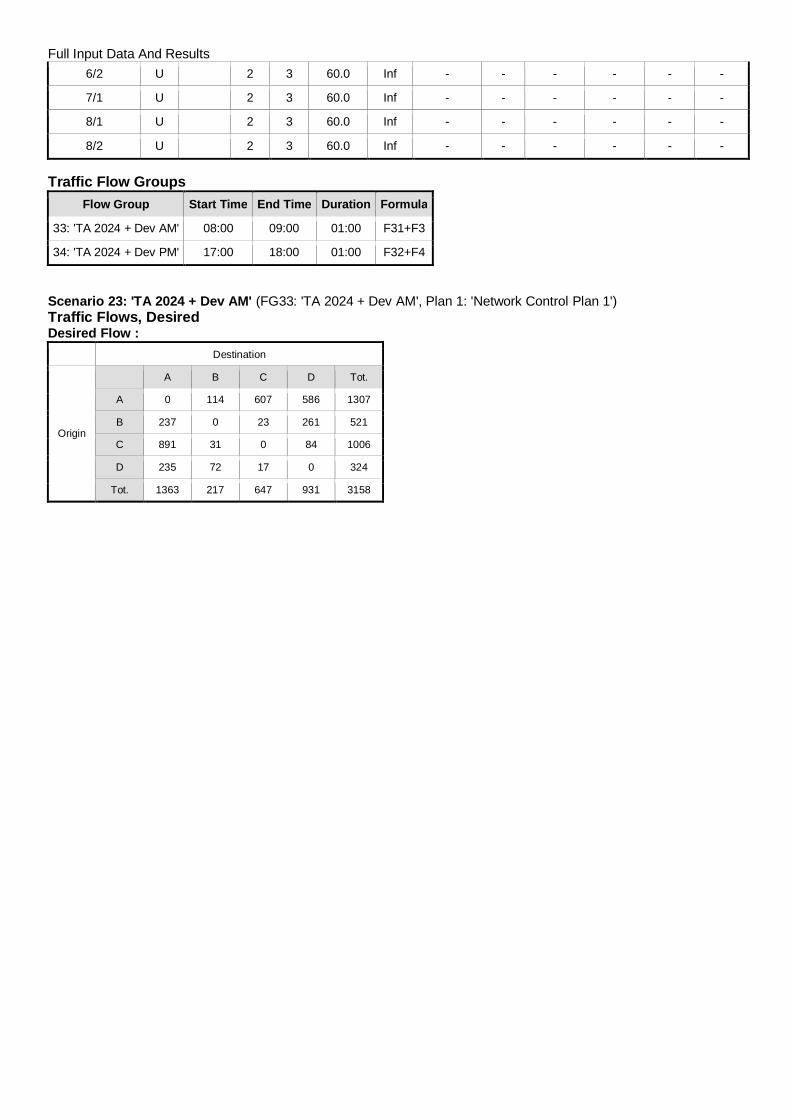
Scenario 23: 'TA 2024 + Dev AM' (FG33: 'TA 2024 + Dev AM', Plan 1: 'Network Control Plan 1')Traffic Flows, DesiredDesired Flow :
Destination
Origin
A B C D Tot.
A 0 114 607 586 1307
B 237 0 23 261 521
C 891 31 0 84 1006
D 235 72 17 0 324
Tot. 1363 217 647 931 3158
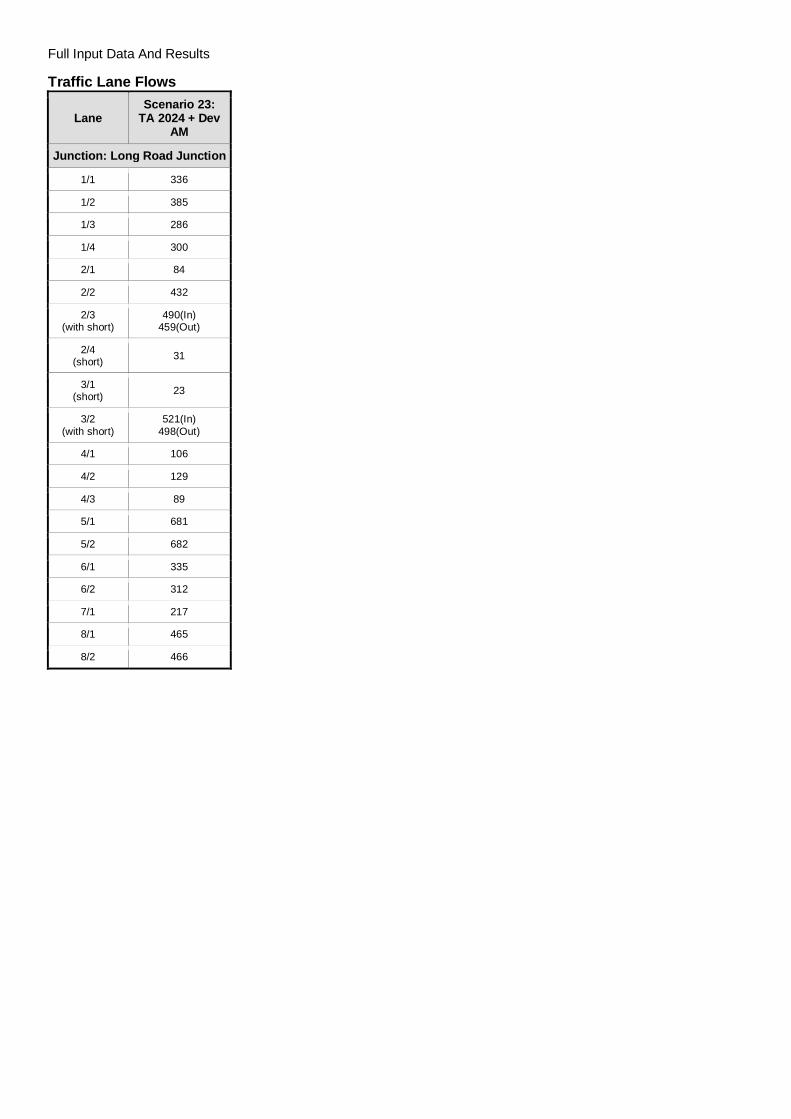
Traffic Lane Flows
LaneScenario 23:
TA 2024 + DevAM
Junction: Long Road Junction
1/1 336
1/2 385
1/3 286
1/4 300
2/1(short) 84
2/2(with short)
498(In)414(Out)
2/3(with short)
508(In)477(Out)
2/4(short) 31
3/1(short) 23
3/2(with short)
521(In)498(Out)
4/1 106
4/2 129
4/3 89
5/1 681
5/2 682
6/1 336
6/2 311
7/1 217
8/1 465
8/2 466

Full Input Data And Results
Lane Saturation FlowsJunction: Long Road Junction
LaneLaneWidth
(m)Gradient Nearside
LaneAllowedTurns
TurningRadius
(m)Turning
Prop.Sat Flow(PCU/Hr)
Flared Sat Flow(PCU/Hr)
1/1(A3022 Brixham Road (north)) 3.20 0.00 Y
Arm 6 Ahead Inf 66.1 %1875 1875
Arm 7 Left 16.00 33.9 %
1/2(A3022 Brixham Road (north)) 3.20 0.00 N Arm 6 Ahead Inf 100.0 % 2075 2075
1/3(A3022 Brixham Road (north)) 3.05 0.00 Y Arm 8 Right 11.80 100.0 % 1703 1703
1/4(A3022 Brixham Road (north)) 3.05 0.00 N Arm 8 Right 9.20 100.0 % 1771 1771
2/1(A3022 Brixham Road (south)) 3.10 0.00 Y Arm 8 Left 9.20 100.0 % 1655 1655
2/2(A3022 Brixham Road (south)) 3.10 0.00 Y Arm 5 Ahead Inf 100.0 % 1925 1925
2/3(A3022 Brixham Road (south)) 3.30 0.00 N Arm 5 Ahead Inf 100.0 % 2085 2085
2/4(A3022 Brixham Road (south)) 3.50 0.00 Y Arm 7 Right 10.80 100.0 % 1725 1725
3/1(Goodrington Road) 3.35 0.00 Y Arm 6 Left 7.60 100.0 % 1629 1629
3/2(Goodrington Road) 3.35 0.00 Y
Arm 5 Right 25.60 47.6 %1897 1897
Arm 8 Ahead Inf 52.4 %
4/1(Long Road) 3.00 0.00 Y Arm 5 Left 18.70 100.0 % 1773 1773
4/2(Long Road) 3.00 0.00 N Arm 5 Left 23.40 100.0 % 1931 1931
4/3(Long Road) 3.50 0.00 Y
Arm 6 Right 20.20 19.1 %1938 1938
Arm 7 Ahead Inf 80.9 %
5/1 Infinite Saturation Flow Inf Inf
5/2 Infinite Saturation Flow Inf Inf
6/1 Infinite Saturation Flow Inf Inf
6/2 Infinite Saturation Flow Inf Inf
7/1 Infinite Saturation Flow Inf Inf
8/1 Infinite Saturation Flow Inf Inf
8/2 Infinite Saturation Flow Inf Inf

Full Input Data And Results
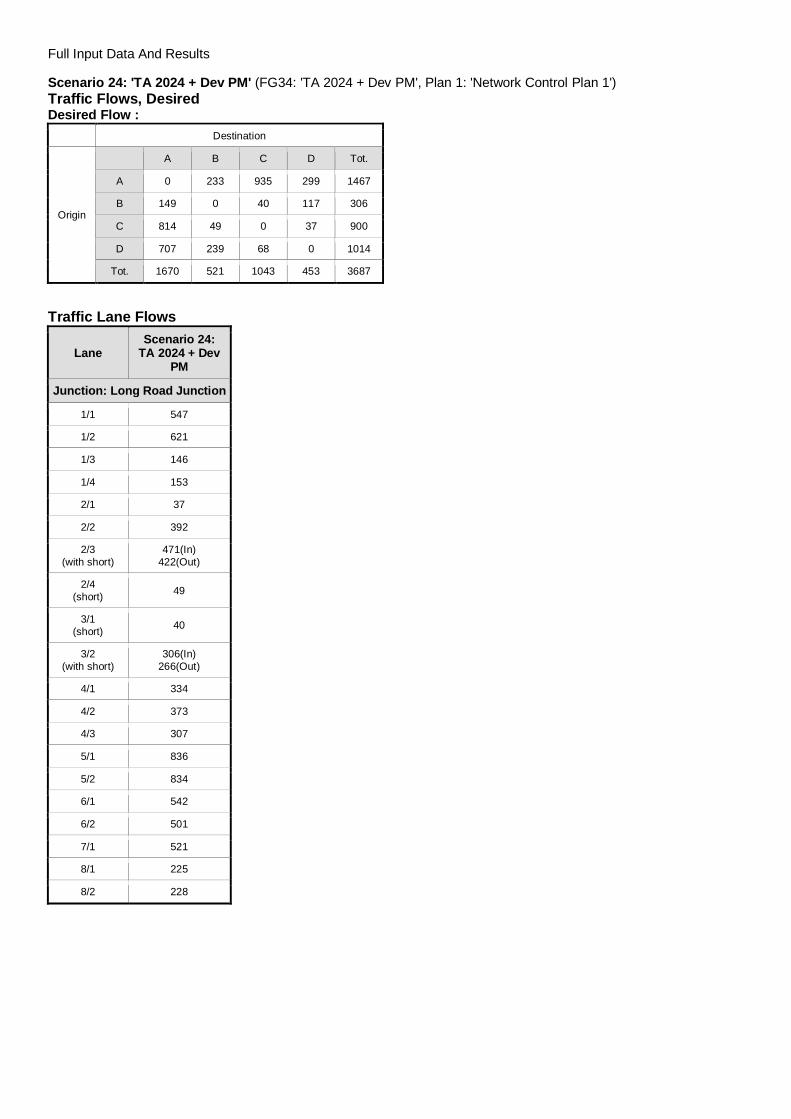
Scenario 24: 'TA 2024 + Dev PM' (FG34: 'TA 2024 + Dev PM', Plan 1: 'Network Control Plan 1')Traffic Flows, DesiredDesired Flow :
Destination
Origin
A B C D Tot.
A 0 233 935 299 1467
B 149 0 40 117 306
C 814 49 0 37 900
D 707 239 68 0 1014
Tot. 1670 521 1043 453 3687
Traffic Lane Flows
LaneScenario 24:
TA 2024 + DevPM
Junction: Long Road Junction
1/1 547
1/2 621
1/3 146
1/4 153
2/1(short) 37
2/2(with short)
427(In)390(Out)
2/3(with short)
473(In)424(Out)
2/4(short) 49
3/1(short) 40
3/2(with short)
306(In)266(Out)
4/1 334
4/2 373
4/3 307
5/1 836
5/2 834
6/1 541
6/2 502
7/1 521
8/1 225
8/2 228

Full Input Data And Results
Lane Saturation FlowsJunction: Long Road Junction
LaneLaneWidth
(m)Gradient Nearside
LaneAllowedTurns
TurningRadius
(m)Turning
Prop.Sat Flow(PCU/Hr)
Flared Sat Flow(PCU/Hr)
1/1(A3022 Brixham Road (north)) 3.20 0.00 Y
Arm 6 Ahead Inf 57.4 %1861 1861
Arm 7 Left 16.00 42.6 %
1/2(A3022 Brixham Road (north)) 3.20 0.00 N Arm 6 Ahead Inf 100.0 % 2075 2075
1/3(A3022 Brixham Road (north)) 3.05 0.00 Y Arm 8 Right 11.80 100.0 % 1703 1703
1/4(A3022 Brixham Road (north)) 3.05 0.00 N Arm 8 Right 9.20 100.0 % 1771 1771
2/1(A3022 Brixham Road (south)) 3.10 0.00 Y Arm 8 Left 9.20 100.0 % 1655 1655
2/2(A3022 Brixham Road (south)) 3.10 0.00 Y Arm 5 Ahead Inf 100.0 % 1925 1925
2/3(A3022 Brixham Road (south)) 3.30 0.00 N Arm 5 Ahead Inf 100.0 % 2085 2085
2/4(A3022 Brixham Road (south)) 3.50 0.00 Y Arm 7 Right 10.80 100.0 % 1725 1725
3/1(Goodrington Road) 3.35 0.00 Y Arm 6 Left 7.60 100.0 % 1629 1629
3/2(Goodrington Road) 3.35 0.00 Y
Arm 5 Right 25.60 56.0 %1888 1888
Arm 8 Ahead Inf 44.0 %
4/1(Long Road) 3.00 0.00 Y Arm 5 Left 18.70 100.0 % 1773 1773
4/2(Long Road) 3.00 0.00 N Arm 5 Left 23.40 100.0 % 1931 1931
4/3(Long Road) 3.50 0.00 Y
Arm 6 Right 20.20 22.1 %1933 1933
Arm 7 Ahead Inf 77.9 %
5/1 Infinite Saturation Flow Inf Inf
5/2 Infinite Saturation Flow Inf Inf
6/1 Infinite Saturation Flow Inf Inf
6/2 Infinite Saturation Flow Inf Inf
7/1 Infinite Saturation Flow Inf Inf
8/1 Infinite Saturation Flow Inf Inf
8/2 Infinite Saturation Flow Inf Inf
Full Input Data And Results
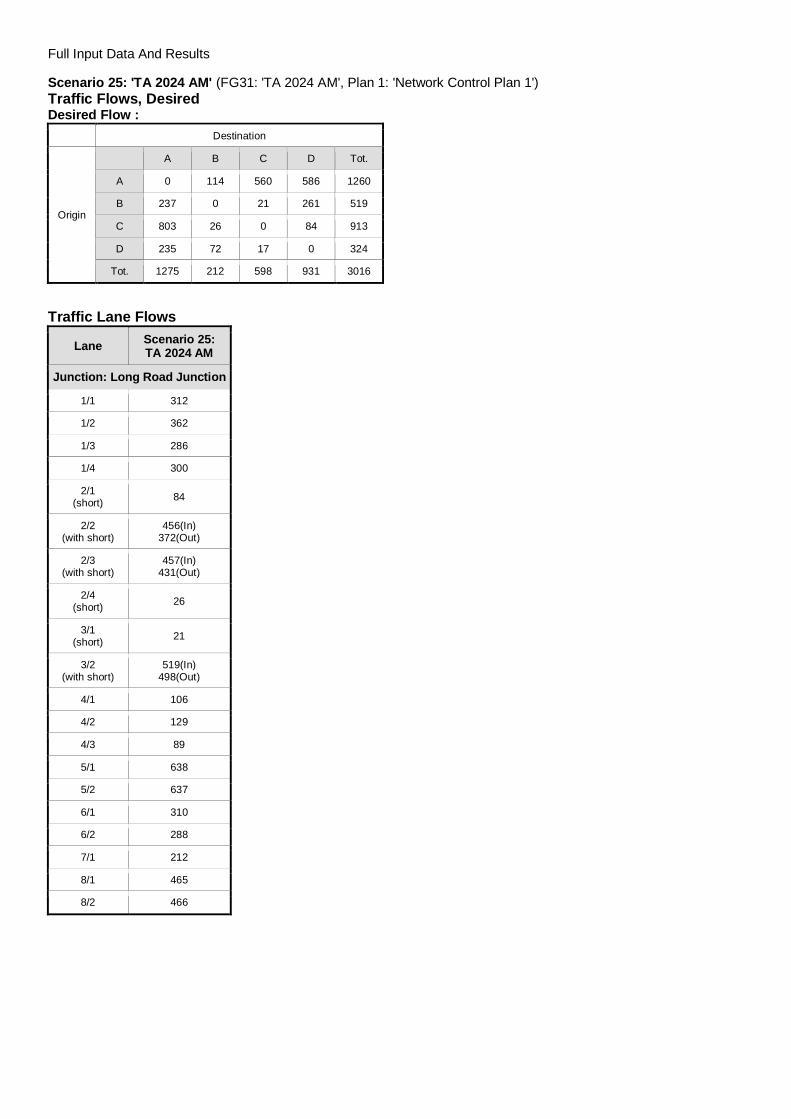
Scenario 25: 'TA 2024 AM' (FG31: 'TA 2024 AM', Plan 1: 'Network Control Plan 1')Traffic Flows, DesiredDesired Flow :
Destination
Origin
A B C D Tot.
A 0 114 560 586 1260
B 237 0 21 261 519
C 803 26 0 84 913
D 235 72 17 0 324
Tot. 1275 212 598 931 3016
Traffic Lane Flows
Lane Scenario 25:TA 2024 AM
Junction: Long Road Junction
1/1 312
1/2 362
1/3 286
1/4 300
2/1(short) 84
2/2(with short)
456(In)372(Out)
2/3(with short)
457(In)431(Out)
2/4(short) 26
3/1(short) 21
3/2(with short)
519(In)498(Out)
4/1 106
4/2 129
4/3 89
5/1 638
5/2 637
6/1 310
6/2 288
7/1 212
8/1 465
8/2 466
Full Input Data And Results
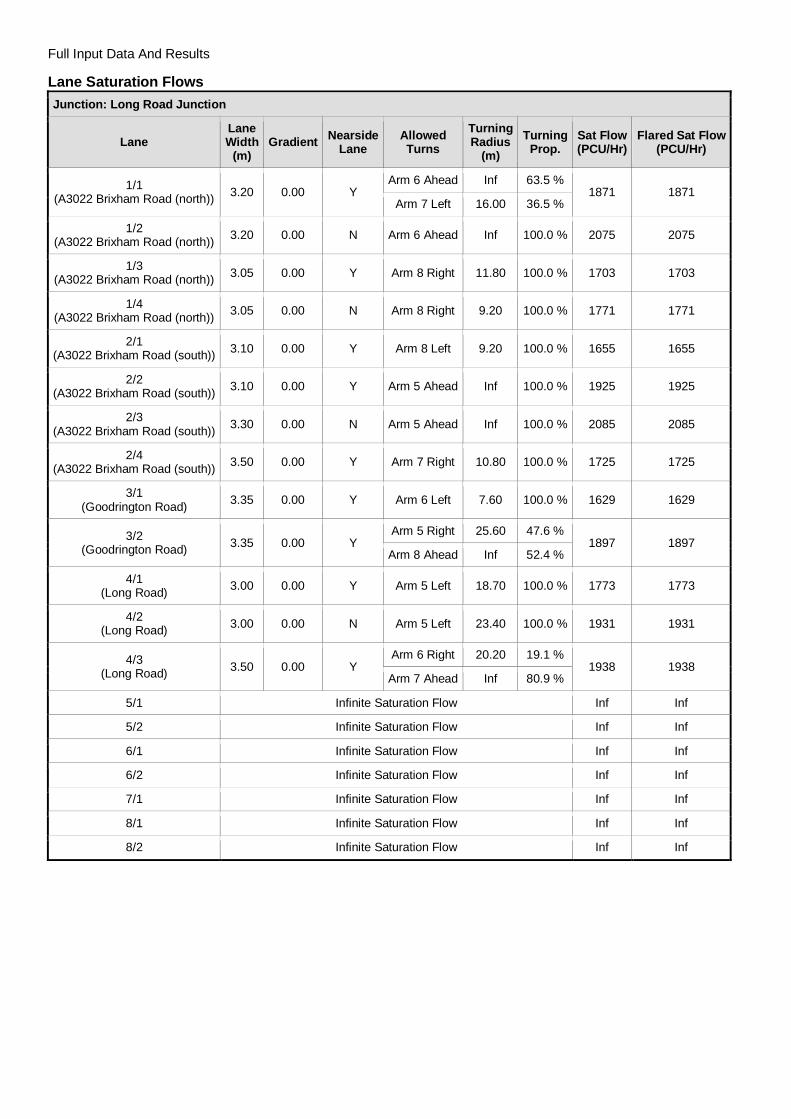
Lane Saturation FlowsJunction: Long Road Junction
LaneLaneWidth
(m)Gradient Nearside
LaneAllowedTurns
TurningRadius
(m)Turning
Prop.Sat Flow(PCU/Hr)
Flared Sat Flow(PCU/Hr)
1/1(A3022 Brixham Road (north)) 3.20 0.00 Y
Arm 6 Ahead Inf 63.5 %1871 1871
Arm 7 Left 16.00 36.5 %
1/2(A3022 Brixham Road (north)) 3.20 0.00 N Arm 6 Ahead Inf 100.0 % 2075 2075
1/3(A3022 Brixham Road (north)) 3.05 0.00 Y Arm 8 Right 11.80 100.0 % 1703 1703
1/4(A3022 Brixham Road (north)) 3.05 0.00 N Arm 8 Right 9.20 100.0 % 1771 1771
2/1(A3022 Brixham Road (south)) 3.10 0.00 Y Arm 8 Left 9.20 100.0 % 1655 1655
2/2(A3022 Brixham Road (south)) 3.10 0.00 Y Arm 5 Ahead Inf 100.0 % 1925 1925
2/3(A3022 Brixham Road (south)) 3.30 0.00 N Arm 5 Ahead Inf 100.0 % 2085 2085
2/4(A3022 Brixham Road (south)) 3.50 0.00 Y Arm 7 Right 10.80 100.0 % 1725 1725
3/1(Goodrington Road) 3.35 0.00 Y Arm 6 Left 7.60 100.0 % 1629 1629
3/2(Goodrington Road) 3.35 0.00 Y
Arm 5 Right 25.60 47.6 %1897 1897
Arm 8 Ahead Inf 52.4 %
4/1(Long Road) 3.00 0.00 Y Arm 5 Left 18.70 100.0 % 1773 1773
4/2(Long Road) 3.00 0.00 N Arm 5 Left 23.40 100.0 % 1931 1931
4/3(Long Road) 3.50 0.00 Y
Arm 6 Right 20.20 19.1 %1938 1938
Arm 7 Ahead Inf 80.9 %
5/1 Infinite Saturation Flow Inf Inf
5/2 Infinite Saturation Flow Inf Inf
6/1 Infinite Saturation Flow Inf Inf
6/2 Infinite Saturation Flow Inf Inf
7/1 Infinite Saturation Flow Inf Inf
8/1 Infinite Saturation Flow Inf Inf
8/2 Infinite Saturation Flow Inf Inf

Full Input Data And Results
Scenario 26: 'TA 2024 PM' (FG32: 'TA 2024 PM', Plan 1: 'Network Control Plan 1')Traffic Flows, DesiredDesired Flow :
Destination
Origin
A B C D Tot.
A 0 233 843 299 1375
B 149 0 34 117 300
C 757 45 0 37 839
D 707 239 68 0 1014
Tot. 1613 517 945 453 3528
Traffic Lane Flows
Lane Scenario 26:TA 2024 PM
Junction: Long Road Junction
1/1 501
1/2 575
1/3 146
1/4 153
2/1(short) 37
2/2(with short)
399(In)362(Out)
2/3(with short)
440(In)395(Out)
2/4(short) 45
3/1(short) 34
3/2(with short)
300(In)266(Out)
4/1 334
4/2 373
4/3 307
5/1 808
5/2 805
6/1 489
6/2 456
7/1 517
8/1 225
8/2 228

Full Input Data And Results
Lane Saturation FlowsJunction: Long Road Junction
LaneLaneWidth
(m)Gradient Nearside
LaneAllowedTurns
TurningRadius
(m)Turning
Prop.Sat Flow(PCU/Hr)
Flared Sat Flow(PCU/Hr)
1/1(A3022 Brixham Road (north)) 3.20 0.00 Y
Arm 6 Ahead Inf 53.5 %1854 1854
Arm 7 Left 16.00 46.5 %
1/2(A3022 Brixham Road (north)) 3.20 0.00 N Arm 6 Ahead Inf 100.0 % 2075 2075
1/3(A3022 Brixham Road (north)) 3.05 0.00 Y Arm 8 Right 11.80 100.0 % 1703 1703
1/4(A3022 Brixham Road (north)) 3.05 0.00 N Arm 8 Right 9.20 100.0 % 1771 1771
2/1(A3022 Brixham Road (south)) 3.10 0.00 Y Arm 8 Left 9.20 100.0 % 1655 1655
2/2(A3022 Brixham Road (south)) 3.10 0.00 Y Arm 5 Ahead Inf 100.0 % 1925 1925
2/3(A3022 Brixham Road (south)) 3.30 0.00 N Arm 5 Ahead Inf 100.0 % 2085 2085
2/4(A3022 Brixham Road (south)) 3.50 0.00 Y Arm 7 Right 10.80 100.0 % 1725 1725
3/1(Goodrington Road) 3.35 0.00 Y Arm 6 Left 7.60 100.0 % 1629 1629
3/2(Goodrington Road) 3.35 0.00 Y
Arm 5 Right 25.60 56.0 %1888 1888
Arm 8 Ahead Inf 44.0 %
4/1(Long Road) 3.00 0.00 Y Arm 5 Left 18.70 100.0 % 1773 1773
4/2(Long Road) 3.00 0.00 N Arm 5 Left 23.40 100.0 % 1931 1931
4/3(Long Road) 3.50 0.00 Y
Arm 6 Right 20.20 22.1 %1933 1933
Arm 7 Ahead Inf 77.9 %
5/1 Infinite Saturation Flow Inf Inf
5/2 Infinite Saturation Flow Inf Inf
6/1 Infinite Saturation Flow Inf Inf
6/2 Infinite Saturation Flow Inf Inf
7/1 Infinite Saturation Flow Inf Inf
8/1 Infinite Saturation Flow Inf Inf
8/2 Infinite Saturation Flow Inf Inf

Full Input Data And Results
Scenario 27: 'TA 2019 AM' (FG35: 'TA 2019 AM', Plan 1: 'Network Control Plan 1')Traffic Flows, DesiredDesired Flow :
Destination
Origin
A B C D Tot.
A 0 100 531 547 1178
B 229 0 21 251 501
C 780 26 0 82 888
D 216 68 16 0 300
Tot. 1225 194 568 880 2867
Traffic Lane Flows
Lane Scenario 27:TA 2019 AM
Junction: Long Road Junction
1/1 292
1/2 339
1/3 268
1/4 279
2/1(short) 82
2/2(with short)
444(In)362(Out)
2/3(with short)
444(In)418(Out)
2/4(short) 26
3/1(short) 21
3/2(with short)
501(In)480(Out)
4/1 98
4/2 118
4/3 84
5/1 613
5/2 612
6/1 294
6/2 274
7/1 194
8/1 439
8/2 441

Full Input Data And Results
Lane Saturation FlowsJunction: Long Road Junction
LaneLaneWidth
(m)Gradient Nearside
LaneAllowedTurns
TurningRadius
(m)Turning
Prop.Sat Flow(PCU/Hr)
Flared Sat Flow(PCU/Hr)
1/1(A3022 Brixham Road (north)) 3.20 0.00 Y
Arm 6 Ahead Inf 65.8 %1875 1875
Arm 7 Left 16.00 34.2 %
1/2(A3022 Brixham Road (north)) 3.20 0.00 N Arm 6 Ahead Inf 100.0 % 2075 2075
1/3(A3022 Brixham Road (north)) 3.05 0.00 Y Arm 8 Right 11.80 100.0 % 1703 1703
1/4(A3022 Brixham Road (north)) 3.05 0.00 N Arm 8 Right 9.20 100.0 % 1771 1771
2/1(A3022 Brixham Road (south)) 3.10 0.00 Y Arm 8 Left 9.20 100.0 % 1655 1655
2/2(A3022 Brixham Road (south)) 3.10 0.00 Y Arm 5 Ahead Inf 100.0 % 1925 1925
2/3(A3022 Brixham Road (south)) 3.30 0.00 N Arm 5 Ahead Inf 100.0 % 2085 2085
2/4(A3022 Brixham Road (south)) 3.50 0.00 Y Arm 7 Right 10.80 100.0 % 1725 1725
3/1(Goodrington Road) 3.35 0.00 Y Arm 6 Left 7.60 100.0 % 1629 1629
3/2(Goodrington Road) 3.35 0.00 Y
Arm 5 Right 25.60 47.7 %1897 1897
Arm 8 Ahead Inf 52.3 %
4/1(Long Road) 3.00 0.00 Y Arm 5 Left 18.70 100.0 % 1773 1773
4/2(Long Road) 3.00 0.00 N Arm 5 Left 23.40 100.0 % 1931 1931
4/3(Long Road) 3.50 0.00 Y
Arm 6 Right 20.20 19.0 %1938 1938
Arm 7 Ahead Inf 81.0 %
5/1 Infinite Saturation Flow Inf Inf
5/2 Infinite Saturation Flow Inf Inf
6/1 Infinite Saturation Flow Inf Inf
6/2 Infinite Saturation Flow Inf Inf
7/1 Infinite Saturation Flow Inf Inf
8/1 Infinite Saturation Flow Inf Inf
8/2 Infinite Saturation Flow Inf Inf

Full Input Data And Results
Scenario 28: 'TA 2019 PM' (FG36: 'TA 2019 PM', Plan 1: 'Network Control Plan 1')Traffic Flows, DesiredDesired Flow :
Destination
Origin
A B C D Tot.
A 0 222 822 263 1307
B 136 0 34 108 278
C 722 45 0 33 800
D 644 224 63 0 931
Tot. 1502 491 919 404 3316
Traffic Lane Flows
Lane Scenario 28:TA 2019 PM
Junction: Long Road Junction
1/1 486
1/2 558
1/3 128
1/4 135
2/1(short) 33
2/2(with short)
377(In)344(Out)
2/3(with short)
423(In)378(Out)
2/4(short) 45
3/1(short) 34
3/2(with short)
278(In)244(Out)
4/1 302
4/2 342
4/3 287
5/1 751
5/2 751
6/1 477
6/2 442
7/1 491
8/1 201
8/2 203

Full Input Data And Results
Lane Saturation FlowsJunction: Long Road Junction
LaneLaneWidth
(m)Gradient Nearside
LaneAllowedTurns
TurningRadius
(m)Turning
Prop.Sat Flow(PCU/Hr)
Flared Sat Flow(PCU/Hr)
1/1(A3022 Brixham Road (north)) 3.20 0.00 Y
Arm 6 Ahead Inf 54.3 %1856 1856
Arm 7 Left 16.00 45.7 %
1/2(A3022 Brixham Road (north)) 3.20 0.00 N Arm 6 Ahead Inf 100.0 % 2075 2075
1/3(A3022 Brixham Road (north)) 3.05 0.00 Y Arm 8 Right 11.80 100.0 % 1703 1703
1/4(A3022 Brixham Road (north)) 3.05 0.00 N Arm 8 Right 9.20 100.0 % 1771 1771
2/1(A3022 Brixham Road (south)) 3.10 0.00 Y Arm 8 Left 9.20 100.0 % 1655 1655
2/2(A3022 Brixham Road (south)) 3.10 0.00 Y Arm 5 Ahead Inf 100.0 % 1925 1925
2/3(A3022 Brixham Road (south)) 3.30 0.00 N Arm 5 Ahead Inf 100.0 % 2085 2085
2/4(A3022 Brixham Road (south)) 3.50 0.00 Y Arm 7 Right 10.80 100.0 % 1725 1725
3/1(Goodrington Road) 3.35 0.00 Y Arm 6 Left 7.60 100.0 % 1629 1629
3/2(Goodrington Road) 3.35 0.00 Y
Arm 5 Right 25.60 55.7 %1888 1888
Arm 8 Ahead Inf 44.3 %
4/1(Long Road) 3.00 0.00 Y Arm 5 Left 18.70 100.0 % 1773 1773
4/2(Long Road) 3.00 0.00 N Arm 5 Left 23.40 100.0 % 1931 1931
4/3(Long Road) 3.50 0.00 Y
Arm 6 Right 20.20 22.0 %1933 1933
Arm 7 Ahead Inf 78.0 %
5/1 Infinite Saturation Flow Inf Inf
5/2 Infinite Saturation Flow Inf Inf
6/1 Infinite Saturation Flow Inf Inf
6/2 Infinite Saturation Flow Inf Inf
7/1 Infinite Saturation Flow Inf Inf
8/1 Infinite Saturation Flow Inf Inf
8/2 Infinite Saturation Flow Inf Inf
Scenario 1: '2017 Base AM' (FG1: '2017 Base AM', Plan 1: 'Network Control Plan 1')Stage Sequence Diagram
A
B
I
L
N
O
1 Min: 7
8 26s
C
D
F H J
L
N
2 Min: 7
14 9s
F
G
H I J
LM
3 Min: 7
10 7s
E
I J
KN
O
4 Min: 7
14 32s
Full Input Data And Results
Stage TimingsStage 1 2 3 4
Duration 26 9 7 32
Change Point 0 34 57 74
Signal Timings Diagram
0
0
10
10
20
20
30
30
40
40
50
50
60
60
70
70
80
80
90
90
100
100
110
110
120
120
Time in cycle (sec)
Phas
es
1 8 : 260
2 14 : 934
3 10 : 757
4 14 : 3274
O ON NM ML LK KJ JI I
H HG GF FE ED DC CB BA A

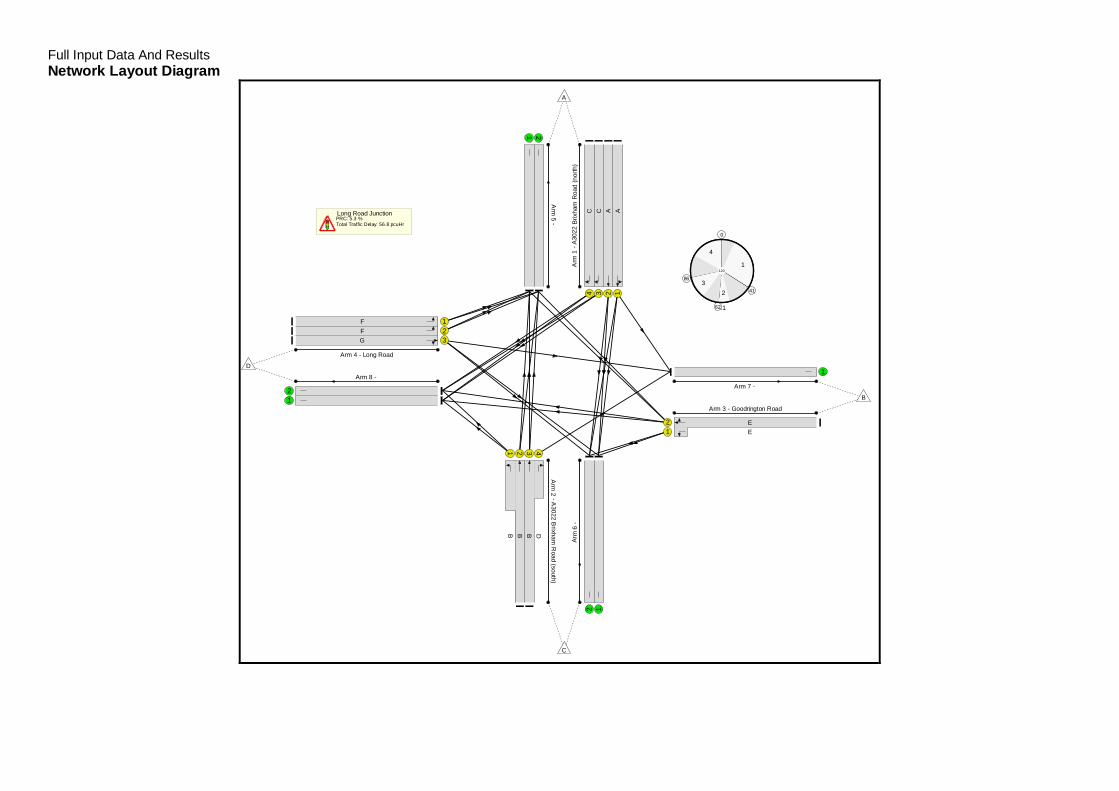
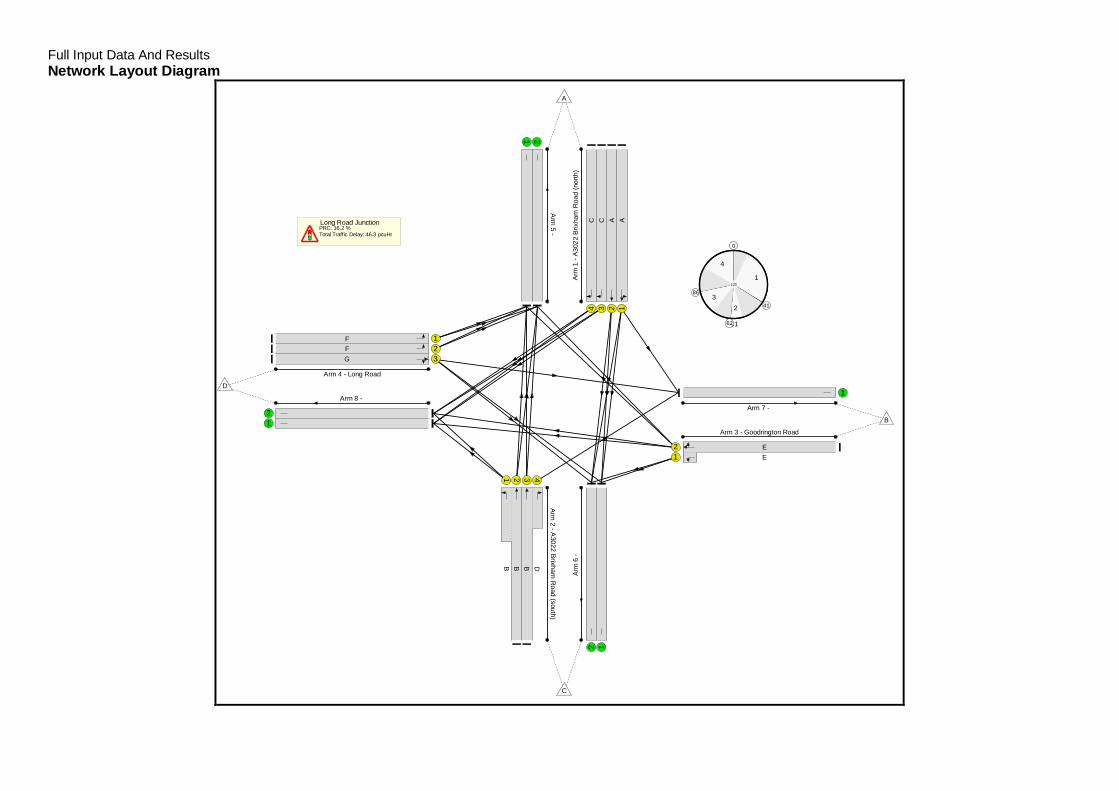
Full Input Data And ResultsNetwork Layout Diagram
Long Road JunctionPRC: 15.6 %Total Traffic Delay: 35.0 pcuHr
C1
0
1
34
2
57
374
4
120
Arm
1-A
3022
Brix
ham
Roa
d(n
orth
)
1234
AACC
Arm
2-A
3022Brixham
Road
(south)
1 2 3 4
B B B D
Arm 3 - Goodrington Road
12
EE
Arm 4 - Long Road
123
FFG
Arm
5-
1 2Ar
m6
-
12
Arm 7 -
1Arm 8 -
12
A
B
C
D

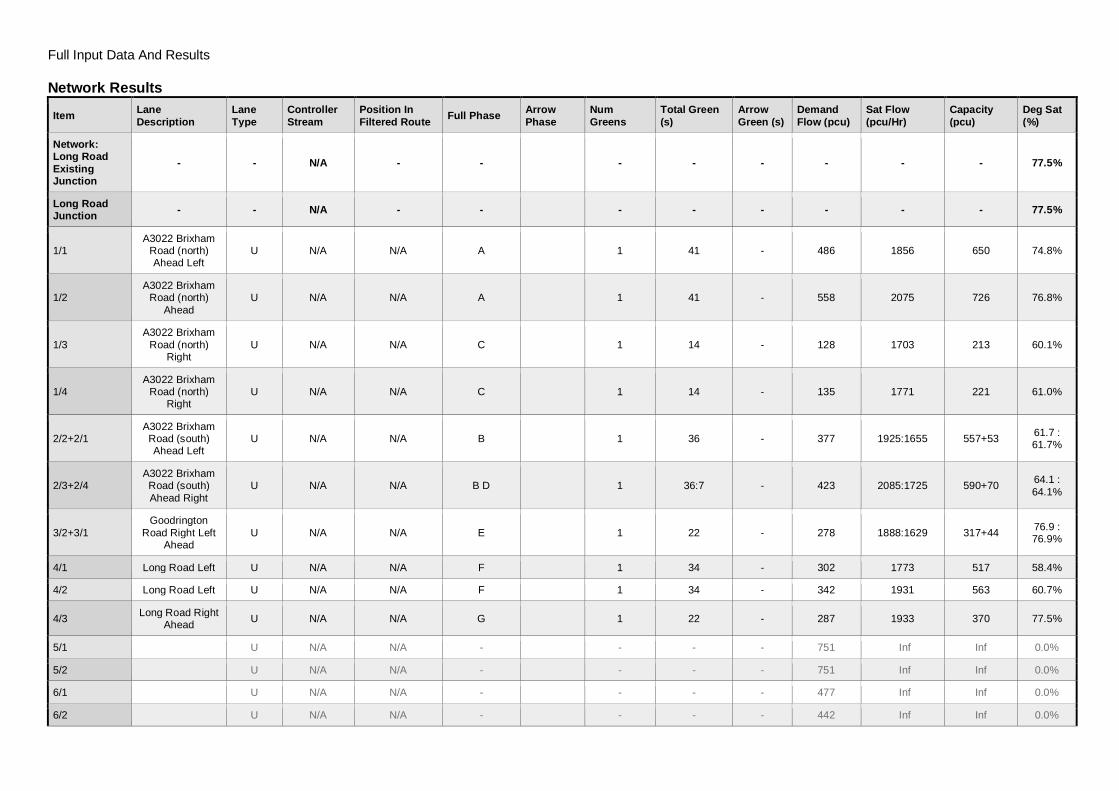
Full Input Data And Results
Network Results
Item LaneDescription
LaneType
ControllerStream
Position InFiltered Route Full Phase Arrow
PhaseNumGreens
Total Green(s)
ArrowGreen (s)
DemandFlow (pcu)
Sat Flow(pcu/Hr)
Capacity(pcu)
Deg Sat(%)
Network:Long RoadExistingJunction
- - N/A - - - - - - - - 77.9%
Long RoadJunction - - N/A - - - - - - - - 77.9%
1/1A3022 Brixham
Road (north)Ahead Left
U N/A N/A A 1 34 - 258 1868 545 47.4%
1/2A3022 Brixham
Road (north)Ahead
U N/A N/A A 1 34 - 304 2075 605 50.2%
1/3A3022 Brixham
Road (north)Right
U N/A N/A C 1 16 - 176 1703 241 73.0%
1/4A3022 Brixham
Road (north)Right
U N/A N/A C 1 16 - 186 1771 251 74.1%
2/2+2/1A3022 BrixhamRoad (south)Ahead Left
U N/A N/A B 1 29 - 404 1925:1655 426+108 75.7 :75.7%
2/3+2/4A3022 BrixhamRoad (south)Ahead Right
U N/A N/A B D 1 29:9 - 394 2085:1725 518+12 74.3 :74.3%
3/2+3/1Goodrington
Road Right LeftAhead
U N/A N/A E 1 34 - 427 1891:1629 543+5 77.9 :77.9%
4/1 Long Road Left U N/A N/A F 1 29 - 64 1773 443 14.4%
4/2 Long Road Left U N/A N/A F 1 29 - 85 1931 483 17.6%
4/3 Long Road RightAhead U N/A N/A G 1 15 - 66 1930 257 25.6%
5/1 U N/A N/A - - - - 540 Inf Inf 0.0%
5/2 U N/A N/A - - - - 541 Inf Inf 0.0%
6/1 U N/A N/A - - - - 244 Inf Inf 0.0%
6/2 U N/A N/A - - - - 240 Inf Inf 0.0%
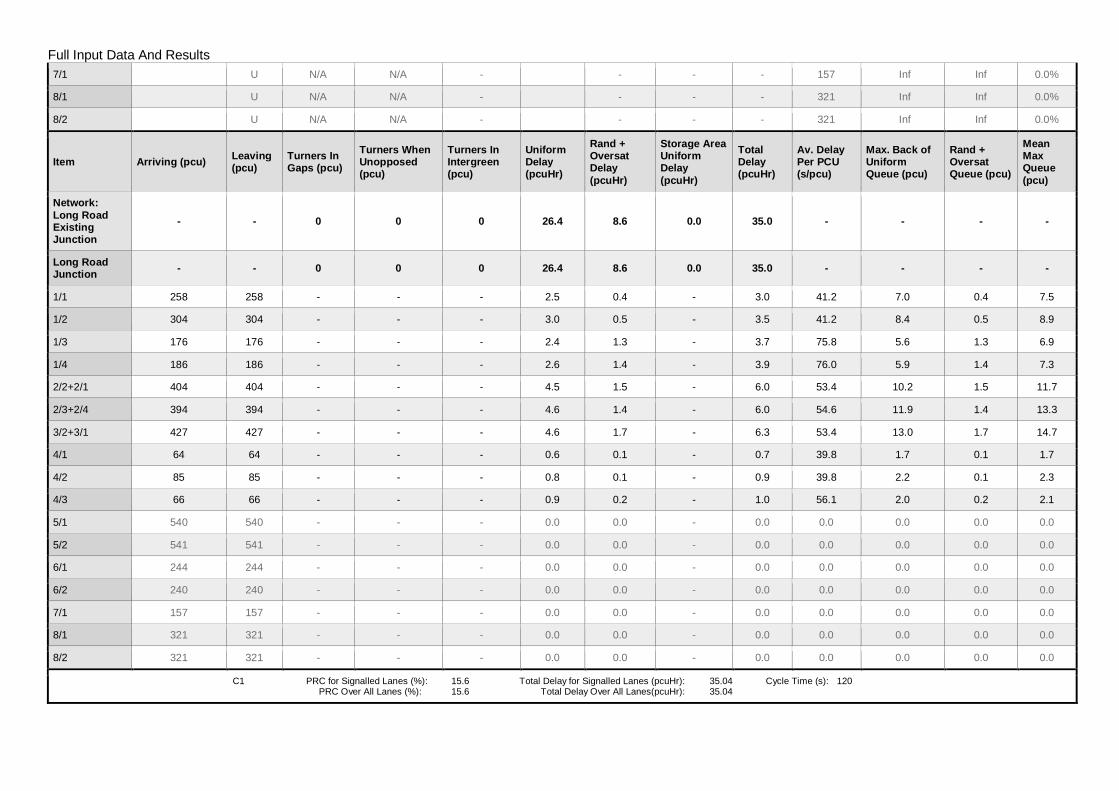
Full Input Data And Results7/1 U N/A N/A - - - - 157 Inf Inf 0.0%
8/1 U N/A N/A - - - - 321 Inf Inf 0.0%
8/2 U N/A N/A - - - - 321 Inf Inf 0.0%
Item Arriving (pcu) Leaving(pcu)
Turners InGaps (pcu)
Turners WhenUnopposed(pcu)
Turners InIntergreen(pcu)
UniformDelay(pcuHr)
Rand +OversatDelay(pcuHr)
Storage AreaUniformDelay(pcuHr)
TotalDelay(pcuHr)
Av. DelayPer PCU(s/pcu)
Max. Back ofUniformQueue (pcu)
Rand +OversatQueue (pcu)
MeanMaxQueue(pcu)
Network:Long RoadExistingJunction
- - 0 0 0 26.4 8.6 0.0 35.0 - - - -
Long RoadJunction - - 0 0 0 26.4 8.6 0.0 35.0 - - - -
1/1 258 258 - - - 2.5 0.4 - 3.0 41.2 7.0 0.4 7.5
1/2 304 304 - - - 3.0 0.5 - 3.5 41.2 8.4 0.5 8.9
1/3 176 176 - - - 2.4 1.3 - 3.7 75.8 5.6 1.3 6.9
1/4 186 186 - - - 2.6 1.4 - 3.9 76.0 5.9 1.4 7.3
2/2+2/1 404 404 - - - 4.5 1.5 - 6.0 53.4 10.2 1.5 11.7
2/3+2/4 394 394 - - - 4.6 1.4 - 6.0 54.6 11.9 1.4 13.3
3/2+3/1 427 427 - - - 4.6 1.7 - 6.3 53.4 13.0 1.7 14.7
4/1 64 64 - - - 0.6 0.1 - 0.7 39.8 1.7 0.1 1.7
4/2 85 85 - - - 0.8 0.1 - 0.9 39.8 2.2 0.1 2.3
4/3 66 66 - - - 0.9 0.2 - 1.0 56.1 2.0 0.2 2.1
5/1 540 540 - - - 0.0 0.0 - 0.0 0.0 0.0 0.0 0.0
5/2 541 541 - - - 0.0 0.0 - 0.0 0.0 0.0 0.0 0.0
6/1 244 244 - - - 0.0 0.0 - 0.0 0.0 0.0 0.0 0.0
6/2 240 240 - - - 0.0 0.0 - 0.0 0.0 0.0 0.0 0.0
7/1 157 157 - - - 0.0 0.0 - 0.0 0.0 0.0 0.0 0.0
8/1 321 321 - - - 0.0 0.0 - 0.0 0.0 0.0 0.0 0.0
8/2 321 321 - - - 0.0 0.0 - 0.0 0.0 0.0 0.0 0.0
C1 PRC for Signalled Lanes (%): 15.6 Total Delay for Signalled Lanes (pcuHr): 35.04 Cycle Time (s): 120 PRC Over All Lanes (%): 15.6 Total Delay Over All Lanes(pcuHr): 35.04
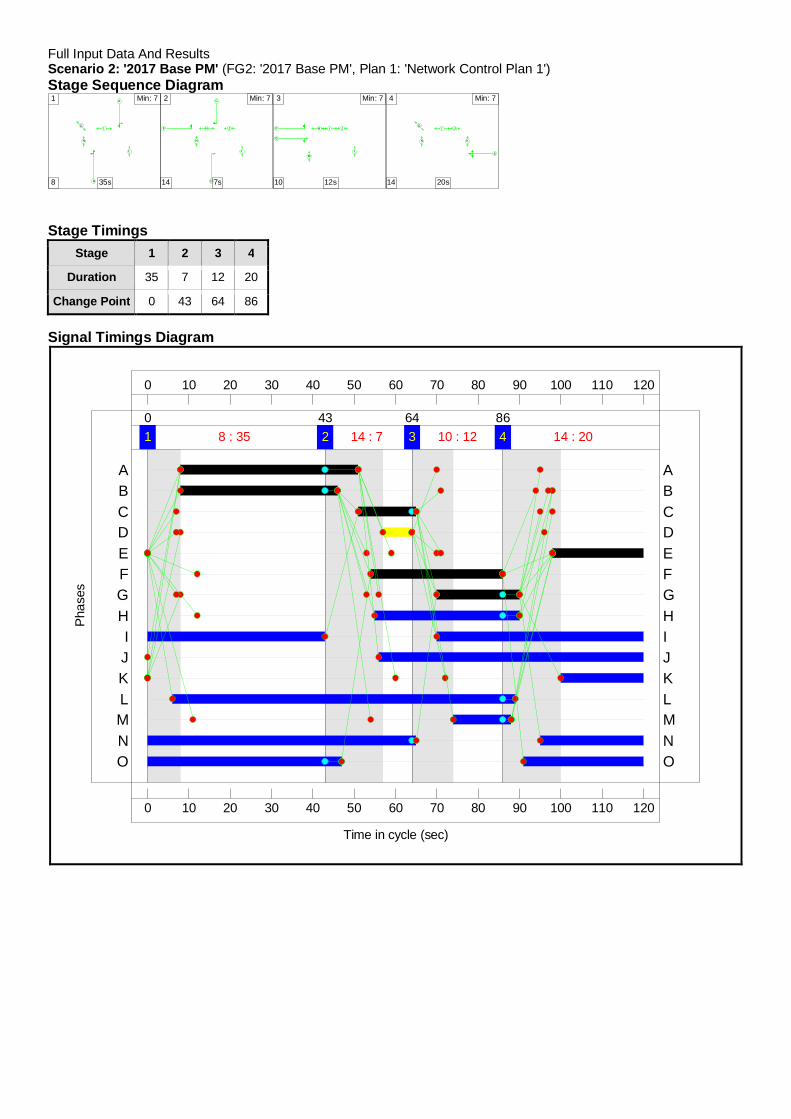
Full Input Data And ResultsScenario 2: '2017 Base PM' (FG2: '2017 Base PM', Plan 1: 'Network Control Plan 1')Stage Sequence Diagram
A
B
I
L
N
O
1 Min: 7
8 35s
C
D
F H J
L
N
2 Min: 7
14 7s
F
G
H I J
LM
3 Min: 7
10 12s
E
I J
KN
O
4 Min: 7
14 20s
Stage TimingsStage 1 2 3 4
Duration 35 7 12 20
Change Point 0 43 64 86
Signal Timings Diagram
0
0
10
10
20
20
30
30
40
40
50
50
60
60
70
70
80
80
90
90
100
100
110
110
120
120
Time in cycle (sec)
Phas
es
1 8 : 350
2 14 : 743
3 10 : 1264
4 14 : 2086
O ON NM ML LK KJ JI I
H HG GF FE ED DC CB BA A
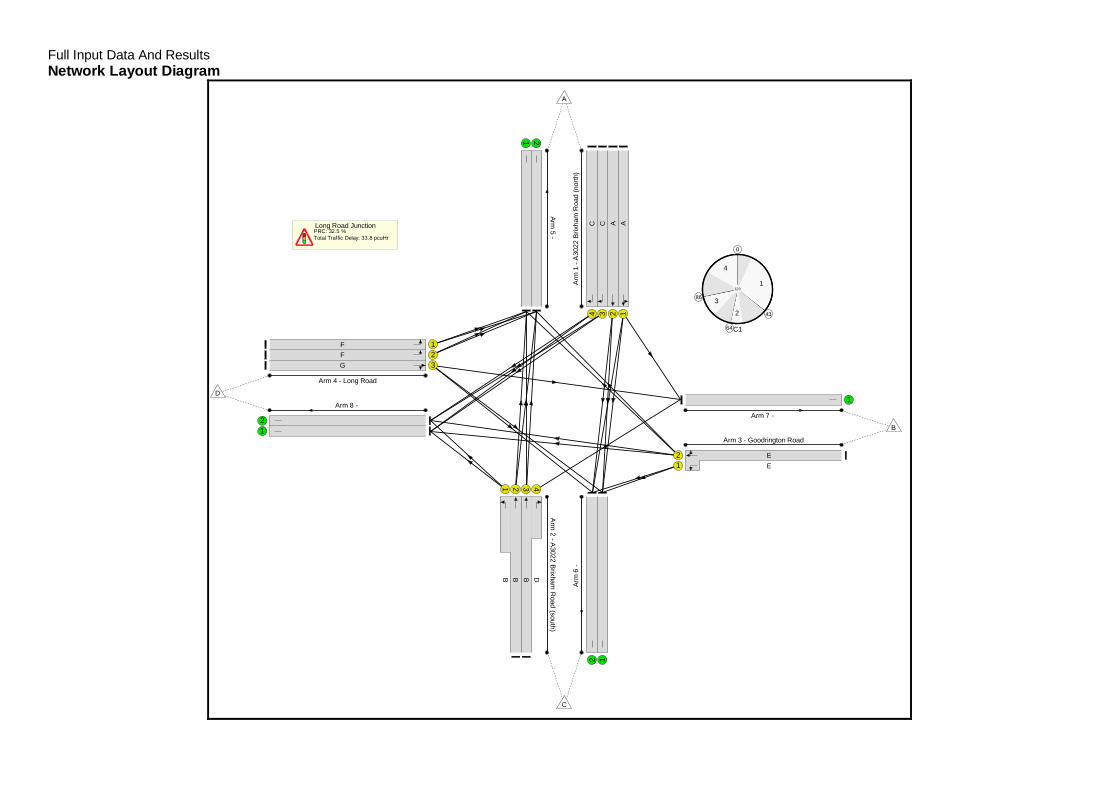
Full Input Data And ResultsNetwork Layout Diagram
Long Road JunctionPRC: 32.5 %Total Traffic Delay: 33.8 pcuHr
C1
0
1
432
64
386
4
120
Arm
1-A
3022
Brix
ham
Roa
d(n
orth
)
1234
AACC
Arm
2-A
3022B
rixhamR
oad(south)
1 2 3 4
B B B D
Arm 3 - Goodrington Road
12
EE
Arm 4 - Long Road
123
FFG
Arm5
-
1 2Ar
m6
-
12
Arm 7 -
1Arm 8 -
12
A
B
C
D
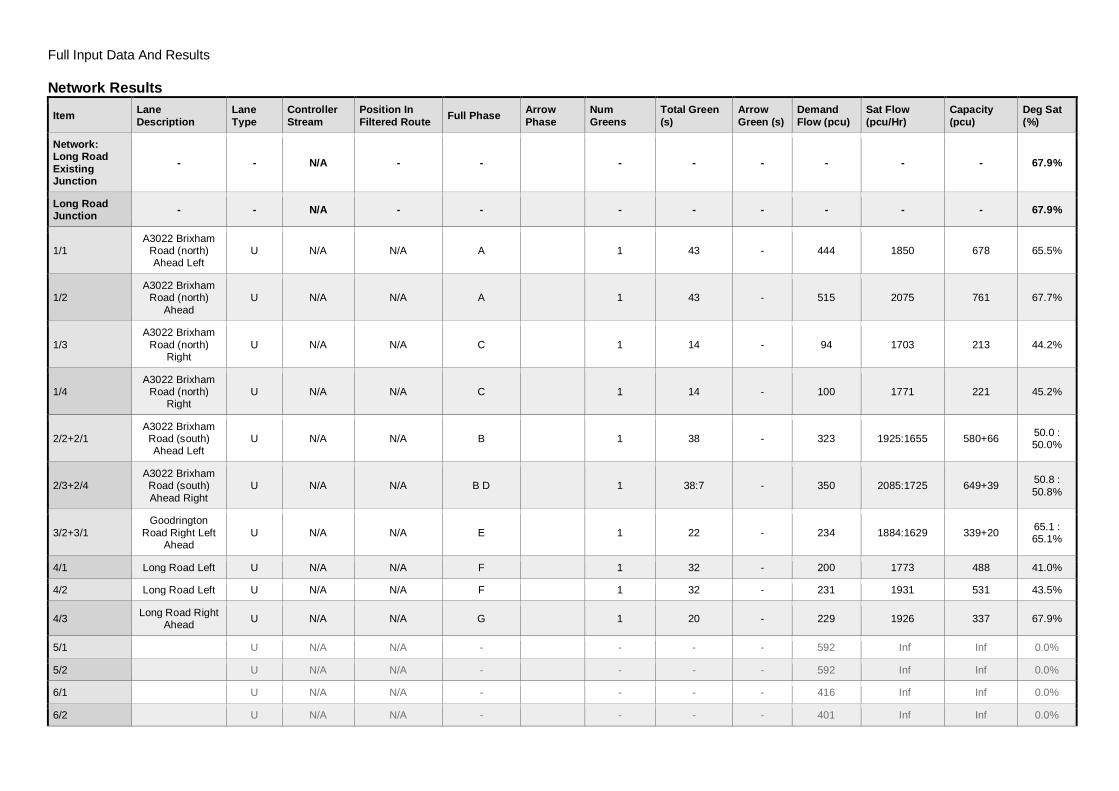
Full Input Data And Results
Network Results
Item LaneDescription
LaneType
ControllerStream
Position InFiltered Route Full Phase Arrow
PhaseNumGreens
Total Green(s)
ArrowGreen (s)
DemandFlow (pcu)
Sat Flow(pcu/Hr)
Capacity(pcu)
Deg Sat(%)
Network:Long RoadExistingJunction
- - N/A - - - - - - - - 67.9%
Long RoadJunction - - N/A - - - - - - - - 67.9%
1/1A3022 Brixham
Road (north)Ahead Left
U N/A N/A A 1 43 - 444 1850 678 65.5%
1/2A3022 Brixham
Road (north)Ahead
U N/A N/A A 1 43 - 515 2075 761 67.7%
1/3A3022 Brixham
Road (north)Right
U N/A N/A C 1 14 - 94 1703 213 44.2%
1/4A3022 Brixham
Road (north)Right
U N/A N/A C 1 14 - 100 1771 221 45.2%
2/2+2/1A3022 BrixhamRoad (south)Ahead Left
U N/A N/A B 1 38 - 323 1925:1655 580+66 50.0 :50.0%
2/3+2/4A3022 BrixhamRoad (south)Ahead Right
U N/A N/A B D 1 38:7 - 350 2085:1725 649+39 50.8 :50.8%
3/2+3/1Goodrington
Road Right LeftAhead
U N/A N/A E 1 22 - 234 1884:1629 339+20 65.1 :65.1%
4/1 Long Road Left U N/A N/A F 1 32 - 200 1773 488 41.0%
4/2 Long Road Left U N/A N/A F 1 32 - 231 1931 531 43.5%
4/3 Long Road RightAhead U N/A N/A G 1 20 - 229 1926 337 67.9%
5/1 U N/A N/A - - - - 592 Inf Inf 0.0%
5/2 U N/A N/A - - - - 592 Inf Inf 0.0%
6/1 U N/A N/A - - - - 416 Inf Inf 0.0%
6/2 U N/A N/A - - - - 401 Inf Inf 0.0%

Full Input Data And Results7/1 U N/A N/A - - - - 404 Inf Inf 0.0%
8/1 U N/A N/A - - - - 157 Inf Inf 0.0%
8/2 U N/A N/A - - - - 158 Inf Inf 0.0%
Item Arriving (pcu) Leaving(pcu)
Turners InGaps (pcu)
Turners WhenUnopposed(pcu)
Turners InIntergreen(pcu)
UniformDelay(pcuHr)
Rand +OversatDelay(pcuHr)
Storage AreaUniformDelay(pcuHr)
TotalDelay(pcuHr)
Av. DelayPer PCU(s/pcu)
Max. Back ofUniformQueue (pcu)
Rand +OversatQueue (pcu)
MeanMaxQueue(pcu)
Network:Long RoadExistingJunction
- - 0 0 0 27.4 6.5 0.0 33.8 - - - -
Long RoadJunction - - 0 0 0 27.4 6.5 0.0 33.8 - - - -
1/1 444 444 - - - 3.9 0.9 - 4.8 39.3 12.2 0.9 13.1
1/2 515 515 - - - 4.6 1.0 - 5.6 39.3 14.4 1.0 15.5
1/3 94 94 - - - 1.3 0.4 - 1.7 63.7 2.9 0.4 3.3
1/4 100 100 - - - 1.4 0.4 - 1.8 63.4 3.1 0.4 3.5
2/2+2/1 323 323 - - - 2.8 0.5 - 3.3 37.3 7.7 0.5 8.2
2/3+2/4 350 350 - - - 3.3 0.5 - 3.8 38.9 9.0 0.5 9.5
3/2+3/1 234 234 - - - 2.9 0.9 - 3.8 58.9 7.0 0.9 8.0
4/1 200 200 - - - 2.0 0.3 - 2.3 41.8 5.4 0.3 5.8
4/2 231 231 - - - 2.3 0.4 - 2.7 41.8 6.3 0.4 6.7
4/3 229 229 - - - 2.9 1.0 - 4.0 62.7 7.1 1.0 8.2
5/1 592 592 - - - 0.0 0.0 - 0.0 0.0 0.0 0.0 0.0
5/2 592 592 - - - 0.0 0.0 - 0.0 0.0 0.0 0.0 0.0
6/1 416 416 - - - 0.0 0.0 - 0.0 0.0 0.0 0.0 0.0
6/2 401 401 - - - 0.0 0.0 - 0.0 0.0 0.0 0.0 0.0
7/1 404 404 - - - 0.0 0.0 - 0.0 0.0 0.0 0.0 0.0
8/1 157 157 - - - 0.0 0.0 - 0.0 0.0 0.0 0.0 0.0
8/2 158 158 - - - 0.0 0.0 - 0.0 0.0 0.0 0.0 0.0
C1 PRC for Signalled Lanes (%): 32.5 Total Delay for Signalled Lanes (pcuHr): 33.84 Cycle Time (s): 120 PRC Over All Lanes (%): 32.5 Total Delay Over All Lanes(pcuHr): 33.84
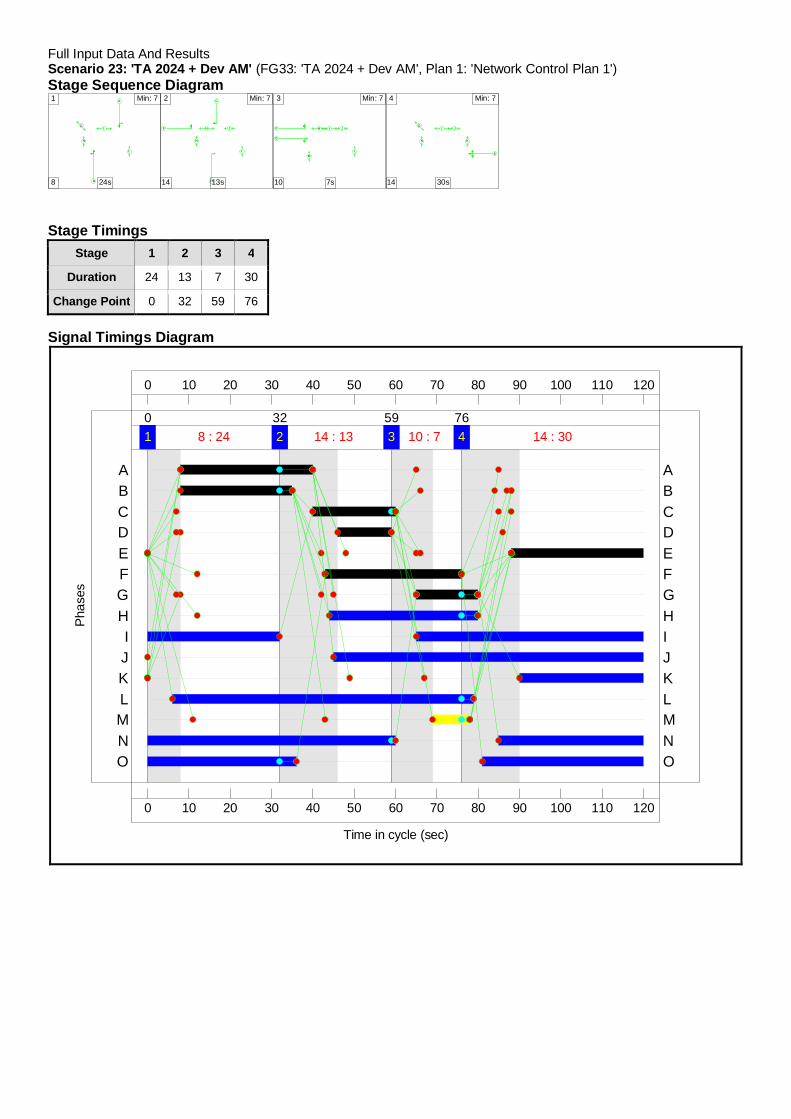
Full Input Data And ResultsScenario 23: 'TA 2024 + Dev AM' (FG33: 'TA 2024 + Dev AM', Plan 1: 'Network Control Plan 1')Stage Sequence Diagram
A
B
I
L
N
O
1 Min: 7
8 24s
C
D
F H J
L
N
2 Min: 7
14 13s
F
G
H I J
LM
3 Min: 7
10 7s
E
I J
KN
O
4 Min: 7
14 30s
Stage TimingsStage 1 2 3 4
Duration 24 13 7 30
Change Point 0 32 59 76
Signal Timings Diagram
0
0
10
10
20
20
30
30
40
40
50
50
60
60
70
70
80
80
90
90
100
100
110
110
120
120
Time in cycle (sec)
Phas
es
1 8 : 240
2 14 : 1332
3 10 : 759
4 14 : 3076
O ON NM ML LK KJ JI I
H HG GF FE ED DC CB BA A
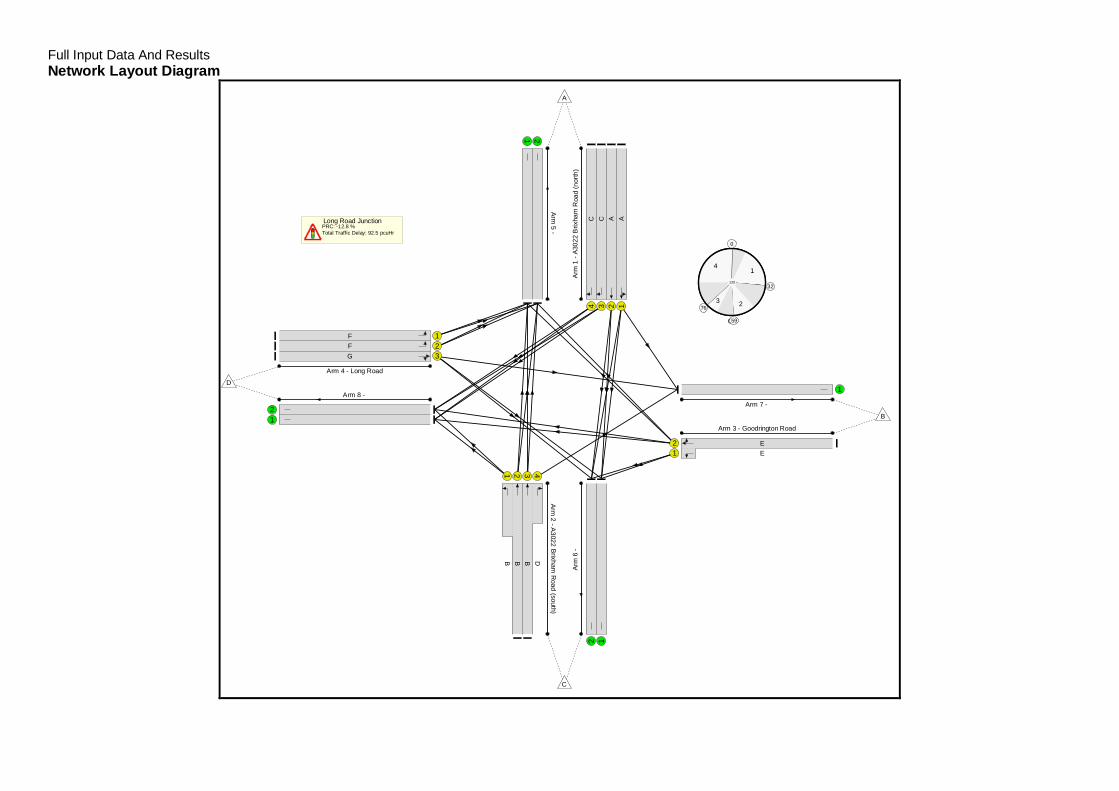
Full Input Data And ResultsNetwork Layout Diagram
Long Road JunctionPRC: -12.8 %Total Traffic Delay: 92.5 pcuHr
C1
0
1
32
2
59
376
4
120
Arm
1-A
3022
Brix
ham
Roa
d(n
orth
)
1234
AACC
Arm
2-A
3022B
rixhamR
oad(south)
1 2 3 4
B B B D
Arm 3 - Goodrington Road
12
EE
Arm 4 - Long Road
123
FFG
Arm
5-
1 2A
rm6
-
12
Arm 7 -
1Arm 8 -
12
A
B
C
D
Full Input Data And Results
Network Results
Item LaneDescription
LaneType
ControllerStream
Position InFiltered Route Full Phase Arrow
PhaseNumGreens
Total Green(s)
ArrowGreen (s)
DemandFlow (pcu)
Sat Flow(pcu/Hr)
Capacity(pcu)
Deg Sat(%)
Network:Long RoadExistingJunction
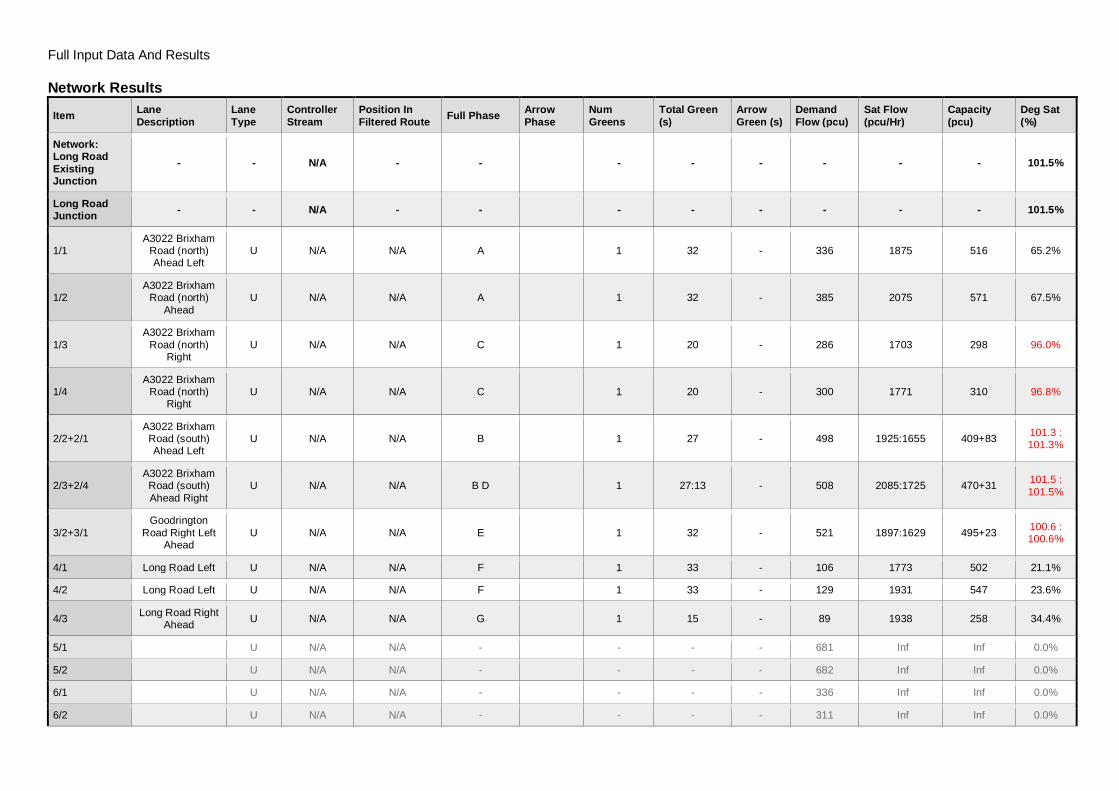
- - N/A - - - - - - - - 101.5%
Long RoadJunction - - N/A - - - - - - - - 101.5%
1/1A3022 Brixham
Road (north)Ahead Left
U N/A N/A A 1 32 - 336 1875 516 65.2%
1/2A3022 Brixham
Road (north)Ahead
U N/A N/A A 1 32 - 385 2075 571 67.5%
1/3A3022 Brixham
Road (north)Right
U N/A N/A C 1 20 - 286 1703 298 96.0%
1/4A3022 Brixham
Road (north)Right
U N/A N/A C 1 20 - 300 1771 310 96.8%
2/2+2/1A3022 BrixhamRoad (south)Ahead Left
U N/A N/A B 1 27 - 498 1925:1655 409+83 101.3 :101.3%
2/3+2/4A3022 BrixhamRoad (south)Ahead Right
U N/A N/A B D 1 27:13 - 508 2085:1725 470+31 101.5 :101.5%
3/2+3/1Goodrington
Road Right LeftAhead
U N/A N/A E 1 32 - 521 1897:1629 495+23 100.6 :100.6%
4/1 Long Road Left U N/A N/A F 1 33 - 106 1773 502 21.1%
4/2 Long Road Left U N/A N/A F 1 33 - 129 1931 547 23.6%
4/3 Long Road RightAhead U N/A N/A G 1 15 - 89 1938 258 34.4%
5/1 U N/A N/A - - - - 681 Inf Inf 0.0%
5/2 U N/A N/A - - - - 682 Inf Inf 0.0%
6/1 U N/A N/A - - - - 336 Inf Inf 0.0%
6/2 U N/A N/A - - - - 311 Inf Inf 0.0%

Full Input Data And Results7/1 U N/A N/A - - - - 217 Inf Inf 0.0%
8/1 U N/A N/A - - - - 465 Inf Inf 0.0%
8/2 U N/A N/A - - - - 466 Inf Inf 0.0%
Item Arriving (pcu) Leaving(pcu)
Turners InGaps (pcu)
Turners WhenUnopposed(pcu)
Turners InIntergreen(pcu)
UniformDelay(pcuHr)
Rand +OversatDelay(pcuHr)
Storage AreaUniformDelay(pcuHr)
TotalDelay(pcuHr)
Av. DelayPer PCU(s/pcu)
Max. Back ofUniformQueue (pcu)
Rand +OversatQueue (pcu)
Mean MaxQueue(pcu)
Network:Long RoadExistingJunction
- - 0 0 0 39.1 53.4 0.0 92.5 - - - -
Long RoadJunction - - 0 0 0 39.1 53.4 0.0 92.5 - - - -
1/1 336 336 - - - 3.6 0.9 - 4.5 48.3 9.8 0.9 10.7
1/2 385 385 - - - 4.1 1.0 - 5.2 48.3 11.3 1.0 12.4
1/3 286 286 - - - 3.9 6.0 - 9.9 124.2 9.4 6.0 15.3
1/4 300 300 - - - 4.1 6.5 - 10.6 127.5 9.9 6.5 16.4
2/2+2/1 498 492 - - - 6.7 12.9 - 19.5 141.2 15.3 12.9 28.2
2/3+2/4 508 501 - - - 6.9 13.3 - 20.2 143.1 16.9 13.3 30.2
3/2+3/1 521 518 - - - 6.5 12.2 - 18.7 129.4 17.4 12.2 29.6
4/1 106 106 - - - 1.0 0.1 - 1.1 37.3 2.7 0.1 2.8
4/2 129 129 - - - 1.2 0.2 - 1.3 37.3 3.3 0.2 3.5
4/3 89 89 - - - 1.2 0.3 - 1.4 57.8 2.7 0.3 3.0
5/1 674 674 - - - 0.0 0.0 - 0.0 0.0 0.0 0.0 0.0
5/2 675 675 - - - 0.0 0.0 - 0.0 0.0 0.0 0.0 0.0
6/1 336 336 - - - 0.0 0.0 - 0.0 0.0 0.0 0.0 0.0
6/2 311 311 - - - 0.0 0.0 - 0.0 0.0 0.0 0.0 0.0
7/1 217 217 - - - 0.0 0.0 - 0.0 0.0 0.0 0.0 0.0
8/1 464 464 - - - 0.0 0.0 - 0.0 0.0 0.0 0.0 0.0
8/2 465 465 - - - 0.0 0.0 - 0.0 0.0 0.0 0.0 0.0
C1 PRC for Signalled Lanes (%): -12.8 Total Delay for Signalled Lanes (pcuHr): 92.49 Cycle Time (s): 120 PRC Over All Lanes (%): -12.8 Total Delay Over All Lanes(pcuHr): 92.49

Full Input Data And ResultsScenario 24: 'TA 2024 + Dev PM' (FG34: 'TA 2024 + Dev PM', Plan 1: 'Network Control Plan 1')Stage Sequence Diagram
A
B
I
L
N
O
1 Min: 7
8 33s
C
D
F H J
L
N
2 Min: 7
14 7s
F
G
H I J
LM
3 Min: 7
10 14s
E
I J
KN
O
4 Min: 7
14 20s
Stage TimingsStage 1 2 3 4
Duration 33 7 14 20
Change Point 0 41 62 86
Signal Timings Diagram
0
0
10
10
20
20
30
30
40
40
50
50
60
60
70
70
80
80
90
90
100
100
110
110
120
120
Time in cycle (sec)
Phas
es
1 8 : 330
2 14 : 741
3 10 : 1462
4 14 : 2086
O ON NM ML LK KJ JI I
H HG GF FE ED DC CB BA A
Full Input Data And ResultsNetwork Layout Diagram
Long Road JunctionPRC: 5.3 %Total Traffic Delay: 56.8 pcuHr
C1
0
1
412
62
386
4
120
Arm
1-A
3022
Brix
ham
Roa
d(n
orth
)
1234
AACC
Arm
2-A
3022B
rixhamR
oad(south)
1 2 3 4
B B B D
Arm 3 - Goodrington Road
12
EE
Arm 4 - Long Road
123
FFG
Arm
5-
1 2Ar
m6
-
12
Arm 7 -
1Arm 8 -
12
A
B
C
D

Full Input Data And Results
Network Results
Item LaneDescription
LaneType
ControllerStream
Position InFiltered Route Full Phase Arrow
PhaseNumGreens
Total Green(s)
ArrowGreen (s)
DemandFlow (pcu)
Sat Flow(pcu/Hr)
Capacity(pcu)
Deg Sat(%)
Network:Long RoadExistingJunction
- - N/A - - - - - - - - 85.5%
Long RoadJunction - - N/A - - - - - - - - 85.5%
1/1A3022 Brixham
Road (north)Ahead Left
U N/A N/A A 1 41 - 547 1861 651 84.0%
1/2A3022 Brixham
Road (north)Ahead
U N/A N/A A 1 41 - 621 2075 726 85.5%
1/3A3022 Brixham
Road (north)Right
U N/A N/A C 1 14 - 146 1703 213 68.6%
1/4A3022 Brixham
Road (north)Right
U N/A N/A C 1 14 - 153 1771 221 69.1%
2/2+2/1A3022 BrixhamRoad (south)Ahead Left
U N/A N/A B 1 36 - 427 1925:1655 558+53 69.9 :69.9%
2/3+2/4A3022 BrixhamRoad (south)Ahead Right
U N/A N/A B D 1 36:7 - 473 2085:1725 592+68 71.7 :71.7%
3/2+3/1Goodrington
Road Right LeftAhead
U N/A N/A E 1 22 - 306 1888:1629 315+47 84.6 :84.6%
4/1 Long Road Left U N/A N/A F 1 34 - 334 1773 517 64.6%
4/2 Long Road Left U N/A N/A F 1 34 - 373 1931 563 66.2%
4/3 Long Road RightAhead U N/A N/A G 1 22 - 307 1933 370 82.9%
5/1 U N/A N/A - - - - 836 Inf Inf 0.0%
5/2 U N/A N/A - - - - 834 Inf Inf 0.0%
6/1 U N/A N/A - - - - 541 Inf Inf 0.0%
6/2 U N/A N/A - - - - 502 Inf Inf 0.0%

Full Input Data And Results7/1 U N/A N/A - - - - 521 Inf Inf 0.0%
8/1 U N/A N/A - - - - 225 Inf Inf 0.0%
8/2 U N/A N/A - - - - 228 Inf Inf 0.0%
Item Arriving (pcu) Leaving(pcu)
Turners InGaps (pcu)
Turners WhenUnopposed(pcu)
Turners InIntergreen(pcu)
UniformDelay(pcuHr)
Rand +OversatDelay(pcuHr)
Storage AreaUniformDelay(pcuHr)
TotalDelay(pcuHr)
Av. DelayPer PCU(s/pcu)
Max. Back ofUniformQueue (pcu)
Rand +OversatQueue (pcu)
MeanMaxQueue(pcu)
Network:Long RoadExistingJunction
- - 0 0 0 40.3 16.5 0.0 56.8 - - - -
Long RoadJunction - - 0 0 0 40.3 16.5 0.0 56.8 - - - -
1/1 547 547 - - - 5.5 2.5 - 8.0 52.4 16.7 2.5 19.2
1/2 621 621 - - - 6.2 2.8 - 9.0 52.4 19.1 2.8 21.9
1/3 146 146 - - - 2.0 1.1 - 3.1 76.3 4.6 1.1 5.7
1/4 153 153 - - - 2.1 1.1 - 3.2 75.8 4.8 1.1 5.9
2/2+2/1 427 427 - - - 4.2 1.1 - 5.4 45.4 11.7 1.1 12.8
2/3+2/4 473 473 - - - 5.0 1.2 - 6.2 47.6 13.1 1.2 14.4
3/2+3/1 306 306 - - - 4.0 2.5 - 6.5 76.1 9.5 2.5 12.0
4/1 334 334 - - - 3.4 0.9 - 4.3 46.8 9.6 0.9 10.6
4/2 373 373 - - - 3.9 1.0 - 4.8 46.7 10.9 1.0 11.8
4/3 307 307 - - - 4.0 2.3 - 6.2 73.1 9.8 2.3 12.1
5/1 836 836 - - - 0.0 0.0 - 0.0 0.0 0.0 0.0 0.0
5/2 834 834 - - - 0.0 0.0 - 0.0 0.0 0.0 0.0 0.0
6/1 541 541 - - - 0.0 0.0 - 0.0 0.0 0.0 0.0 0.0
6/2 502 502 - - - 0.0 0.0 - 0.0 0.0 0.0 0.0 0.0
7/1 521 521 - - - 0.0 0.0 - 0.0 0.0 0.0 0.0 0.0
8/1 225 225 - - - 0.0 0.0 - 0.0 0.0 0.0 0.0 0.0
8/2 228 228 - - - 0.0 0.0 - 0.0 0.0 0.0 0.0 0.0
C1 PRC for Signalled Lanes (%): 5.3 Total Delay for Signalled Lanes (pcuHr): 56.83 Cycle Time (s): 120 PRC Over All Lanes (%): 5.3 Total Delay Over All Lanes(pcuHr): 56.83

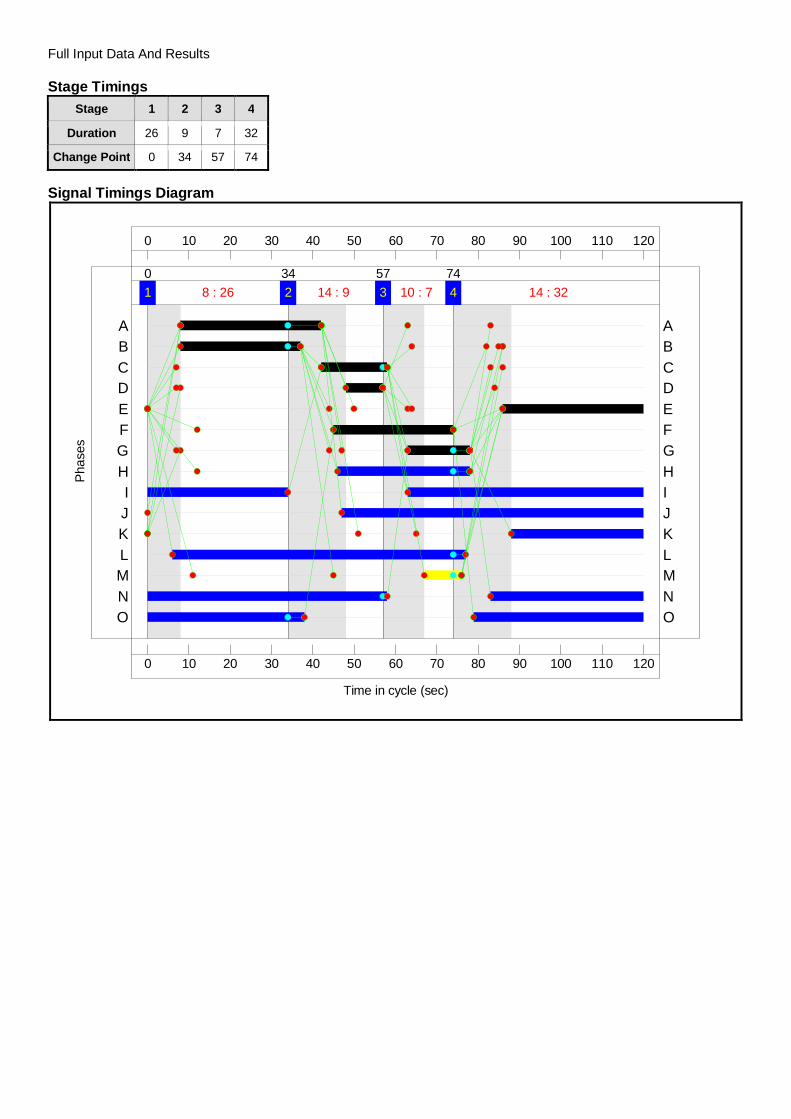
Full Input Data And ResultsScenario 25: 'TA 2024 AM' (FG31: 'TA 2024 AM', Plan 1: 'Network Control Plan 1')Stage Sequence Diagram
A
B
I
L
N
O
1 Min: 7
8 23s
C
D
F H J
L
N
2 Min: 7
14 13s
F
G
H I J
LM
3 Min: 7
10 7s
E
I J
KN
O
4 Min: 7
14 31s
Stage TimingsStage 1 2 3 4
Duration 23 13 7 31
Change Point 0 31 58 75
Signal Timings Diagram
0
0
10
10
20
20
30
30
40
40
50
50
60
60
70
70
80
80
90
90
100
100
110
110
120
120
Time in cycle (sec)
Phas
es
1 8 : 230
2 14 : 1331
3 10 : 758
4 14 : 3175
O ON NM ML LK KJ JI I
H HG GF FE ED DC CB BA A

Full Input Data And ResultsNetwork Layout Diagram
Long Road JunctionPRC: -8.1 %Total Traffic Delay: 71.4 pcuHr
C1
0
1
31
2
58
375
4
120
Arm
1-A
3022
Brix
ham
Roa
d(n
orth
)
1234
AACC
Arm2
-A3022
BrixhamR
oad(south)
1 2 3 4
B B B D
Arm 3 - Goodrington Road
12
EE
Arm 4 - Long Road
123
FFG
Arm
5-
1 2Ar
m6
-
12
Arm 7 -
1Arm 8 -
12
A
B
C
D
Full Input Data And Results
Network Results
Item LaneDescription
LaneType
ControllerStream
Position InFiltered Route Full Phase Arrow
PhaseNumGreens
Total Green(s)
ArrowGreen (s)
DemandFlow (pcu)
Sat Flow(pcu/Hr)
Capacity(pcu)
Deg Sat(%)
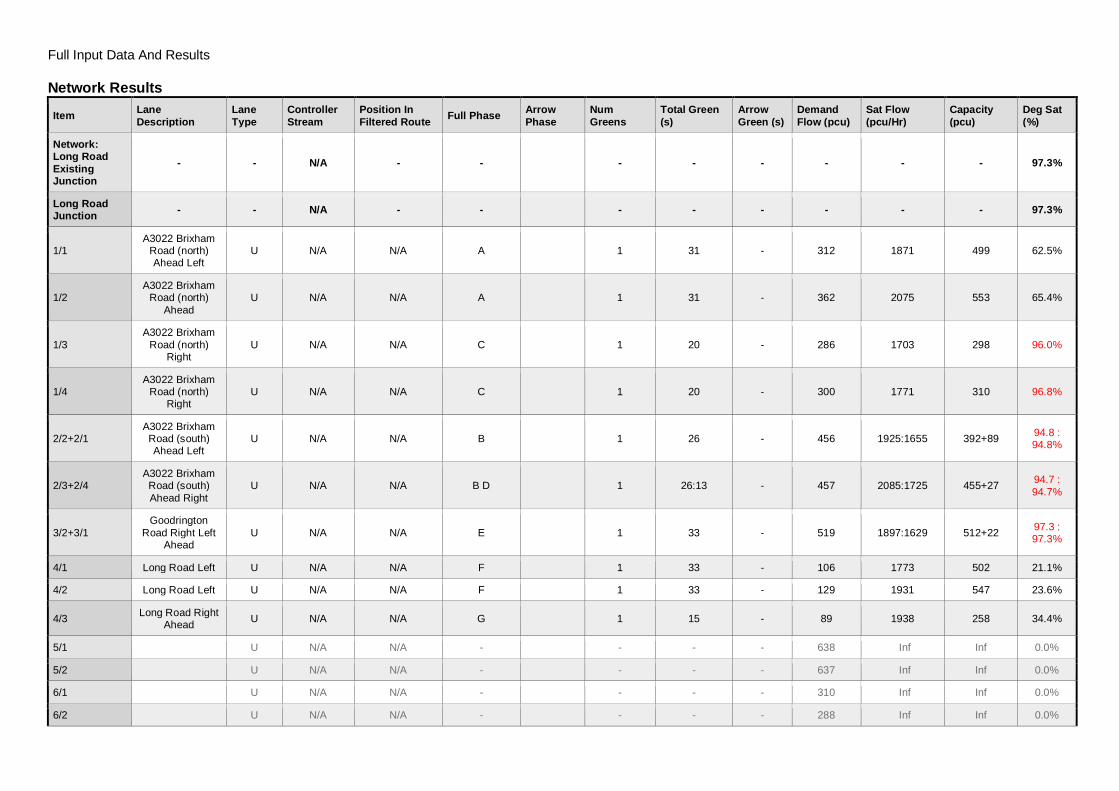
Network:Long RoadExistingJunction
- - N/A - - - - - - - - 97.3%
Long RoadJunction - - N/A - - - - - - - - 97.3%
1/1A3022 Brixham
Road (north)Ahead Left
U N/A N/A A 1 31 - 312 1871 499 62.5%
1/2A3022 Brixham
Road (north)Ahead
U N/A N/A A 1 31 - 362 2075 553 65.4%
1/3A3022 Brixham
Road (north)Right
U N/A N/A C 1 20 - 286 1703 298 96.0%
1/4A3022 Brixham
Road (north)Right
U N/A N/A C 1 20 - 300 1771 310 96.8%
2/2+2/1A3022 BrixhamRoad (south)Ahead Left
U N/A N/A B 1 26 - 456 1925:1655 392+89 94.8 :94.8%
2/3+2/4A3022 BrixhamRoad (south)Ahead Right
U N/A N/A B D 1 26:13 - 457 2085:1725 455+27 94.7 :94.7%
3/2+3/1Goodrington
Road Right LeftAhead
U N/A N/A E 1 33 - 519 1897:1629 512+22 97.3 :97.3%
4/1 Long Road Left U N/A N/A F 1 33 - 106 1773 502 21.1%
4/2 Long Road Left U N/A N/A F 1 33 - 129 1931 547 23.6%
4/3 Long Road RightAhead U N/A N/A G 1 15 - 89 1938 258 34.4%
5/1 U N/A N/A - - - - 638 Inf Inf 0.0%
5/2 U N/A N/A - - - - 637 Inf Inf 0.0%
6/1 U N/A N/A - - - - 310 Inf Inf 0.0%
6/2 U N/A N/A - - - - 288 Inf Inf 0.0%

Full Input Data And Results7/1 U N/A N/A - - - - 212 Inf Inf 0.0%
8/1 U N/A N/A - - - - 465 Inf Inf 0.0%
8/2 U N/A N/A - - - - 466 Inf Inf 0.0%
Item Arriving (pcu) Leaving(pcu)
Turners InGaps (pcu)
Turners WhenUnopposed(pcu)
Turners InIntergreen(pcu)
UniformDelay(pcuHr)
Rand +OversatDelay(pcuHr)
Storage AreaUniformDelay(pcuHr)
TotalDelay(pcuHr)
Av. DelayPer PCU(s/pcu)
Max. Back ofUniformQueue (pcu)
Rand +OversatQueue (pcu)
MeanMaxQueue(pcu)
Network:Long RoadExistingJunction
- - 0 0 0 36.2 35.3 0.0 71.4 - - - -
Long RoadJunction - - 0 0 0 36.2 35.3 0.0 71.4 - - - -
1/1 312 312 - - - 3.4 0.8 - 4.2 48.3 9.1 0.8 9.9
1/2 362 362 - - - 3.9 0.9 - 4.9 48.4 10.7 0.9 11.6
1/3 286 286 - - - 3.9 6.0 - 9.9 124.2 9.4 6.0 15.3
1/4 300 300 - - - 4.1 6.5 - 10.6 127.5 9.9 6.5 16.4
2/2+2/1 456 456 - - - 5.6 6.1 - 11.7 92.7 13.0 6.1 19.1
2/3+2/4 457 457 - - - 5.8 6.0 - 11.8 93.2 14.6 6.0 20.7
3/2+3/1 519 519 - - - 6.1 8.3 - 14.4 100.1 16.9 8.3 25.2
4/1 106 106 - - - 1.0 0.1 - 1.1 37.3 2.7 0.1 2.8
4/2 129 129 - - - 1.2 0.2 - 1.3 37.3 3.3 0.2 3.5
4/3 89 89 - - - 1.2 0.3 - 1.4 57.8 2.7 0.3 3.0
5/1 638 638 - - - 0.0 0.0 - 0.0 0.0 0.0 0.0 0.0
5/2 637 637 - - - 0.0 0.0 - 0.0 0.0 0.0 0.0 0.0
6/1 310 310 - - - 0.0 0.0 - 0.0 0.0 0.0 0.0 0.0
6/2 288 288 - - - 0.0 0.0 - 0.0 0.0 0.0 0.0 0.0
7/1 212 212 - - - 0.0 0.0 - 0.0 0.0 0.0 0.0 0.0
8/1 465 465 - - - 0.0 0.0 - 0.0 0.0 0.0 0.0 0.0
8/2 466 466 - - - 0.0 0.0 - 0.0 0.0 0.0 0.0 0.0
C1 PRC for Signalled Lanes (%): -8.1 Total Delay for Signalled Lanes (pcuHr): 71.42 Cycle Time (s): 120 PRC Over All Lanes (%): -8.1 Total Delay Over All Lanes(pcuHr): 71.42
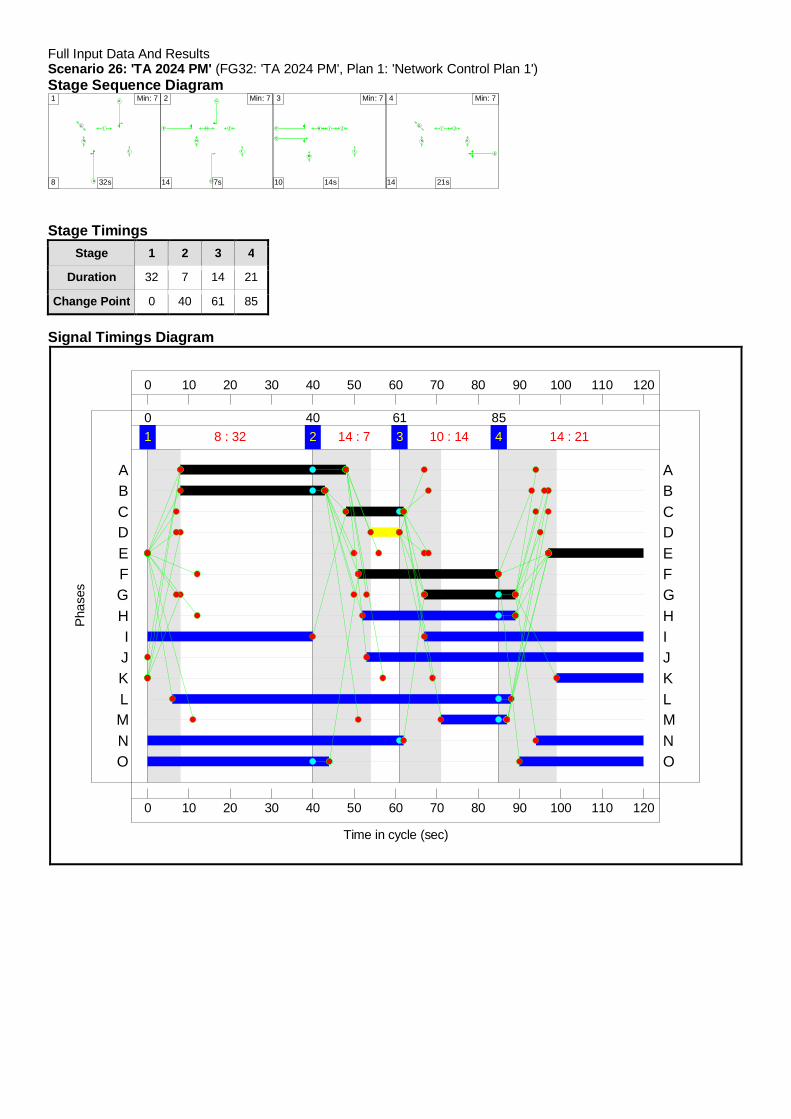
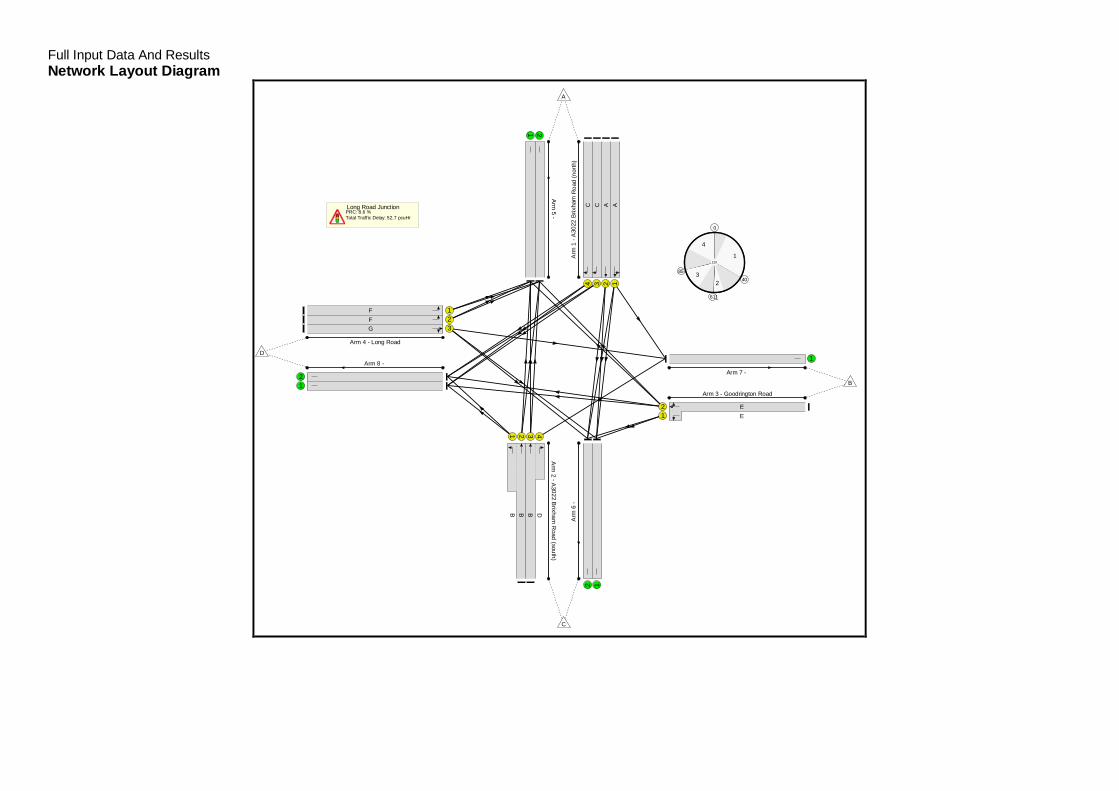
Full Input Data And ResultsScenario 26: 'TA 2024 PM' (FG32: 'TA 2024 PM', Plan 1: 'Network Control Plan 1')Stage Sequence Diagram
A
B
I
L
N
O
1 Min: 7
8 32s
C
D
F H J
L
N
2 Min: 7
14 7s
F
G
H I J
LM
3 Min: 7
10 14s
E
I J
KN
O
4 Min: 7
14 21s
Stage TimingsStage 1 2 3 4
Duration 32 7 14 21
Change Point 0 40 61 85
Signal Timings Diagram
0
0
10
10
20
20
30
30
40
40
50
50
60
60
70
70
80
80
90
90
100
100
110
110
120
120
Time in cycle (sec)
Phas
es
1 8 : 320
2 14 : 740
3 10 : 1461
4 14 : 2185
O ON NM ML LK KJ JI I
H HG GF FE ED DC CB BA A
Full Input Data And ResultsNetwork Layout Diagram
Long Road JunctionPRC: 8.6 %Total Traffic Delay: 52.7 pcuHr
C1
0
1
402
61
385
4
120
Arm
1-A
3022
Brix
ham
Roa
d(n
orth
)
1234
AACC
Arm
2-A
3 022B
rixhamR
oad(south)
1 2 3 4
B B B D
Arm 3 - Goodrington Road
12
EE
Arm 4 - Long Road
123
FFG
Arm
5-
1 2A
rm6
-
12
Arm 7 -
1Arm 8 -
12
A
B
C
D
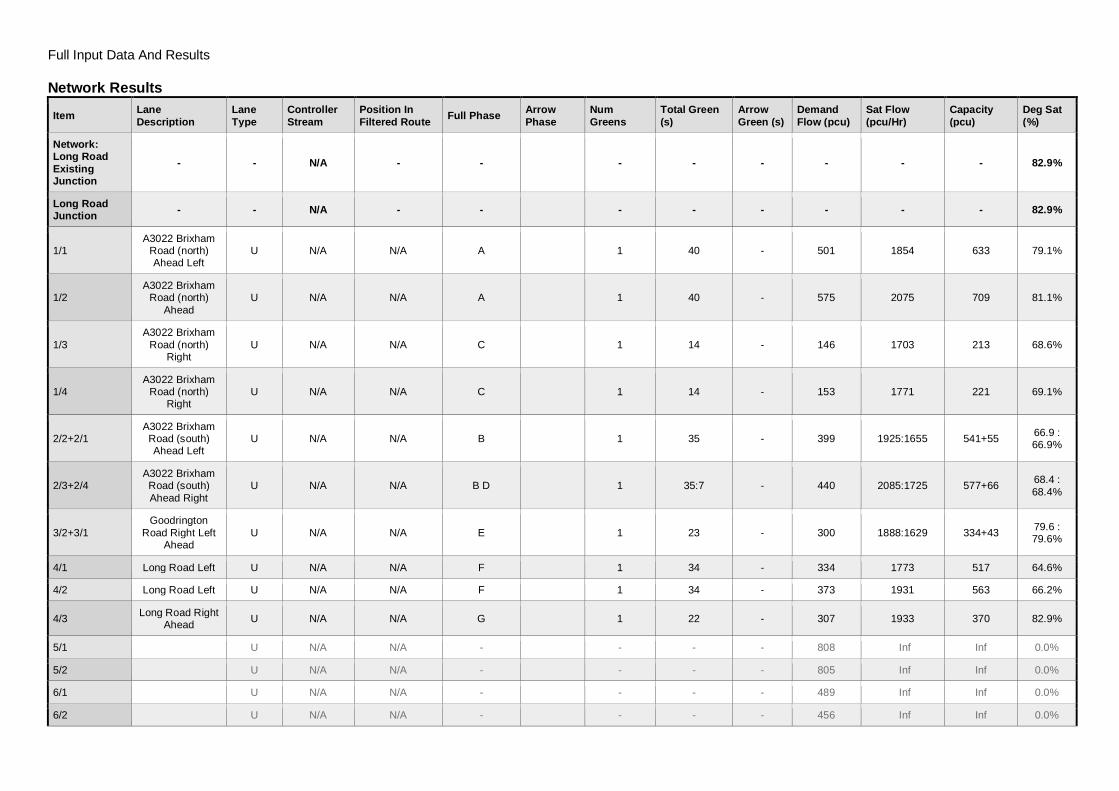
Full Input Data And Results
Network Results
Item LaneDescription
LaneType
ControllerStream
Position InFiltered Route Full Phase Arrow
PhaseNumGreens
Total Green(s)
ArrowGreen (s)
DemandFlow (pcu)
Sat Flow(pcu/Hr)
Capacity(pcu)
Deg Sat(%)
Network:Long RoadExistingJunction
- - N/A - - - - - - - - 82.9%
Long RoadJunction - - N/A - - - - - - - - 82.9%
1/1A3022 Brixham
Road (north)Ahead Left
U N/A N/A A 1 40 - 501 1854 633 79.1%
1/2A3022 Brixham
Road (north)Ahead
U N/A N/A A 1 40 - 575 2075 709 81.1%
1/3A3022 Brixham
Road (north)Right
U N/A N/A C 1 14 - 146 1703 213 68.6%
1/4A3022 Brixham
Road (north)Right
U N/A N/A C 1 14 - 153 1771 221 69.1%
2/2+2/1A3022 BrixhamRoad (south)Ahead Left
U N/A N/A B 1 35 - 399 1925:1655 541+55 66.9 :66.9%
2/3+2/4A3022 BrixhamRoad (south)Ahead Right
U N/A N/A B D 1 35:7 - 440 2085:1725 577+66 68.4 :68.4%
3/2+3/1Goodrington
Road Right LeftAhead
U N/A N/A E 1 23 - 300 1888:1629 334+43 79.6 :79.6%
4/1 Long Road Left U N/A N/A F 1 34 - 334 1773 517 64.6%
4/2 Long Road Left U N/A N/A F 1 34 - 373 1931 563 66.2%
4/3 Long Road RightAhead U N/A N/A G 1 22 - 307 1933 370 82.9%
5/1 U N/A N/A - - - - 808 Inf Inf 0.0%
5/2 U N/A N/A - - - - 805 Inf Inf 0.0%
6/1 U N/A N/A - - - - 489 Inf Inf 0.0%
6/2 U N/A N/A - - - - 456 Inf Inf 0.0%

Full Input Data And Results7/1 U N/A N/A - - - - 517 Inf Inf 0.0%
8/1 U N/A N/A - - - - 225 Inf Inf 0.0%
8/2 U N/A N/A - - - - 228 Inf Inf 0.0%
Item Arriving (pcu) Leaving(pcu)
Turners InGaps (pcu)
Turners WhenUnopposed(pcu)
Turners InIntergreen(pcu)
UniformDelay(pcuHr)
Rand +OversatDelay(pcuHr)
Storage AreaUniformDelay(pcuHr)
TotalDelay(pcuHr)
Av. DelayPer PCU(s/pcu)
Max. Back ofUniformQueue (pcu)
Rand +OversatQueue (pcu)
MeanMaxQueue(pcu)
Network:Long RoadExistingJunction
- - 0 0 0 38.6 14.1 0.0 52.7 - - - -
Long RoadJunction - - 0 0 0 38.6 14.1 0.0 52.7 - - - -
1/1 501 501 - - - 5.0 1.8 - 6.8 48.9 15.0 1.8 16.9
1/2 575 575 - - - 5.7 2.1 - 7.8 49.0 17.4 2.1 19.5
1/3 146 146 - - - 2.0 1.1 - 3.1 76.3 4.6 1.1 5.7
1/4 153 153 - - - 2.1 1.1 - 3.2 75.8 4.8 1.1 5.9
2/2+2/1 399 399 - - - 4.0 1.0 - 5.0 44.9 10.7 1.0 11.7
2/3+2/4 440 440 - - - 4.7 1.1 - 5.7 47.0 12.0 1.1 13.1
3/2+3/1 300 300 - - - 3.8 1.9 - 5.7 67.8 9.2 1.9 11.1
4/1 334 334 - - - 3.4 0.9 - 4.3 46.8 9.6 0.9 10.6
4/2 373 373 - - - 3.9 1.0 - 4.8 46.7 10.9 1.0 11.8
4/3 307 307 - - - 4.0 2.3 - 6.2 73.1 9.8 2.3 12.1
5/1 808 808 - - - 0.0 0.0 - 0.0 0.0 0.0 0.0 0.0
5/2 805 805 - - - 0.0 0.0 - 0.0 0.0 0.0 0.0 0.0
6/1 489 489 - - - 0.0 0.0 - 0.0 0.0 0.0 0.0 0.0
6/2 456 456 - - - 0.0 0.0 - 0.0 0.0 0.0 0.0 0.0
7/1 517 517 - - - 0.0 0.0 - 0.0 0.0 0.0 0.0 0.0
8/1 225 225 - - - 0.0 0.0 - 0.0 0.0 0.0 0.0 0.0
8/2 228 228 - - - 0.0 0.0 - 0.0 0.0 0.0 0.0 0.0
C1 PRC for Signalled Lanes (%): 8.6 Total Delay for Signalled Lanes (pcuHr): 52.73 Cycle Time (s): 120 PRC Over All Lanes (%): 8.6 Total Delay Over All Lanes(pcuHr): 52.73
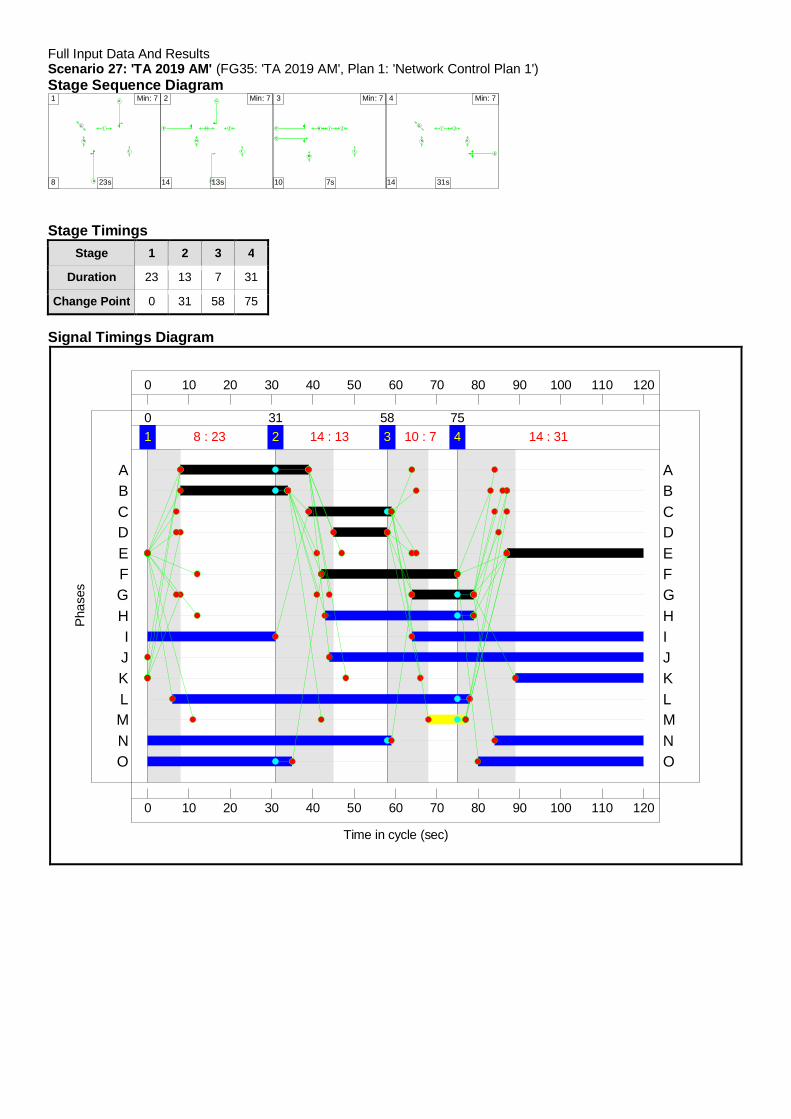
Full Input Data And ResultsScenario 27: 'TA 2019 AM' (FG35: 'TA 2019 AM', Plan 1: 'Network Control Plan 1')Stage Sequence Diagram
A
B
I
L
N
O
1 Min: 7
8 23s
C
D
F H J
L
N
2 Min: 7
14 13s
F
G
H I J
LM
3 Min: 7
10 7s
E
I J
KN
O
4 Min: 7
14 31s
Stage TimingsStage 1 2 3 4
Duration 23 13 7 31
Change Point 0 31 58 75
Signal Timings Diagram
0
0
10
10
20
20
30
30
40
40
50
50
60
60
70
70
80
80
90
90
100
100
110
110
120
120
Time in cycle (sec)
Phas
es
1 8 : 230
2 14 : 1331
3 10 : 758
4 14 : 3175
O ON NM ML LK KJ JI I
H HG GF FE ED DC CB BA A
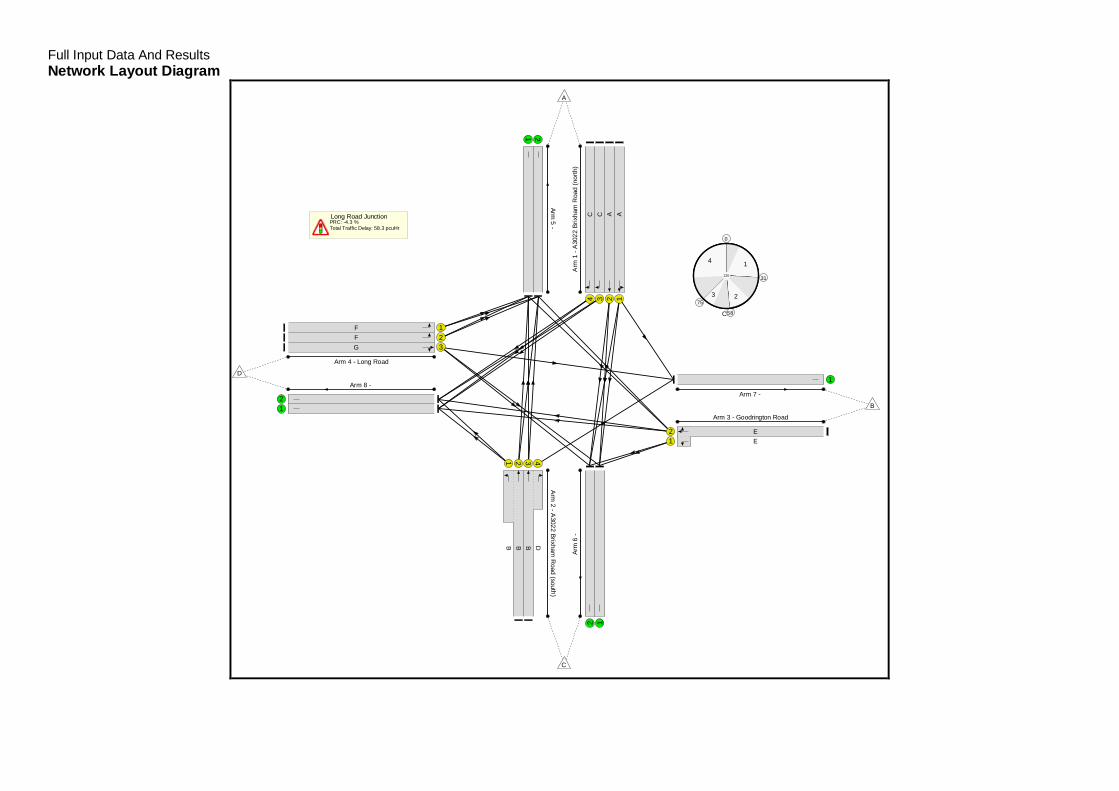
Full Input Data And ResultsNetwork Layout Diagram
Long Road JunctionPRC: -4.3 %Total Traffic Delay: 58.3 pcuHr
C1
0
1
31
2
58
375
4
120
Arm
1-A
3022
Brix
ham
Roa
d(n
orth
)
1234
AACC
Arm
2-A
3022Brixham
Road
(sou th)
1 2 3 4
B B B D
Arm 3 - Goodrington Road
12
EE
Arm 4 - Long Road
123
FFG
Arm5
-
1 2Ar
m6
-
12
Arm 7 -
1Arm 8 -
12
A
B
C
D

Full Input Data And Results
Network Results
Item LaneDescription
LaneType
ControllerStream
Position InFiltered Route Full Phase Arrow
PhaseNumGreens
Total Green(s)
ArrowGreen (s)
DemandFlow (pcu)
Sat Flow(pcu/Hr)
Capacity(pcu)
Deg Sat(%)
Network:Long RoadExistingJunction
- - N/A - - - - - - - - 93.9%
Long RoadJunction - - N/A - - - - - - - - 93.9%
1/1A3022 Brixham
Road (north)Ahead Left
U N/A N/A A 1 31 - 292 1875 500 58.4%
1/2A3022 Brixham
Road (north)Ahead
U N/A N/A A 1 31 - 339 2075 553 61.3%
1/3A3022 Brixham
Road (north)Right
U N/A N/A C 1 20 - 268 1703 298 89.9%
1/4A3022 Brixham
Road (north)Right
U N/A N/A C 1 20 - 279 1771 310 90.0%
2/2+2/1A3022 BrixhamRoad (south)Ahead Left
U N/A N/A B 1 26 - 444 1925:1655 392+89 92.3 :92.3%
2/3+2/4A3022 BrixhamRoad (south)Ahead Right
U N/A N/A B D 1 26:13 - 444 2085:1725 455+28 91.9 :91.9%
3/2+3/1Goodrington
Road Right LeftAhead
U N/A N/A E 1 33 - 501 1897:1629 511+22 93.9 :93.9%
4/1 Long Road Left U N/A N/A F 1 33 - 98 1773 502 19.5%
4/2 Long Road Left U N/A N/A F 1 33 - 118 1931 547 21.6%
4/3 Long Road RightAhead U N/A N/A G 1 15 - 84 1938 258 32.5%
5/1 U N/A N/A - - - - 613 Inf Inf 0.0%
5/2 U N/A N/A - - - - 612 Inf Inf 0.0%
6/1 U N/A N/A - - - - 294 Inf Inf 0.0%
6/2 U N/A N/A - - - - 274 Inf Inf 0.0%
Full Input Data And Results7/1 U N/A N/A - - - - 194 Inf Inf 0.0%
8/1 U N/A N/A - - - - 439 Inf Inf 0.0%
8/2 U N/A N/A - - - - 441 Inf Inf 0.0%
Item Arriving (pcu) Leaving(pcu)
Turners InGaps (pcu)
Turners WhenUnopposed(pcu)
Turners InIntergreen(pcu)
UniformDelay(pcuHr)
Rand +OversatDelay(pcuHr)
Storage AreaUniformDelay(pcuHr)
TotalDelay(pcuHr)
Av. DelayPer PCU(s/pcu)
Max. Back ofUniformQueue (pcu)
Rand +OversatQueue (pcu)
MeanMaxQueue(pcu)
Network:Long RoadExistingJunction
- - 0 0 0 34.0 24.3 0.0 58.3 - - - -
Long RoadJunction - - 0 0 0 34.0 24.3 0.0 58.3 - - - -
1/1 292 292 - - - 3.1 0.7 - 3.8 46.8 8.4 0.7 9.1
1/2 339 339 - - - 3.6 0.8 - 4.4 46.9 9.9 0.8 10.7
1/3 268 268 - - - 3.6 3.6 - 7.2 96.8 8.7 3.6 12.3
1/4 279 279 - - - 3.8 3.6 - 7.4 95.6 9.1 3.6 12.7
2/2+2/1 444 444 - - - 5.4 4.8 - 10.2 82.6 12.5 4.8 17.2
2/3+2/4 444 444 - - - 5.6 4.6 - 10.2 82.7 14.1 4.6 18.7
3/2+3/1 501 501 - - - 5.8 5.7 - 11.5 82.9 16.2 5.7 21.9
4/1 98 98 - - - 0.9 0.1 - 1.0 37.1 2.5 0.1 2.6
4/2 118 118 - - - 1.1 0.1 - 1.2 37.0 3.0 0.1 3.1
4/3 84 84 - - - 1.1 0.2 - 1.3 57.4 2.5 0.2 2.8
5/1 613 613 - - - 0.0 0.0 - 0.0 0.0 0.0 0.0 0.0
5/2 612 612 - - - 0.0 0.0 - 0.0 0.0 0.0 0.0 0.0
6/1 294 294 - - - 0.0 0.0 - 0.0 0.0 0.0 0.0 0.0
6/2 274 274 - - - 0.0 0.0 - 0.0 0.0 0.0 0.0 0.0
7/1 194 194 - - - 0.0 0.0 - 0.0 0.0 0.0 0.0 0.0
8/1 439 439 - - - 0.0 0.0 - 0.0 0.0 0.0 0.0 0.0
8/2 441 441 - - - 0.0 0.0 - 0.0 0.0 0.0 0.0 0.0
C1 PRC for Signalled Lanes (%): -4.3 Total Delay for Signalled Lanes (pcuHr): 58.30 Cycle Time (s): 120 PRC Over All Lanes (%): -4.3 Total Delay Over All Lanes(pcuHr): 58.30
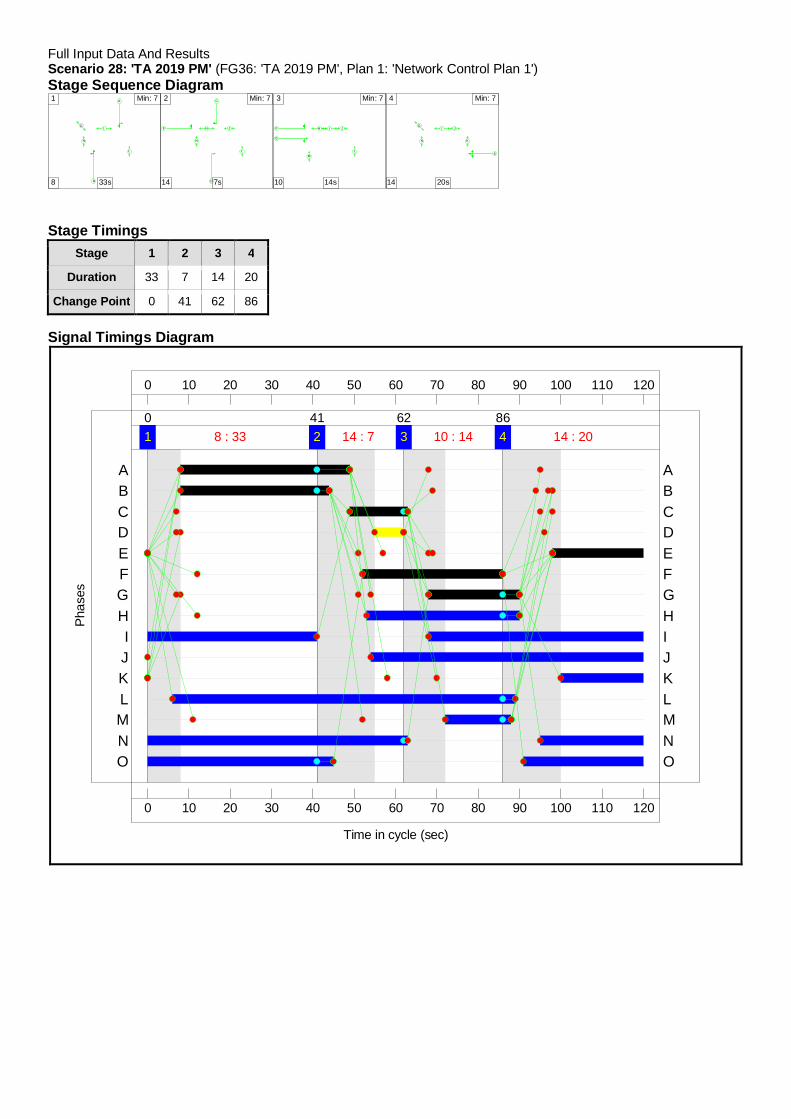
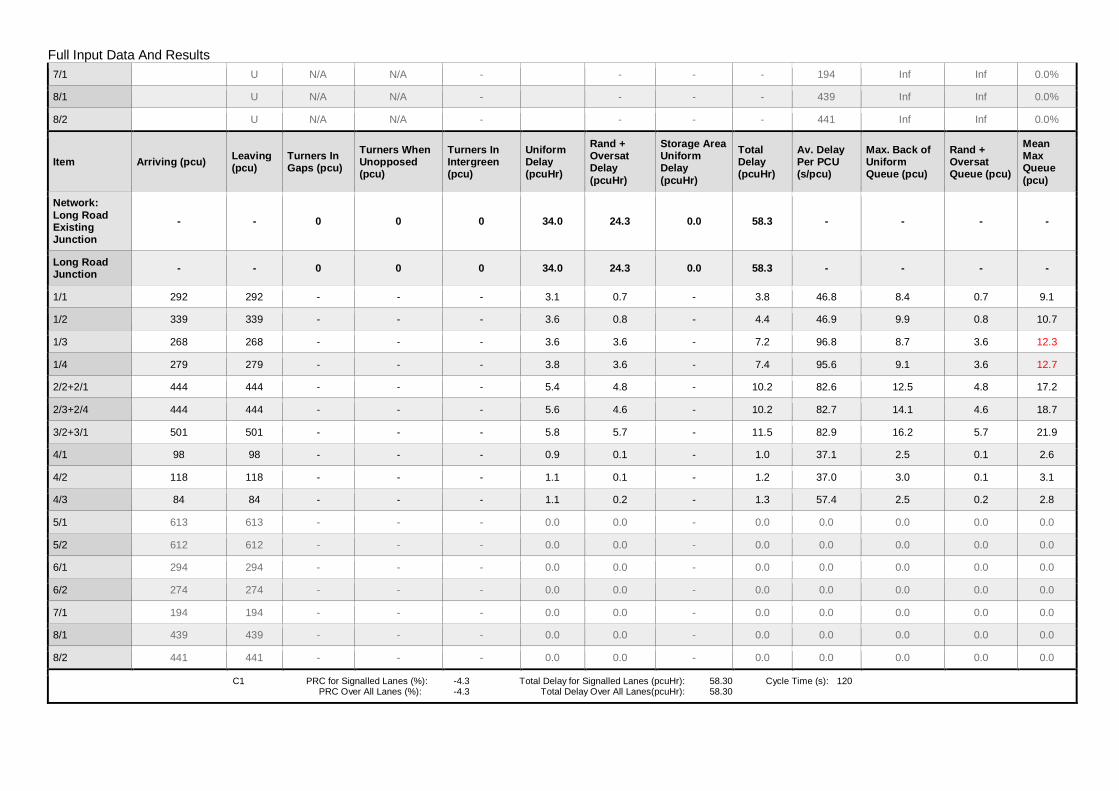
Full Input Data And ResultsScenario 28: 'TA 2019 PM' (FG36: 'TA 2019 PM', Plan 1: 'Network Control Plan 1')Stage Sequence Diagram
A
B
I
L
N
O
1 Min: 7
8 33s
C
D
F H J
L
N
2 Min: 7
14 7s
F
G
H I J
LM
3 Min: 7
10 14s
E
I J
KN
O
4 Min: 7
14 20s
Stage TimingsStage 1 2 3 4
Duration 33 7 14 20
Change Point 0 41 62 86
Signal Timings Diagram
0
0
10
10
20
20
30
30
40
40
50
50
60
60
70
70
80
80
90
90
100
100
110
110
120
120
Time in cycle (sec)
Phas
es
1 8 : 330
2 14 : 741
3 10 : 1462
4 14 : 2086
O ON NM ML LK KJ JI I
H HG GF FE ED DC CB BA A
Full Input Data And ResultsNetwork Layout Diagram
Long Road JunctionPRC: 16.2 %Total Traffic Delay: 46.3 pcuHr
C1
0
1
412
62
386
4
120
Arm
1-A
3022
Brix
ham
Roa
d(n
orth
)
1234
AACC
Arm2
-A3022
BrixhamR
oad(south)
1 2 3 4
B B B D
Arm 3 - Goodrington Road
12
EE
Arm 4 - Long Road
123
FFG
Arm
5-
1 2Ar
m6
-
12
Arm 7 -
1Arm 8 -
12
A
B
C
D
Full Input Data And Results
Network Results
Item LaneDescription
LaneType
ControllerStream
Position InFiltered Route Full Phase Arrow
PhaseNumGreens
Total Green(s)
ArrowGreen (s)
DemandFlow (pcu)
Sat Flow(pcu/Hr)
Capacity(pcu)
Deg Sat(%)
Network:Long RoadExistingJunction
- - N/A - - - - - - - - 77.5%
Long RoadJunction - - N/A - - - - - - - - 77.5%
1/1A3022 Brixham
Road (north)Ahead Left
U N/A N/A A 1 41 - 486 1856 650 74.8%
1/2A3022 Brixham
Road (north)Ahead
U N/A N/A A 1 41 - 558 2075 726 76.8%
1/3A3022 Brixham
Road (north)Right
U N/A N/A C 1 14 - 128 1703 213 60.1%
1/4A3022 Brixham
Road (north)Right
U N/A N/A C 1 14 - 135 1771 221 61.0%
2/2+2/1A3022 BrixhamRoad (south)Ahead Left
U N/A N/A B 1 36 - 377 1925:1655 557+53 61.7 :61.7%
2/3+2/4A3022 BrixhamRoad (south)Ahead Right
U N/A N/A B D 1 36:7 - 423 2085:1725 590+70 64.1 :64.1%
3/2+3/1Goodrington
Road Right LeftAhead
U N/A N/A E 1 22 - 278 1888:1629 317+44 76.9 :76.9%
4/1 Long Road Left U N/A N/A F 1 34 - 302 1773 517 58.4%
4/2 Long Road Left U N/A N/A F 1 34 - 342 1931 563 60.7%
4/3 Long Road RightAhead U N/A N/A G 1 22 - 287 1933 370 77.5%
5/1 U N/A N/A - - - - 751 Inf Inf 0.0%
5/2 U N/A N/A - - - - 751 Inf Inf 0.0%
6/1 U N/A N/A - - - - 477 Inf Inf 0.0%
6/2 U N/A N/A - - - - 442 Inf Inf 0.0%

Full Input Data And Results7/1 U N/A N/A - - - - 491 Inf Inf 0.0%
8/1 U N/A N/A - - - - 201 Inf Inf 0.0%
8/2 U N/A N/A - - - - 203 Inf Inf 0.0%
Item Arriving (pcu) Leaving(pcu)
Turners InGaps (pcu)
Turners WhenUnopposed(pcu)
Turners InIntergreen(pcu)
UniformDelay(pcuHr)
Rand +OversatDelay(pcuHr)
Storage AreaUniformDelay(pcuHr)
TotalDelay(pcuHr)
Av. DelayPer PCU(s/pcu)
Max. Back ofUniformQueue (pcu)
Rand +OversatQueue (pcu)
MeanMaxQueue(pcu)
Network:Long RoadExistingJunction
- - 0 0 0 35.3 11.0 0.0 46.3 - - - -
Long RoadJunction - - 0 0 0 35.3 11.0 0.0 46.3 - - - -
1/1 486 486 - - - 4.6 1.5 - 6.1 45.2 14.2 1.5 15.6
1/2 558 558 - - - 5.4 1.6 - 7.0 45.2 16.4 1.6 18.1
1/3 128 128 - - - 1.8 0.7 - 2.5 70.5 4.0 0.7 4.8
1/4 135 135 - - - 1.9 0.8 - 2.6 70.2 4.2 0.8 5.0
2/2+2/1 377 377 - - - 3.6 0.8 - 4.4 42.2 9.8 0.8 10.6
2/3+2/4 423 423 - - - 4.4 0.9 - 5.2 44.7 11.3 0.9 12.2
3/2+3/1 278 278 - - - 3.5 1.6 - 5.1 66.5 8.4 1.6 10.0
4/1 302 302 - - - 3.0 0.7 - 3.7 44.6 8.6 0.7 9.3
4/2 342 342 - - - 3.5 0.8 - 4.2 44.7 9.8 0.8 10.6
4/3 287 287 - - - 3.7 1.7 - 5.3 66.8 9.0 1.7 10.7
5/1 751 751 - - - 0.0 0.0 - 0.0 0.0 0.0 0.0 0.0
5/2 751 751 - - - 0.0 0.0 - 0.0 0.0 0.0 0.0 0.0
6/1 477 477 - - - 0.0 0.0 - 0.0 0.0 0.0 0.0 0.0
6/2 442 442 - - - 0.0 0.0 - 0.0 0.0 0.0 0.0 0.0
7/1 491 491 - - - 0.0 0.0 - 0.0 0.0 0.0 0.0 0.0
8/1 201 201 - - - 0.0 0.0 - 0.0 0.0 0.0 0.0 0.0
8/2 203 203 - - - 0.0 0.0 - 0.0 0.0 0.0 0.0 0.0
C1 PRC for Signalled Lanes (%): 16.2 Total Delay for Signalled Lanes (pcuHr): 46.35 Cycle Time (s): 120 PRC Over All Lanes (%): 16.2 Total Delay Over All Lanes(pcuHr): 46.35
Full Input Data And ResultsFull Input Data And Results
User and Project DetailsProject: Inglewood
Title: Long Road Junction - KTC proposed highway works
Location: Torbay
File name: Long Road Junction (Possible amendments with additional land0734-040RevB).lsg3x
Author: FF
Company: Key Transport Consultants
Address: 26 Berkeley Square, Bristol, BS8 1HP
Notes:
Network Layout Diagram
Long Road Junction
Arm
1-A
3022
Brix
ham
Roa
d(n
orth
)
1234
1/1
1/2
1/3
1/4
Arm2
-A3022
BrixhamR
oad(south )
1 2 3 4
2/12/22/32/4
Arm 3 - Goodrington Road
12
3/13/2
Arm 4 - Long Road
123
4/14/24/3
Arm
5-
1 25/15/2
Arm
6-
126/
16/
2
Arm 7 -
17/1Arm 8 -
12
8/18/2
A
B
C
D
Full Input Data And Results
Phase Diagram
A
B
C
D
E
F
G
H I J
K
L
M
N
O

Full Input Data And Results
Phase Input DataPhase Name Phase Type Assoc. Phase Street Min Cont Min
A Traffic 7 5
B Traffic 7 7
C Traffic 7 6
D Traffic 7 7
E Traffic 7 7
F Traffic 7 7
G Traffic 7 4
H Pedestrian 7 3
I Pedestrian 7 7
J Pedestrian 7 7
K Pedestrian 7 7
L Pedestrian 7 7
M Pedestrian 7 7
N Pedestrian 7 6
O Pedestrian 7 6
Full Input Data And Results
Phase Intergreens MatrixStarting Phase
TerminatingPhase
A B C D E F G H I J K L M N O
A - - - 6 8 - 5 - - 5 9 - - - -
B - - 5 - 7 8 7 9 - - - - 8 - -
C - 6 - - 6 - 5 - 5 - - - 9 - -
D 6 - - - 6 - 6 - - - 8 - - - -
E 8 8 7 7 - 12 7 12 - - - 6 11 - -
F - 8 - - 12 - - - - - - - - - 5
G 5 7 5 6 8 - - - - - 10 - - 5 -
H - 8 - - 8 - - - - - - - - - -
I - - 8 - - - - - - - - - - - -
J 8 - - - - - - - - - - - - - -
K 8 - - 8 - - 8 - - - - - - - -
L - - - - 10 - - - - - - - - - -
M - 10 10 - 10 - - - - - - - - - -
N - - - - - - 5 - - - - - - - -
O - - - - - 7 - - - - - - - - -
Phases in StageStage No. Phases in Stage
1 A B I L N O
2 C D F H J L N
3 F G H I J L M
4 E I J K N O
Stage DiagramA
B
C
D
E
F
G
H I J
K
LM
N
O
1 Min >= 7 A
B
C
D
E
F
G
H I J
K
LM
N
O
2 Min >= 2 A
B
C
D
E
F
G
H I J
K
LM
N
O
3 Min >= 4 A
B
C
D
E
F
G
H I J
K
LM
N
O
4 Min >= 7
Full Input Data And Results
Phase DelaysTerm. Stage Start Stage Phase Type Value Cont value
1 2 A Losing 8 8
1 2 B Losing 3 3
1 2 O Losing 4 4
1 3 A Losing 8 8
1 3 N Losing 8 8
1 3 O Losing 1 1
1 4 A Losing 2 2
1 4 B Losing 3 3
2 1 C Losing 8 8
2 1 D Losing 2 2
2 1 F Losing 6 6
2 1 H Losing 6 6
2 3 C Losing 1 1
2 3 N Losing 1 1
2 4 C Losing 6 6
2 4 D Losing 6 6
2 4 H Losing 4 4
2 4 L Losing 2 2
3 1 F Losing 8 8
3 1 G Losing 3 3
3 1 H Losing 8 8
3 1 M Losing 6 6
3 2 G Losing 5 5
3 2 I Losing 2 2
3 4 G Losing 4 4
3 4 H Losing 4 4
3 4 L Losing 2 2
3 4 M Losing 2 2
4 2 E Losing 1 1
4 2 O Losing 6 6
4 3 E Losing 1 1
4 3 N Losing 3 3
4 3 O Losing 6 6

Full Input Data And Results
Prohibited Stage ChangeTo Stage
FromStage
1 2 3 4
1 14 13 11
2 14 10 14
3 16 11 14
4 8 13 13

Full Input Data And ResultsGive-Way Lane Input DataJunction: Long Road Junction
There are no Opposed Lanes in this Junction
Full Input Data And ResultsLane Input DataJunction: Long Road Junction
Lane LaneType Phases Start
Disp.EndDisp.
PhysicalLength(PCU)
SatFlowType
Def UserSaturation
Flow(PCU/Hr)
LaneWidth
(m)Gradient Nearside
Lane TurnsTurningRadius
(m)
1/1(A3022
Brixham Road(north))
U A 2 3 60.0 Geom - 3.20 0.00 Y
Arm 6Ahead Inf
Arm 7Left 16.00
1/2(A3022
Brixham Road(north))
U A 2 3 60.0 Geom - 3.20 0.00 N Arm 6Ahead Inf
1/3(A3022
Brixham Road(north))
U C 2 3 11.0 Geom - 3.05 0.00 Y Arm 8Right 11.80
1/4(A3022
Brixham Road(north))
U C 2 3 11.0 Geom - 3.05 0.00 N Arm 8Right 9.20
2/1(A3022
Brixham Road(south))
U B 2 3 12.0 Geom - 3.00 0.00 Y Arm 8Left 5.20
2/2(A3022
Brixham Road(south))
U B 2 3 60.0 Geom - 3.75 0.00 Y Arm 5Ahead Inf
2/3(A3022
Brixham Road(south))
U B 2 3 60.0 Geom - 3.70 0.00 N Arm 5Ahead Inf
2/4(A3022
Brixham Road(south))
U D 2 3 13.0 Geom - 3.70 0.00 Y Arm 7Right 10.80
3/1(Goodrington
Road)U E 2 3 10.0 Geom - 3.35 0.00 Y Arm 6
Left 7.60
3/2(Goodrington
Road)U E 2 3 60.0 Geom - 3.35 0.00 Y
Arm 5Right 25.60
Arm 8Ahead Inf
4/1(Long Road) U F 2 3 13.5 Geom - 3.00 0.00 Y Arm 5
Left 18.70
4/2(Long Road) U F 2 3 13.5 Geom - 3.00 0.00 N Arm 5
Left 23.40
4/3(Long Road) U G 2 3 60.0 Geom - 3.50 0.00 Y
Arm 6Right 20.20
Arm 7Ahead Inf
5/1 U 2 3 60.0 Inf - - - - - -
5/2 U 2 3 60.0 Inf - - - - - -
6/1 U 2 3 60.0 Inf - - - - - -
Full Input Data And Results6/2 U 2 3 60.0 Inf - - - - - -
7/1 U 2 3 60.0 Inf - - - - - -
8/1 U 2 3 60.0 Inf - - - - - -
8/2 U 2 3 60.0 Inf - - - - - -
Traffic Flow GroupsFlow Group Start Time End Time Duration Formula
33: 'TA 2024 + Dev AM' 08:00 09:00 01:00 F31+F3
34: 'TA 2024 + Dev PM' 17:00 18:00 01:00 F32+F4
Scenario 23: 'TA 2024 + Dev AM' (FG33: 'TA 2024 + Dev AM', Plan 1: 'Network Control Plan 1')Traffic Flows, DesiredDesired Flow :
Destination
Origin
A B C D Tot.
A 0 114 607 586 1307
B 237 0 23 261 521
C 891 31 0 84 1006
D 235 72 17 0 324
Tot. 1363 217 647 931 3158
Full Input Data And Results
Traffic Lane Flows
LaneScenario 23:
TA 2024 + DevAM
Junction: Long Road Junction
1/1 336
1/2 385
1/3 286
1/4 300
2/1 84
2/2 432
2/3(with short)
490(In)459(Out)
2/4(short) 31
3/1(short) 23
3/2(with short)
521(In)498(Out)
4/1 106
4/2 129
4/3 89
5/1 681
5/2 682
6/1 335
6/2 312
7/1 217
8/1 465
8/2 466

Full Input Data And Results
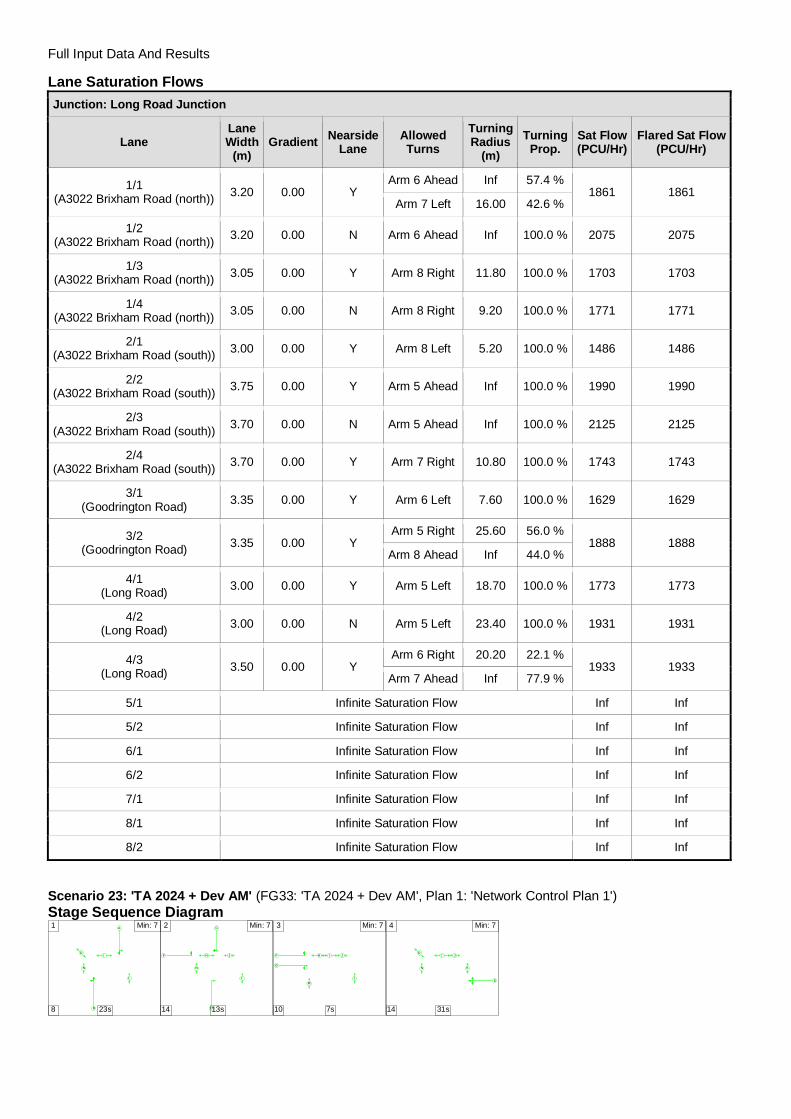
Lane Saturation FlowsJunction: Long Road Junction
LaneLaneWidth
(m)Gradient Nearside
LaneAllowedTurns
TurningRadius
(m)Turning
Prop.Sat Flow(PCU/Hr)
Flared Sat Flow(PCU/Hr)
1/1(A3022 Brixham Road (north)) 3.20 0.00 Y
Arm 6 Ahead Inf 66.1 %1875 1875
Arm 7 Left 16.00 33.9 %
1/2(A3022 Brixham Road (north)) 3.20 0.00 N Arm 6 Ahead Inf 100.0 % 2075 2075
1/3(A3022 Brixham Road (north)) 3.05 0.00 Y Arm 8 Right 11.80 100.0 % 1703 1703
1/4(A3022 Brixham Road (north)) 3.05 0.00 N Arm 8 Right 9.20 100.0 % 1771 1771
2/1(A3022 Brixham Road (south)) 3.00 0.00 Y Arm 8 Left 5.20 100.0 % 1486 1486
2/2(A3022 Brixham Road (south)) 3.75 0.00 Y Arm 5 Ahead Inf 100.0 % 1990 1990
2/3(A3022 Brixham Road (south)) 3.70 0.00 N Arm 5 Ahead Inf 100.0 % 2125 2125
2/4(A3022 Brixham Road (south)) 3.70 0.00 Y Arm 7 Right 10.80 100.0 % 1743 1743
3/1(Goodrington Road) 3.35 0.00 Y Arm 6 Left 7.60 100.0 % 1629 1629
3/2(Goodrington Road) 3.35 0.00 Y
Arm 5 Right 25.60 47.6 %1897 1897
Arm 8 Ahead Inf 52.4 %
4/1(Long Road) 3.00 0.00 Y Arm 5 Left 18.70 100.0 % 1773 1773
4/2(Long Road) 3.00 0.00 N Arm 5 Left 23.40 100.0 % 1931 1931
4/3(Long Road) 3.50 0.00 Y
Arm 6 Right 20.20 19.1 %1938 1938
Arm 7 Ahead Inf 80.9 %
5/1 Infinite Saturation Flow Inf Inf
5/2 Infinite Saturation Flow Inf Inf
6/1 Infinite Saturation Flow Inf Inf
6/2 Infinite Saturation Flow Inf Inf
7/1 Infinite Saturation Flow Inf Inf
8/1 Infinite Saturation Flow Inf Inf
8/2 Infinite Saturation Flow Inf Inf
Full Input Data And Results
Scenario 24: 'TA 2024 + Dev PM' (FG34: 'TA 2024 + Dev PM', Plan 1: 'Network Control Plan 1')Traffic Flows, DesiredDesired Flow :
Destination
Origin
A B C D Tot.
A 0 233 935 299 1467
B 149 0 40 117 306
C 814 49 0 37 900
D 707 239 68 0 1014
Tot. 1670 521 1043 453 3687
Traffic Lane Flows
LaneScenario 24:
TA 2024 + DevPM
Junction: Long Road Junction
1/1 547
1/2 621
1/3 146
1/4 153
2/1 37
2/2 392
2/3(with short)
471(In)422(Out)
2/4(short) 49
3/1(short) 40
3/2(with short)
306(In)266(Out)
4/1 334
4/2 373
4/3 307
5/1 836
5/2 834
6/1 542
6/2 501
7/1 521
8/1 225
8/2 228
Full Input Data And Results
Lane Saturation FlowsJunction: Long Road Junction
LaneLaneWidth
(m)Gradient Nearside
LaneAllowedTurns
TurningRadius
(m)Turning
Prop.Sat Flow(PCU/Hr)
Flared Sat Flow(PCU/Hr)
1/1(A3022 Brixham Road (north)) 3.20 0.00 Y
Arm 6 Ahead Inf 57.4 %1861 1861
Arm 7 Left 16.00 42.6 %
1/2(A3022 Brixham Road (north)) 3.20 0.00 N Arm 6 Ahead Inf 100.0 % 2075 2075
1/3(A3022 Brixham Road (north)) 3.05 0.00 Y Arm 8 Right 11.80 100.0 % 1703 1703
1/4(A3022 Brixham Road (north)) 3.05 0.00 N Arm 8 Right 9.20 100.0 % 1771 1771
2/1(A3022 Brixham Road (south)) 3.00 0.00 Y Arm 8 Left 5.20 100.0 % 1486 1486
2/2(A3022 Brixham Road (south)) 3.75 0.00 Y Arm 5 Ahead Inf 100.0 % 1990 1990
2/3(A3022 Brixham Road (south)) 3.70 0.00 N Arm 5 Ahead Inf 100.0 % 2125 2125
2/4(A3022 Brixham Road (south)) 3.70 0.00 Y Arm 7 Right 10.80 100.0 % 1743 1743
3/1(Goodrington Road) 3.35 0.00 Y Arm 6 Left 7.60 100.0 % 1629 1629
3/2(Goodrington Road) 3.35 0.00 Y
Arm 5 Right 25.60 56.0 %1888 1888
Arm 8 Ahead Inf 44.0 %
4/1(Long Road) 3.00 0.00 Y Arm 5 Left 18.70 100.0 % 1773 1773
4/2(Long Road) 3.00 0.00 N Arm 5 Left 23.40 100.0 % 1931 1931
4/3(Long Road) 3.50 0.00 Y
Arm 6 Right 20.20 22.1 %1933 1933
Arm 7 Ahead Inf 77.9 %
5/1 Infinite Saturation Flow Inf Inf
5/2 Infinite Saturation Flow Inf Inf
6/1 Infinite Saturation Flow Inf Inf
6/2 Infinite Saturation Flow Inf Inf
7/1 Infinite Saturation Flow Inf Inf
8/1 Infinite Saturation Flow Inf Inf
8/2 Infinite Saturation Flow Inf Inf
Scenario 23: 'TA 2024 + Dev AM' (FG33: 'TA 2024 + Dev AM', Plan 1: 'Network Control Plan 1')Stage Sequence Diagram
A
B
I
L
N
O
1 Min: 7
8 23s
C
D
F H J
L
N
2 Min: 7
14 13s
F
G
H I J
LM
3 Min: 7
10 7s
E
I J
KN
O
4 Min: 7
14 31s
Full Input Data And Results
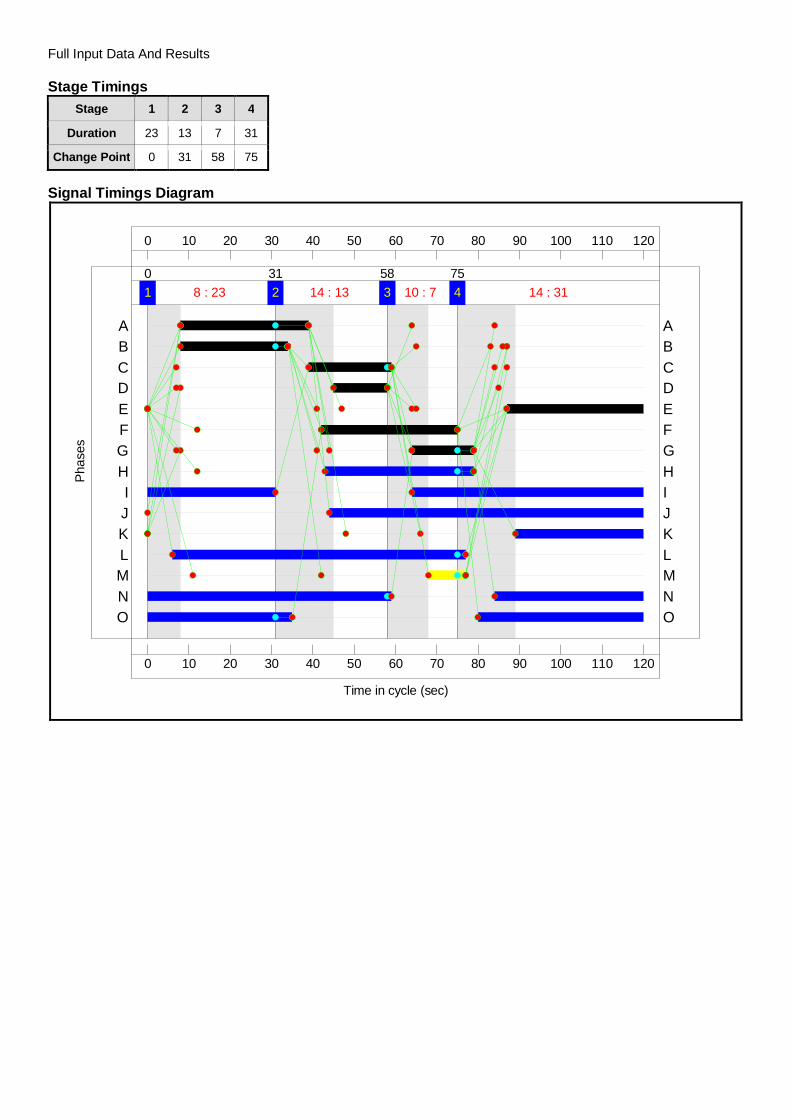
Stage TimingsStage 1 2 3 4
Duration 23 13 7 31
Change Point 0 31 58 75
Signal Timings Diagram
0
0
10
10
20
20
30
30
40
40
50
50
60
60
70
70
80
80
90
90
100
100
110
110
120
120
Time in cycle (sec)
Phas
es
1 8 : 230
2 14 : 1331
3 10 : 758
4 14 : 3175
O ON NM ML LK KJ JI I
H HG GF FE ED DC CB BA A
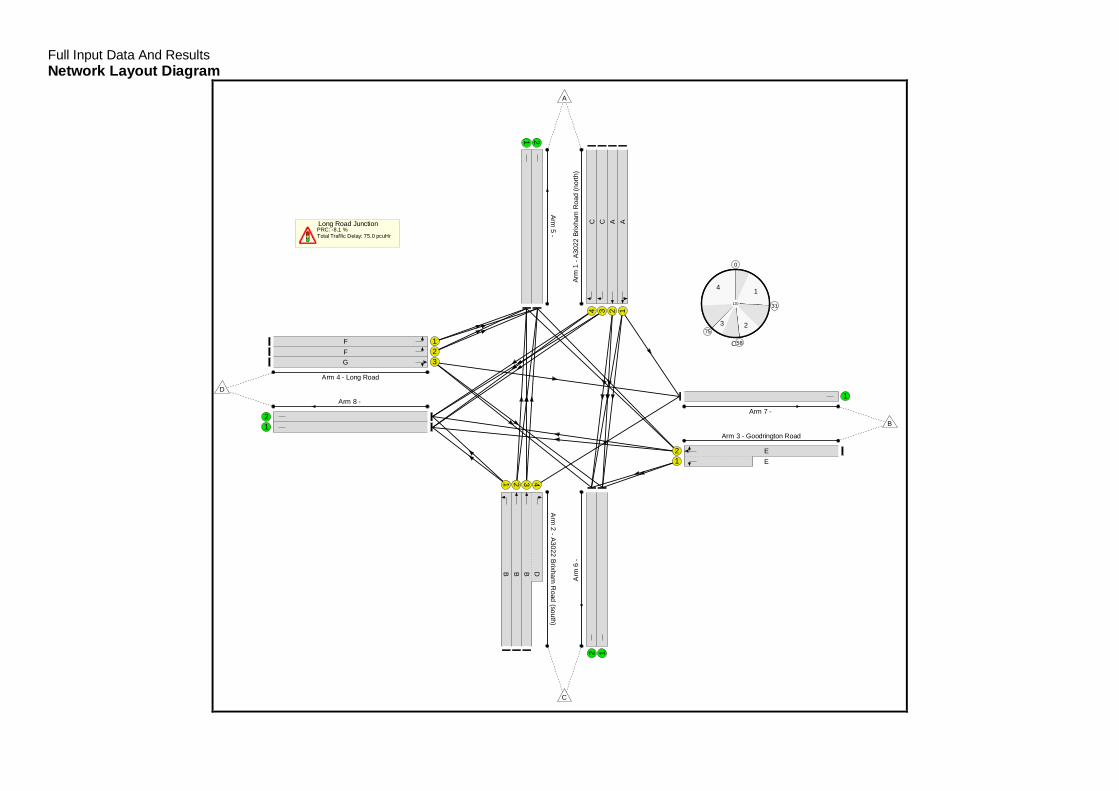
Full Input Data And ResultsNetwork Layout Diagram
Long Road JunctionPRC: -8.1 %Total Traffic Delay: 75.0 pcuHr
C1
0
1
31
2
58
375
4
120
Arm
1-A
3022
Brix
ham
Roa
d(n
orth
)
1234
AACC
Arm
2-A3022
BrixhamR
oad(south)
1 2 3 4
B B B D
Arm 3 - Goodrington Road
12
EE
Arm 4 - Long Road
123
FFG
Arm5
-
1 2A
rm6
-
12
Arm 7 -
1Arm 8 -
12
A
B
C
D
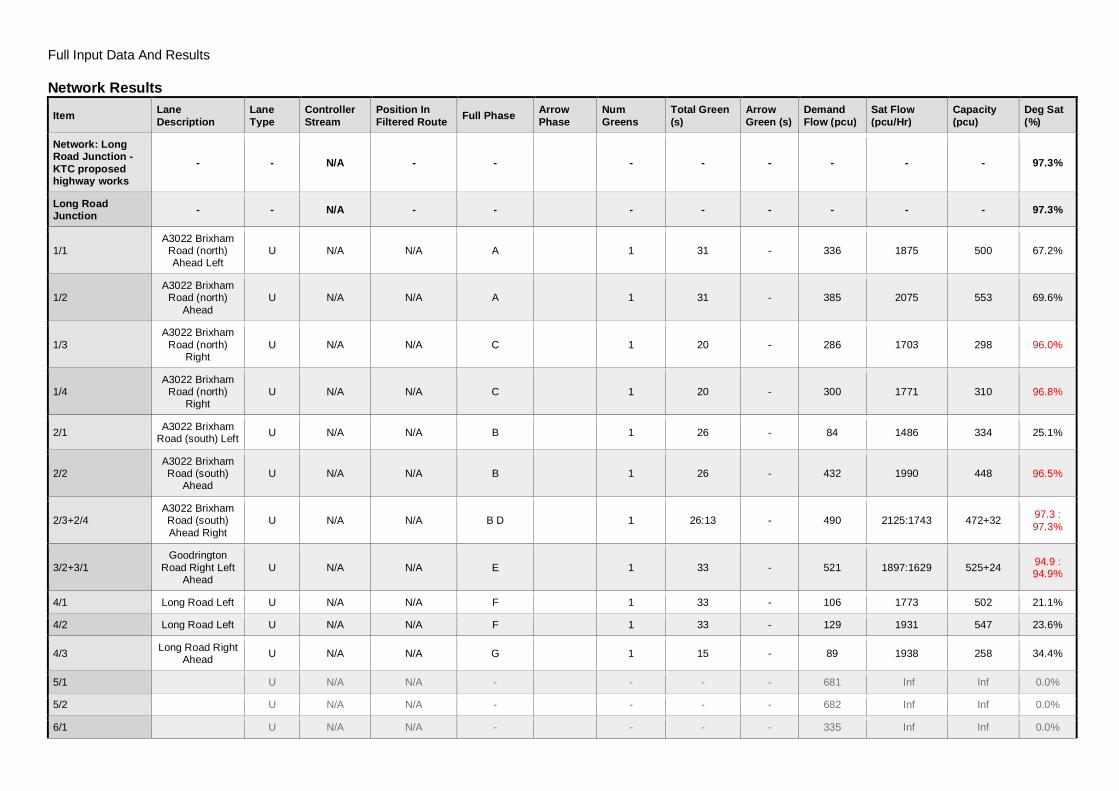
Full Input Data And Results
Network Results
Item LaneDescription
LaneType
ControllerStream
Position InFiltered Route Full Phase Arrow
PhaseNumGreens
Total Green(s)
ArrowGreen (s)
DemandFlow (pcu)
Sat Flow(pcu/Hr)
Capacity(pcu)
Deg Sat(%)
Network: LongRoad Junction -KTC proposedhighway works
- - N/A - - - - - - - - 97.3%
Long RoadJunction - - N/A - - - - - - - - 97.3%
1/1A3022 Brixham
Road (north)Ahead Left
U N/A N/A A 1 31 - 336 1875 500 67.2%
1/2A3022 Brixham
Road (north)Ahead
U N/A N/A A 1 31 - 385 2075 553 69.6%
1/3A3022 Brixham
Road (north)Right
U N/A N/A C 1 20 - 286 1703 298 96.0%
1/4A3022 Brixham
Road (north)Right
U N/A N/A C 1 20 - 300 1771 310 96.8%
2/1 A3022 BrixhamRoad (south) Left U N/A N/A B 1 26 - 84 1486 334 25.1%
2/2A3022 BrixhamRoad (south)
AheadU N/A N/A B 1 26 - 432 1990 448 96.5%
2/3+2/4A3022 BrixhamRoad (south)Ahead Right
U N/A N/A B D 1 26:13 - 490 2125:1743 472+32 97.3 :97.3%
3/2+3/1Goodrington
Road Right LeftAhead
U N/A N/A E 1 33 - 521 1897:1629 525+24 94.9 :94.9%
4/1 Long Road Left U N/A N/A F 1 33 - 106 1773 502 21.1%
4/2 Long Road Left U N/A N/A F 1 33 - 129 1931 547 23.6%
4/3 Long Road RightAhead U N/A N/A G 1 15 - 89 1938 258 34.4%
5/1 U N/A N/A - - - - 681 Inf Inf 0.0%
5/2 U N/A N/A - - - - 682 Inf Inf 0.0%
6/1 U N/A N/A - - - - 335 Inf Inf 0.0%
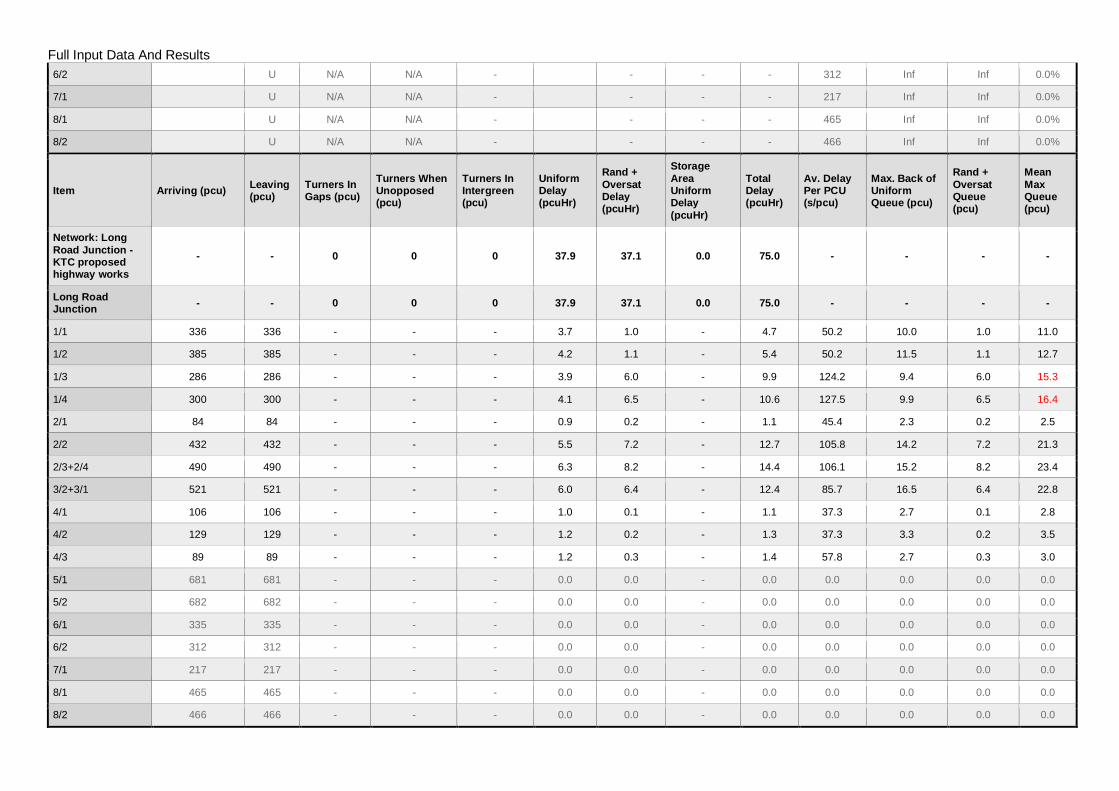
Full Input Data And Results6/2 U N/A N/A - - - - 312 Inf Inf 0.0%
7/1 U N/A N/A - - - - 217 Inf Inf 0.0%
8/1 U N/A N/A - - - - 465 Inf Inf 0.0%
8/2 U N/A N/A - - - - 466 Inf Inf 0.0%
Item Arriving (pcu) Leaving(pcu)
Turners InGaps (pcu)
Turners WhenUnopposed(pcu)
Turners InIntergreen(pcu)
UniformDelay(pcuHr)
Rand +OversatDelay(pcuHr)
StorageAreaUniformDelay(pcuHr)
TotalDelay(pcuHr)
Av. DelayPer PCU(s/pcu)
Max. Back ofUniformQueue (pcu)
Rand +OversatQueue(pcu)
MeanMaxQueue(pcu)
Network: LongRoad Junction -KTC proposedhighway works
- - 0 0 0 37.9 37.1 0.0 75.0 - - - -
Long RoadJunction - - 0 0 0 37.9 37.1 0.0 75.0 - - - -
1/1 336 336 - - - 3.7 1.0 - 4.7 50.2 10.0 1.0 11.0
1/2 385 385 - - - 4.2 1.1 - 5.4 50.2 11.5 1.1 12.7
1/3 286 286 - - - 3.9 6.0 - 9.9 124.2 9.4 6.0 15.3
1/4 300 300 - - - 4.1 6.5 - 10.6 127.5 9.9 6.5 16.4
2/1 84 84 - - - 0.9 0.2 - 1.1 45.4 2.3 0.2 2.5
2/2 432 432 - - - 5.5 7.2 - 12.7 105.8 14.2 7.2 21.3
2/3+2/4 490 490 - - - 6.3 8.2 - 14.4 106.1 15.2 8.2 23.4
3/2+3/1 521 521 - - - 6.0 6.4 - 12.4 85.7 16.5 6.4 22.8
4/1 106 106 - - - 1.0 0.1 - 1.1 37.3 2.7 0.1 2.8
4/2 129 129 - - - 1.2 0.2 - 1.3 37.3 3.3 0.2 3.5
4/3 89 89 - - - 1.2 0.3 - 1.4 57.8 2.7 0.3 3.0
5/1 681 681 - - - 0.0 0.0 - 0.0 0.0 0.0 0.0 0.0
5/2 682 682 - - - 0.0 0.0 - 0.0 0.0 0.0 0.0 0.0
6/1 335 335 - - - 0.0 0.0 - 0.0 0.0 0.0 0.0 0.0
6/2 312 312 - - - 0.0 0.0 - 0.0 0.0 0.0 0.0 0.0
7/1 217 217 - - - 0.0 0.0 - 0.0 0.0 0.0 0.0 0.0
8/1 465 465 - - - 0.0 0.0 - 0.0 0.0 0.0 0.0 0.0
8/2 466 466 - - - 0.0 0.0 - 0.0 0.0 0.0 0.0 0.0

Full Input Data And ResultsC1 PRC for Signalled Lanes (%): -8.1 Total Delay for Signalled Lanes (pcuHr): 75.00 Cycle Time (s): 120
PRC Over All Lanes (%): -8.1 Total Delay Over All Lanes(pcuHr): 75.00

Full Input Data And ResultsScenario 24: 'TA 2024 + Dev PM' (FG34: 'TA 2024 + Dev PM', Plan 1: 'Network Control Plan 1')Stage Sequence Diagram
A
B
I
L
N
O
1 Min: 7
8 35s
C
D
F H J
L
N
2 Min: 7
14 7s
F
G
H I J
LM
3 Min: 7
10 14s
E
I J
KN
O
4 Min: 7
14 18s
Stage TimingsStage 1 2 3 4
Duration 35 7 14 18
Change Point 0 43 64 88
Signal Timings Diagram
0
0
10
10
20
20
30
30
40
40
50
50
60
60
70
70
80
80
90
90
100
100
110
110
120
120
Time in cycle (sec)
Phas
es
1 8 : 350
2 14 : 743
3 10 : 1464
4 14 : 1888
O ON NM ML LK KJ JI I
H HG GF FE ED DC CB BA A

Full Input Data And ResultsNetwork Layout Diagram
Long Road JunctionPRC: 8.6 %Total Traffic Delay: 53.4 pcuHr
C1
0
1
432
64
388
4
120
Arm
1-A
3022
Brix
ham
Roa
d(n
orth
)
1234
AACC
Ar m2
-A3022
Brixham
Road
(south)
1 2 3 4
B B B D
Arm 3 - Goodrington Road
12
EE
Arm 4 - Long Road
123
FFG
Arm
5-
1 2Ar
m6
-
12
Arm 7 -
1Arm 8 -
12
A
B
C
D
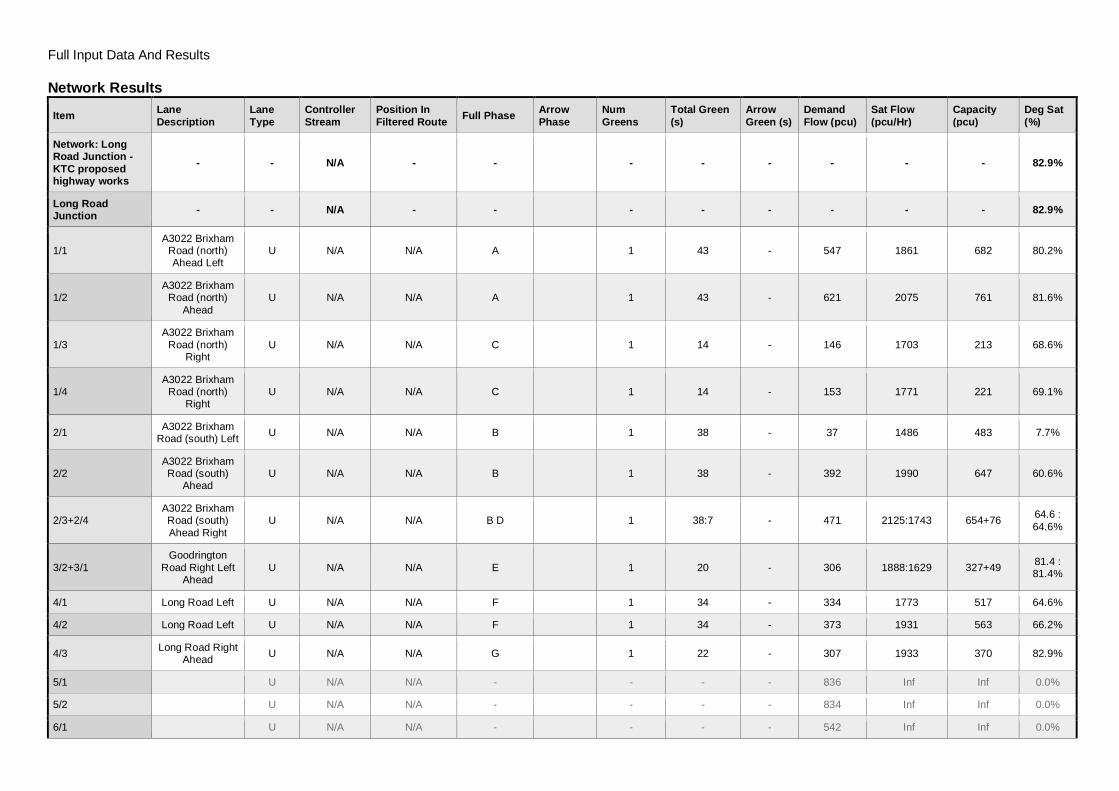
Full Input Data And Results
Network Results
Item LaneDescription
LaneType
ControllerStream
Position InFiltered Route Full Phase Arrow
PhaseNumGreens
Total Green(s)
ArrowGreen (s)
DemandFlow (pcu)
Sat Flow(pcu/Hr)
Capacity(pcu)
Deg Sat(%)
Network: LongRoad Junction -KTC proposedhighway works
- - N/A - - - - - - - - 82.9%
Long RoadJunction - - N/A - - - - - - - - 82.9%
1/1A3022 Brixham
Road (north)Ahead Left
U N/A N/A A 1 43 - 547 1861 682 80.2%
1/2A3022 Brixham
Road (north)Ahead
U N/A N/A A 1 43 - 621 2075 761 81.6%
1/3A3022 Brixham
Road (north)Right
U N/A N/A C 1 14 - 146 1703 213 68.6%
1/4A3022 Brixham
Road (north)Right
U N/A N/A C 1 14 - 153 1771 221 69.1%
2/1 A3022 BrixhamRoad (south) Left U N/A N/A B 1 38 - 37 1486 483 7.7%
2/2A3022 BrixhamRoad (south)
AheadU N/A N/A B 1 38 - 392 1990 647 60.6%
2/3+2/4A3022 BrixhamRoad (south)Ahead Right
U N/A N/A B D 1 38:7 - 471 2125:1743 654+76 64.6 :64.6%
3/2+3/1Goodrington
Road Right LeftAhead
U N/A N/A E 1 20 - 306 1888:1629 327+49 81.4 :81.4%
4/1 Long Road Left U N/A N/A F 1 34 - 334 1773 517 64.6%
4/2 Long Road Left U N/A N/A F 1 34 - 373 1931 563 66.2%
4/3 Long Road RightAhead U N/A N/A G 1 22 - 307 1933 370 82.9%
5/1 U N/A N/A - - - - 836 Inf Inf 0.0%
5/2 U N/A N/A - - - - 834 Inf Inf 0.0%
6/1 U N/A N/A - - - - 542 Inf Inf 0.0%
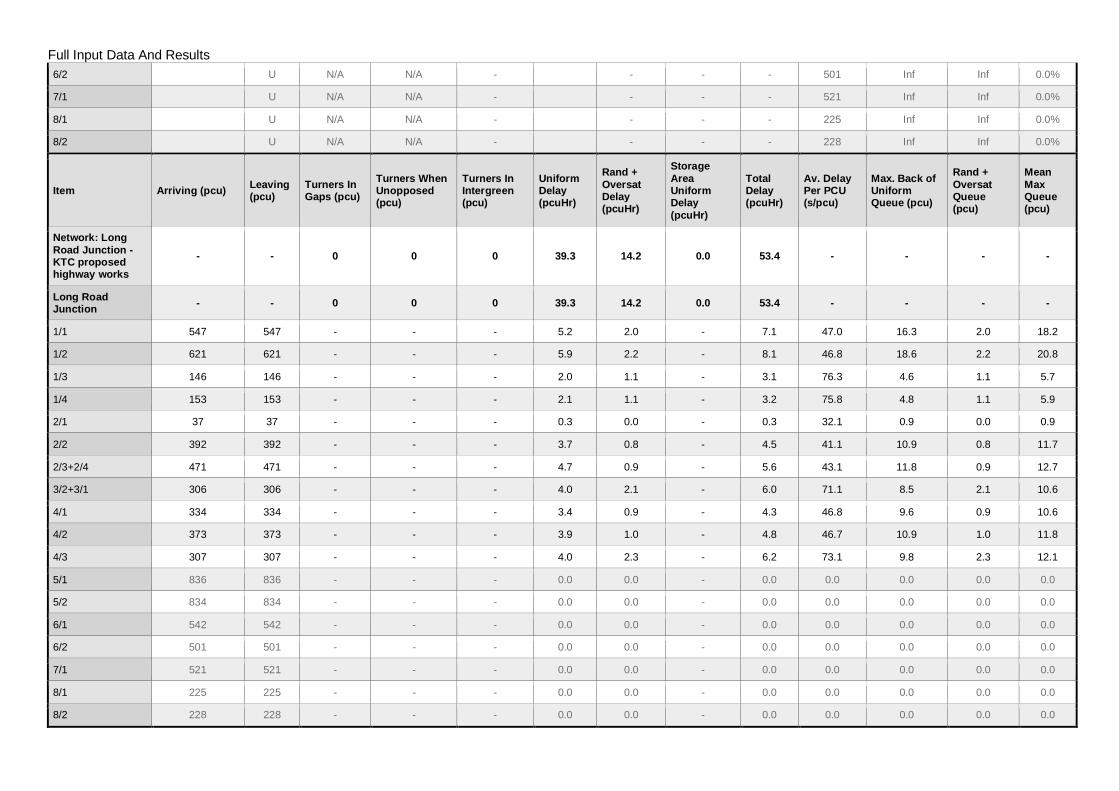
Full Input Data And Results6/2 U N/A N/A - - - - 501 Inf Inf 0.0%
7/1 U N/A N/A - - - - 521 Inf Inf 0.0%
8/1 U N/A N/A - - - - 225 Inf Inf 0.0%
8/2 U N/A N/A - - - - 228 Inf Inf 0.0%
Item Arriving (pcu) Leaving(pcu)
Turners InGaps (pcu)
Turners WhenUnopposed(pcu)
Turners InIntergreen(pcu)
UniformDelay(pcuHr)
Rand +OversatDelay(pcuHr)
StorageAreaUniformDelay(pcuHr)
TotalDelay(pcuHr)
Av. DelayPer PCU(s/pcu)
Max. Back ofUniformQueue (pcu)
Rand +OversatQueue(pcu)
MeanMaxQueue(pcu)
Network: LongRoad Junction -KTC proposedhighway works
- - 0 0 0 39.3 14.2 0.0 53.4 - - - -
Long RoadJunction - - 0 0 0 39.3 14.2 0.0 53.4 - - - -
1/1 547 547 - - - 5.2 2.0 - 7.1 47.0 16.3 2.0 18.2
1/2 621 621 - - - 5.9 2.2 - 8.1 46.8 18.6 2.2 20.8
1/3 146 146 - - - 2.0 1.1 - 3.1 76.3 4.6 1.1 5.7
1/4 153 153 - - - 2.1 1.1 - 3.2 75.8 4.8 1.1 5.9
2/1 37 37 - - - 0.3 0.0 - 0.3 32.1 0.9 0.0 0.9
2/2 392 392 - - - 3.7 0.8 - 4.5 41.1 10.9 0.8 11.7
2/3+2/4 471 471 - - - 4.7 0.9 - 5.6 43.1 11.8 0.9 12.7
3/2+3/1 306 306 - - - 4.0 2.1 - 6.0 71.1 8.5 2.1 10.6
4/1 334 334 - - - 3.4 0.9 - 4.3 46.8 9.6 0.9 10.6
4/2 373 373 - - - 3.9 1.0 - 4.8 46.7 10.9 1.0 11.8
4/3 307 307 - - - 4.0 2.3 - 6.2 73.1 9.8 2.3 12.1
5/1 836 836 - - - 0.0 0.0 - 0.0 0.0 0.0 0.0 0.0
5/2 834 834 - - - 0.0 0.0 - 0.0 0.0 0.0 0.0 0.0
6/1 542 542 - - - 0.0 0.0 - 0.0 0.0 0.0 0.0 0.0
6/2 501 501 - - - 0.0 0.0 - 0.0 0.0 0.0 0.0 0.0
7/1 521 521 - - - 0.0 0.0 - 0.0 0.0 0.0 0.0 0.0
8/1 225 225 - - - 0.0 0.0 - 0.0 0.0 0.0 0.0 0.0
8/2 228 228 - - - 0.0 0.0 - 0.0 0.0 0.0 0.0 0.0
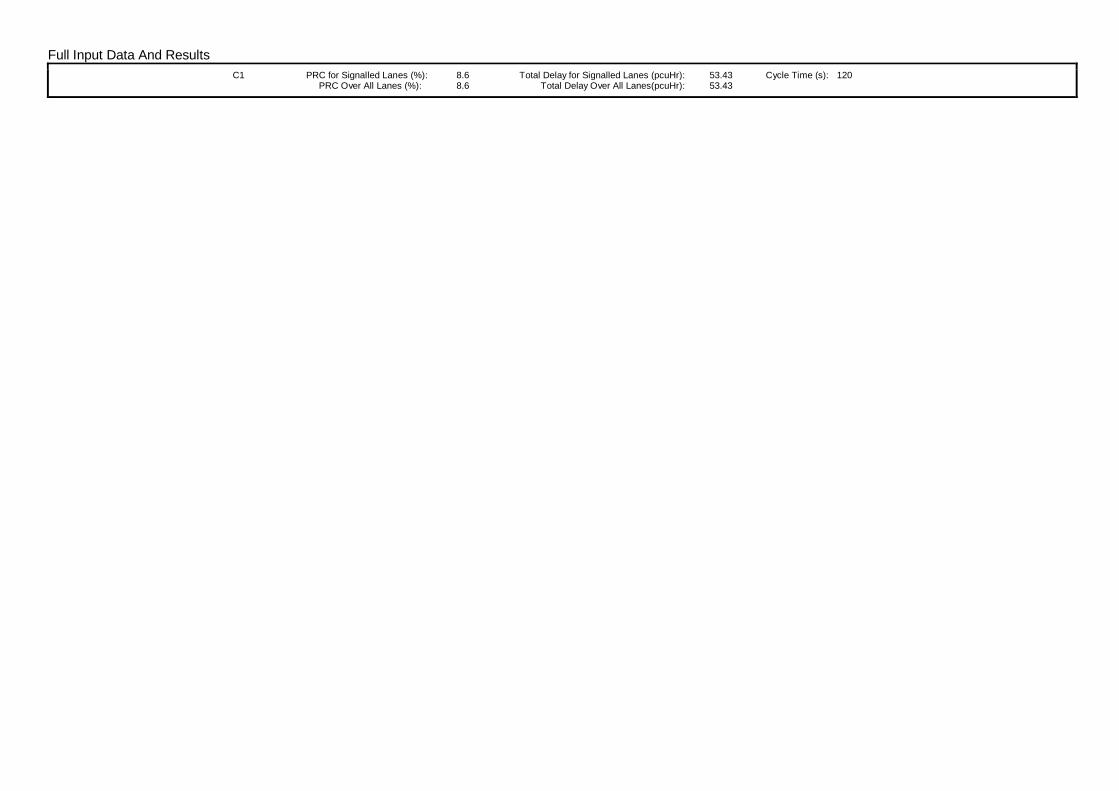
Full Input Data And ResultsC1 PRC for Signalled Lanes (%): 8.6 Total Delay for Signalled Lanes (pcuHr): 53.43 Cycle Time (s): 120
PRC Over All Lanes (%): 8.6 Total Delay Over All Lanes(pcuHr): 53.43
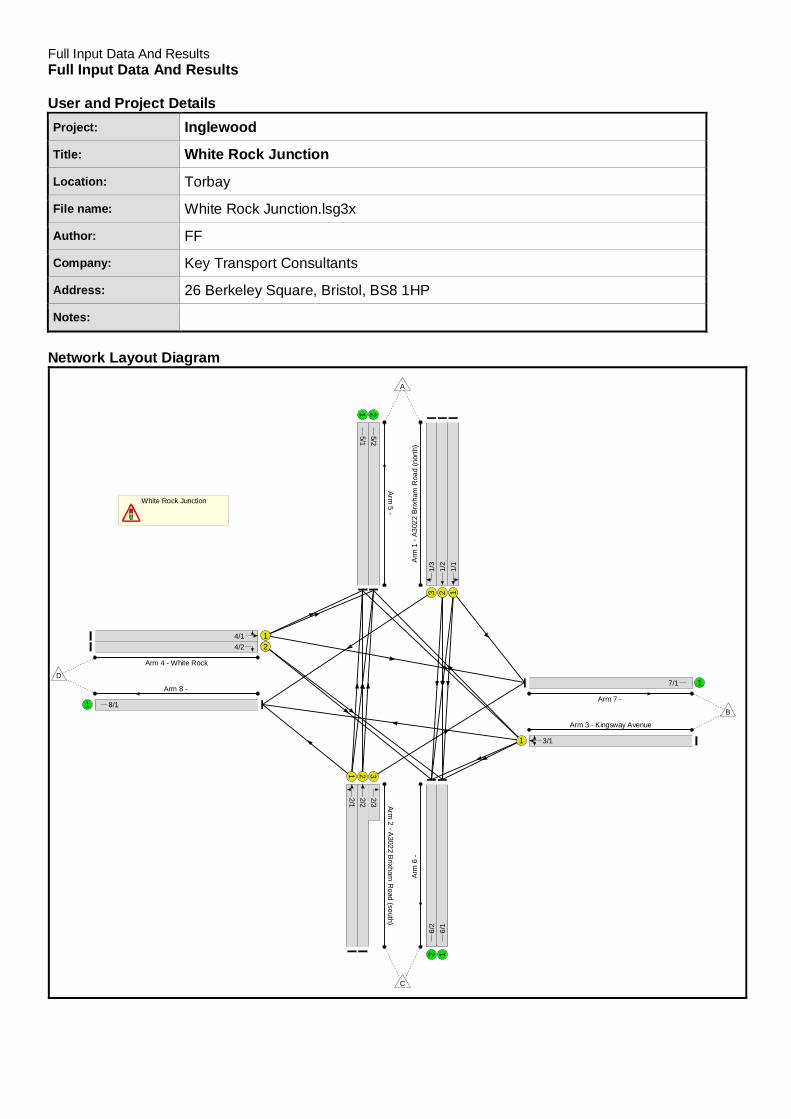
Full Input Data And ResultsFull Input Data And Results
User and Project DetailsProject: Inglewood
Title: White Rock Junction
Location: Torbay
File name: White Rock Junction.lsg3x
Author: FF
Company: Key Transport Consultants
Address: 26 Berkeley Square, Bristol, BS8 1HP
Notes:
Network Layout Diagram
White Rock Junction
Arm
1-A
3022
Brix
h am
Roa
d(n
orth
)
123
1/1
1/2
1/3
Arm2
-A3022
Brixham
Road
(south)
1 2 3
2/12/22/3
Arm 3 - Kingsway Avenue
1 3/1
Arm 4 - White Rock
12
4/14/2
Arm5
-
1 25/15/2
Arm
6-
126/
16/
2
Arm 7 -
17/1Arm 8 -
1 8/1
A
B
C
D
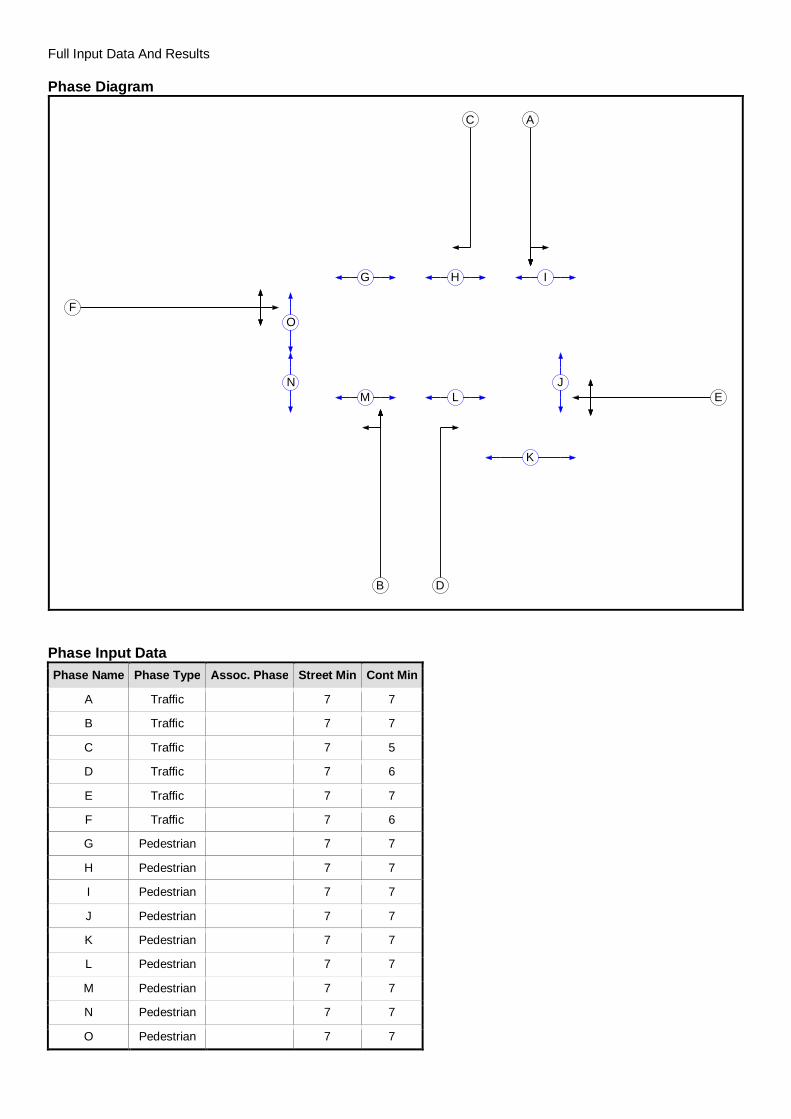
Full Input Data And Results
Phase Diagram
A
B
C
D
E
F
G H I
J
K
LMN
O
Phase Input DataPhase Name Phase Type Assoc. Phase Street Min Cont Min
A Traffic 7 7
B Traffic 7 7
C Traffic 7 5
D Traffic 7 6
E Traffic 7 7
F Traffic 7 6
G Pedestrian 7 7
H Pedestrian 7 7
I Pedestrian 7 7
J Pedestrian 7 7
K Pedestrian 7 7
L Pedestrian 7 7
M Pedestrian 7 7
N Pedestrian 7 7
O Pedestrian 7 7
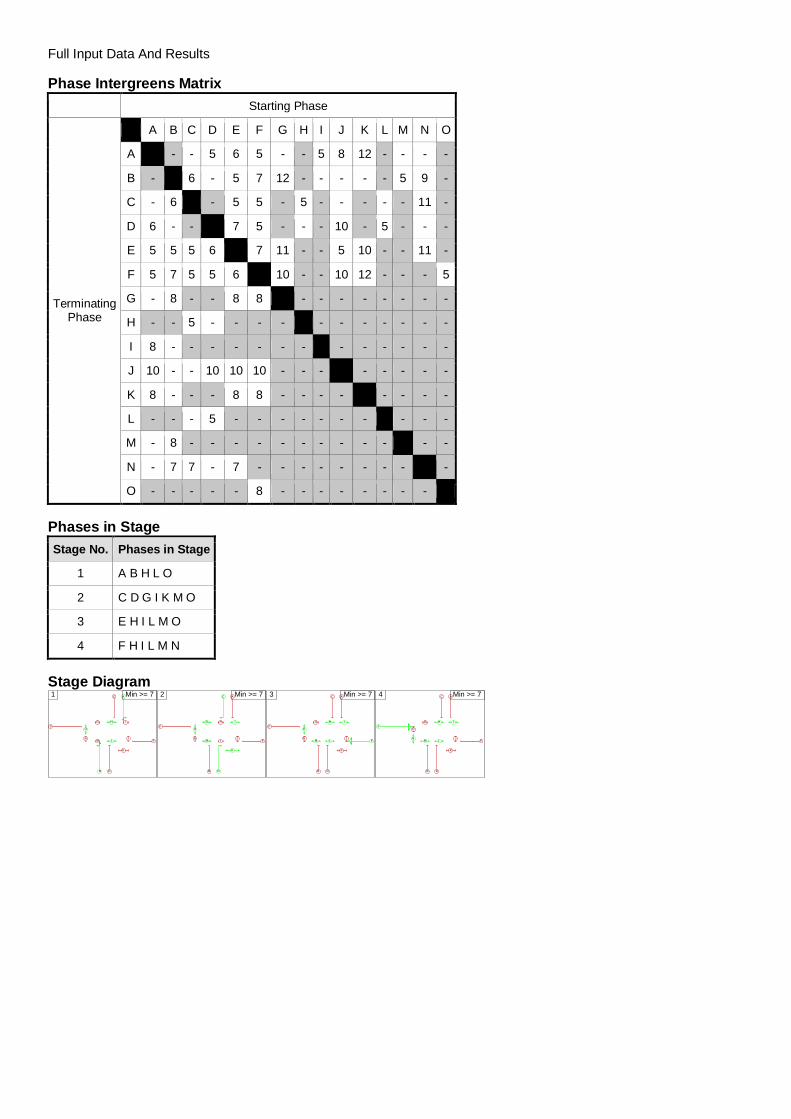
Full Input Data And Results
Phase Intergreens MatrixStarting Phase
TerminatingPhase
A B C D E F G H I J K L M N O
A - - - 5 6 5 - - 5 8 12 - - - -
B - - 6 - 5 7 12 - - - - - 5 9 -
C - 6 - - 5 5 - 5 - - - - - 11 -
D 6 - - - 7 5 - - - 10 - 5 - - -
E 5 5 5 6 - 7 11 - - 5 10 - - 11 -
F 5 7 5 5 6 - 10 - - 10 12 - - - 5
G - 8 - - 8 8 - - - - - - - - -
H - - 5 - - - - - - - - - - - -
I 8 - - - - - - - - - - - - - -
J 10 - - 10 10 10 - - - - - - - - -
K 8 - - - 8 8 - - - - - - - - -
L - - - 5 - - - - - - - - - - -
M - 8 - - - - - - - - - - - - -
N - 7 7 - 7 - - - - - - - - - -
O - - - - - 8 - - - - - - - - -
Phases in StageStage No. Phases in Stage
1 A B H L O
2 C D G I K M O
3 E H I L M O
4 F H I L M N
Stage DiagramA
B
C
D
E
FG H I
J
K
LMN
O
1 Min >= 7 A
B
C
D
E
FG H I
J
K
LMN
O
2 Min >= 7 A
B
C
D
E
FG H I
J
K
LMN
O
3 Min >= 7 A
B
C
D
E
FG H I
J
K
LMN
O
4 Min >= 7
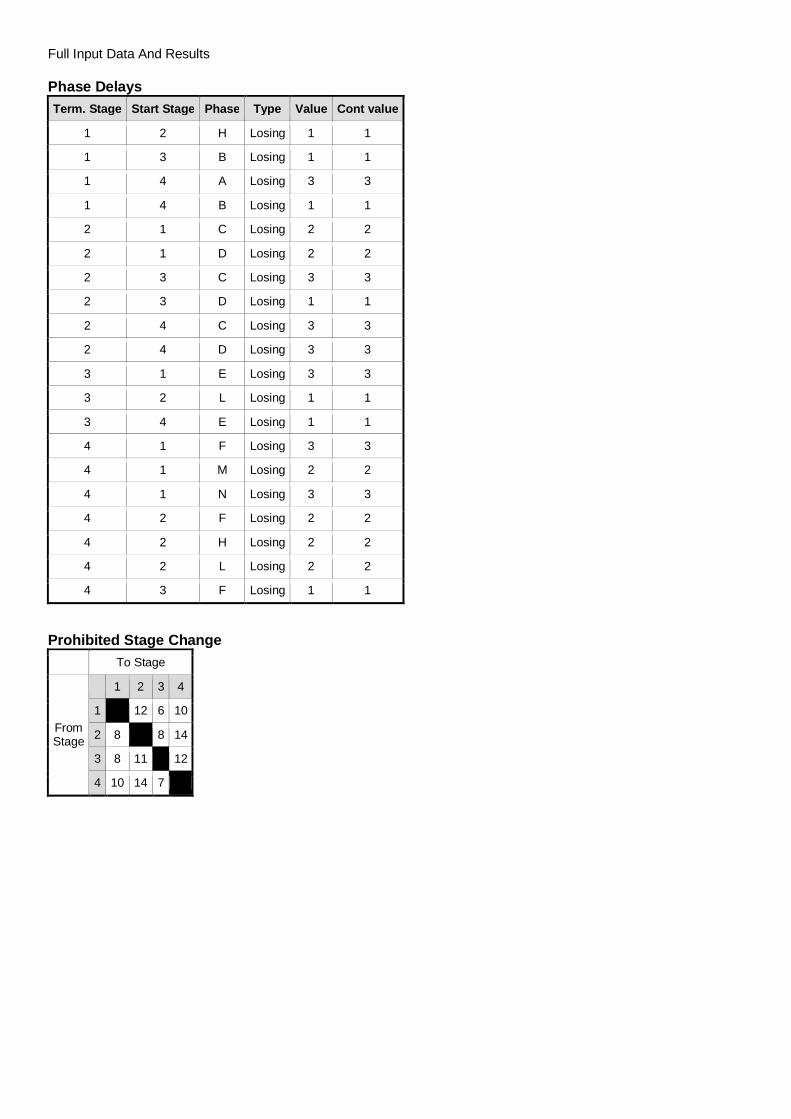
Full Input Data And Results
Phase DelaysTerm. Stage Start Stage Phase Type Value Cont value
1 2 H Losing 1 1
1 3 B Losing 1 1
1 4 A Losing 3 3
1 4 B Losing 1 1
2 1 C Losing 2 2
2 1 D Losing 2 2
2 3 C Losing 3 3
2 3 D Losing 1 1
2 4 C Losing 3 3
2 4 D Losing 3 3
3 1 E Losing 3 3
3 2 L Losing 1 1
3 4 E Losing 1 1
4 1 F Losing 3 3
4 1 M Losing 2 2
4 1 N Losing 3 3
4 2 F Losing 2 2
4 2 H Losing 2 2
4 2 L Losing 2 2
4 3 F Losing 1 1
Prohibited Stage ChangeTo Stage
FromStage
1 2 3 4
1 12 6 10
2 8 8 14
3 8 11 12
4 10 14 7

Full Input Data And ResultsGive-Way Lane Input DataJunction: White Rock Junction
There are no Opposed Lanes in this Junction
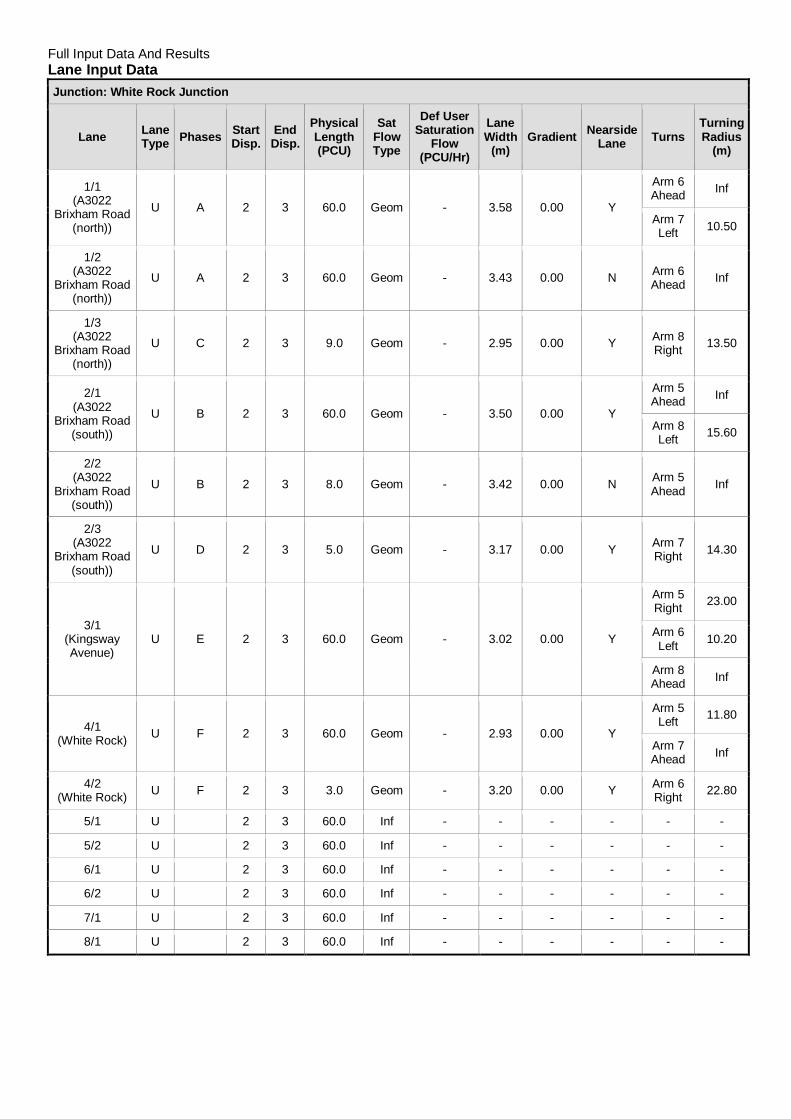
Full Input Data And ResultsLane Input DataJunction: White Rock Junction
Lane LaneType Phases Start
Disp.EndDisp.
PhysicalLength(PCU)
SatFlowType
Def UserSaturation
Flow(PCU/Hr)
LaneWidth
(m)Gradient Nearside
Lane TurnsTurningRadius
(m)
1/1(A3022
Brixham Road(north))
U A 2 3 60.0 Geom - 3.58 0.00 Y
Arm 6Ahead Inf
Arm 7Left 10.50
1/2(A3022
Brixham Road(north))
U A 2 3 60.0 Geom - 3.43 0.00 N Arm 6Ahead Inf
1/3(A3022
Brixham Road(north))
U C 2 3 9.0 Geom - 2.95 0.00 Y Arm 8Right 13.50
2/1(A3022
Brixham Road(south))
U B 2 3 60.0 Geom - 3.50 0.00 Y
Arm 5Ahead Inf
Arm 8Left 15.60
2/2(A3022
Brixham Road(south))
U B 2 3 8.0 Geom - 3.42 0.00 N Arm 5Ahead Inf
2/3(A3022
Brixham Road(south))
U D 2 3 5.0 Geom - 3.17 0.00 Y Arm 7Right 14.30
3/1(KingswayAvenue)
U E 2 3 60.0 Geom - 3.02 0.00 Y
Arm 5Right 23.00
Arm 6Left 10.20
Arm 8Ahead Inf
4/1(White Rock) U F 2 3 60.0 Geom - 2.93 0.00 Y
Arm 5Left 11.80
Arm 7Ahead Inf
4/2(White Rock) U F 2 3 3.0 Geom - 3.20 0.00 Y Arm 6
Right 22.80
5/1 U 2 3 60.0 Inf - - - - - -
5/2 U 2 3 60.0 Inf - - - - - -
6/1 U 2 3 60.0 Inf - - - - - -
6/2 U 2 3 60.0 Inf - - - - - -
7/1 U 2 3 60.0 Inf - - - - - -
8/1 U 2 3 60.0 Inf - - - - - -
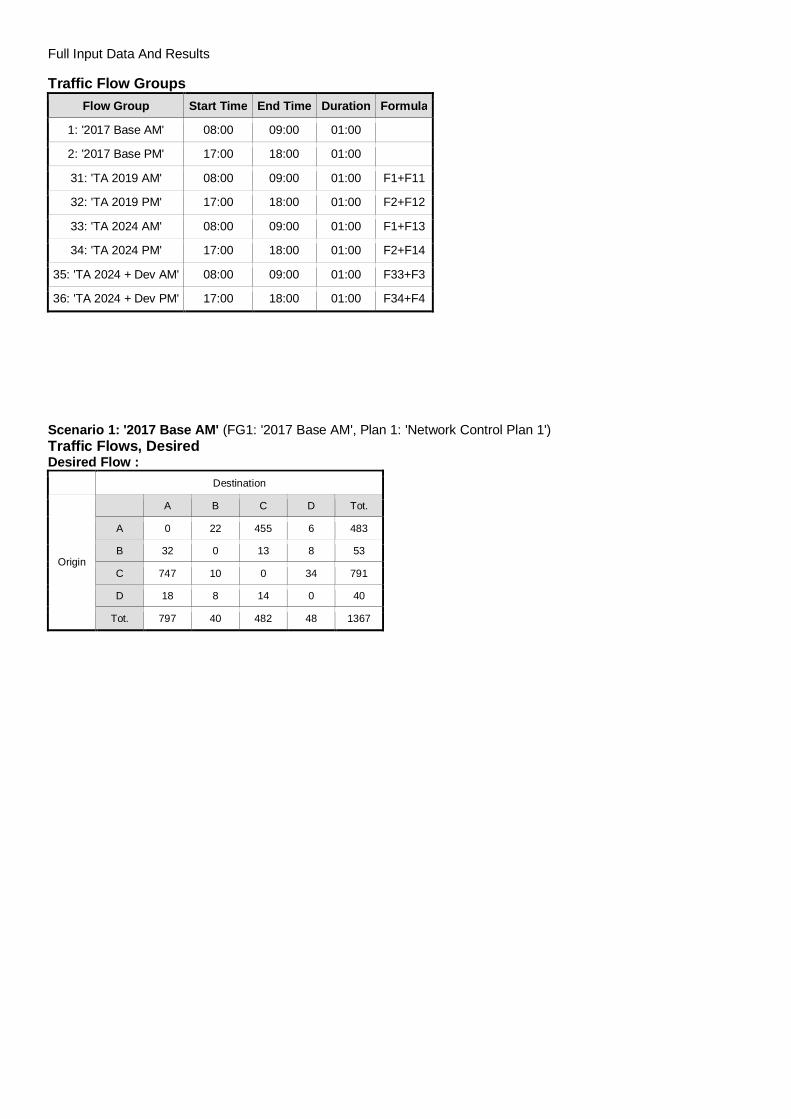
Full Input Data And Results
Traffic Flow GroupsFlow Group Start Time End Time Duration Formula
1: '2017 Base AM' 08:00 09:00 01:00
2: '2017 Base PM' 17:00 18:00 01:00
31: 'TA 2019 AM' 08:00 09:00 01:00 F1+F11
32: 'TA 2019 PM' 17:00 18:00 01:00 F2+F12
33: 'TA 2024 AM' 08:00 09:00 01:00 F1+F13
34: 'TA 2024 PM' 17:00 18:00 01:00 F2+F14
35: 'TA 2024 + Dev AM' 08:00 09:00 01:00 F33+F3
36: 'TA 2024 + Dev PM' 17:00 18:00 01:00 F34+F4
Scenario 1: '2017 Base AM' (FG1: '2017 Base AM', Plan 1: 'Network Control Plan 1')Traffic Flows, DesiredDesired Flow :
Destination
Origin
A B C D Tot.
A 0 22 455 6 483
B 32 0 13 8 53
C 747 10 0 34 791
D 18 8 14 0 40
Tot. 797 40 482 48 1367

Full Input Data And Results
Traffic Lane Flows
Lane Scenario 1:2017 Base AM
Junction: White Rock Junction
1/1 222
1/2 255
1/3 6
2/1 376
2/2(with short)
415(In)405(Out)
2/3(short) 10
3/1 53
4/1 26
4/2 14
5/1 398
5/2 399
6/1 247
6/2 235
7/1 40
8/1 48

Full Input Data And Results
Lane Saturation FlowsJunction: White Rock Junction
LaneLaneWidth
(m)Gradient Nearside
LaneAllowedTurns
TurningRadius
(m)Turning
Prop.Sat Flow(PCU/Hr)
Flared Sat Flow(PCU/Hr)
1/1(A3022 Brixham Road (north)) 3.58 0.00 Y
Arm 6 Ahead Inf 90.1 %1945 1945
Arm 7 Left 10.50 9.9 %
1/2(A3022 Brixham Road (north)) 3.43 0.00 N Arm 6 Ahead Inf 100.0 % 2098 2098
1/3(A3022 Brixham Road (north)) 2.95 0.00 Y Arm 8 Right 13.50 100.0 % 1719 1719
2/1(A3022 Brixham Road (south)) 3.50 0.00 Y
Arm 5 Ahead Inf 91.0 %1948 1948
Arm 8 Left 15.60 9.0 %
2/2(A3022 Brixham Road (south)) 3.42 0.00 N Arm 5 Ahead Inf 100.0 % 2097 2097
2/3(A3022 Brixham Road (south)) 3.17 0.00 Y Arm 7 Right 14.30 100.0 % 1749 1749
3/1(Kingsway Avenue) 3.02 0.00 Y
Arm 5 Right 23.00 60.4 %
1783 1783Arm 6 Left 10.20 24.5 %
Arm 8 Ahead Inf 15.1 %
4/1(White Rock) 2.93 0.00 Y
Arm 5 Left 11.80 69.2 %1754 1754
Arm 7 Ahead Inf 30.8 %
4/2(White Rock) 3.20 0.00 Y Arm 6 Right 22.80 100.0 % 1816 1816
5/1 Infinite Saturation Flow Inf Inf
5/2 Infinite Saturation Flow Inf Inf
6/1 Infinite Saturation Flow Inf Inf
6/2 Infinite Saturation Flow Inf Inf
7/1 Infinite Saturation Flow Inf Inf
8/1 Infinite Saturation Flow Inf Inf
Scenario 2: '2017 Base PM' (FG2: '2017 Base PM', Plan 1: 'Network Control Plan 1')Traffic Flows, DesiredDesired Flow :
Destination
Origin
A B C D Tot.
A 0 26 778 15 819
B 11 0 5 9 25
C 658 6 0 19 683
D 12 12 14 0 38
Tot. 681 44 797 43 1565

Full Input Data And Results
Traffic Lane Flows
Lane Scenario 2:2017 Base PM
Junction: White Rock Junction
1/1 382
1/2 422
1/3 15
2/1 325
2/2(with short)
358(In)352(Out)
2/3(short) 6
3/1 25
4/1 24
4/2 14
5/1 341
5/2 340
6/1 401
6/2 396
7/1 44
8/1 43
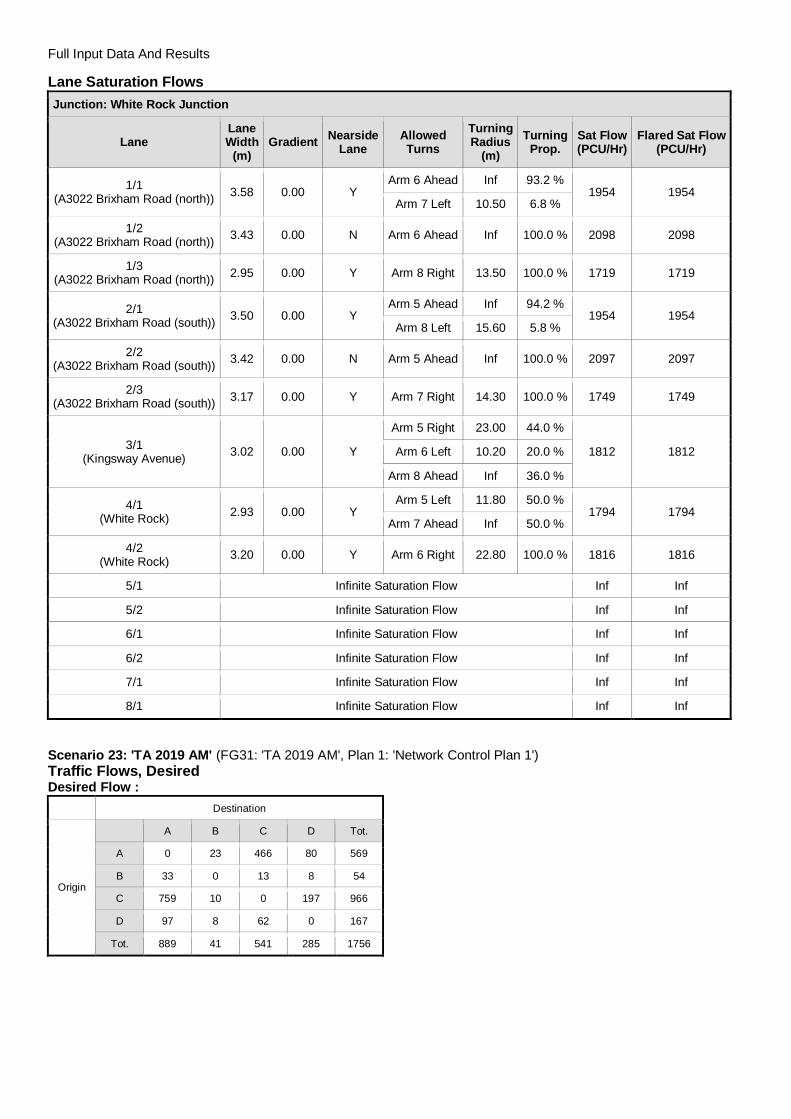
Full Input Data And Results
Lane Saturation FlowsJunction: White Rock Junction
LaneLaneWidth
(m)Gradient Nearside
LaneAllowedTurns
TurningRadius
(m)Turning
Prop.Sat Flow(PCU/Hr)
Flared Sat Flow(PCU/Hr)
1/1(A3022 Brixham Road (north)) 3.58 0.00 Y
Arm 6 Ahead Inf 93.2 %1954 1954
Arm 7 Left 10.50 6.8 %
1/2(A3022 Brixham Road (north)) 3.43 0.00 N Arm 6 Ahead Inf 100.0 % 2098 2098
1/3(A3022 Brixham Road (north)) 2.95 0.00 Y Arm 8 Right 13.50 100.0 % 1719 1719
2/1(A3022 Brixham Road (south)) 3.50 0.00 Y
Arm 5 Ahead Inf 94.2 %1954 1954
Arm 8 Left 15.60 5.8 %
2/2(A3022 Brixham Road (south)) 3.42 0.00 N Arm 5 Ahead Inf 100.0 % 2097 2097
2/3(A3022 Brixham Road (south)) 3.17 0.00 Y Arm 7 Right 14.30 100.0 % 1749 1749
3/1(Kingsway Avenue) 3.02 0.00 Y
Arm 5 Right 23.00 44.0 %
1812 1812Arm 6 Left 10.20 20.0 %
Arm 8 Ahead Inf 36.0 %
4/1(White Rock) 2.93 0.00 Y
Arm 5 Left 11.80 50.0 %1794 1794
Arm 7 Ahead Inf 50.0 %
4/2(White Rock) 3.20 0.00 Y Arm 6 Right 22.80 100.0 % 1816 1816
5/1 Infinite Saturation Flow Inf Inf
5/2 Infinite Saturation Flow Inf Inf
6/1 Infinite Saturation Flow Inf Inf
6/2 Infinite Saturation Flow Inf Inf
7/1 Infinite Saturation Flow Inf Inf
8/1 Infinite Saturation Flow Inf Inf
Scenario 23: 'TA 2019 AM' (FG31: 'TA 2019 AM', Plan 1: 'Network Control Plan 1')Traffic Flows, DesiredDesired Flow :
Destination
Origin
A B C D Tot.
A 0 23 466 80 569
B 33 0 13 8 54
C 759 10 0 197 966
D 97 8 62 0 167
Tot. 889 41 541 285 1756
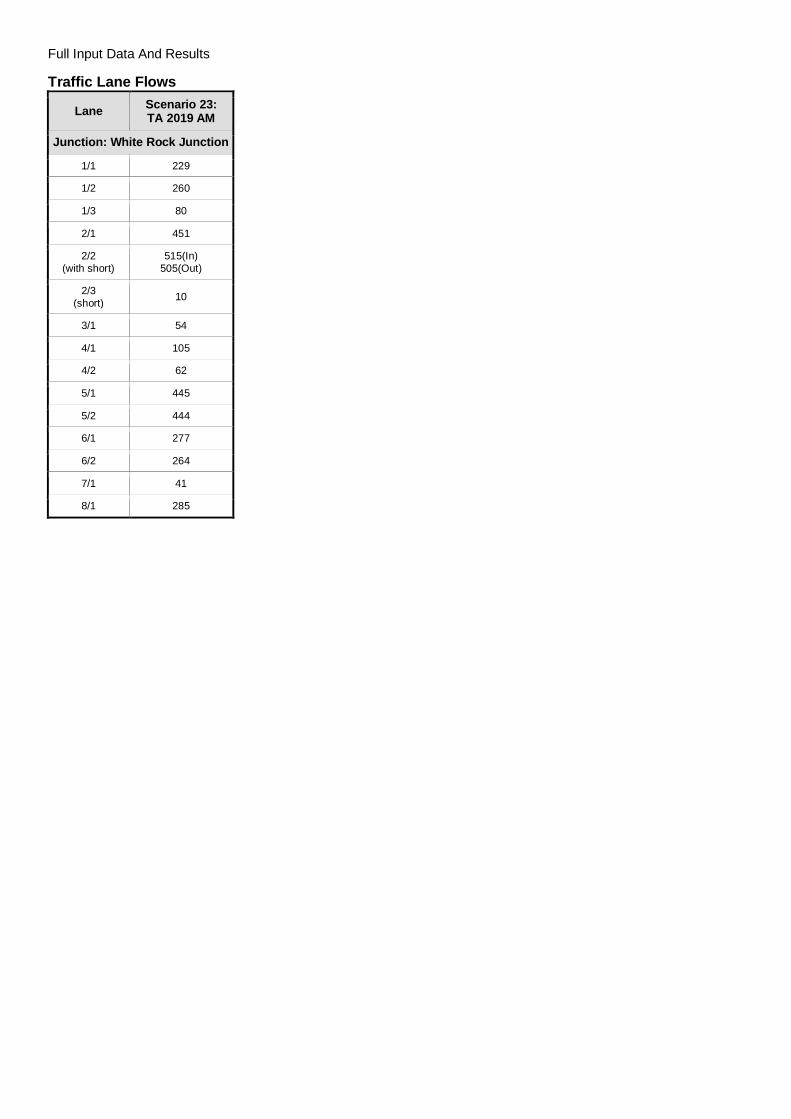
Full Input Data And Results
Traffic Lane Flows
Lane Scenario 23:TA 2019 AM
Junction: White Rock Junction
1/1 229
1/2 260
1/3 80
2/1 451
2/2(with short)
515(In)505(Out)
2/3(short) 10
3/1 54
4/1 105
4/2 62
5/1 445
5/2 444
6/1 277
6/2 264
7/1 41
8/1 285
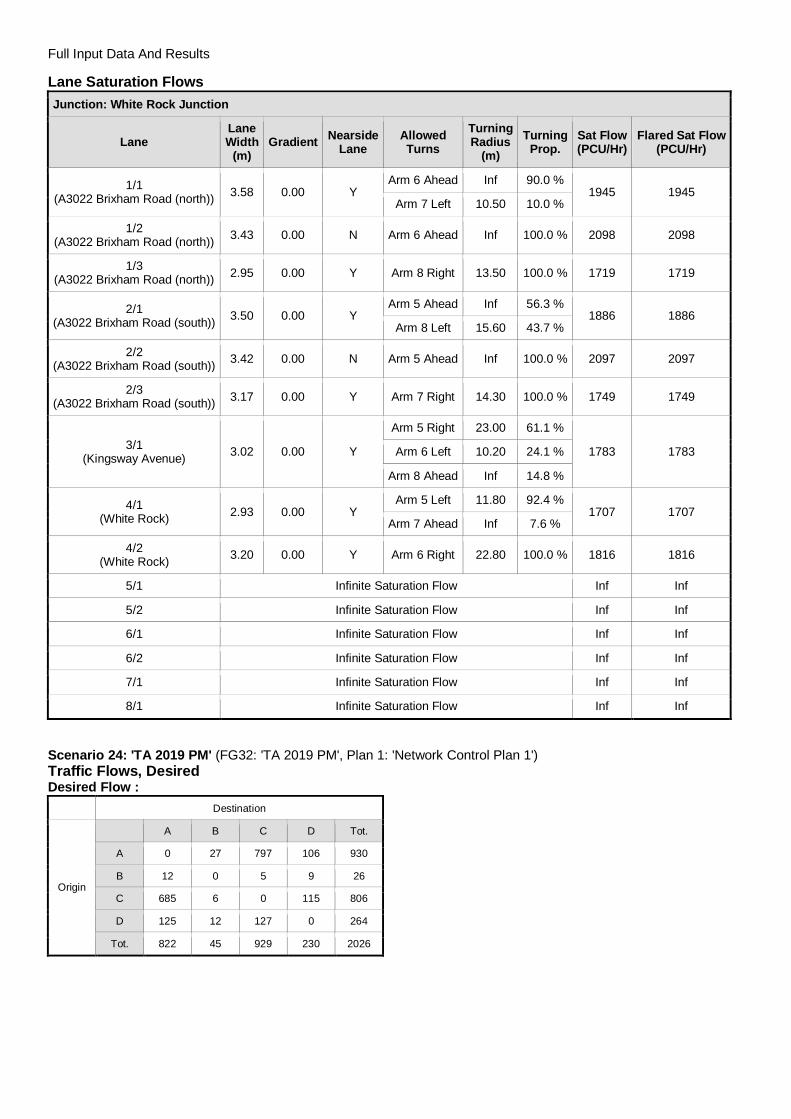
Full Input Data And Results
Lane Saturation FlowsJunction: White Rock Junction
LaneLaneWidth
(m)Gradient Nearside
LaneAllowedTurns
TurningRadius
(m)Turning
Prop.Sat Flow(PCU/Hr)
Flared Sat Flow(PCU/Hr)
1/1(A3022 Brixham Road (north)) 3.58 0.00 Y
Arm 6 Ahead Inf 90.0 %1945 1945
Arm 7 Left 10.50 10.0 %
1/2(A3022 Brixham Road (north)) 3.43 0.00 N Arm 6 Ahead Inf 100.0 % 2098 2098
1/3(A3022 Brixham Road (north)) 2.95 0.00 Y Arm 8 Right 13.50 100.0 % 1719 1719
2/1(A3022 Brixham Road (south)) 3.50 0.00 Y
Arm 5 Ahead Inf 56.3 %1886 1886
Arm 8 Left 15.60 43.7 %
2/2(A3022 Brixham Road (south)) 3.42 0.00 N Arm 5 Ahead Inf 100.0 % 2097 2097
2/3(A3022 Brixham Road (south)) 3.17 0.00 Y Arm 7 Right 14.30 100.0 % 1749 1749
3/1(Kingsway Avenue) 3.02 0.00 Y
Arm 5 Right 23.00 61.1 %
1783 1783Arm 6 Left 10.20 24.1 %
Arm 8 Ahead Inf 14.8 %
4/1(White Rock) 2.93 0.00 Y
Arm 5 Left 11.80 92.4 %1707 1707
Arm 7 Ahead Inf 7.6 %
4/2(White Rock) 3.20 0.00 Y Arm 6 Right 22.80 100.0 % 1816 1816
5/1 Infinite Saturation Flow Inf Inf
5/2 Infinite Saturation Flow Inf Inf
6/1 Infinite Saturation Flow Inf Inf
6/2 Infinite Saturation Flow Inf Inf
7/1 Infinite Saturation Flow Inf Inf
8/1 Infinite Saturation Flow Inf Inf
Scenario 24: 'TA 2019 PM' (FG32: 'TA 2019 PM', Plan 1: 'Network Control Plan 1')Traffic Flows, DesiredDesired Flow :
Destination
Origin
A B C D Tot.
A 0 27 797 106 930
B 12 0 5 9 26
C 685 6 0 115 806
D 125 12 127 0 264
Tot. 822 45 929 230 2026

Full Input Data And Results
Traffic Lane Flows
Lane Scenario 24:TA 2019 PM
Junction: White Rock Junction
1/1 391
1/2 433
1/3 106
2/1 379
2/2(with short)
427(In)421(Out)
2/3(short) 6
3/1 26
4/1 137
4/2 127
5/1 411
5/2 411
6/1 467
6/2 462
7/1 45
8/1 230

Full Input Data And Results
Lane Saturation FlowsJunction: White Rock Junction
LaneLaneWidth
(m)Gradient Nearside
LaneAllowedTurns
TurningRadius
(m)Turning
Prop.Sat Flow(PCU/Hr)
Flared Sat Flow(PCU/Hr)
1/1(A3022 Brixham Road (north)) 3.58 0.00 Y
Arm 6 Ahead Inf 93.1 %1954 1954
Arm 7 Left 10.50 6.9 %
1/2(A3022 Brixham Road (north)) 3.43 0.00 N Arm 6 Ahead Inf 100.0 % 2098 2098
1/3(A3022 Brixham Road (north)) 2.95 0.00 Y Arm 8 Right 13.50 100.0 % 1719 1719
2/1(A3022 Brixham Road (south)) 3.50 0.00 Y
Arm 5 Ahead Inf 69.7 %1909 1909
Arm 8 Left 15.60 30.3 %
2/2(A3022 Brixham Road (south)) 3.42 0.00 N Arm 5 Ahead Inf 100.0 % 2097 2097
2/3(A3022 Brixham Road (south)) 3.17 0.00 Y Arm 7 Right 14.30 100.0 % 1749 1749
3/1(Kingsway Avenue) 3.02 0.00 Y
Arm 5 Right 23.00 46.2 %
1811 1811Arm 6 Left 10.20 19.2 %
Arm 8 Ahead Inf 34.6 %
4/1(White Rock) 2.93 0.00 Y
Arm 5 Left 11.80 91.2 %1710 1710
Arm 7 Ahead Inf 8.8 %
4/2(White Rock) 3.20 0.00 Y Arm 6 Right 22.80 100.0 % 1816 1816
5/1 Infinite Saturation Flow Inf Inf
5/2 Infinite Saturation Flow Inf Inf
6/1 Infinite Saturation Flow Inf Inf
6/2 Infinite Saturation Flow Inf Inf
7/1 Infinite Saturation Flow Inf Inf
8/1 Infinite Saturation Flow Inf Inf
Scenario 25: 'TA 2024 AM' (FG33: 'TA 2024 AM', Plan 1: 'Network Control Plan 1')Traffic Flows, DesiredDesired Flow :
Destination
Origin
A B C D Tot.
A 0 23 490 80 593
B 33 0 13 8 54
C 780 10 0 216 1006
D 97 8 68 0 173
Tot. 910 41 571 304 1826

Full Input Data And Results
Traffic Lane Flows
Lane Scenario 25:TA 2024 AM
Junction: White Rock Junction
1/1 239
1/2 274
1/3 80
2/1 470
2/2(with short)
536(In)526(Out)
2/3(short) 10
3/1 54
4/1 105
4/2 68
5/1 456
5/2 454
6/1 292
6/2 279
7/1 41
8/1 304

Full Input Data And Results
Lane Saturation FlowsJunction: White Rock Junction
LaneLaneWidth
(m)Gradient Nearside
LaneAllowedTurns
TurningRadius
(m)Turning
Prop.Sat Flow(PCU/Hr)
Flared Sat Flow(PCU/Hr)
1/1(A3022 Brixham Road (north)) 3.58 0.00 Y
Arm 6 Ahead Inf 90.4 %1946 1946
Arm 7 Left 10.50 9.6 %
1/2(A3022 Brixham Road (north)) 3.43 0.00 N Arm 6 Ahead Inf 100.0 % 2098 2098
1/3(A3022 Brixham Road (north)) 2.95 0.00 Y Arm 8 Right 13.50 100.0 % 1719 1719
2/1(A3022 Brixham Road (south)) 3.50 0.00 Y
Arm 5 Ahead Inf 54.0 %1882 1882
Arm 8 Left 15.60 46.0 %
2/2(A3022 Brixham Road (south)) 3.42 0.00 N Arm 5 Ahead Inf 100.0 % 2097 2097
2/3(A3022 Brixham Road (south)) 3.17 0.00 Y Arm 7 Right 14.30 100.0 % 1749 1749
3/1(Kingsway Avenue) 3.02 0.00 Y
Arm 5 Right 23.00 61.1 %
1783 1783Arm 6 Left 10.20 24.1 %
Arm 8 Ahead Inf 14.8 %
4/1(White Rock) 2.93 0.00 Y
Arm 5 Left 11.80 92.4 %1707 1707
Arm 7 Ahead Inf 7.6 %
4/2(White Rock) 3.20 0.00 Y Arm 6 Right 22.80 100.0 % 1816 1816
5/1 Infinite Saturation Flow Inf Inf
5/2 Infinite Saturation Flow Inf Inf
6/1 Infinite Saturation Flow Inf Inf
6/2 Infinite Saturation Flow Inf Inf
7/1 Infinite Saturation Flow Inf Inf
8/1 Infinite Saturation Flow Inf Inf
Scenario 26: 'TA 2024 PM' (FG34: 'TA 2024 PM', Plan 1: 'Network Control Plan 1')Traffic Flows, DesiredDesired Flow :
Destination
Origin
A B C D Tot.
A 0 28 820 106 954
B 12 0 6 9 27
C 723 6 0 135 864
D 125 12 145 0 282
Tot. 860 46 971 250 2127

Full Input Data And Results
Traffic Lane Flows
Lane Scenario 26:TA 2024 PM
Junction: White Rock Junction
1/1 402
1/2 446
1/3 106
2/1 407
2/2(with short)
457(In)451(Out)
2/3(short) 6
3/1 27
4/1 137
4/2 145
5/1 431
5/2 429
6/1 489
6/2 482
7/1 46
8/1 250

Full Input Data And Results
Lane Saturation FlowsJunction: White Rock Junction
LaneLaneWidth
(m)Gradient Nearside
LaneAllowedTurns
TurningRadius
(m)Turning
Prop.Sat Flow(PCU/Hr)
Flared Sat Flow(PCU/Hr)
1/1(A3022 Brixham Road (north)) 3.58 0.00 Y
Arm 6 Ahead Inf 93.0 %1954 1954
Arm 7 Left 10.50 7.0 %
1/2(A3022 Brixham Road (north)) 3.43 0.00 N Arm 6 Ahead Inf 100.0 % 2098 2098
1/3(A3022 Brixham Road (north)) 2.95 0.00 Y Arm 8 Right 13.50 100.0 % 1719 1719
2/1(A3022 Brixham Road (south)) 3.50 0.00 Y
Arm 5 Ahead Inf 66.8 %1904 1904
Arm 8 Left 15.60 33.2 %
2/2(A3022 Brixham Road (south)) 3.42 0.00 N Arm 5 Ahead Inf 100.0 % 2097 2097
2/3(A3022 Brixham Road (south)) 3.17 0.00 Y Arm 7 Right 14.30 100.0 % 1749 1749
3/1(Kingsway Avenue) 3.02 0.00 Y
Arm 5 Right 23.00 44.4 %
1806 1806Arm 6 Left 10.20 22.2 %
Arm 8 Ahead Inf 33.3 %
4/1(White Rock) 2.93 0.00 Y
Arm 5 Left 11.80 91.2 %1710 1710
Arm 7 Ahead Inf 8.8 %
4/2(White Rock) 3.20 0.00 Y Arm 6 Right 22.80 100.0 % 1816 1816
5/1 Infinite Saturation Flow Inf Inf
5/2 Infinite Saturation Flow Inf Inf
6/1 Infinite Saturation Flow Inf Inf
6/2 Infinite Saturation Flow Inf Inf
7/1 Infinite Saturation Flow Inf Inf
8/1 Infinite Saturation Flow Inf Inf
Scenario 27: 'TA 2024 + Dev AM' (FG35: 'TA 2024 + Dev AM', Plan 1: 'Network Control Plan 1')Traffic Flows, DesiredDesired Flow :
Destination
Origin
A B C D Tot.
A 0 23 539 80 642
B 33 0 13 8 54
C 873 10 0 226 1109
D 97 8 82 0 187
Tot. 1003 41 634 314 1992
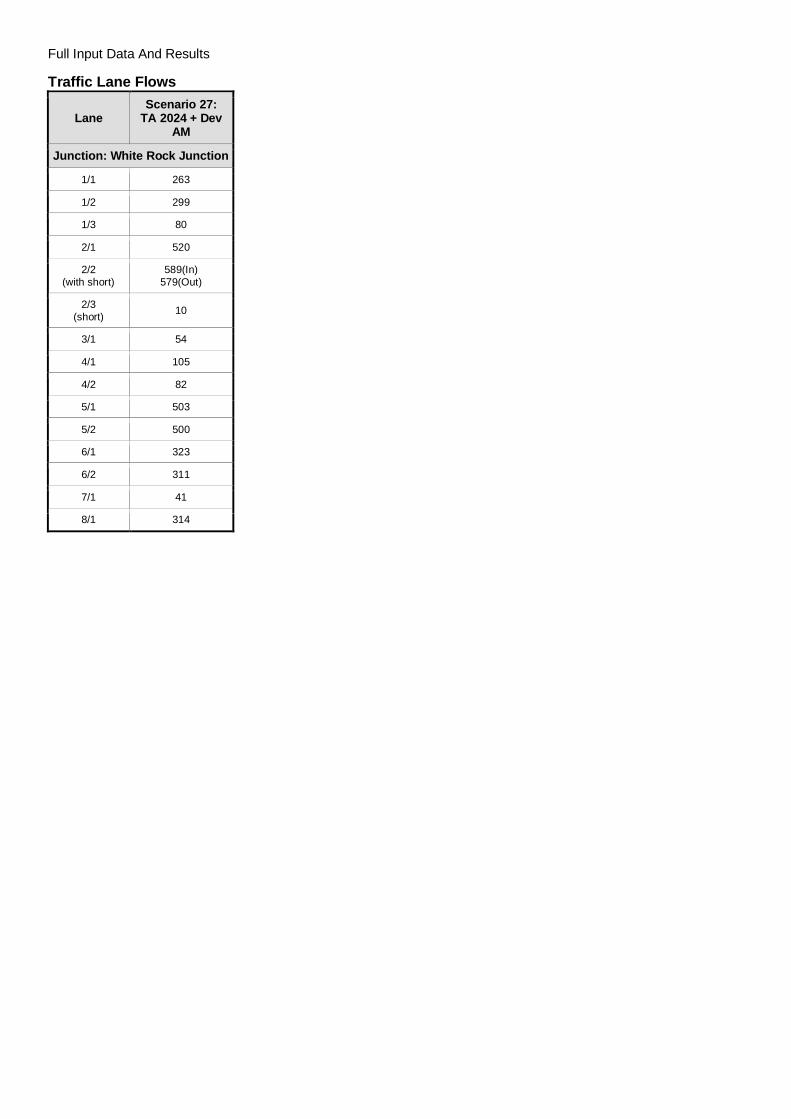
Full Input Data And Results
Traffic Lane Flows
LaneScenario 27:
TA 2024 + DevAM
Junction: White Rock Junction
1/1 263
1/2 299
1/3 80
2/1 520
2/2(with short)
589(In)579(Out)
2/3(short) 10
3/1 54
4/1 105
4/2 82
5/1 503
5/2 500
6/1 323
6/2 311
7/1 41
8/1 314
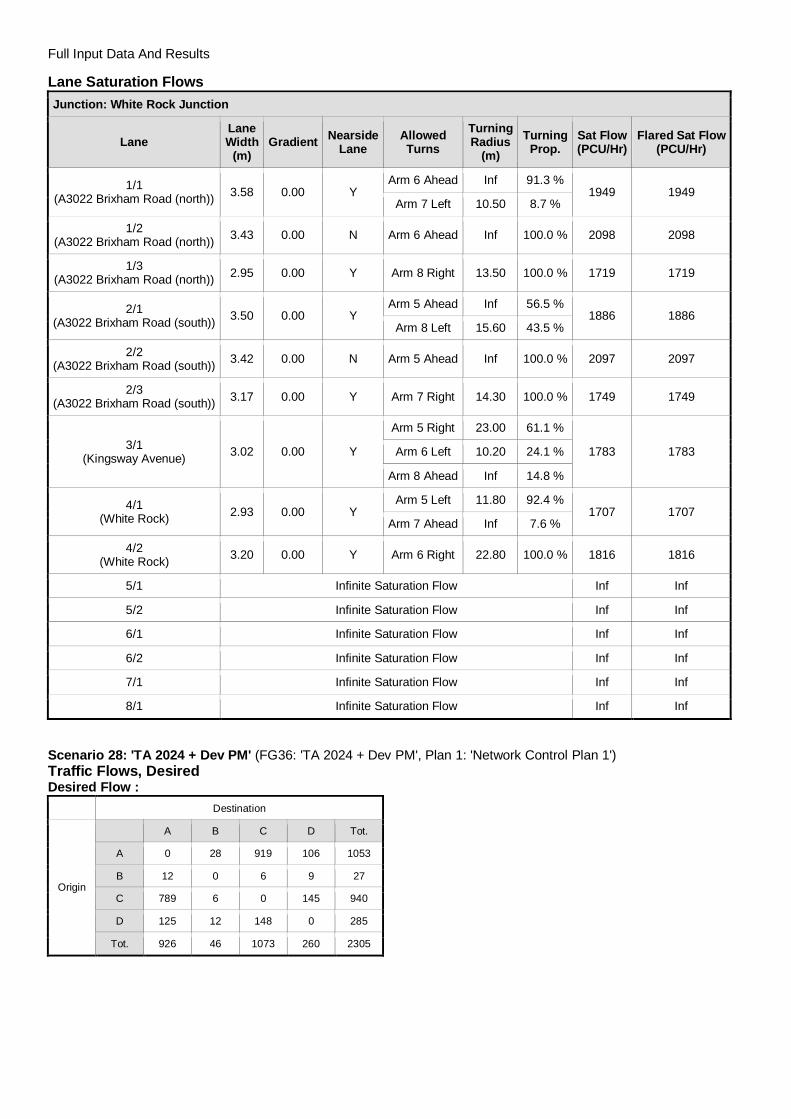
Full Input Data And Results
Lane Saturation FlowsJunction: White Rock Junction
LaneLaneWidth
(m)Gradient Nearside
LaneAllowedTurns
TurningRadius
(m)Turning
Prop.Sat Flow(PCU/Hr)
Flared Sat Flow(PCU/Hr)
1/1(A3022 Brixham Road (north)) 3.58 0.00 Y
Arm 6 Ahead Inf 91.3 %1949 1949
Arm 7 Left 10.50 8.7 %
1/2(A3022 Brixham Road (north)) 3.43 0.00 N Arm 6 Ahead Inf 100.0 % 2098 2098
1/3(A3022 Brixham Road (north)) 2.95 0.00 Y Arm 8 Right 13.50 100.0 % 1719 1719
2/1(A3022 Brixham Road (south)) 3.50 0.00 Y
Arm 5 Ahead Inf 56.5 %1886 1886
Arm 8 Left 15.60 43.5 %
2/2(A3022 Brixham Road (south)) 3.42 0.00 N Arm 5 Ahead Inf 100.0 % 2097 2097
2/3(A3022 Brixham Road (south)) 3.17 0.00 Y Arm 7 Right 14.30 100.0 % 1749 1749
3/1(Kingsway Avenue) 3.02 0.00 Y
Arm 5 Right 23.00 61.1 %
1783 1783Arm 6 Left 10.20 24.1 %
Arm 8 Ahead Inf 14.8 %
4/1(White Rock) 2.93 0.00 Y
Arm 5 Left 11.80 92.4 %1707 1707
Arm 7 Ahead Inf 7.6 %
4/2(White Rock) 3.20 0.00 Y Arm 6 Right 22.80 100.0 % 1816 1816
5/1 Infinite Saturation Flow Inf Inf
5/2 Infinite Saturation Flow Inf Inf
6/1 Infinite Saturation Flow Inf Inf
6/2 Infinite Saturation Flow Inf Inf
7/1 Infinite Saturation Flow Inf Inf
8/1 Infinite Saturation Flow Inf Inf
Scenario 28: 'TA 2024 + Dev PM' (FG36: 'TA 2024 + Dev PM', Plan 1: 'Network Control Plan 1')Traffic Flows, DesiredDesired Flow :
Destination
Origin
A B C D Tot.
A 0 28 919 106 1053
B 12 0 6 9 27
C 789 6 0 145 940
D 125 12 148 0 285
Tot. 926 46 1073 260 2305
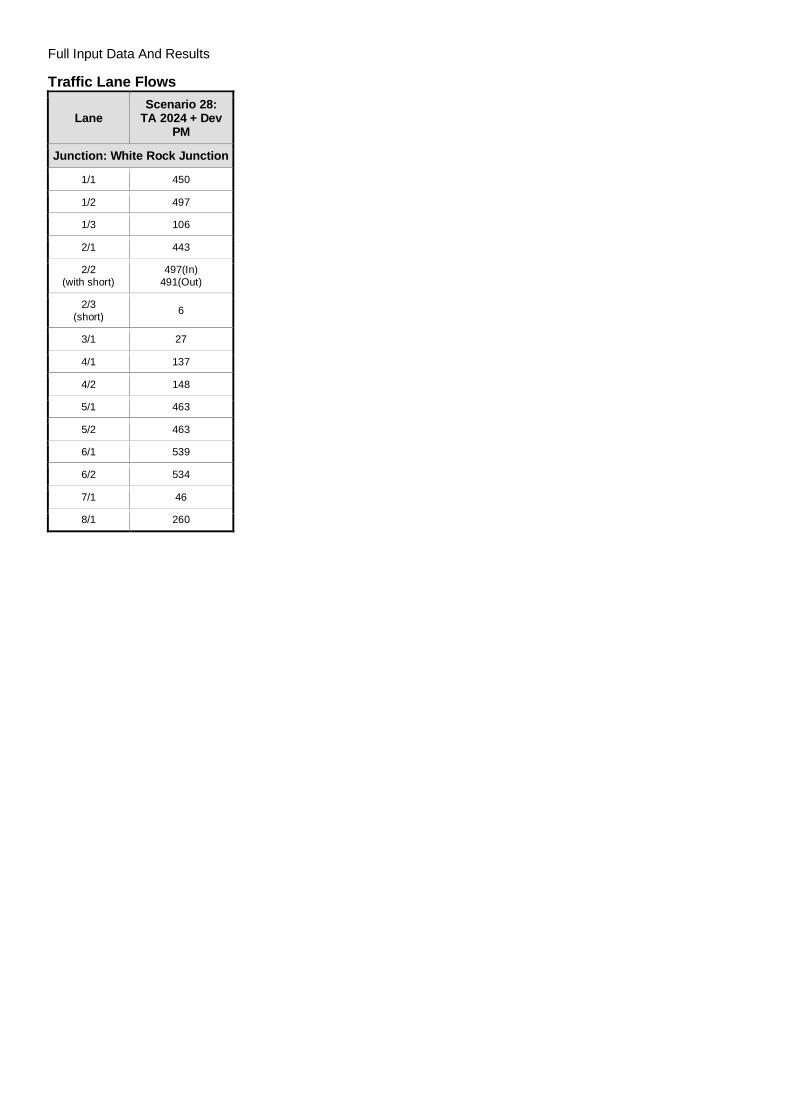
Full Input Data And Results
Traffic Lane Flows
LaneScenario 28:
TA 2024 + DevPM
Junction: White Rock Junction
1/1 450
1/2 497
1/3 106
2/1 443
2/2(with short)
497(In)491(Out)
2/3(short) 6
3/1 27
4/1 137
4/2 148
5/1 463
5/2 463
6/1 539
6/2 534
7/1 46
8/1 260
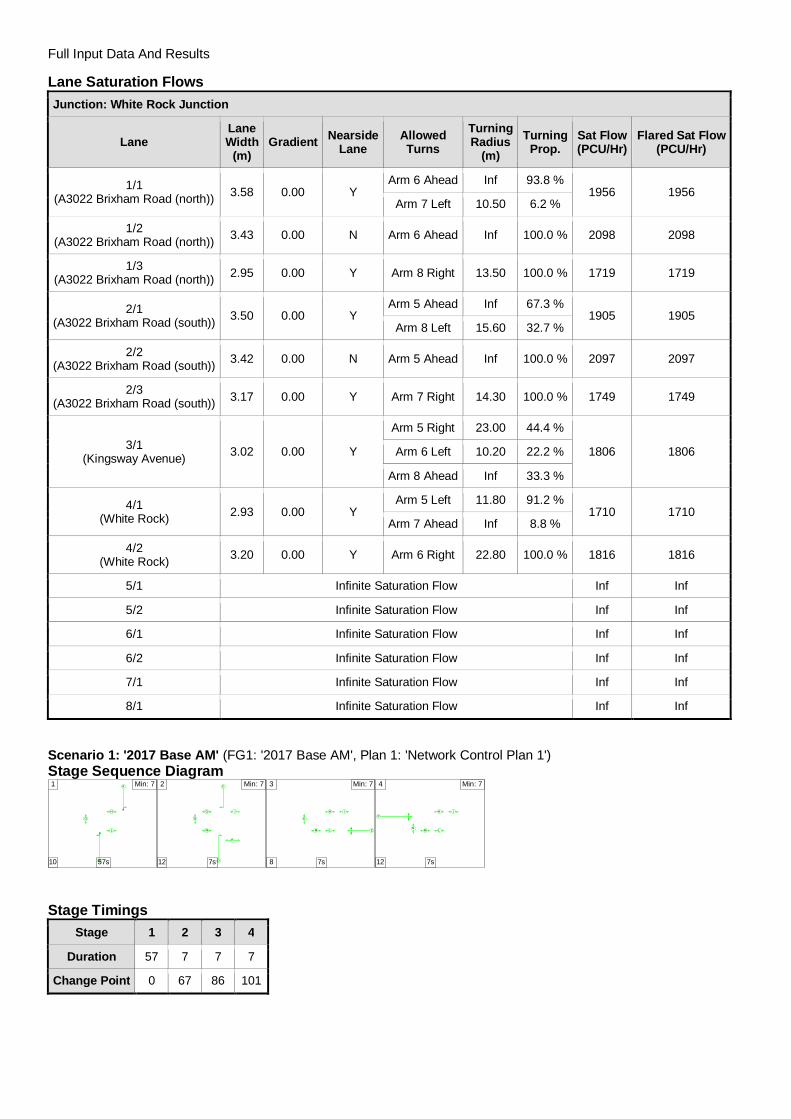
Full Input Data And Results
Lane Saturation FlowsJunction: White Rock Junction
LaneLaneWidth
(m)Gradient Nearside
LaneAllowedTurns
TurningRadius
(m)Turning
Prop.Sat Flow(PCU/Hr)
Flared Sat Flow(PCU/Hr)
1/1(A3022 Brixham Road (north)) 3.58 0.00 Y
Arm 6 Ahead Inf 93.8 %1956 1956
Arm 7 Left 10.50 6.2 %
1/2(A3022 Brixham Road (north)) 3.43 0.00 N Arm 6 Ahead Inf 100.0 % 2098 2098
1/3(A3022 Brixham Road (north)) 2.95 0.00 Y Arm 8 Right 13.50 100.0 % 1719 1719
2/1(A3022 Brixham Road (south)) 3.50 0.00 Y
Arm 5 Ahead Inf 67.3 %1905 1905
Arm 8 Left 15.60 32.7 %
2/2(A3022 Brixham Road (south)) 3.42 0.00 N Arm 5 Ahead Inf 100.0 % 2097 2097
2/3(A3022 Brixham Road (south)) 3.17 0.00 Y Arm 7 Right 14.30 100.0 % 1749 1749
3/1(Kingsway Avenue) 3.02 0.00 Y
Arm 5 Right 23.00 44.4 %
1806 1806Arm 6 Left 10.20 22.2 %
Arm 8 Ahead Inf 33.3 %
4/1(White Rock) 2.93 0.00 Y
Arm 5 Left 11.80 91.2 %1710 1710
Arm 7 Ahead Inf 8.8 %
4/2(White Rock) 3.20 0.00 Y Arm 6 Right 22.80 100.0 % 1816 1816
5/1 Infinite Saturation Flow Inf Inf
5/2 Infinite Saturation Flow Inf Inf
6/1 Infinite Saturation Flow Inf Inf
6/2 Infinite Saturation Flow Inf Inf
7/1 Infinite Saturation Flow Inf Inf
8/1 Infinite Saturation Flow Inf Inf
Scenario 1: '2017 Base AM' (FG1: '2017 Base AM', Plan 1: 'Network Control Plan 1')Stage Sequence Diagram
A
B
H
L
O
1 Min: 7
10 57s
C
D
G I
K
M
O
2 Min: 7
12 7s
E
H I
LM
O
3 Min: 7
8 7s
FH I
LMN
4 Min: 7
12 7s
Stage TimingsStage 1 2 3 4
Duration 57 7 7 7
Change Point 0 67 86 101
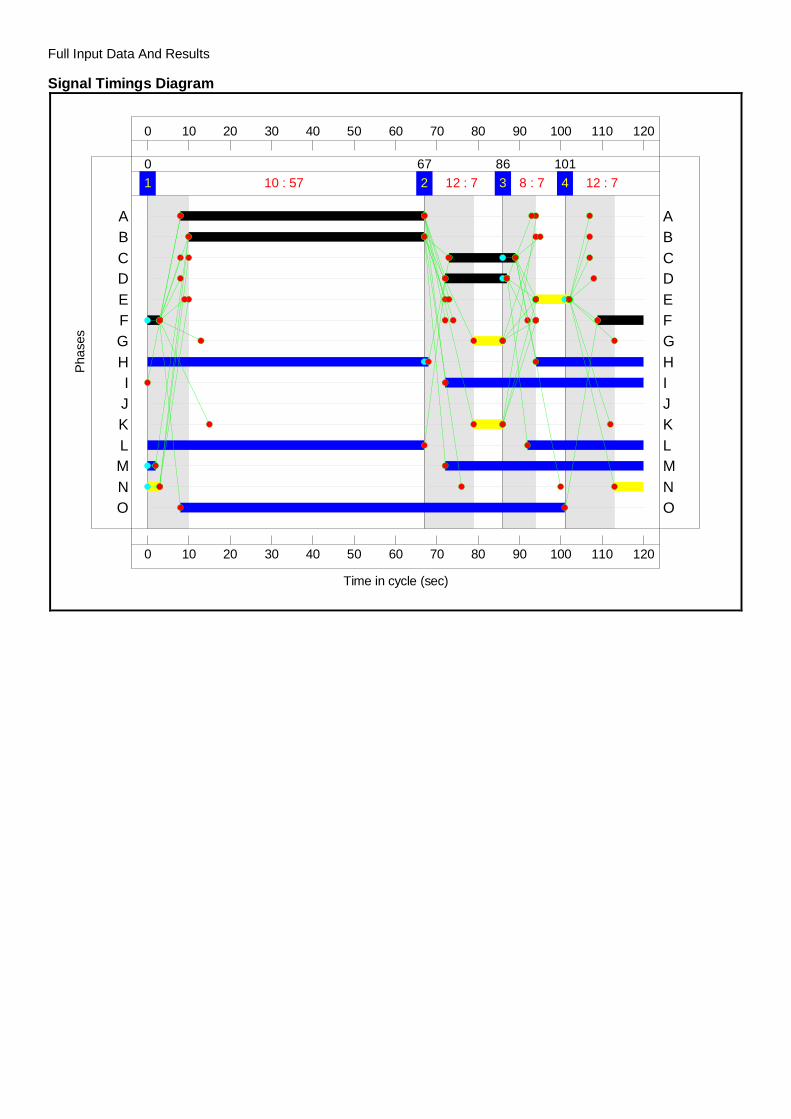
Full Input Data And Results
Signal Timings Diagram
0
0
10
10
20
20
30
30
40
40
50
50
60
60
70
70
80
80
90
90
100
100
110
110
120
120
Time in cycle (sec)
Phas
es
1 10 : 570
2 12 : 767
3 8 : 786
4 12 : 7101
O ON NM ML LK KJ JI I
H HG GF FE ED DC CB BA A
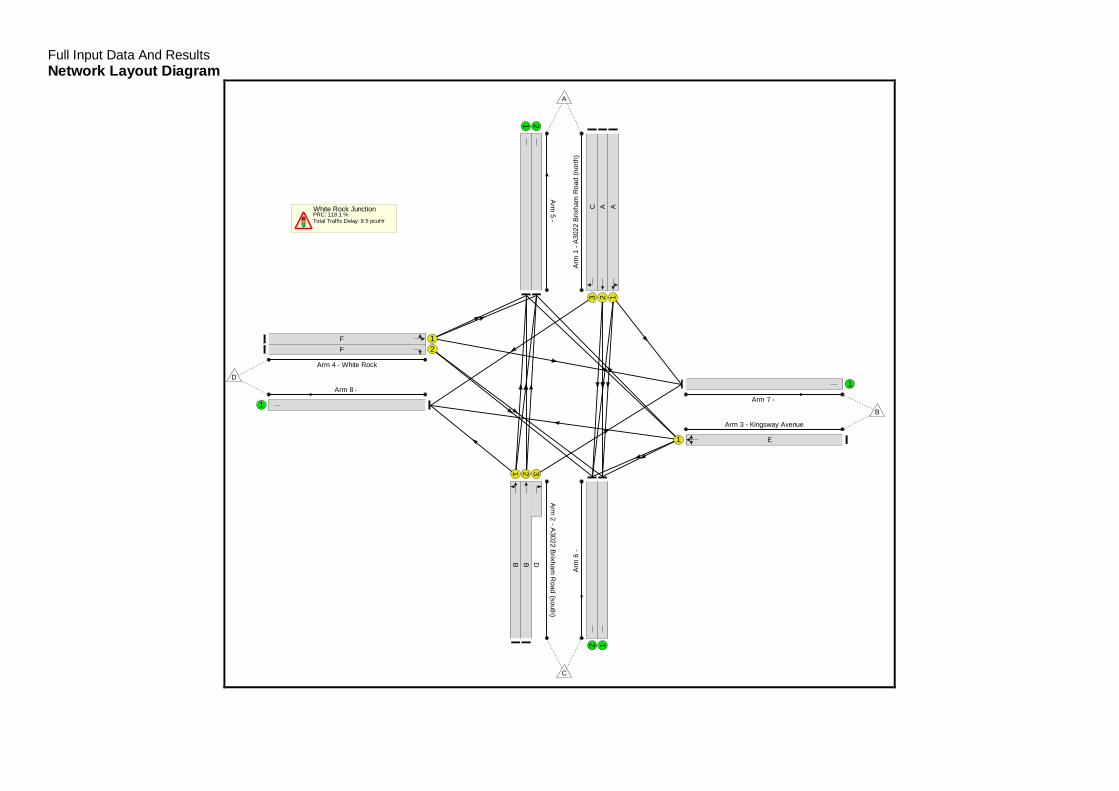
Full Input Data And ResultsNetwork Layout Diagram
White Rock JunctionPRC: 118.1 %Total Traffic Delay: 9.5 pcuHr
Arm
1-A
3022
Brix
ham
Roa
d(n
orth
)
123
AAC
Arm2
-A3022
Brixham
Road
(south)
1 2 3
B B D
Arm 3 - Kingsway Avenue
1 E
Arm 4 - White Rock
12
FF
Arm
5-
1 2A
rm6
-
12
Arm 7 -
1Arm 8 -
1
A
B
C
D
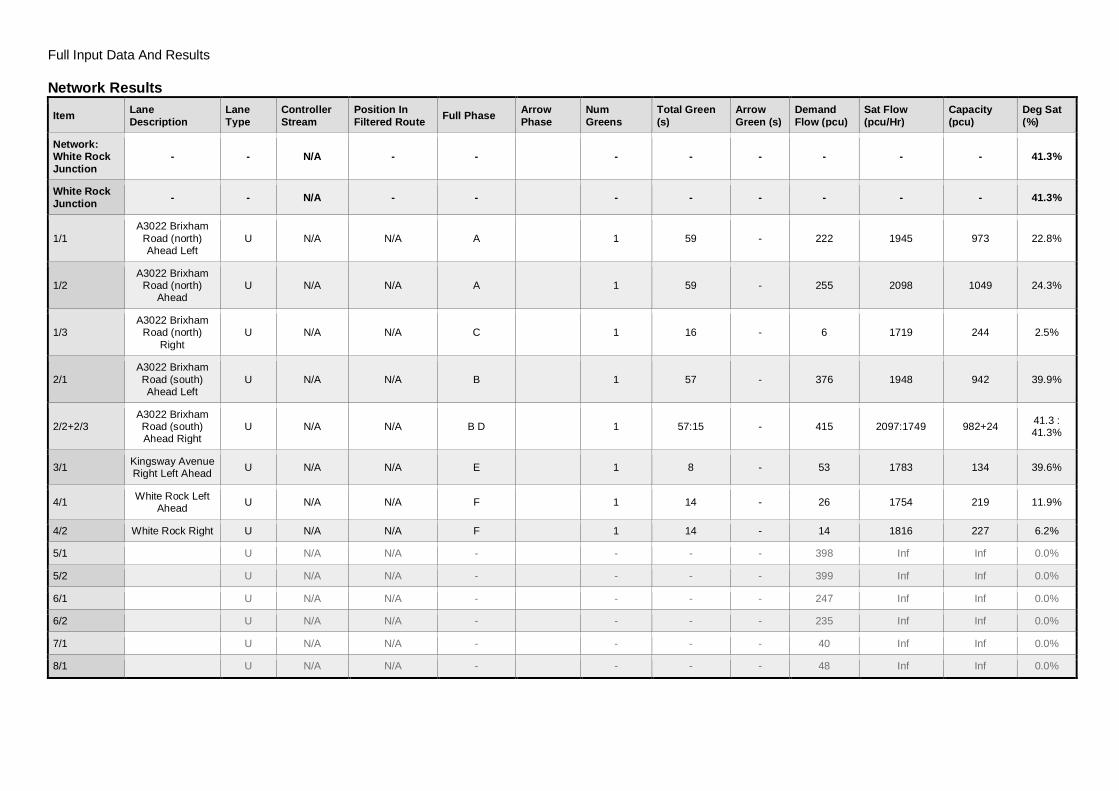
Full Input Data And Results
Network Results
Item LaneDescription
LaneType
ControllerStream
Position InFiltered Route Full Phase Arrow
PhaseNumGreens
Total Green(s)
ArrowGreen (s)
DemandFlow (pcu)
Sat Flow(pcu/Hr)
Capacity(pcu)
Deg Sat(%)
Network:White RockJunction
- - N/A - - - - - - - - 41.3%
White RockJunction - - N/A - - - - - - - - 41.3%
1/1A3022 Brixham
Road (north)Ahead Left
U N/A N/A A 1 59 - 222 1945 973 22.8%
1/2A3022 Brixham
Road (north)Ahead
U N/A N/A A 1 59 - 255 2098 1049 24.3%
1/3A3022 Brixham
Road (north)Right
U N/A N/A C 1 16 - 6 1719 244 2.5%
2/1A3022 BrixhamRoad (south)Ahead Left
U N/A N/A B 1 57 - 376 1948 942 39.9%
2/2+2/3A3022 BrixhamRoad (south)Ahead Right
U N/A N/A B D 1 57:15 - 415 2097:1749 982+24 41.3 :41.3%
3/1 Kingsway AvenueRight Left Ahead U N/A N/A E 1 8 - 53 1783 134 39.6%
4/1 White Rock LeftAhead U N/A N/A F 1 14 - 26 1754 219 11.9%
4/2 White Rock Right U N/A N/A F 1 14 - 14 1816 227 6.2%
5/1 U N/A N/A - - - - 398 Inf Inf 0.0%
5/2 U N/A N/A - - - - 399 Inf Inf 0.0%
6/1 U N/A N/A - - - - 247 Inf Inf 0.0%
6/2 U N/A N/A - - - - 235 Inf Inf 0.0%
7/1 U N/A N/A - - - - 40 Inf Inf 0.0%
8/1 U N/A N/A - - - - 48 Inf Inf 0.0%

Full Input Data And Results
Item Arriving (pcu) Leaving(pcu)
Turners InGaps (pcu)
Turners WhenUnopposed(pcu)
Turners InIntergreen(pcu)
UniformDelay(pcuHr)
Rand +OversatDelay(pcuHr)
Storage AreaUniformDelay(pcuHr)
TotalDelay(pcuHr)
Av. DelayPer PCU(s/pcu)
Max. Back ofUniformQueue (pcu)
Rand +OversatQueue (pcu)
MeanMaxQueue(pcu)
Network:White RockJunction
- - 0 0 0 8.1 1.4 0.0 9.5 - - - -
White RockJunction - - 0 0 0 8.1 1.4 0.0 9.5 - - - -
1/1 222 222 - - - 1.0 0.1 - 1.2 19.3 4.1 0.1 4.3
1/2 255 255 - - - 1.2 0.2 - 1.4 19.3 4.8 0.2 5.0
1/3 6 6 - - - 0.1 0.0 - 0.1 52.2 0.2 0.0 0.2
2/1 376 376 - - - 2.1 0.3 - 2.4 23.0 7.9 0.3 8.3
2/2+2/3 415 415 - - - 2.4 0.4 - 2.7 23.7 8.8 0.4 9.1
3/1 53 53 - - - 0.8 0.3 - 1.1 75.1 1.7 0.3 2.0
4/1 26 26 - - - 0.3 0.1 - 0.4 56.0 0.8 0.1 0.8
4/2 14 14 - - - 0.2 0.0 - 0.2 54.8 0.4 0.0 0.4
5/1 398 398 - - - 0.0 0.0 - 0.0 0.0 0.0 0.0 0.0
5/2 399 399 - - - 0.0 0.0 - 0.0 0.0 0.0 0.0 0.0
6/1 247 247 - - - 0.0 0.0 - 0.0 0.0 0.0 0.0 0.0
6/2 235 235 - - - 0.0 0.0 - 0.0 0.0 0.0 0.0 0.0
7/1 40 40 - - - 0.0 0.0 - 0.0 0.0 0.0 0.0 0.0
8/1 48 48 - - - 0.0 0.0 - 0.0 0.0 0.0 0.0 0.0
C1 PRC for Signalled Lanes (%): 118.1 Total Delay for Signalled Lanes (pcuHr): 9.50 Cycle Time (s): 120 PRC Over All Lanes (%): 118.1 Total Delay Over All Lanes(pcuHr): 9.50

Full Input Data And ResultsScenario 2: '2017 Base PM' (FG2: '2017 Base PM', Plan 1: 'Network Control Plan 1')Stage Sequence Diagram
A
B
H
L
O
1 Min: 7
10 57s
C
D
G I
K
M
O
2 Min: 7
12 7s
E
H I
LM
O
3 Min: 7
8 7s
FH I
LMN
4 Min: 7
12 7s
Stage TimingsStage 1 2 3 4
Duration 57 7 7 7
Change Point 0 67 86 101
Signal Timings Diagram
0
0
10
10
20
20
30
30
40
40
50
50
60
60
70
70
80
80
90
90
100
100
110
110
120
120
Time in cycle (sec)
Phas
es
1 10 : 570
2 12 : 767
3 8 : 786
4 12 : 7101
O ON NM ML LK KJ JI I
H HG GF FE ED DC CB BA A

Full Input Data And ResultsNetwork Layout Diagram
White Rock JunctionPRC: 123.7 %Total Traffic Delay: 10.4 pcuHr
Arm
1-A
3022
Brix
ham
Roa
d(n
orth
)
123
AAC
Arm
2-A
3022B
rixhamR
oad(south)
1 2 3
B B D
Arm 3 - Kingsway Avenue
1 E
Arm 4 - White Rock
12
FF
Ar m
5-
1 2A
rm6
-
12
Arm 7 -
1Arm 8 -
1
A
B
C
D
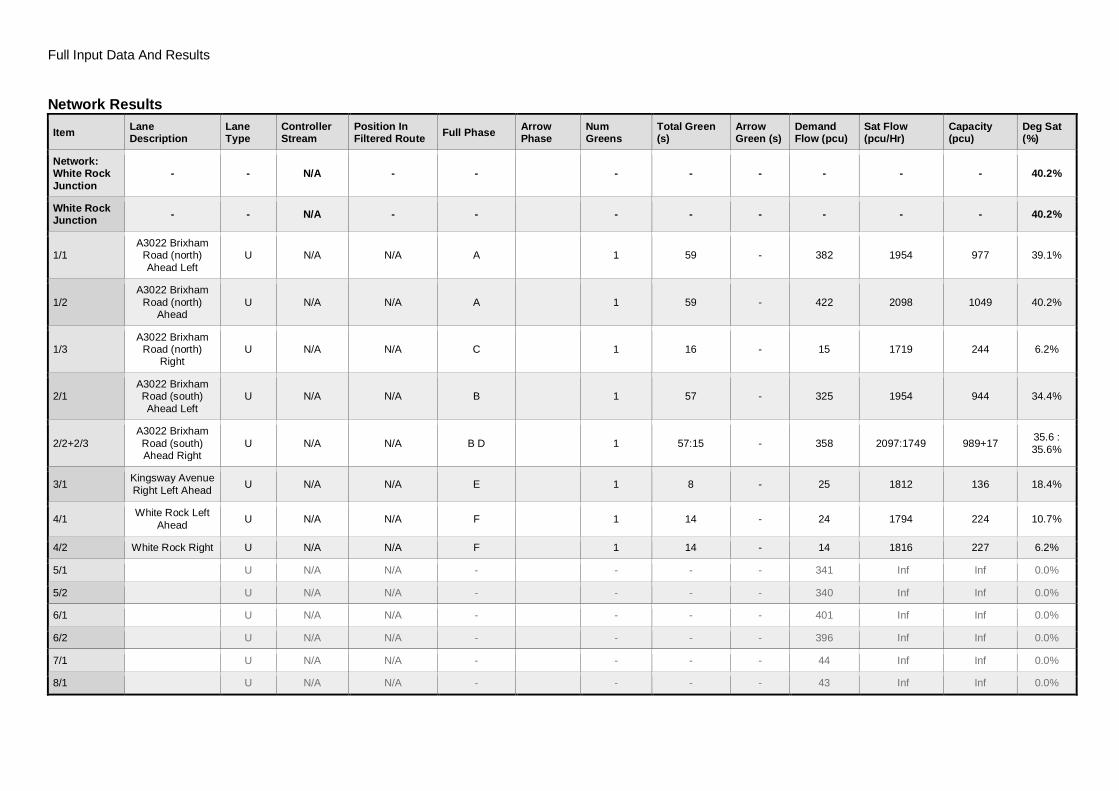
Full Input Data And Results
Network Results
Item LaneDescription
LaneType
ControllerStream
Position InFiltered Route Full Phase Arrow
PhaseNumGreens
Total Green(s)
ArrowGreen (s)
DemandFlow (pcu)
Sat Flow(pcu/Hr)
Capacity(pcu)
Deg Sat(%)
Network:White RockJunction
- - N/A - - - - - - - - 40.2%
White RockJunction - - N/A - - - - - - - - 40.2%
1/1A3022 Brixham
Road (north)Ahead Left
U N/A N/A A 1 59 - 382 1954 977 39.1%
1/2A3022 Brixham
Road (north)Ahead
U N/A N/A A 1 59 - 422 2098 1049 40.2%
1/3A3022 Brixham
Road (north)Right
U N/A N/A C 1 16 - 15 1719 244 6.2%
2/1A3022 BrixhamRoad (south)Ahead Left
U N/A N/A B 1 57 - 325 1954 944 34.4%
2/2+2/3A3022 BrixhamRoad (south)Ahead Right
U N/A N/A B D 1 57:15 - 358 2097:1749 989+17 35.6 :35.6%
3/1 Kingsway AvenueRight Left Ahead U N/A N/A E 1 8 - 25 1812 136 18.4%
4/1 White Rock LeftAhead U N/A N/A F 1 14 - 24 1794 224 10.7%
4/2 White Rock Right U N/A N/A F 1 14 - 14 1816 227 6.2%
5/1 U N/A N/A - - - - 341 Inf Inf 0.0%
5/2 U N/A N/A - - - - 340 Inf Inf 0.0%
6/1 U N/A N/A - - - - 401 Inf Inf 0.0%
6/2 U N/A N/A - - - - 396 Inf Inf 0.0%
7/1 U N/A N/A - - - - 44 Inf Inf 0.0%
8/1 U N/A N/A - - - - 43 Inf Inf 0.0%
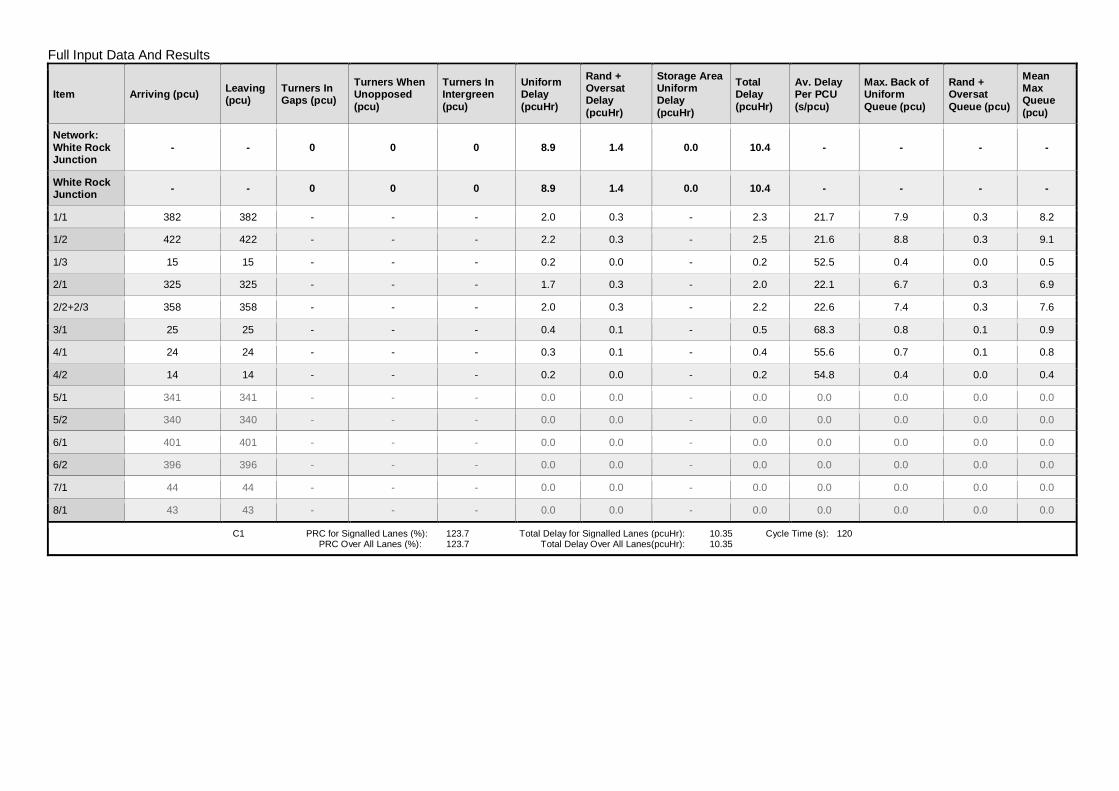
Full Input Data And Results
Item Arriving (pcu) Leaving(pcu)
Turners InGaps (pcu)
Turners WhenUnopposed(pcu)
Turners InIntergreen(pcu)
UniformDelay(pcuHr)
Rand +OversatDelay(pcuHr)
Storage AreaUniformDelay(pcuHr)
TotalDelay(pcuHr)
Av. DelayPer PCU(s/pcu)
Max. Back ofUniformQueue (pcu)
Rand +OversatQueue (pcu)
MeanMaxQueue(pcu)
Network:White RockJunction
- - 0 0 0 8.9 1.4 0.0 10.4 - - - -
White RockJunction - - 0 0 0 8.9 1.4 0.0 10.4 - - - -
1/1 382 382 - - - 2.0 0.3 - 2.3 21.7 7.9 0.3 8.2
1/2 422 422 - - - 2.2 0.3 - 2.5 21.6 8.8 0.3 9.1
1/3 15 15 - - - 0.2 0.0 - 0.2 52.5 0.4 0.0 0.5
2/1 325 325 - - - 1.7 0.3 - 2.0 22.1 6.7 0.3 6.9
2/2+2/3 358 358 - - - 2.0 0.3 - 2.2 22.6 7.4 0.3 7.6
3/1 25 25 - - - 0.4 0.1 - 0.5 68.3 0.8 0.1 0.9
4/1 24 24 - - - 0.3 0.1 - 0.4 55.6 0.7 0.1 0.8
4/2 14 14 - - - 0.2 0.0 - 0.2 54.8 0.4 0.0 0.4
5/1 341 341 - - - 0.0 0.0 - 0.0 0.0 0.0 0.0 0.0
5/2 340 340 - - - 0.0 0.0 - 0.0 0.0 0.0 0.0 0.0
6/1 401 401 - - - 0.0 0.0 - 0.0 0.0 0.0 0.0 0.0
6/2 396 396 - - - 0.0 0.0 - 0.0 0.0 0.0 0.0 0.0
7/1 44 44 - - - 0.0 0.0 - 0.0 0.0 0.0 0.0 0.0
8/1 43 43 - - - 0.0 0.0 - 0.0 0.0 0.0 0.0 0.0
C1 PRC for Signalled Lanes (%): 123.7 Total Delay for Signalled Lanes (pcuHr): 10.35 Cycle Time (s): 120 PRC Over All Lanes (%): 123.7 Total Delay Over All Lanes(pcuHr): 10.35
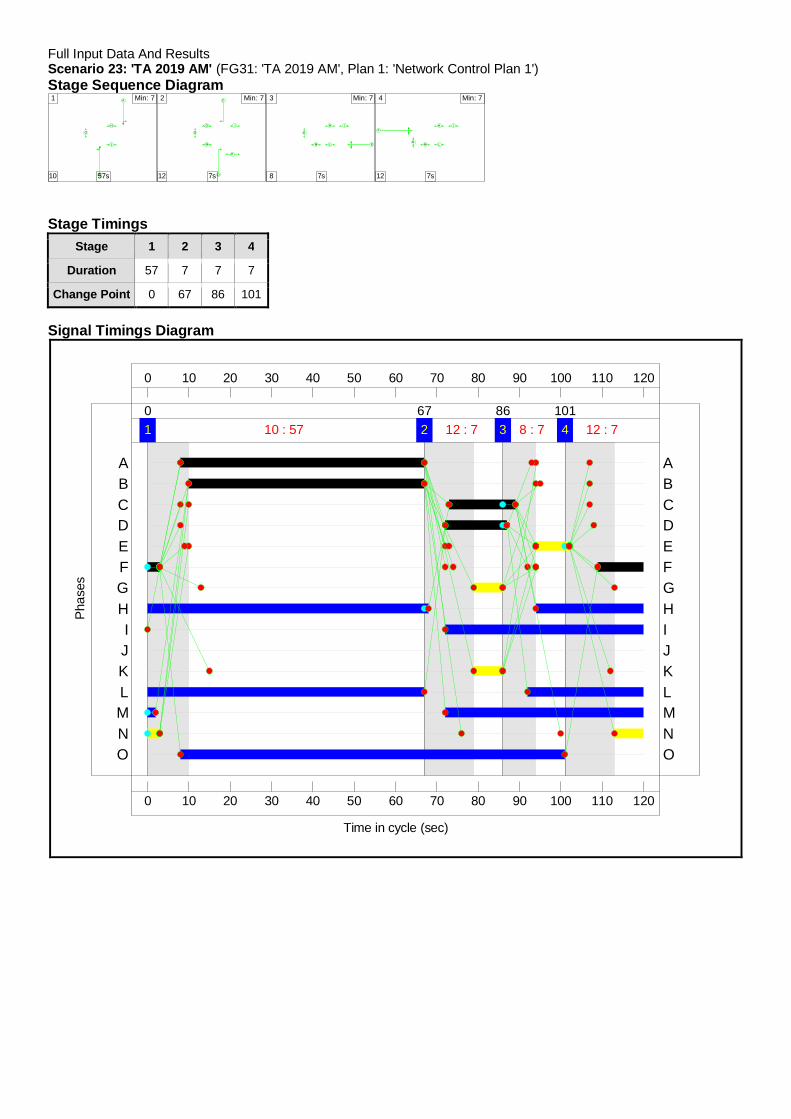
Full Input Data And ResultsScenario 23: 'TA 2019 AM' (FG31: 'TA 2019 AM', Plan 1: 'Network Control Plan 1')Stage Sequence Diagram
A
B
H
L
O
1 Min: 7
10 57s
C
D
G I
K
M
O
2 Min: 7
12 7s
E
H I
LM
O
3 Min: 7
8 7s
FH I
LMN
4 Min: 7
12 7s
Stage TimingsStage 1 2 3 4
Duration 57 7 7 7
Change Point 0 67 86 101
Signal Timings Diagram
0
0
10
10
20
20
30
30
40
40
50
50
60
60
70
70
80
80
90
90
100
100
110
110
120
120
Time in cycle (sec)
Phas
es
1 10 : 570
2 12 : 767
3 8 : 786
4 12 : 7101
O ON NM ML LK KJ JI I
H HG GF FE ED DC CB BA A
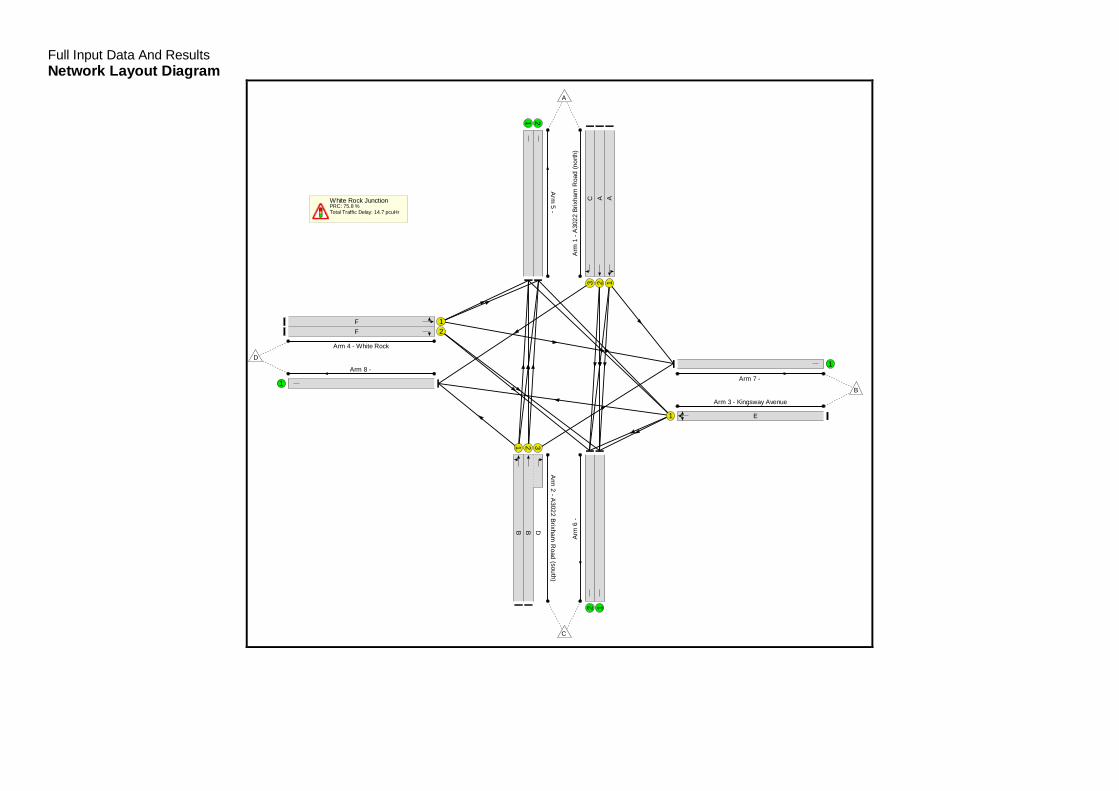
Full Input Data And ResultsNetwork Layout Diagram
White Rock JunctionPRC: 75.8 %Total Traffic Delay: 14.7 pcuHr
Arm
1-A
3022
Brix
ham
Roa
d(n
orth
)
123
AAC
Arm
2-A
3022Brixham
Road
(south)
1 2 3
B B D
Arm 3 - Kingsway Avenue
1 E
Arm 4 - White Rock
12
FF
Arm
5-
1 2Ar
m6
-
12
Arm 7 -
1Arm 8 -
1
A
B
C
D

Full Input Data And Results
Network Results
Item LaneDescription
LaneType
ControllerStream
Position InFiltered Route Full Phase Arrow
PhaseNumGreens
Total Green(s)
ArrowGreen (s)
DemandFlow (pcu)
Sat Flow(pcu/Hr)
Capacity(pcu)
Deg Sat(%)
Network:White RockJunction
- - N/A - - - - - - - - 51.2%
White RockJunction - - N/A - - - - - - - - 51.2%
1/1A3022 Brixham
Road (north)Ahead Left
U N/A N/A A 1 59 - 229 1945 973 23.5%
1/2A3022 Brixham
Road (north)Ahead
U N/A N/A A 1 59 - 260 2098 1049 24.8%
1/3A3022 Brixham
Road (north)Right
U N/A N/A C 1 16 - 80 1719 244 32.9%
2/1A3022 BrixhamRoad (south)Ahead Left
U N/A N/A B 1 57 - 451 1886 912 49.5%
2/2+2/3A3022 BrixhamRoad (south)Ahead Right
U N/A N/A B D 1 57:15 - 515 2097:1749 986+20 51.2 :51.2%
3/1 Kingsway AvenueRight Left Ahead U N/A N/A E 1 8 - 54 1783 134 40.4%
4/1 White Rock LeftAhead U N/A N/A F 1 14 - 105 1707 213 49.2%
4/2 White Rock Right U N/A N/A F 1 14 - 62 1816 227 27.3%
5/1 U N/A N/A - - - - 445 Inf Inf 0.0%
5/2 U N/A N/A - - - - 444 Inf Inf 0.0%
6/1 U N/A N/A - - - - 277 Inf Inf 0.0%
6/2 U N/A N/A - - - - 264 Inf Inf 0.0%
7/1 U N/A N/A - - - - 41 Inf Inf 0.0%
8/1 U N/A N/A - - - - 285 Inf Inf 0.0%

Full Input Data And Results
Item Arriving (pcu) Leaving(pcu)
Turners InGaps (pcu)
Turners WhenUnopposed(pcu)
Turners InIntergreen(pcu)
UniformDelay(pcuHr)
Rand +OversatDelay(pcuHr)
Storage AreaUniformDelay(pcuHr)
TotalDelay(pcuHr)
Av. DelayPer PCU(s/pcu)
Max. Back ofUniformQueue (pcu)
Rand +OversatQueue (pcu)
MeanMaxQueue(pcu)
Network:White RockJunction
- - 0 0 0 12.1 2.6 0.0 14.7 - - - -
White RockJunction - - 0 0 0 12.1 2.6 0.0 14.7 - - - -
1/1 229 229 - - - 1.1 0.2 - 1.2 19.4 4.3 0.2 4.5
1/2 260 260 - - - 1.2 0.2 - 1.4 19.4 4.9 0.2 5.1
1/3 80 80 - - - 1.0 0.2 - 1.3 57.3 2.4 0.2 2.6
2/1 451 451 - - - 2.6 0.5 - 3.1 25.0 10.1 0.5 10.6
2/2+2/3 515 515 - - - 3.1 0.5 - 3.6 25.4 11.6 0.5 12.2
3/1 54 54 - - - 0.8 0.3 - 1.1 75.4 1.7 0.3 2.0
4/1 105 105 - - - 1.4 0.5 - 1.9 65.4 3.2 0.5 3.7
4/2 62 62 - - - 0.8 0.2 - 1.0 58.5 1.9 0.2 2.0
5/1 445 445 - - - 0.0 0.0 - 0.0 0.0 0.0 0.0 0.0
5/2 444 444 - - - 0.0 0.0 - 0.0 0.0 0.0 0.0 0.0
6/1 277 277 - - - 0.0 0.0 - 0.0 0.0 0.0 0.0 0.0
6/2 264 264 - - - 0.0 0.0 - 0.0 0.0 0.0 0.0 0.0
7/1 41 41 - - - 0.0 0.0 - 0.0 0.0 0.0 0.0 0.0
8/1 285 285 - - - 0.0 0.0 - 0.0 0.0 0.0 0.0 0.0
C1 PRC for Signalled Lanes (%): 75.8 Total Delay for Signalled Lanes (pcuHr): 14.72 Cycle Time (s): 120 PRC Over All Lanes (%): 75.8 Total Delay Over All Lanes(pcuHr): 14.72

Full Input Data And ResultsScenario 24: 'TA 2019 PM' (FG32: 'TA 2019 PM', Plan 1: 'Network Control Plan 1')Stage Sequence Diagram
A
B
H
L
O
1 Min: 7
10 51s
C
D
G I
K
M
O
2 Min: 7
12 7s
E
H I
LM
O
3 Min: 7
8 7s
FH I
LMN
4 Min: 7
12 13s
Stage TimingsStage 1 2 3 4
Duration 51 7 7 13
Change Point 0 61 80 95
Signal Timings Diagram
0
0
10
10
20
20
30
30
40
40
50
50
60
60
70
70
80
80
90
90
100
100
110
110
120
120
Time in cycle (sec)
Phas
es
1 10 : 510
2 12 : 761
3 8 : 780
4 12 : 1395
O ON NM ML LK KJ JI I
H HG GF FE ED DC CB BA A
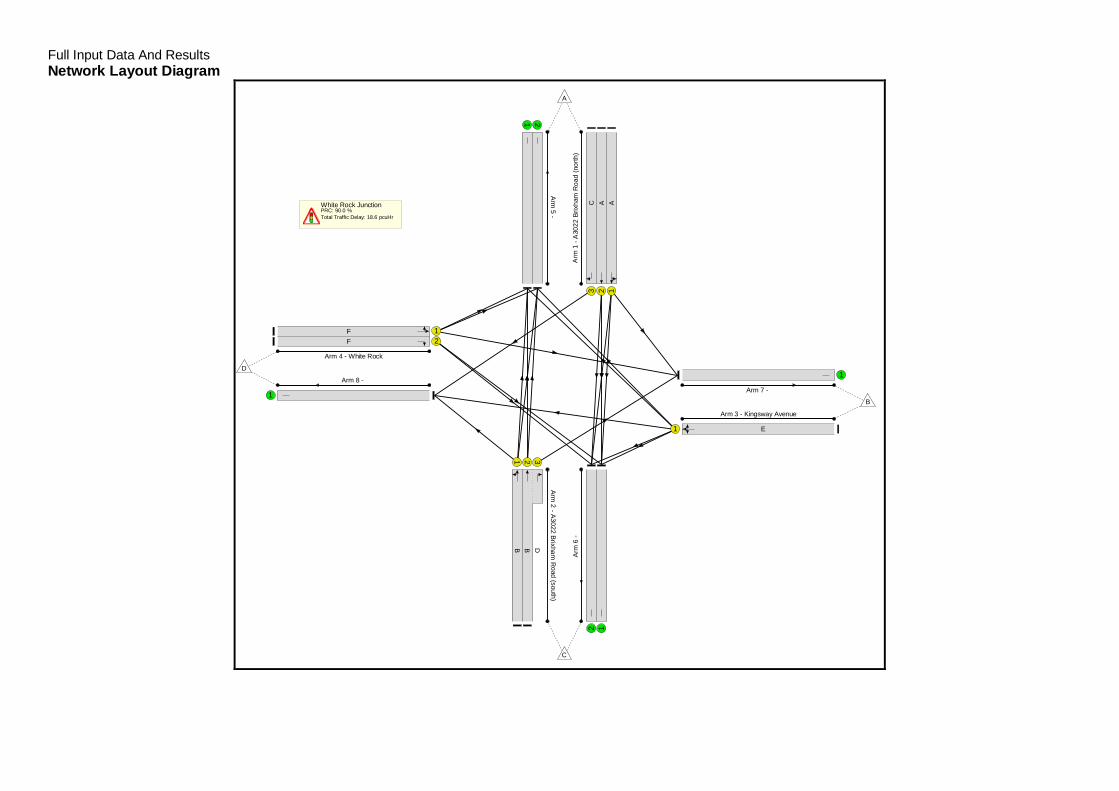
Full Input Data And ResultsNetwork Layout Diagram
White Rock JunctionPRC: 90.0 %Total Traffic Delay: 18.6 pcuHr
Arm
1-A
3022
Brix
ham
Roa
d(n
orth
)
123
AAC
Arm2
-A3022Brixham
Road
(south)
1 2 3
B B D
Arm 3 - Kingsway Avenue
1 E
Arm 4 - White Rock
12
FF
Arm5
-
1 2Ar
m6
-
12
Arm 7 -
1Arm 8 -
1
A
B
C
D

Full Input Data And Results
Network Results
Item LaneDescription
LaneType
ControllerStream
Position InFiltered Route Full Phase Arrow
PhaseNumGreens
Total Green(s)
ArrowGreen (s)
DemandFlow (pcu)
Sat Flow(pcu/Hr)
Capacity(pcu)
Deg Sat(%)
Network:White RockJunction
- - N/A - - - - - - - - 47.4%
White RockJunction - - N/A - - - - - - - - 47.4%
1/1A3022 Brixham
Road (north)Ahead Left
U N/A N/A A 1 53 - 391 1954 879 44.5%
1/2A3022 Brixham
Road (north)Ahead
U N/A N/A A 1 53 - 433 2098 944 45.9%
1/3A3022 Brixham
Road (north)Right
U N/A N/A C 1 16 - 106 1719 244 43.5%
2/1A3022 BrixhamRoad (south)Ahead Left
U N/A N/A B 1 51 - 379 1909 827 45.8%
2/2+2/3A3022 BrixhamRoad (south)Ahead Right
U N/A N/A B D 1 51:15 - 427 2097:1749 889+13 47.4 :47.4%
3/1 Kingsway AvenueRight Left Ahead U N/A N/A E 1 8 - 26 1811 136 19.1%
4/1 White Rock LeftAhead U N/A N/A F 1 20 - 137 1710 299 45.8%
4/2 White Rock Right U N/A N/A F 1 20 - 127 1816 318 40.0%
5/1 U N/A N/A - - - - 411 Inf Inf 0.0%
5/2 U N/A N/A - - - - 411 Inf Inf 0.0%
6/1 U N/A N/A - - - - 467 Inf Inf 0.0%
6/2 U N/A N/A - - - - 462 Inf Inf 0.0%
7/1 U N/A N/A - - - - 45 Inf Inf 0.0%
8/1 U N/A N/A - - - - 230 Inf Inf 0.0%

Full Input Data And Results
Item Arriving (pcu) Leaving(pcu)
Turners InGaps (pcu)
Turners WhenUnopposed(pcu)
Turners InIntergreen(pcu)
UniformDelay(pcuHr)
Rand +OversatDelay(pcuHr)
Storage AreaUniformDelay(pcuHr)
TotalDelay(pcuHr)
Av. DelayPer PCU(s/pcu)
Max. Back ofUniformQueue (pcu)
Rand +OversatQueue (pcu)
MeanMaxQueue(pcu)
Network:White RockJunction
- - 0 0 0 15.7 2.9 0.0 18.6 - - - -
White RockJunction - - 0 0 0 15.7 2.9 0.0 18.6 - - - -
1/1 391 391 - - - 2.5 0.4 - 2.9 26.4 8.9 0.4 9.3
1/2 433 433 - - - 2.8 0.4 - 3.2 26.4 10.0 0.4 10.4
1/3 106 106 - - - 1.4 0.4 - 1.8 60.1 3.2 0.4 3.6
2/1 379 379 - - - 2.5 0.4 - 3.0 28.0 8.8 0.4 9.3
2/2+2/3 427 427 - - - 2.9 0.4 - 3.4 28.4 10.0 0.4 10.5
3/1 26 26 - - - 0.4 0.1 - 0.5 68.5 0.8 0.1 0.9
4/1 137 137 - - - 1.7 0.4 - 2.1 55.4 4.1 0.4 4.5
4/2 127 127 - - - 1.5 0.3 - 1.9 53.3 3.7 0.3 4.1
5/1 411 411 - - - 0.0 0.0 - 0.0 0.0 0.0 0.0 0.0
5/2 411 411 - - - 0.0 0.0 - 0.0 0.0 0.0 0.0 0.0
6/1 467 467 - - - 0.0 0.0 - 0.0 0.0 0.0 0.0 0.0
6/2 462 462 - - - 0.0 0.0 - 0.0 0.0 0.0 0.0 0.0
7/1 45 45 - - - 0.0 0.0 - 0.0 0.0 0.0 0.0 0.0
8/1 230 230 - - - 0.0 0.0 - 0.0 0.0 0.0 0.0 0.0
C1 PRC for Signalled Lanes (%): 90.0 Total Delay for Signalled Lanes (pcuHr): 18.61 Cycle Time (s): 120 PRC Over All Lanes (%): 90.0 Total Delay Over All Lanes(pcuHr): 18.61

Full Input Data And ResultsScenario 25: 'TA 2024 AM' (FG33: 'TA 2024 AM', Plan 1: 'Network Control Plan 1')Stage Sequence Diagram
A
B
H
L
O
1 Min: 7
10 57s
C
D
G I
K
M
O
2 Min: 7
12 7s
E
H I
LM
O
3 Min: 7
8 7s
FH I
LMN
4 Min: 7
12 7s
Stage TimingsStage 1 2 3 4
Duration 57 7 7 7
Change Point 0 67 86 101
Signal Timings Diagram
0
0
10
10
20
20
30
30
40
40
50
50
60
60
70
70
80
80
90
90
100
100
110
110
120
120
Time in cycle (sec)
Phas
es
1 10 : 570
2 12 : 767
3 8 : 786
4 12 : 7101
O ON NM ML LK KJ JI I
H HG GF FE ED DC CB BA A
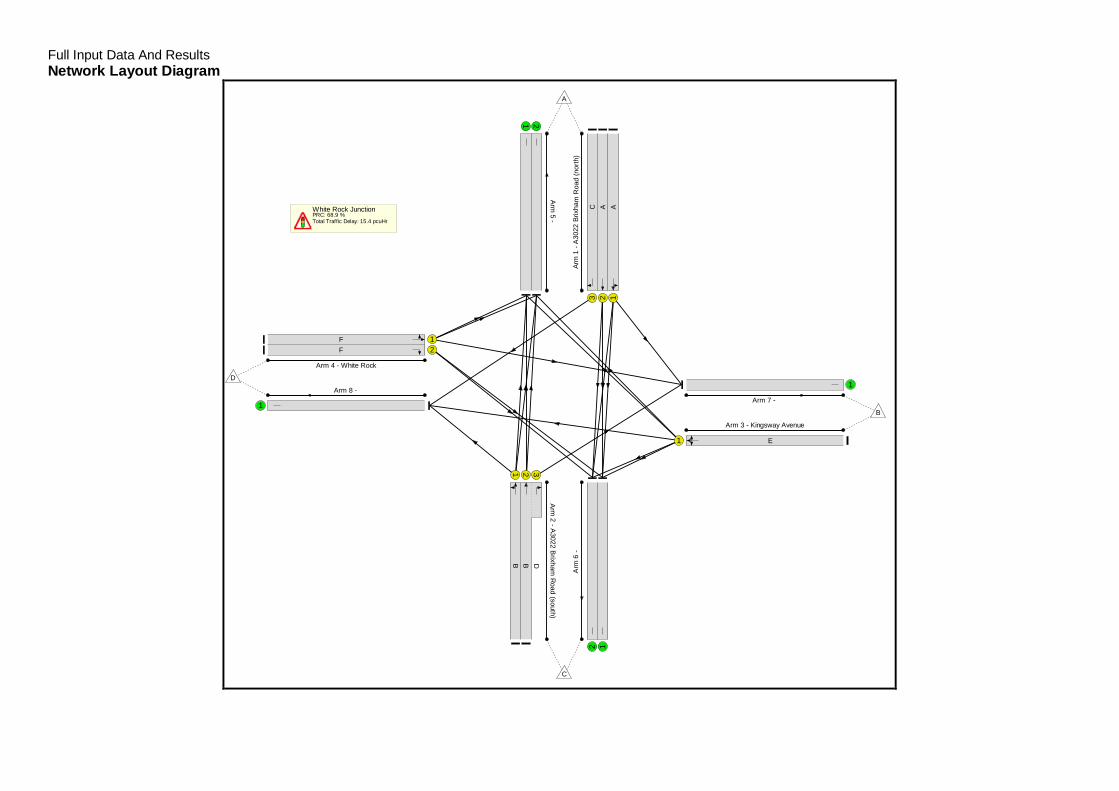
Full Input Data And ResultsNetwork Layout Diagram
White Rock JunctionPRC: 68.9 %Total Traffic Delay: 15.4 pcuHr
Arm
1-A
3022
Brix
ham
Roa
d(n
orth
)
123
AAC
Ar m
2-A
3022B
rixhamR
oad(south)
1 2 3
B B D
Arm 3 - Kingsway Avenue
1 E
Arm 4 - White Rock
12
FF
Arm
5-
1 2A
rm6
-
12
Arm 7 -
1Arm 8 -
1
A
B
C
D

Full Input Data And Results
Network Results
Item LaneDescription
LaneType
ControllerStream
Position InFiltered Route Full Phase Arrow
PhaseNumGreens
Total Green(s)
ArrowGreen (s)
DemandFlow (pcu)
Sat Flow(pcu/Hr)
Capacity(pcu)
Deg Sat(%)
Network:White RockJunction
- - N/A - - - - - - - - 53.3%
White RockJunction - - N/A - - - - - - - - 53.3%
1/1A3022 Brixham
Road (north)Ahead Left
U N/A N/A A 1 59 - 239 1946 973 24.6%
1/2A3022 Brixham
Road (north)Ahead
U N/A N/A A 1 59 - 274 2098 1049 26.1%
1/3A3022 Brixham
Road (north)Right
U N/A N/A C 1 16 - 80 1719 244 32.9%
2/1A3022 BrixhamRoad (south)Ahead Left
U N/A N/A B 1 57 - 470 1882 910 51.7%
2/2+2/3A3022 BrixhamRoad (south)Ahead Right
U N/A N/A B D 1 57:15 - 536 2097:1749 987+19 53.3 :53.3%
3/1 Kingsway AvenueRight Left Ahead U N/A N/A E 1 8 - 54 1783 134 40.4%
4/1 White Rock LeftAhead U N/A N/A F 1 14 - 105 1707 213 49.2%
4/2 White Rock Right U N/A N/A F 1 14 - 68 1816 227 30.0%
5/1 U N/A N/A - - - - 456 Inf Inf 0.0%
5/2 U N/A N/A - - - - 454 Inf Inf 0.0%
6/1 U N/A N/A - - - - 292 Inf Inf 0.0%
6/2 U N/A N/A - - - - 279 Inf Inf 0.0%
7/1 U N/A N/A - - - - 41 Inf Inf 0.0%
8/1 U N/A N/A - - - - 304 Inf Inf 0.0%

Full Input Data And Results
Item Arriving (pcu) Leaving(pcu)
Turners InGaps (pcu)
Turners WhenUnopposed(pcu)
Turners InIntergreen(pcu)
UniformDelay(pcuHr)
Rand +OversatDelay(pcuHr)
Storage AreaUniformDelay(pcuHr)
TotalDelay(pcuHr)
Av. DelayPer PCU(s/pcu)
Max. Back ofUniformQueue (pcu)
Rand +OversatQueue (pcu)
MeanMaxQueue(pcu)
Network:White RockJunction
- - 0 0 0 12.7 2.7 0.0 15.4 - - - -
White RockJunction - - 0 0 0 12.7 2.7 0.0 15.4 - - - -
1/1 239 239 - - - 1.1 0.2 - 1.3 19.6 4.5 0.2 4.7
1/2 274 274 - - - 1.3 0.2 - 1.5 19.6 5.3 0.2 5.4
1/3 80 80 - - - 1.0 0.2 - 1.3 57.3 2.4 0.2 2.6
2/1 470 470 - - - 2.8 0.5 - 3.3 25.4 10.7 0.5 11.2
2/2+2/3 536 536 - - - 3.3 0.6 - 3.9 25.9 12.3 0.6 12.8
3/1 54 54 - - - 0.8 0.3 - 1.1 75.4 1.7 0.3 2.0
4/1 105 105 - - - 1.4 0.5 - 1.9 65.4 3.2 0.5 3.7
4/2 68 68 - - - 0.9 0.2 - 1.1 59.0 2.1 0.2 2.3
5/1 456 456 - - - 0.0 0.0 - 0.0 0.0 0.0 0.0 0.0
5/2 454 454 - - - 0.0 0.0 - 0.0 0.0 0.0 0.0 0.0
6/1 292 292 - - - 0.0 0.0 - 0.0 0.0 0.0 0.0 0.0
6/2 279 279 - - - 0.0 0.0 - 0.0 0.0 0.0 0.0 0.0
7/1 41 41 - - - 0.0 0.0 - 0.0 0.0 0.0 0.0 0.0
8/1 304 304 - - - 0.0 0.0 - 0.0 0.0 0.0 0.0 0.0
C1 PRC for Signalled Lanes (%): 68.9 Total Delay for Signalled Lanes (pcuHr): 15.39 Cycle Time (s): 120 PRC Over All Lanes (%): 68.9 Total Delay Over All Lanes(pcuHr): 15.39
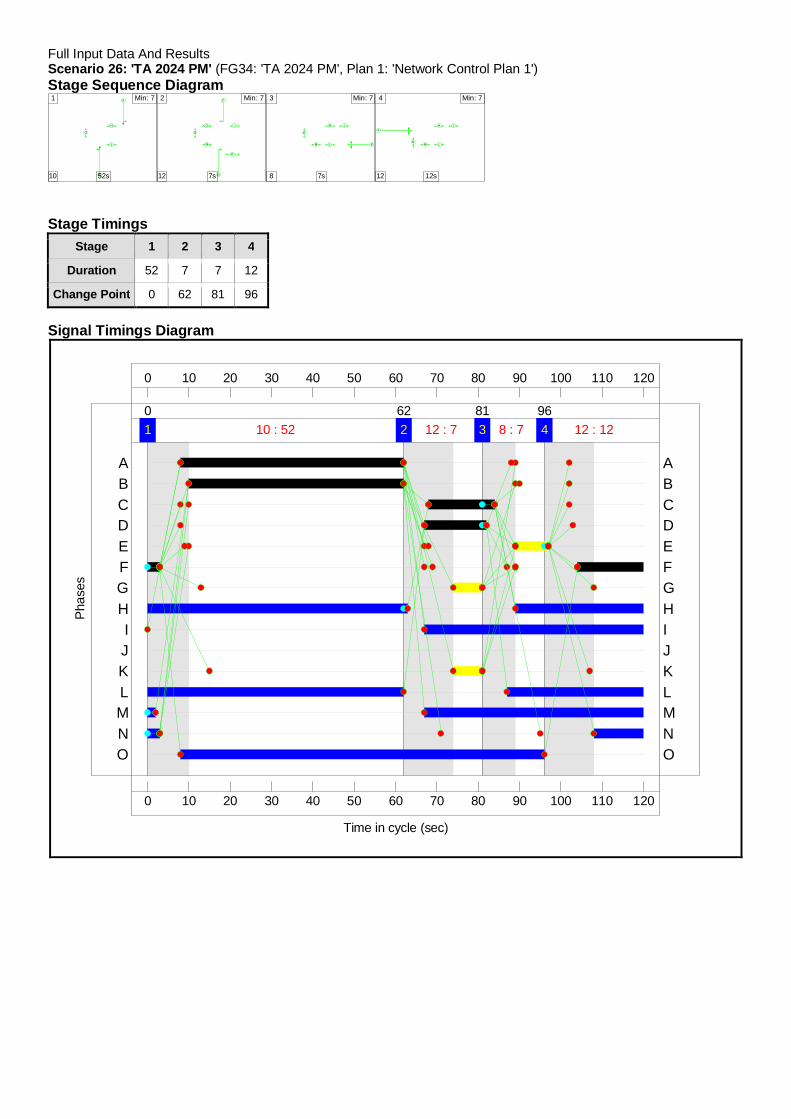
Full Input Data And ResultsScenario 26: 'TA 2024 PM' (FG34: 'TA 2024 PM', Plan 1: 'Network Control Plan 1')Stage Sequence Diagram
A
B
H
L
O
1 Min: 7
10 52s
C
D
G I
K
M
O
2 Min: 7
12 7s
E
H I
LM
O
3 Min: 7
8 7s
FH I
LMN
4 Min: 7
12 12s
Stage TimingsStage 1 2 3 4
Duration 52 7 7 12
Change Point 0 62 81 96
Signal Timings Diagram
0
0
10
10
20
20
30
30
40
40
50
50
60
60
70
70
80
80
90
90
100
100
110
110
120
120
Time in cycle (sec)
Phas
es
1 10 : 520
2 12 : 762
3 8 : 781
4 12 : 1296
O ON NM ML LK KJ JI I
H HG GF FE ED DC CB BA A
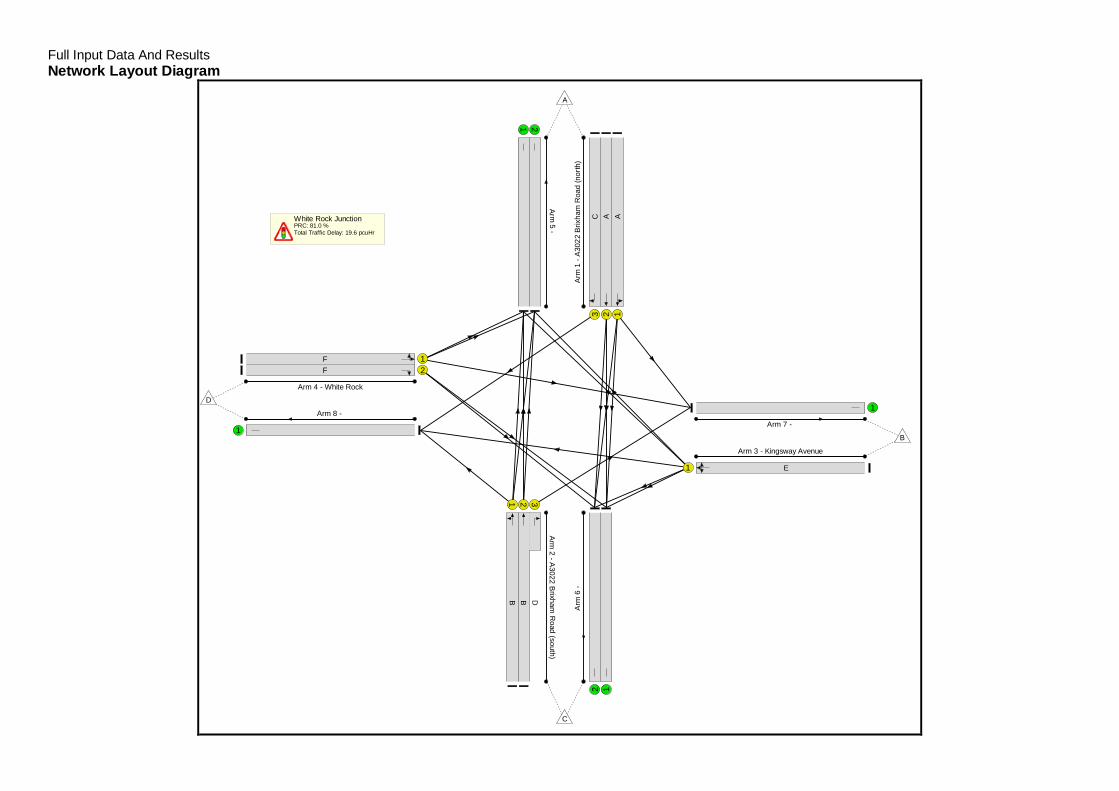
Full Input Data And ResultsNetwork Layout Diagram
White Rock JunctionPRC: 81.0 %Total Traffic Delay: 19.6 pcuHr
Arm
1-A
3022
Brix
ham
Roa
d(n
orth
)
123
AAC
Arm
2-A
3022B
rixhamR
oad(south)
1 2 3
B B D
Arm 3 - Kingsway Avenue
1 E
Arm 4 - White Rock
12
FF
Ar m
5-
1 2A
rm6
-
12
Arm 7 -
1Arm 8 -
1
A
B
C
D
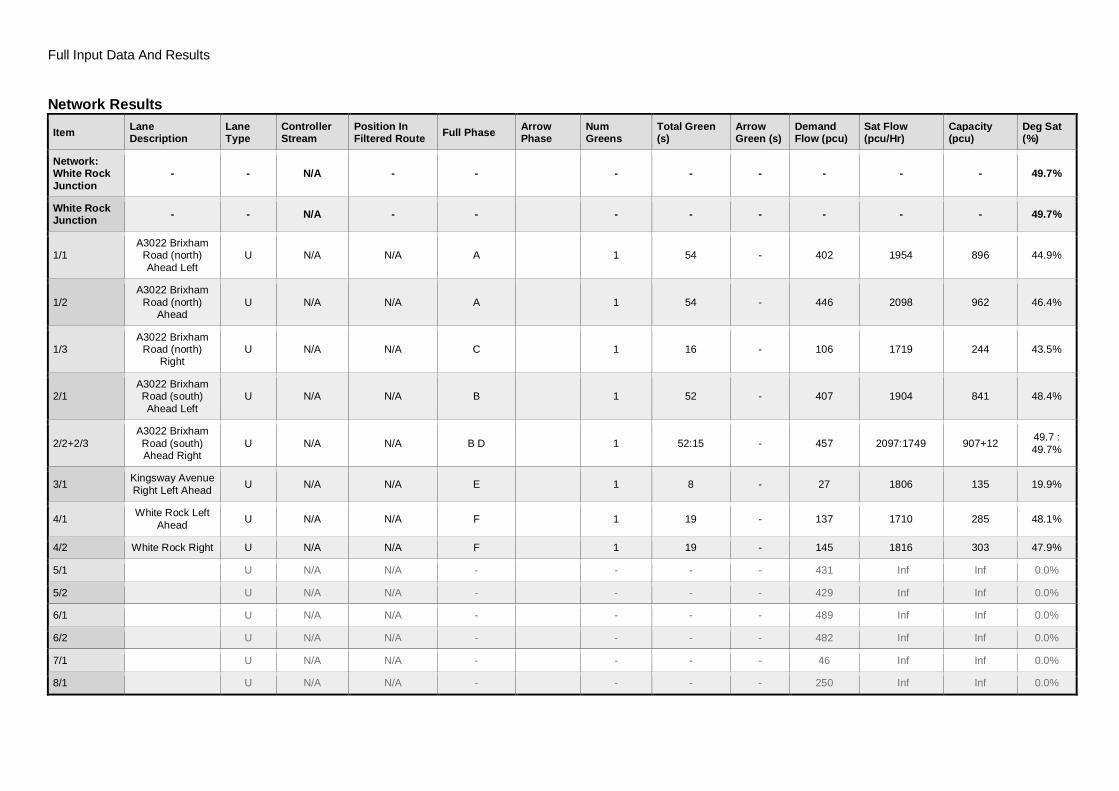
Full Input Data And Results
Network Results
Item LaneDescription
LaneType
ControllerStream
Position InFiltered Route Full Phase Arrow
PhaseNumGreens
Total Green(s)
ArrowGreen (s)
DemandFlow (pcu)
Sat Flow(pcu/Hr)
Capacity(pcu)
Deg Sat(%)
Network:White RockJunction
- - N/A - - - - - - - - 49.7%
White RockJunction - - N/A - - - - - - - - 49.7%
1/1A3022 Brixham
Road (north)Ahead Left
U N/A N/A A 1 54 - 402 1954 896 44.9%
1/2A3022 Brixham
Road (north)Ahead
U N/A N/A A 1 54 - 446 2098 962 46.4%
1/3A3022 Brixham
Road (north)Right
U N/A N/A C 1 16 - 106 1719 244 43.5%
2/1A3022 BrixhamRoad (south)Ahead Left
U N/A N/A B 1 52 - 407 1904 841 48.4%
2/2+2/3A3022 BrixhamRoad (south)Ahead Right
U N/A N/A B D 1 52:15 - 457 2097:1749 907+12 49.7 :49.7%
3/1 Kingsway AvenueRight Left Ahead U N/A N/A E 1 8 - 27 1806 135 19.9%
4/1 White Rock LeftAhead U N/A N/A F 1 19 - 137 1710 285 48.1%
4/2 White Rock Right U N/A N/A F 1 19 - 145 1816 303 47.9%
5/1 U N/A N/A - - - - 431 Inf Inf 0.0%
5/2 U N/A N/A - - - - 429 Inf Inf 0.0%
6/1 U N/A N/A - - - - 489 Inf Inf 0.0%
6/2 U N/A N/A - - - - 482 Inf Inf 0.0%
7/1 U N/A N/A - - - - 46 Inf Inf 0.0%
8/1 U N/A N/A - - - - 250 Inf Inf 0.0%
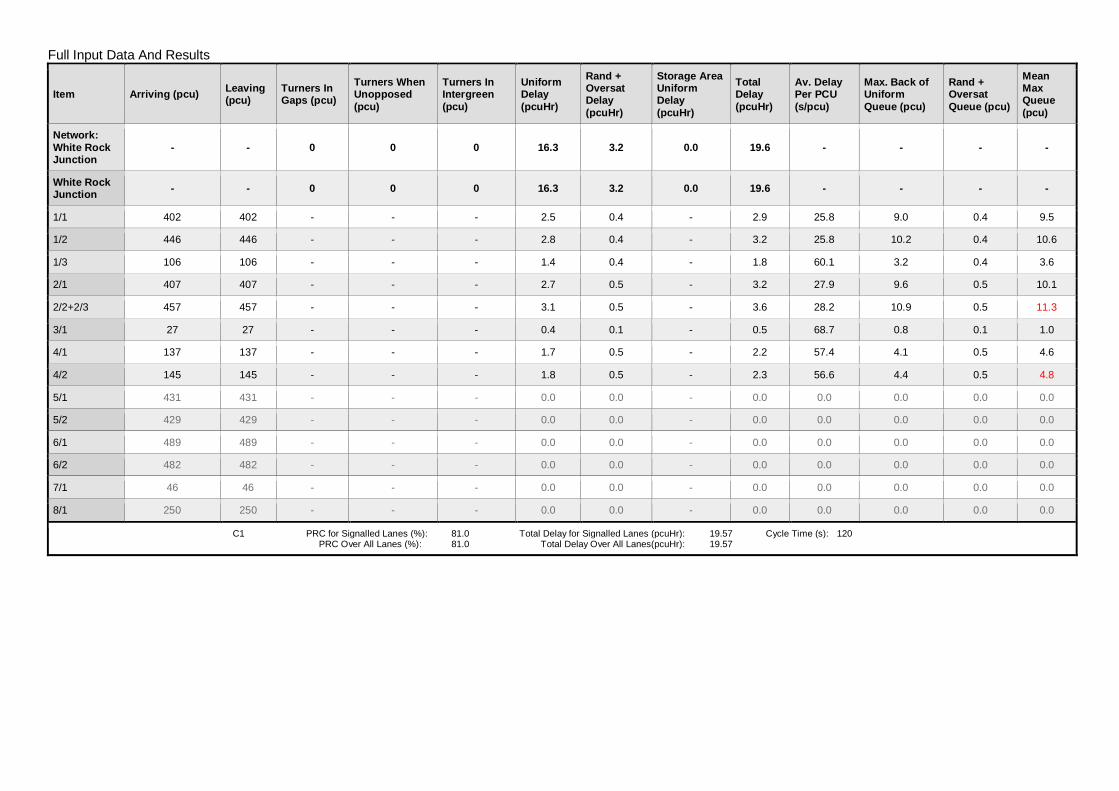
Full Input Data And Results
Item Arriving (pcu) Leaving(pcu)
Turners InGaps (pcu)
Turners WhenUnopposed(pcu)
Turners InIntergreen(pcu)
UniformDelay(pcuHr)
Rand +OversatDelay(pcuHr)
Storage AreaUniformDelay(pcuHr)
TotalDelay(pcuHr)
Av. DelayPer PCU(s/pcu)
Max. Back ofUniformQueue (pcu)
Rand +OversatQueue (pcu)
MeanMaxQueue(pcu)
Network:White RockJunction
- - 0 0 0 16.3 3.2 0.0 19.6 - - - -
White RockJunction - - 0 0 0 16.3 3.2 0.0 19.6 - - - -
1/1 402 402 - - - 2.5 0.4 - 2.9 25.8 9.0 0.4 9.5
1/2 446 446 - - - 2.8 0.4 - 3.2 25.8 10.2 0.4 10.6
1/3 106 106 - - - 1.4 0.4 - 1.8 60.1 3.2 0.4 3.6
2/1 407 407 - - - 2.7 0.5 - 3.2 27.9 9.6 0.5 10.1
2/2+2/3 457 457 - - - 3.1 0.5 - 3.6 28.2 10.9 0.5 11.3
3/1 27 27 - - - 0.4 0.1 - 0.5 68.7 0.8 0.1 1.0
4/1 137 137 - - - 1.7 0.5 - 2.2 57.4 4.1 0.5 4.6
4/2 145 145 - - - 1.8 0.5 - 2.3 56.6 4.4 0.5 4.8
5/1 431 431 - - - 0.0 0.0 - 0.0 0.0 0.0 0.0 0.0
5/2 429 429 - - - 0.0 0.0 - 0.0 0.0 0.0 0.0 0.0
6/1 489 489 - - - 0.0 0.0 - 0.0 0.0 0.0 0.0 0.0
6/2 482 482 - - - 0.0 0.0 - 0.0 0.0 0.0 0.0 0.0
7/1 46 46 - - - 0.0 0.0 - 0.0 0.0 0.0 0.0 0.0
8/1 250 250 - - - 0.0 0.0 - 0.0 0.0 0.0 0.0 0.0
C1 PRC for Signalled Lanes (%): 81.0 Total Delay for Signalled Lanes (pcuHr): 19.57 Cycle Time (s): 120 PRC Over All Lanes (%): 81.0 Total Delay Over All Lanes(pcuHr): 19.57

Full Input Data And ResultsScenario 27: 'TA 2024 + Dev AM' (FG35: 'TA 2024 + Dev AM', Plan 1: 'Network Control Plan 1')Stage Sequence Diagram
A
B
H
L
O
1 Min: 7
10 57s
C
D
G I
K
M
O
2 Min: 7
12 7s
E
H I
LM
O
3 Min: 7
8 7s
FH I
LMN
4 Min: 7
12 7s
Stage TimingsStage 1 2 3 4
Duration 57 7 7 7
Change Point 0 67 86 101
Signal Timings Diagram
0
0
10
10
20
20
30
30
40
40
50
50
60
60
70
70
80
80
90
90
100
100
110
110
120
120
Time in cycle (sec)
Phas
es
1 10 : 570
2 12 : 767
3 8 : 786
4 12 : 7101
O ON NM ML LK KJ JI I
H HG GF FE ED DC CB BA A
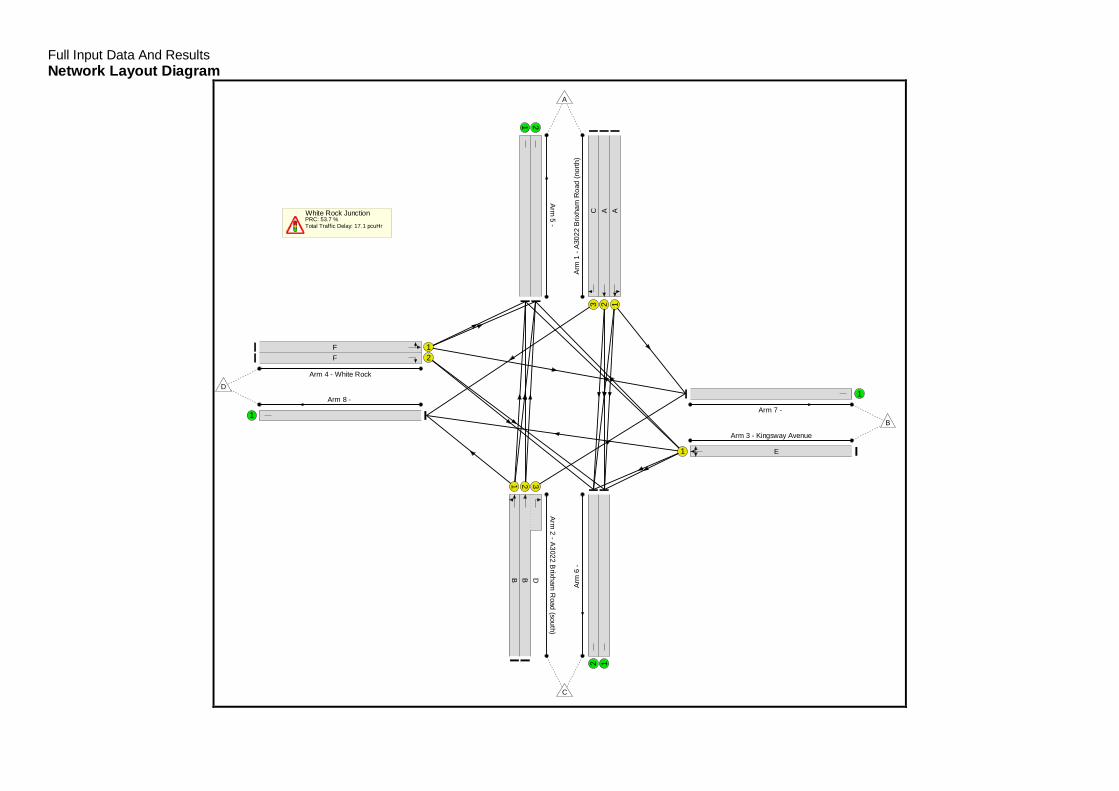
Full Input Data And ResultsNetwork Layout Diagram
White Rock JunctionPRC: 53.7 %Total Traffic Delay: 17.1 pcuHr
Arm
1-A
3022
Brix
ham
Roa
d(n
orth
)
123
AAC
Arm
2-A
3022B
rixhamR
oad(south)
1 2 3
B B D
Arm 3 - Kingsway Avenue
1 E
Arm 4 - White Rock
12
FF
Arm
5-
1 2A
rm6
-
12
Arm 7 -
1Arm 8 -
1
A
B
C
D

Full Input Data And Results
Network Results
Item LaneDescription
LaneType
ControllerStream
Position InFiltered Route Full Phase Arrow
PhaseNumGreens
Total Green(s)
ArrowGreen (s)
DemandFlow (pcu)
Sat Flow(pcu/Hr)
Capacity(pcu)
Deg Sat(%)
Network:White RockJunction
- - N/A - - - - - - - - 58.5%
White RockJunction - - N/A - - - - - - - - 58.5%
1/1A3022 Brixham
Road (north)Ahead Left
U N/A N/A A 1 59 - 263 1949 975 27.0%
1/2A3022 Brixham
Road (north)Ahead
U N/A N/A A 1 59 - 299 2098 1049 28.5%
1/3A3022 Brixham
Road (north)Right
U N/A N/A C 1 16 - 80 1719 244 32.9%
2/1A3022 BrixhamRoad (south)Ahead Left
U N/A N/A B 1 57 - 520 1886 912 57.0%
2/2+2/3A3022 BrixhamRoad (south)Ahead Right
U N/A N/A B D 1 57:15 - 589 2097:1749 989+17 58.5 :58.5%
3/1 Kingsway AvenueRight Left Ahead U N/A N/A E 1 8 - 54 1783 134 40.4%
4/1 White Rock LeftAhead U N/A N/A F 1 14 - 105 1707 213 49.2%
4/2 White Rock Right U N/A N/A F 1 14 - 82 1816 227 36.1%
5/1 U N/A N/A - - - - 503 Inf Inf 0.0%
5/2 U N/A N/A - - - - 500 Inf Inf 0.0%
6/1 U N/A N/A - - - - 323 Inf Inf 0.0%
6/2 U N/A N/A - - - - 311 Inf Inf 0.0%
7/1 U N/A N/A - - - - 41 Inf Inf 0.0%
8/1 U N/A N/A - - - - 314 Inf Inf 0.0%

Full Input Data And Results
Item Arriving (pcu) Leaving(pcu)
Turners InGaps (pcu)
Turners WhenUnopposed(pcu)
Turners InIntergreen(pcu)
UniformDelay(pcuHr)
Rand +OversatDelay(pcuHr)
Storage AreaUniformDelay(pcuHr)
TotalDelay(pcuHr)
Av. DelayPer PCU(s/pcu)
Max. Back ofUniformQueue (pcu)
Rand +OversatQueue (pcu)
MeanMaxQueue(pcu)
Network:White RockJunction
- - 0 0 0 14.0 3.1 0.0 17.1 - - - -
White RockJunction - - 0 0 0 14.0 3.1 0.0 17.1 - - - -
1/1 263 263 - - - 1.3 0.2 - 1.5 19.9 5.0 0.2 5.2
1/2 299 299 - - - 1.5 0.2 - 1.7 19.9 5.7 0.2 5.9
1/3 80 80 - - - 1.0 0.2 - 1.3 57.3 2.4 0.2 2.6
2/1 520 520 - - - 3.2 0.7 - 3.9 26.7 12.3 0.7 12.9
2/2+2/3 589 589 - - - 3.7 0.7 - 4.4 27.1 14.0 0.7 14.7
3/1 54 54 - - - 0.8 0.3 - 1.1 75.4 1.7 0.3 2.0
4/1 105 105 - - - 1.4 0.5 - 1.9 65.4 3.2 0.5 3.7
4/2 82 82 - - - 1.1 0.3 - 1.4 60.5 2.5 0.3 2.8
5/1 503 503 - - - 0.0 0.0 - 0.0 0.0 0.0 0.0 0.0
5/2 500 500 - - - 0.0 0.0 - 0.0 0.0 0.0 0.0 0.0
6/1 323 323 - - - 0.0 0.0 - 0.0 0.0 0.0 0.0 0.0
6/2 311 311 - - - 0.0 0.0 - 0.0 0.0 0.0 0.0 0.0
7/1 41 41 - - - 0.0 0.0 - 0.0 0.0 0.0 0.0 0.0
8/1 314 314 - - - 0.0 0.0 - 0.0 0.0 0.0 0.0 0.0
C1 PRC for Signalled Lanes (%): 53.7 Total Delay for Signalled Lanes (pcuHr): 17.08 Cycle Time (s): 120 PRC Over All Lanes (%): 53.7 Total Delay Over All Lanes(pcuHr): 17.08
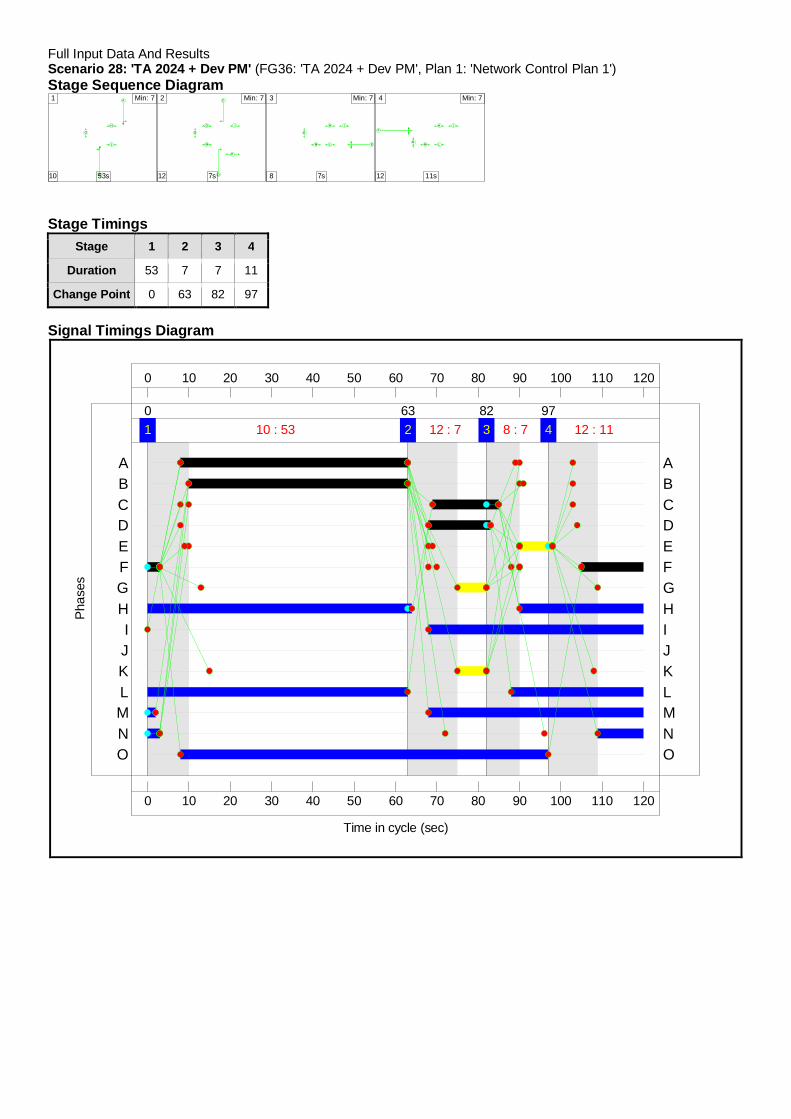
Full Input Data And ResultsScenario 28: 'TA 2024 + Dev PM' (FG36: 'TA 2024 + Dev PM', Plan 1: 'Network Control Plan 1')Stage Sequence Diagram
A
B
H
L
O
1 Min: 7
10 53s
C
D
G I
K
M
O
2 Min: 7
12 7s
E
H I
LM
O
3 Min: 7
8 7s
FH I
LMN
4 Min: 7
12 11s
Stage TimingsStage 1 2 3 4
Duration 53 7 7 11
Change Point 0 63 82 97
Signal Timings Diagram
0
0
10
10
20
20
30
30
40
40
50
50
60
60
70
70
80
80
90
90
100
100
110
110
120
120
Time in cycle (sec)
Phas
es
1 10 : 530
2 12 : 763
3 8 : 782
4 12 : 1197
O ON NM ML LK KJ JI I
H HG GF FE ED DC CB BA A
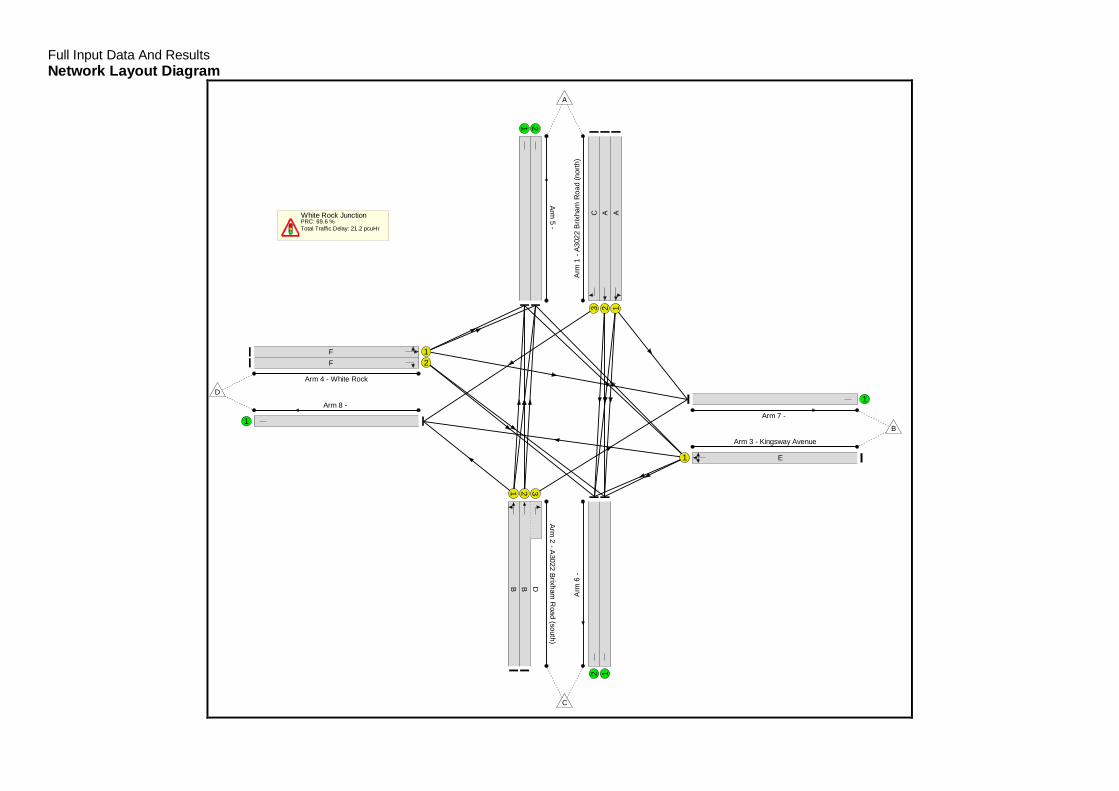
Full Input Data And ResultsNetwork Layout Diagram
White Rock JunctionPRC: 69.6 %Total Traffic Delay: 21.2 pcuHr
Arm
1-A
3022
Brix
ham
Roa
d(n
orth
)
123
AAC
Arm2
-A3022
B rixhamR
oad(south)
1 2 3
B B D
Arm 3 - Kingsway Avenue
1 E
Arm 4 - White Rock
12
FF
Ar m5
-
1 2A
rm6
-
12
Arm 7 -
1Arm 8 -
1
A
B
C
D
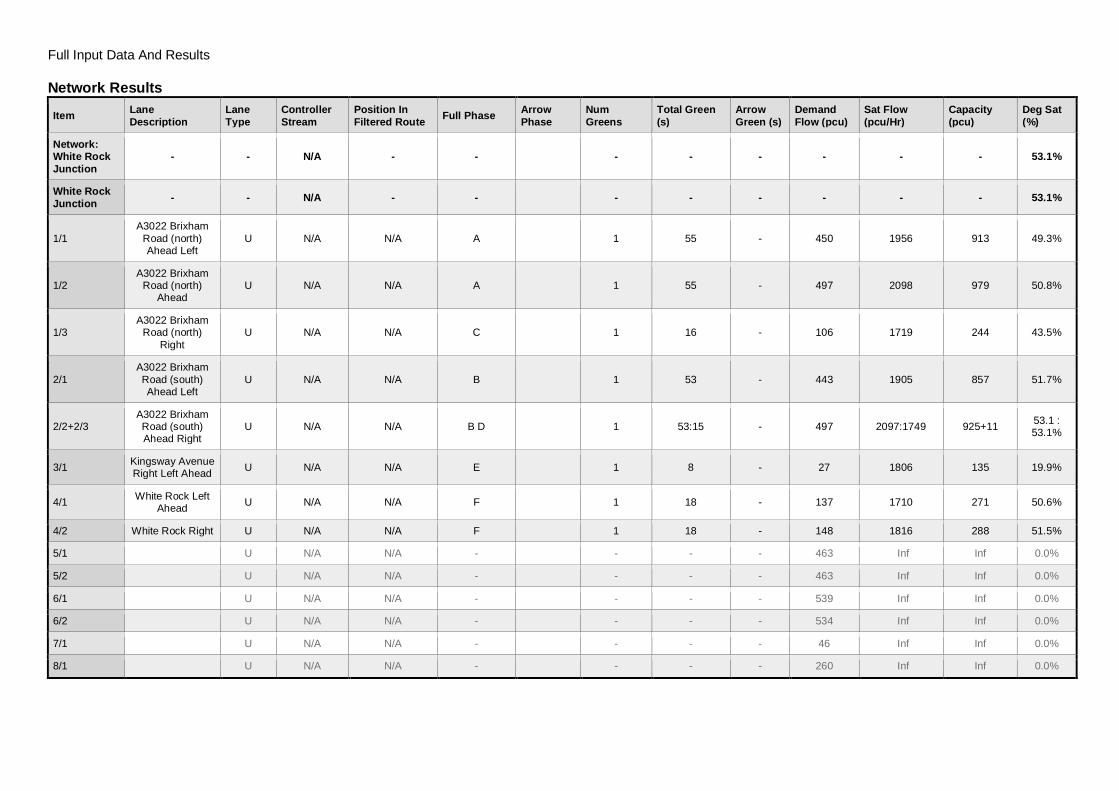
Full Input Data And Results
Network Results
Item LaneDescription
LaneType
ControllerStream
Position InFiltered Route Full Phase Arrow
PhaseNumGreens
Total Green(s)
ArrowGreen (s)
DemandFlow (pcu)
Sat Flow(pcu/Hr)
Capacity(pcu)
Deg Sat(%)
Network:White RockJunction
- - N/A - - - - - - - - 53.1%
White RockJunction - - N/A - - - - - - - - 53.1%
1/1A3022 Brixham
Road (north)Ahead Left
U N/A N/A A 1 55 - 450 1956 913 49.3%
1/2A3022 Brixham
Road (north)Ahead
U N/A N/A A 1 55 - 497 2098 979 50.8%
1/3A3022 Brixham
Road (north)Right
U N/A N/A C 1 16 - 106 1719 244 43.5%
2/1A3022 BrixhamRoad (south)Ahead Left
U N/A N/A B 1 53 - 443 1905 857 51.7%
2/2+2/3A3022 BrixhamRoad (south)Ahead Right
U N/A N/A B D 1 53:15 - 497 2097:1749 925+11 53.1 :53.1%
3/1 Kingsway AvenueRight Left Ahead U N/A N/A E 1 8 - 27 1806 135 19.9%
4/1 White Rock LeftAhead U N/A N/A F 1 18 - 137 1710 271 50.6%
4/2 White Rock Right U N/A N/A F 1 18 - 148 1816 288 51.5%
5/1 U N/A N/A - - - - 463 Inf Inf 0.0%
5/2 U N/A N/A - - - - 463 Inf Inf 0.0%
6/1 U N/A N/A - - - - 539 Inf Inf 0.0%
6/2 U N/A N/A - - - - 534 Inf Inf 0.0%
7/1 U N/A N/A - - - - 46 Inf Inf 0.0%
8/1 U N/A N/A - - - - 260 Inf Inf 0.0%
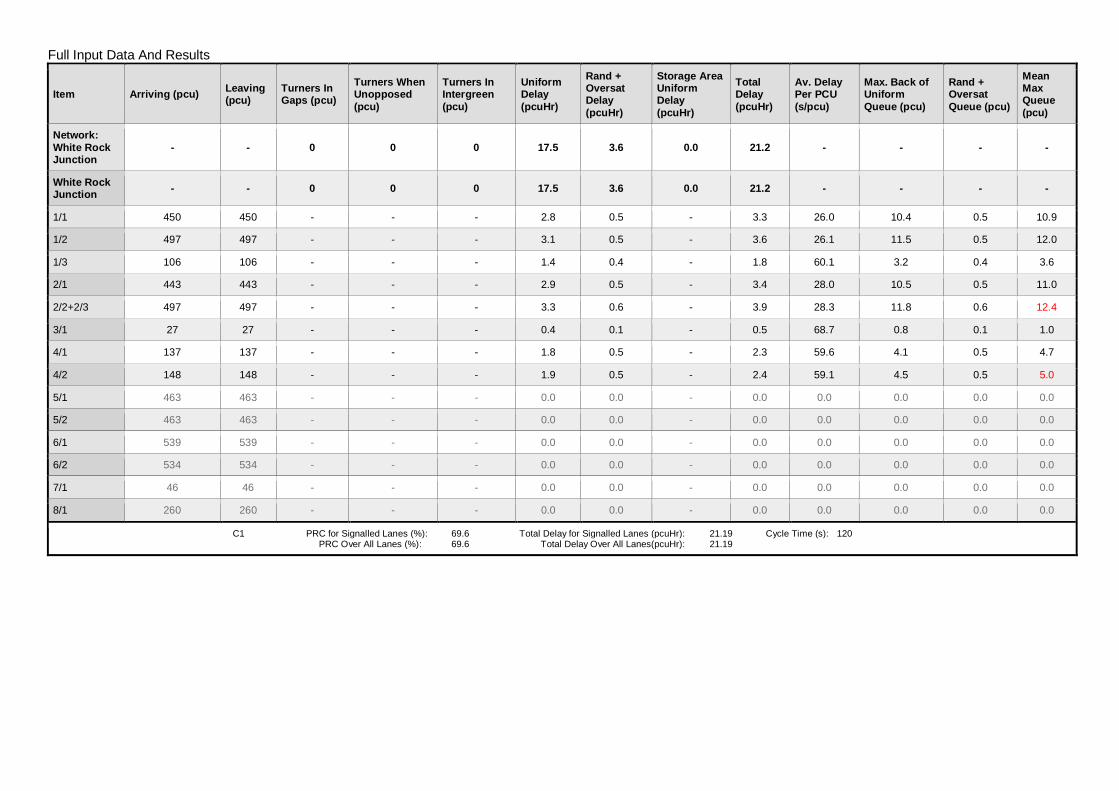
Full Input Data And Results
Item Arriving (pcu) Leaving(pcu)
Turners InGaps (pcu)
Turners WhenUnopposed(pcu)
Turners InIntergreen(pcu)
UniformDelay(pcuHr)
Rand +OversatDelay(pcuHr)
Storage AreaUniformDelay(pcuHr)
TotalDelay(pcuHr)
Av. DelayPer PCU(s/pcu)
Max. Back ofUniformQueue (pcu)
Rand +OversatQueue (pcu)
MeanMaxQueue(pcu)
Network:White RockJunction
- - 0 0 0 17.5 3.6 0.0 21.2 - - - -
White RockJunction - - 0 0 0 17.5 3.6 0.0 21.2 - - - -
1/1 450 450 - - - 2.8 0.5 - 3.3 26.0 10.4 0.5 10.9
1/2 497 497 - - - 3.1 0.5 - 3.6 26.1 11.5 0.5 12.0
1/3 106 106 - - - 1.4 0.4 - 1.8 60.1 3.2 0.4 3.6
2/1 443 443 - - - 2.9 0.5 - 3.4 28.0 10.5 0.5 11.0
2/2+2/3 497 497 - - - 3.3 0.6 - 3.9 28.3 11.8 0.6 12.4
3/1 27 27 - - - 0.4 0.1 - 0.5 68.7 0.8 0.1 1.0
4/1 137 137 - - - 1.8 0.5 - 2.3 59.6 4.1 0.5 4.7
4/2 148 148 - - - 1.9 0.5 - 2.4 59.1 4.5 0.5 5.0
5/1 463 463 - - - 0.0 0.0 - 0.0 0.0 0.0 0.0 0.0
5/2 463 463 - - - 0.0 0.0 - 0.0 0.0 0.0 0.0 0.0
6/1 539 539 - - - 0.0 0.0 - 0.0 0.0 0.0 0.0 0.0
6/2 534 534 - - - 0.0 0.0 - 0.0 0.0 0.0 0.0 0.0
7/1 46 46 - - - 0.0 0.0 - 0.0 0.0 0.0 0.0 0.0
8/1 260 260 - - - 0.0 0.0 - 0.0 0.0 0.0 0.0 0.0
C1 PRC for Signalled Lanes (%): 69.6 Total Delay for Signalled Lanes (pcuHr): 21.19 Cycle Time (s): 120 PRC Over All Lanes (%): 69.6 Total Delay Over All Lanes(pcuHr): 21.19
Full Input Data And ResultsFull Input Data And Results
User and Project DetailsProject: Inglewood
Title: Windy Corner Existing Junction
Location:
File name: Windy Corner Existing Copy (modelled as existing give way).lsg3x
Author: FF
Company: Key Transport Consultants
Address: 26 Berkeley Square, Bristol, BS8 1HP
Notes:
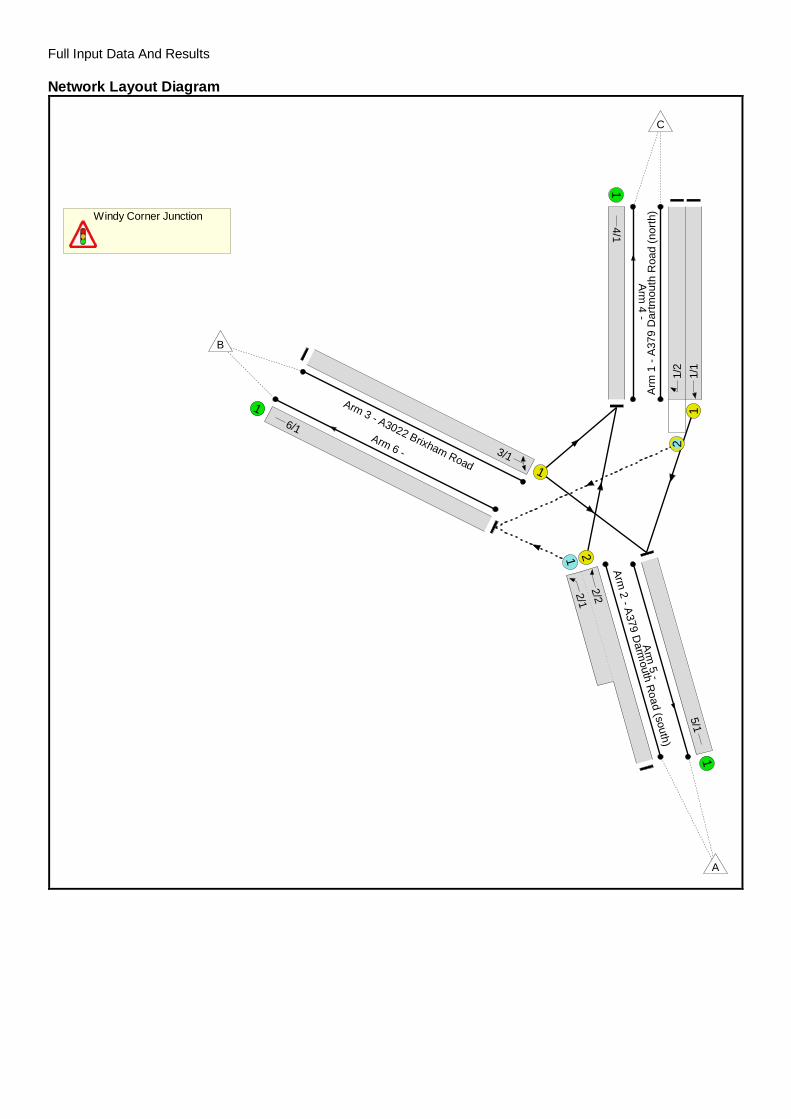
Full Input Data And Results
Network Layout Diagram
Windy Corner Junction
Arm
1-A
379
Dar
tmou
thR
oad
(nor
th)
12
1/1
1/2
Arm2
- A379
Darm
outhR
oad(south)
1 22/1
2/2
Arm 3 - A3022 Brixham Road 13/1
Arm
4-
14/1
Arm
5-
15/1
Arm 6 -
16/1
A
B
C

Full Input Data And Results
Phase Diagram
A
B
C D
Full Input Data And Results
Phase Input DataPhase Name Phase Type Assoc. Phase Street Min Cont Min
A Traffic 7 7
B Traffic 7 7
C Traffic 7 7
D Ind. Arrow A 4 4
Phase Intergreens MatrixStarting Phase
TerminatingPhase
A B C D
A - - 5 -
B - - 6 3
C 5 7 - 5
D - 6 5 -
Phases in StageStage No. Phases in Stage
1 A B
2 A D
3 C
Stage DiagramA
B
C D1 Min >= 7
A
B
C D2 Min >= 4
A
B
C D3 Min >= 7
Phase DelaysTerm. Stage Start Stage Phase Type Value Cont value
1 3 A Losing 1 1
Prohibited Stage ChangeTo Stage
FromStage
1 2 3
1 3 6
2 6 5
3 7 5

Full Input Data And ResultsGive-Way Lane Input DataJunction: Windy Corner Junction
Lane MovementMax Flow
whenGiving Way
(PCU/Hr)
Min Flowwhen
Giving Way(PCU/Hr)
OpposingLane
Opp. LaneCoeff.
Opp.Mvmnts.
Right TurnStorage (PCU)
Non-BlockingStorage(PCU)
RTF Right TurnMove up (s)
Max Turnsin Intergreen
(PCU)
1/2(A379 Dartmouth Road (north)) 6/1 (Right) 1439 0
2/1 1.09 All3.00 - 0.50 3 2.00
2/2 1.09 All
2/1(A379 Darmouth Road (south)) 6/1 (Left) 1940 0 1/2 1.09 All - - - - -
Full Input Data And ResultsLane Input DataJunction: Windy Corner Junction
Lane LaneType Phases Start
Disp.EndDisp.
PhysicalLength(PCU)
SatFlowType
Def UserSaturation
Flow(PCU/Hr)
LaneWidth
(m)Gradient Nearside
Lane TurnsTurningRadius
(m)
1/1(A379
DartmouthRoad (north))
U A 2 3 10.0 Geom - 3.10 0.00 Y Arm 5Ahead Inf
1/2(A379
DartmouthRoad (north))
O A D 2 3 10.4 Geom - 3.00 0.00 Y Arm 6Right 9.30
2/1(A379
DarmouthRoad (south))
O 2 3 10.4 Geom - 4.20 0.00 Y Arm 6Left 48.20
2/2(A379
DarmouthRoad (south))
U B 2 3 60.0 Geom - 3.50 0.00 Y Arm 4Ahead Inf
3/1(A3022BrixhamRoad)
U C 2 3 60.0 Geom - 3.60 0.00 Y
Arm 4Left 8.90
Arm 5Right 22.10
4/1 U 2 3 60.0 Inf - - - - - -
5/1 U 2 3 60.0 Inf - - - - - -
6/1 U 2 3 60.0 Inf - - - - - -
Traffic Flow GroupsFlow Group Start Time End Time Duration Formula
1: '2017 Base AM' 08:00 09:00 01:00
2: '2017 Base PM' 17:00 18:00 01:00
17: 'TA 2019 AM' 08:00 09:00 01:00 F1+F13
18: 'TA 2019 PM' 17:00 18:00 01:00 F2+F14
21: 'TA 2024 AM' 08:00 09:00 01:00 F1+F15
22: 'TA 2024 PM' 17:00 18:00 01:00 F2+F16
Scenario 1: '2017 Base AM' (FG1: '2017 Base AM', Plan 1: 'Network Control Plan 1')Traffic Flows, DesiredDesired Flow :
Destination
Origin
A B C Tot.
A 0 756 604 1360
B 505 0 27 532
C 668 56 0 724
Tot. 1173 812 631 2616

Full Input Data And Results
Traffic Lane Flows
Lane Scenario 1:2017 Base AM
Junction: Windy Corner Junction
1/1 668
1/2 56
2/1(short) 756
2/2(with short)
1360(In)604(Out)
3/1 532
4/1 631
5/1 1173
6/1 812
Lane Saturation FlowsJunction: Windy Corner Junction
LaneLaneWidth
(m)Gradient Nearside
LaneAllowedTurns
TurningRadius
(m)Turning
Prop.Sat Flow(PCU/Hr)
Flared Sat Flow(PCU/Hr)
1/1(A379 Dartmouth Road (north)) 3.10 0.00 Y Arm 5 Ahead Inf 100.0 % 1925 1925
1/2(A379 Dartmouth Road (north)) 3.00 0.00 Y Arm 6 Right 9.30 100.0 % 1649 1649
2/1(A379 Darmouth Road (south)) 4.20 0.00 Y Arm 6 Left 48.20 100.0 % 1974 1974
2/2(A379 Darmouth Road (south)) 3.50 0.00 Y Arm 4 Ahead Inf 100.0 % 1965 1965
3/1(A3022 Brixham Road) 3.60 0.00 Y
Arm 4 Left 8.90 5.1 %1841 1841
Arm 5 Right 22.10 94.9 %
4/1 Infinite Saturation Flow Inf Inf
5/1 Infinite Saturation Flow Inf Inf
6/1 Infinite Saturation Flow Inf Inf
Scenario 2: '2017 Base PM' (FG2: '2017 Base PM', Plan 1: 'Network Control Plan 1')Traffic Flows, DesiredDesired Flow :
Destination
Origin
A B C Tot.
A 0 659 540 1199
B 717 0 63 780
C 587 45 0 632
Tot. 1304 704 603 2611

Full Input Data And Results
Traffic Lane Flows
Lane Scenario 2:2017 Base PM
Junction: Windy Corner Junction
1/1 587
1/2 45
2/1(short) 659
2/2(with short)
1199(In)540(Out)
3/1 780
4/1 603
5/1 1304
6/1 704
Lane Saturation FlowsJunction: Windy Corner Junction
LaneLaneWidth
(m)Gradient Nearside
LaneAllowedTurns
TurningRadius
(m)Turning
Prop.Sat Flow(PCU/Hr)
Flared Sat Flow(PCU/Hr)
1/1(A379 Dartmouth Road (north)) 3.10 0.00 Y Arm 5 Ahead Inf 100.0 % 1925 1925
1/2(A379 Dartmouth Road (north)) 3.00 0.00 Y Arm 6 Right 9.30 100.0 % 1649 1649
2/1(A379 Darmouth Road (south)) 4.20 0.00 Y Arm 6 Left 48.20 100.0 % 1974 1974
2/2(A379 Darmouth Road (south)) 3.50 0.00 Y Arm 4 Ahead Inf 100.0 % 1965 1965
3/1(A3022 Brixham Road) 3.60 0.00 Y
Arm 4 Left 8.90 8.1 %1835 1835
Arm 5 Right 22.10 91.9 %
4/1 Infinite Saturation Flow Inf Inf
5/1 Infinite Saturation Flow Inf Inf
6/1 Infinite Saturation Flow Inf Inf
Scenario 11: 'TA 2019 AM' (FG17: 'TA 2019 AM', Plan 1: 'Network Control Plan 1')Traffic Flows, DesiredDesired Flow :
Destination
Origin
A B C Tot.
A 0 929 604 1533
B 562 0 28 590
C 668 56 0 724
Tot. 1230 985 632 2847
Full Input Data And Results
Traffic Lane Flows
Lane Scenario 11:TA 2019 AM
Junction: Windy Corner Junction
1/1 668
1/2 56
2/1(short) 929
2/2(with short)
1533(In)604(Out)
3/1 590
4/1 632
5/1 1230
6/1 985
Lane Saturation FlowsJunction: Windy Corner Junction
LaneLaneWidth
(m)Gradient Nearside
LaneAllowedTurns
TurningRadius
(m)Turning
Prop.Sat Flow(PCU/Hr)
Flared Sat Flow(PCU/Hr)
1/1(A379 Dartmouth Road (north)) 3.10 0.00 Y Arm 5 Ahead Inf 100.0 % 1925 1925
1/2(A379 Dartmouth Road (north)) 3.00 0.00 Y Arm 6 Right 9.30 100.0 % 1649 1649
2/1(A379 Darmouth Road (south)) 4.20 0.00 Y Arm 6 Left 48.20 100.0 % 1974 1974
2/2(A379 Darmouth Road (south)) 3.50 0.00 Y Arm 4 Ahead Inf 100.0 % 1965 1965
3/1(A3022 Brixham Road) 3.60 0.00 Y
Arm 4 Left 8.90 4.7 %1841 1841
Arm 5 Right 22.10 95.3 %
4/1 Infinite Saturation Flow Inf Inf
5/1 Infinite Saturation Flow Inf Inf
6/1 Infinite Saturation Flow Inf Inf
Scenario 12: 'TA 2019 PM' (FG18: 'TA 2019 PM', Plan 1: 'Network Control Plan 1')Traffic Flows, DesiredDesired Flow :
Destination
Origin
A B C Tot.
A 0 776 540 1316
B 848 0 65 913
C 587 47 0 634
Tot. 1435 823 605 2863
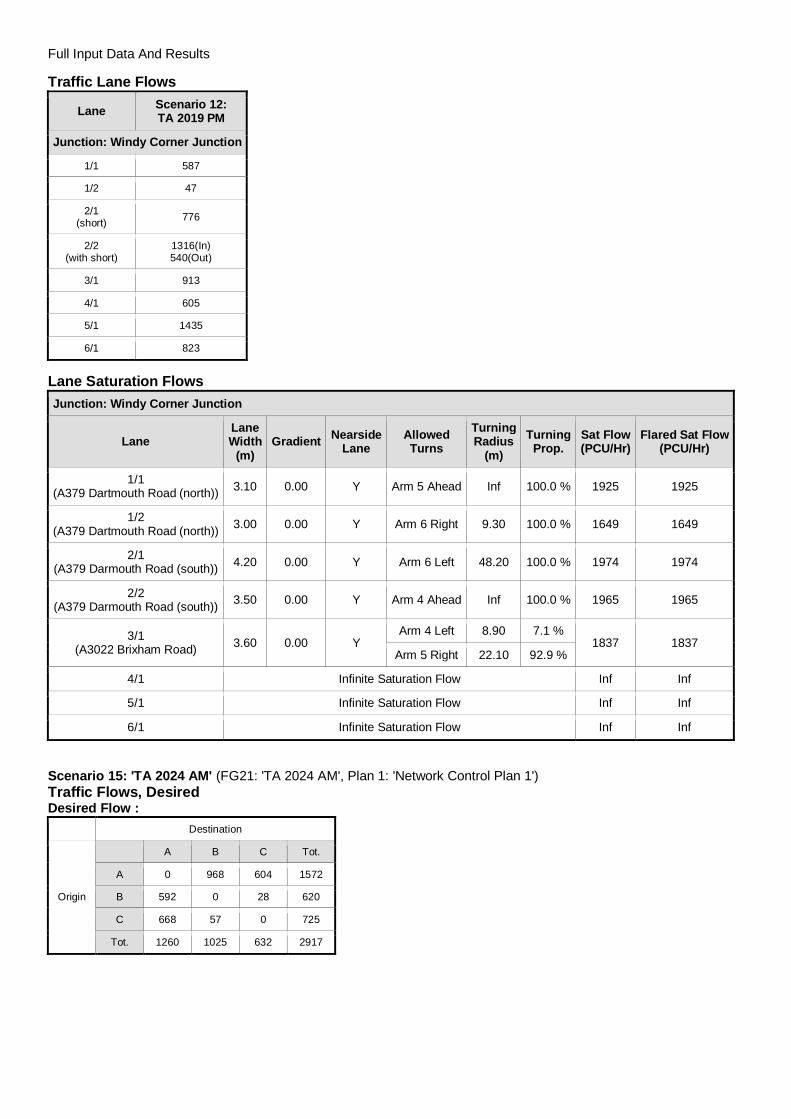
Full Input Data And Results
Traffic Lane Flows
Lane Scenario 12:TA 2019 PM
Junction: Windy Corner Junction
1/1 587
1/2 47
2/1(short) 776
2/2(with short)
1316(In)540(Out)
3/1 913
4/1 605
5/1 1435
6/1 823
Lane Saturation FlowsJunction: Windy Corner Junction
LaneLaneWidth
(m)Gradient Nearside
LaneAllowedTurns
TurningRadius
(m)Turning
Prop.Sat Flow(PCU/Hr)
Flared Sat Flow(PCU/Hr)
1/1(A379 Dartmouth Road (north)) 3.10 0.00 Y Arm 5 Ahead Inf 100.0 % 1925 1925
1/2(A379 Dartmouth Road (north)) 3.00 0.00 Y Arm 6 Right 9.30 100.0 % 1649 1649
2/1(A379 Darmouth Road (south)) 4.20 0.00 Y Arm 6 Left 48.20 100.0 % 1974 1974
2/2(A379 Darmouth Road (south)) 3.50 0.00 Y Arm 4 Ahead Inf 100.0 % 1965 1965
3/1(A3022 Brixham Road) 3.60 0.00 Y
Arm 4 Left 8.90 7.1 %1837 1837
Arm 5 Right 22.10 92.9 %
4/1 Infinite Saturation Flow Inf Inf
5/1 Infinite Saturation Flow Inf Inf
6/1 Infinite Saturation Flow Inf Inf
Scenario 15: 'TA 2024 AM' (FG21: 'TA 2024 AM', Plan 1: 'Network Control Plan 1')Traffic Flows, DesiredDesired Flow :
Destination
Origin
A B C Tot.
A 0 968 604 1572
B 592 0 28 620
C 668 57 0 725
Tot. 1260 1025 632 2917

Full Input Data And Results
Traffic Lane Flows
Lane Scenario 15:TA 2024 AM
Junction: Windy Corner Junction
1/1 668
1/2 57
2/1(short) 968
2/2(with short)
1572(In)604(Out)
3/1 620
4/1 632
5/1 1260
6/1 1025
Lane Saturation FlowsJunction: Windy Corner Junction
LaneLaneWidth
(m)Gradient Nearside
LaneAllowedTurns
TurningRadius
(m)Turning
Prop.Sat Flow(PCU/Hr)
Flared Sat Flow(PCU/Hr)
1/1(A379 Dartmouth Road (north)) 3.10 0.00 Y Arm 5 Ahead Inf 100.0 % 1925 1925
1/2(A379 Dartmouth Road (north)) 3.00 0.00 Y Arm 6 Right 9.30 100.0 % 1649 1649
2/1(A379 Darmouth Road (south)) 4.20 0.00 Y Arm 6 Left 48.20 100.0 % 1974 1974
2/2(A379 Darmouth Road (south)) 3.50 0.00 Y Arm 4 Ahead Inf 100.0 % 1965 1965
3/1(A3022 Brixham Road) 3.60 0.00 Y
Arm 4 Left 8.90 4.5 %1842 1842
Arm 5 Right 22.10 95.5 %
4/1 Infinite Saturation Flow Inf Inf
5/1 Infinite Saturation Flow Inf Inf
6/1 Infinite Saturation Flow Inf Inf
Scenario 16: 'TA 2024 PM' (FG22: 'TA 2024 PM', Plan 1: 'Network Control Plan 1')Traffic Flows, DesiredDesired Flow :
Destination
Origin
A B C Tot.
A 0 833 540 1373
B 888 0 65 953
C 587 47 0 634
Tot. 1475 880 605 2960
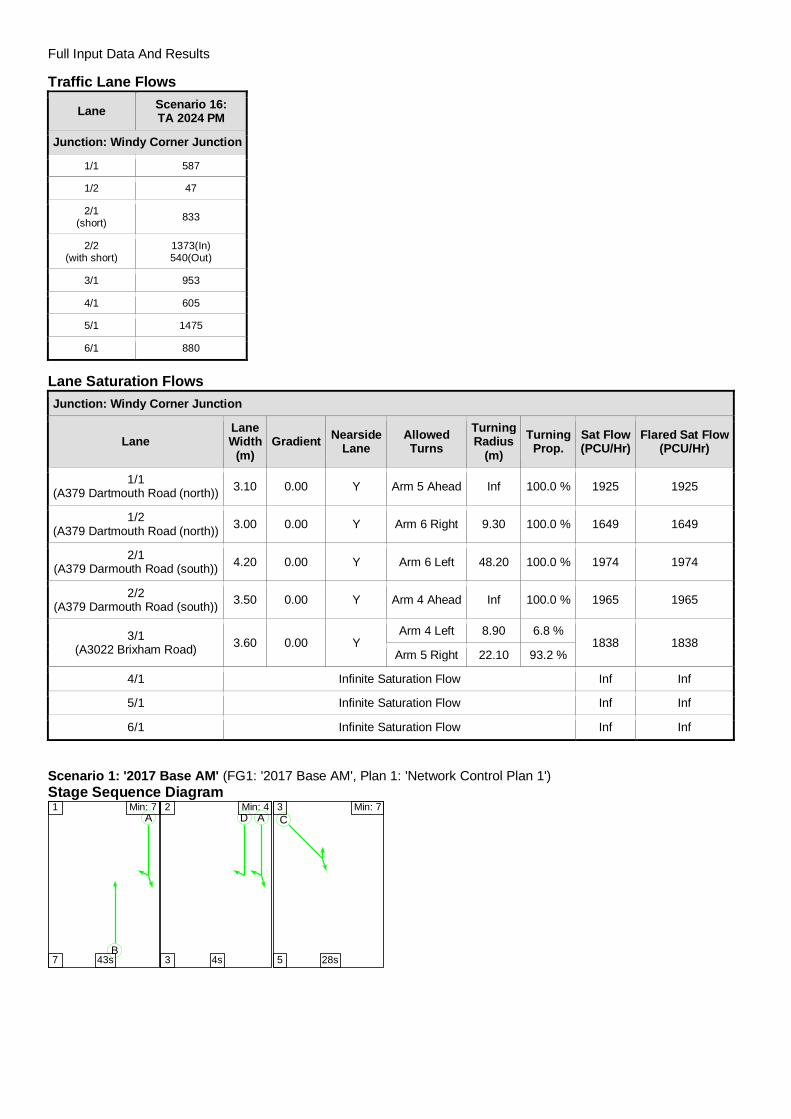
Full Input Data And Results
Traffic Lane Flows
Lane Scenario 16:TA 2024 PM
Junction: Windy Corner Junction
1/1 587
1/2 47
2/1(short) 833
2/2(with short)
1373(In)540(Out)
3/1 953
4/1 605
5/1 1475
6/1 880
Lane Saturation FlowsJunction: Windy Corner Junction
LaneLaneWidth
(m)Gradient Nearside
LaneAllowedTurns
TurningRadius
(m)Turning
Prop.Sat Flow(PCU/Hr)
Flared Sat Flow(PCU/Hr)
1/1(A379 Dartmouth Road (north)) 3.10 0.00 Y Arm 5 Ahead Inf 100.0 % 1925 1925
1/2(A379 Dartmouth Road (north)) 3.00 0.00 Y Arm 6 Right 9.30 100.0 % 1649 1649
2/1(A379 Darmouth Road (south)) 4.20 0.00 Y Arm 6 Left 48.20 100.0 % 1974 1974
2/2(A379 Darmouth Road (south)) 3.50 0.00 Y Arm 4 Ahead Inf 100.0 % 1965 1965
3/1(A3022 Brixham Road) 3.60 0.00 Y
Arm 4 Left 8.90 6.8 %1838 1838
Arm 5 Right 22.10 93.2 %
4/1 Infinite Saturation Flow Inf Inf
5/1 Infinite Saturation Flow Inf Inf
6/1 Infinite Saturation Flow Inf Inf
Scenario 1: '2017 Base AM' (FG1: '2017 Base AM', Plan 1: 'Network Control Plan 1')Stage Sequence Diagram
A
B
1 Min: 7
7 43s
AD2 Min: 4
3 4s
C3 Min: 7
5 28s
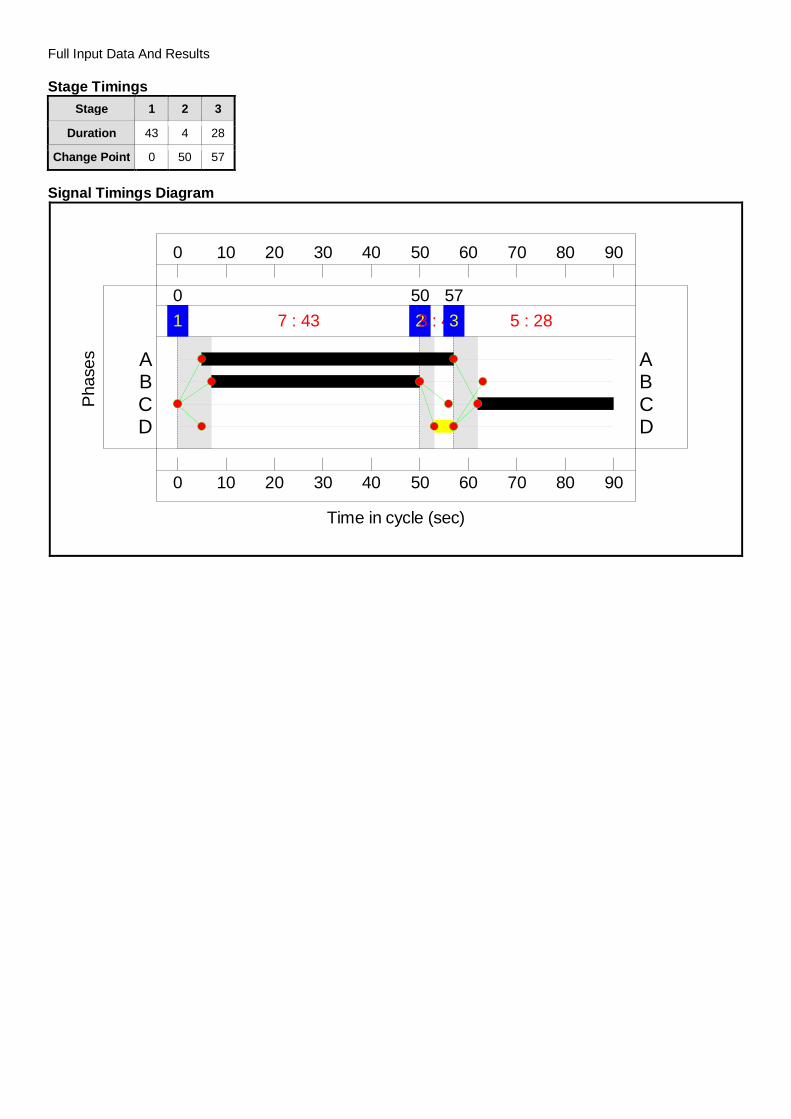
Full Input Data And Results
Stage TimingsStage 1 2 3
Duration 43 4 28
Change Point 0 50 57
Signal Timings Diagram
0
0
10
10
20
20
30
30
40
40
50
50
60
60
70
70
80
80
90
90
Time in cycle (sec)
Pha
ses
1 7 : 430
23 : 450
3 5 : 2857
D DC CB BA A
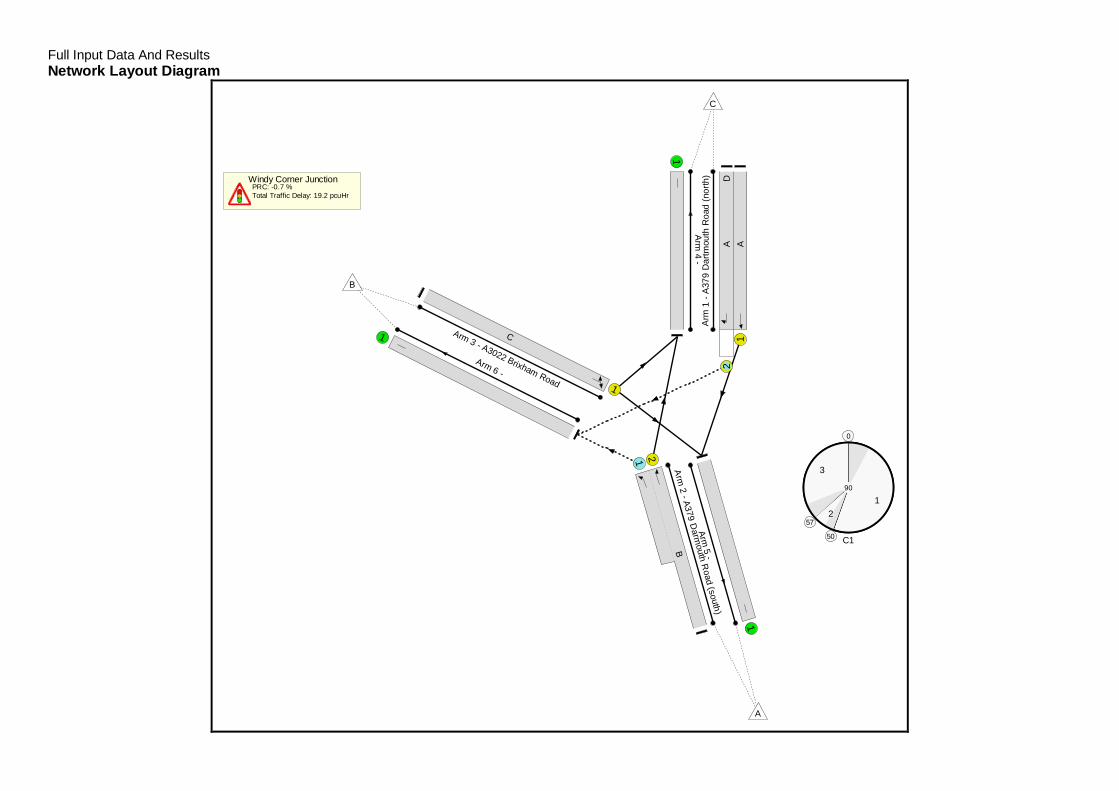
Full Input Data And ResultsNetwork Layout Diagram
Windy Corner JunctionPRC: -0.7 %Total Traffic Delay: 19.2 pcuHr
C1
0
1
50
257
3
90
Arm
1-A
379
Dar
tmou
thR
oad
(nor
th)
12
AAD
Arm
2- A379
Darm
outhR
oad(south)
1 2
B
Arm 3 - A3022 Brixham Road 1
C
Arm
4-
1
Arm5
-
1Arm 6 -
1
A
B
C
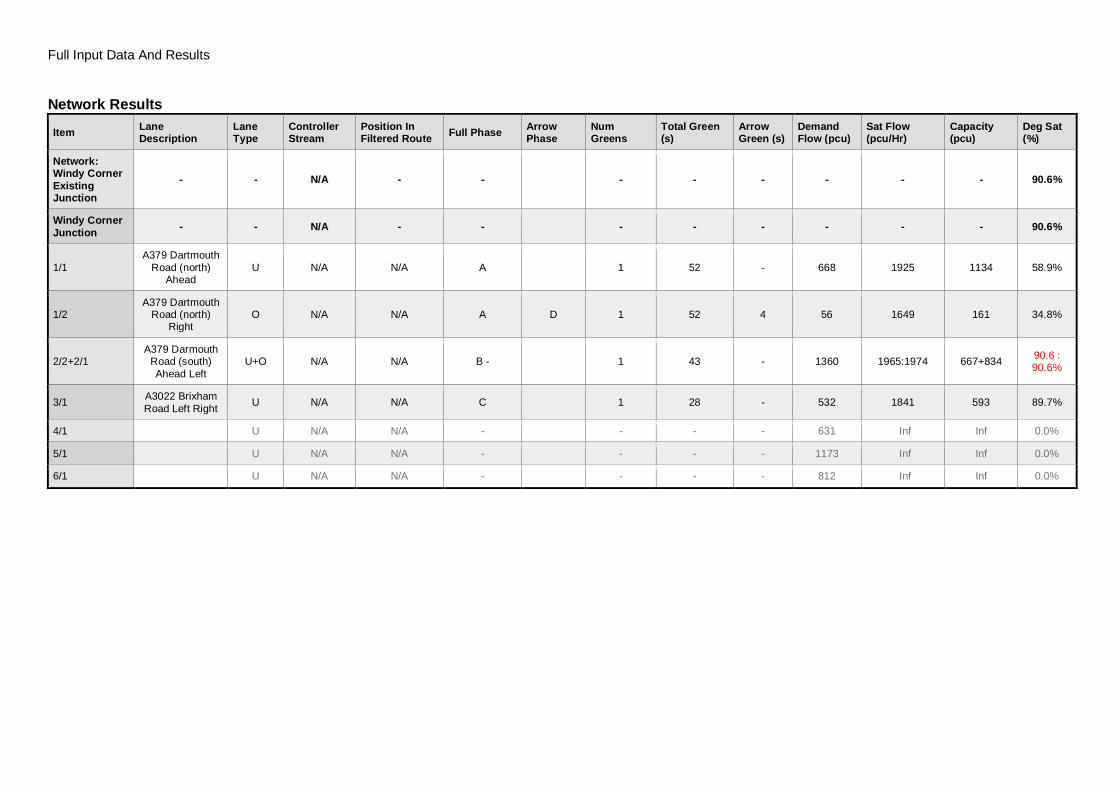
Full Input Data And Results
Network Results
Item LaneDescription
LaneType
ControllerStream
Position InFiltered Route Full Phase Arrow
PhaseNumGreens
Total Green(s)
ArrowGreen (s)
DemandFlow (pcu)
Sat Flow(pcu/Hr)
Capacity(pcu)
Deg Sat(%)
Network:Windy CornerExistingJunction
- - N/A - - - - - - - - 90.6%
Windy CornerJunction - - N/A - - - - - - - - 90.6%
1/1A379 Dartmouth
Road (north)Ahead
U N/A N/A A 1 52 - 668 1925 1134 58.9%
1/2A379 Dartmouth
Road (north)Right
O N/A N/A A D 1 52 4 56 1649 161 34.8%
2/2+2/1A379 Darmouth
Road (south)Ahead Left
U+O N/A N/A B - 1 43 - 1360 1965:1974 667+834 90.6 :90.6%
3/1 A3022 BrixhamRoad Left Right U N/A N/A C 1 28 - 532 1841 593 89.7%
4/1 U N/A N/A - - - - 631 Inf Inf 0.0%
5/1 U N/A N/A - - - - 1173 Inf Inf 0.0%
6/1 U N/A N/A - - - - 812 Inf Inf 0.0%

Full Input Data And Results
Item Arriving (pcu) Leaving(pcu)
Turners InGaps (pcu)
Turners WhenUnopposed(pcu)
Turners InIntergreen(pcu)
UniformDelay(pcuHr)
Rand +OversatDelay(pcuHr)
Storage AreaUniformDelay(pcuHr)
TotalDelay(pcuHr)
Av. DelayPer PCU(s/pcu)
Max. Back ofUniformQueue (pcu)
Rand +OversatQueue (pcu)
MeanMaxQueue(pcu)
Network:Windy CornerExistingJunction
- - 501 311 0 9.5 9.4 0.4 19.2 - - - -
Windy CornerJunction - - 501 311 0 9.5 9.4 0.4 19.2 - - - -
1/1 668 668 - - - 2.2 0.7 - 2.9 15.5 10.4 0.7 11.1
1/2 56 56 56 0 0 0.1 0.3 0.4 0.8 51.8 0.6 0.3 0.9
2/2+2/1 1360 1360 445 311 0 2.9 4.5 - 7.4 19.6 13.4 4.5 18.0
3/1 532 532 - - - 4.3 3.9 - 8.2 55.2 12.6 3.9 16.4
4/1 631 631 - - - 0.0 0.0 - 0.0 0.0 0.0 0.0 0.0
5/1 1173 1173 - - - 0.0 0.0 - 0.0 0.0 0.0 0.0 0.0
6/1 812 812 - - - 0.0 0.0 - 0.0 0.0 0.0 0.0 0.0
C1 PRC for Signalled Lanes (%): -0.7 Total Delay for Signalled Lanes (pcuHr): 19.25 Cycle Time (s): 90 PRC Over All Lanes (%): -0.7 Total Delay Over All Lanes(pcuHr): 19.25
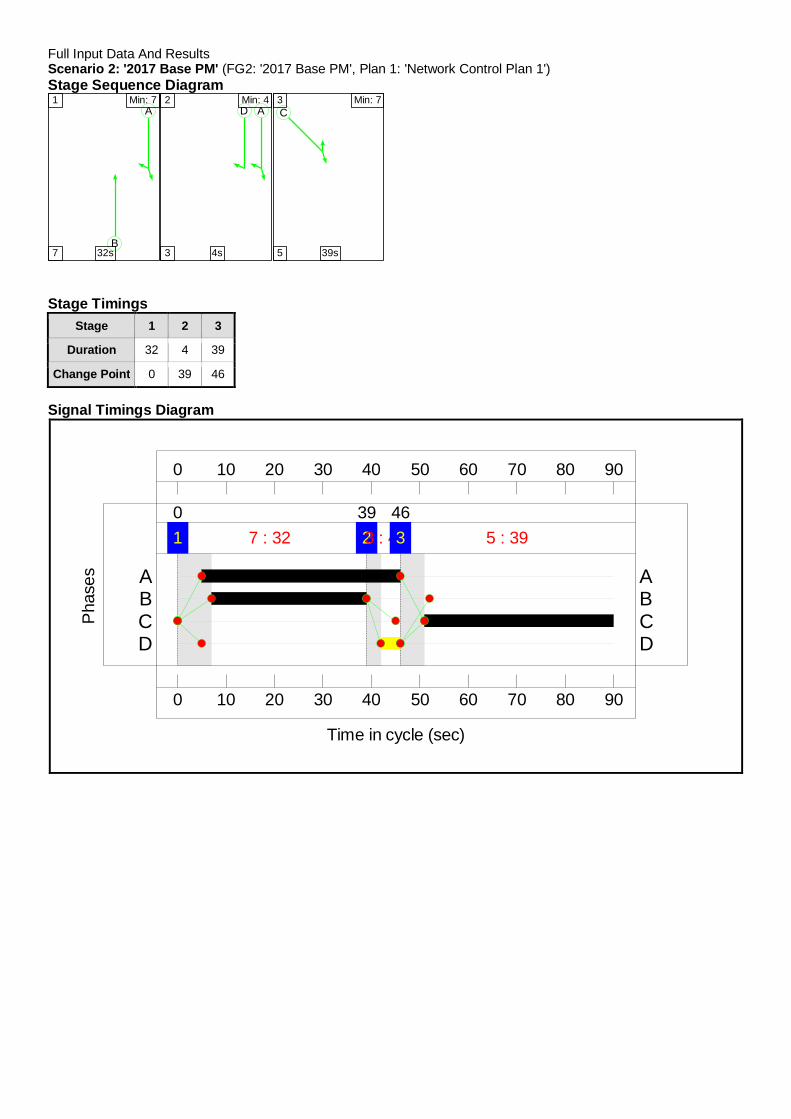
Full Input Data And ResultsScenario 2: '2017 Base PM' (FG2: '2017 Base PM', Plan 1: 'Network Control Plan 1')Stage Sequence Diagram
A
B
1 Min: 7
7 32s
AD2 Min: 4
3 4s
C3 Min: 7
5 39s
Stage TimingsStage 1 2 3
Duration 32 4 39
Change Point 0 39 46
Signal Timings Diagram
0
0
10
10
20
20
30
30
40
40
50
50
60
60
70
70
80
80
90
90
Time in cycle (sec)
Pha
ses
1 7 : 320
23 : 439
3 5 : 3946
D DC CB BA A
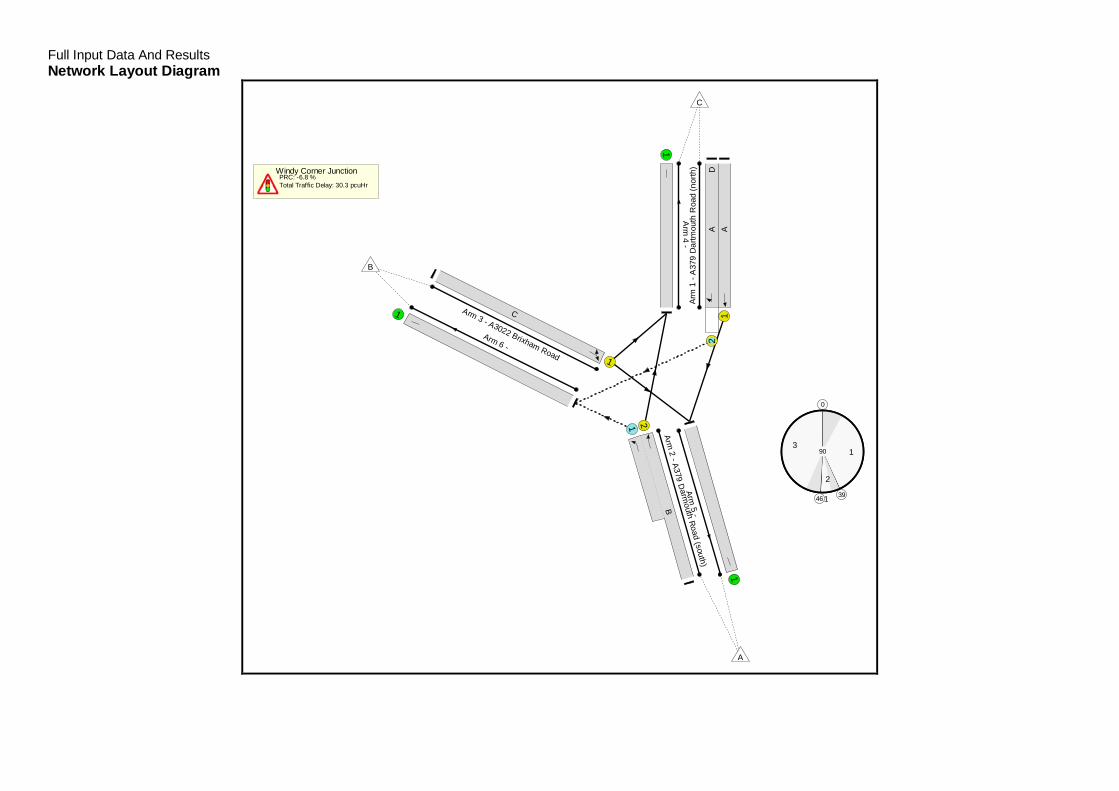
Full Input Data And ResultsNetwork Layout Diagram
Windy Corner JunctionPRC: -6.8 %Total Traffic Delay: 30.3 pcuHr
C1
0
1
39
2
46
390
Arm
1- A
379
Dar
tmou
thR
oad
(nor
th)
12
AAD
Arm2
- A379D
armouth
Road(south)
1 2
B
Arm 3 - A3022 Brixham Road 1
C
Arm
4-
1
Arm5
-
1
Arm 6 -
1
A
B
C
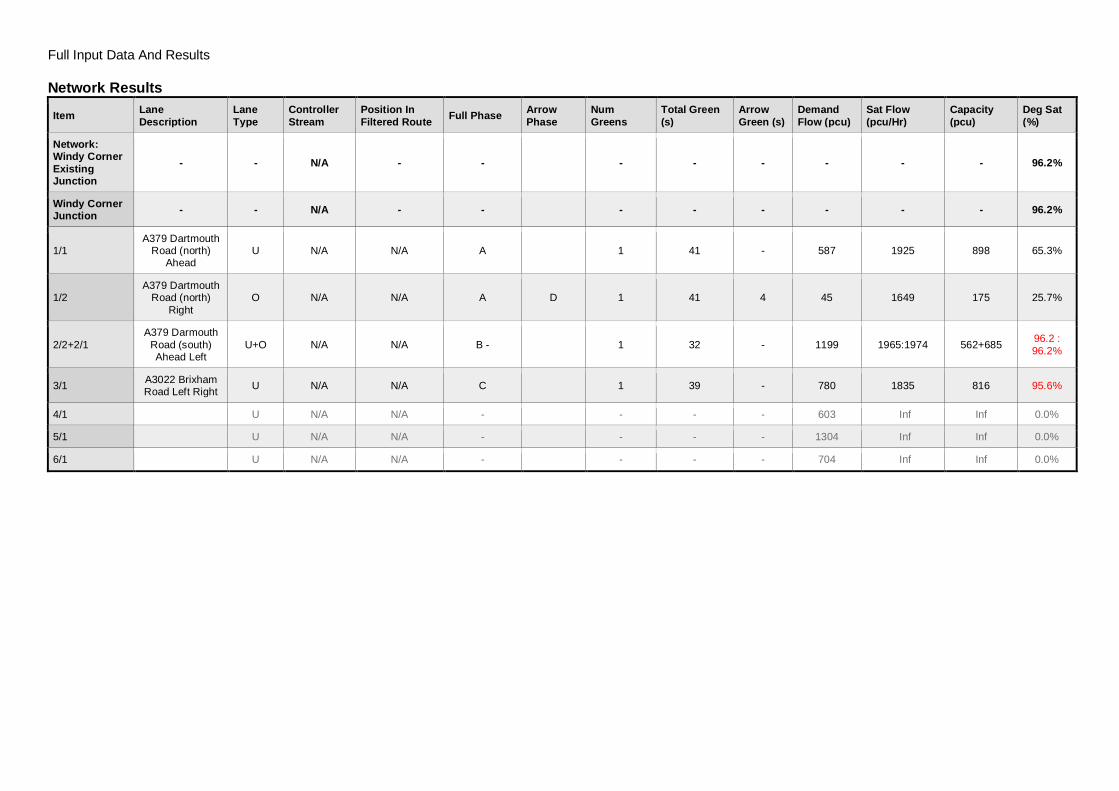
Full Input Data And Results
Network Results
Item LaneDescription
LaneType
ControllerStream
Position InFiltered Route Full Phase Arrow
PhaseNumGreens
Total Green(s)
ArrowGreen (s)
DemandFlow (pcu)
Sat Flow(pcu/Hr)
Capacity(pcu)
Deg Sat(%)
Network:Windy CornerExistingJunction
- - N/A - - - - - - - - 96.2%
Windy CornerJunction - - N/A - - - - - - - - 96.2%
1/1A379 Dartmouth
Road (north)Ahead
U N/A N/A A 1 41 - 587 1925 898 65.3%
1/2A379 Dartmouth
Road (north)Right
O N/A N/A A D 1 41 4 45 1649 175 25.7%
2/2+2/1A379 Darmouth
Road (south)Ahead Left
U+O N/A N/A B - 1 32 - 1199 1965:1974 562+685 96.2 :96.2%
3/1 A3022 BrixhamRoad Left Right U N/A N/A C 1 39 - 780 1835 816 95.6%
4/1 U N/A N/A - - - - 603 Inf Inf 0.0%
5/1 U N/A N/A - - - - 1304 Inf Inf 0.0%
6/1 U N/A N/A - - - - 704 Inf Inf 0.0%
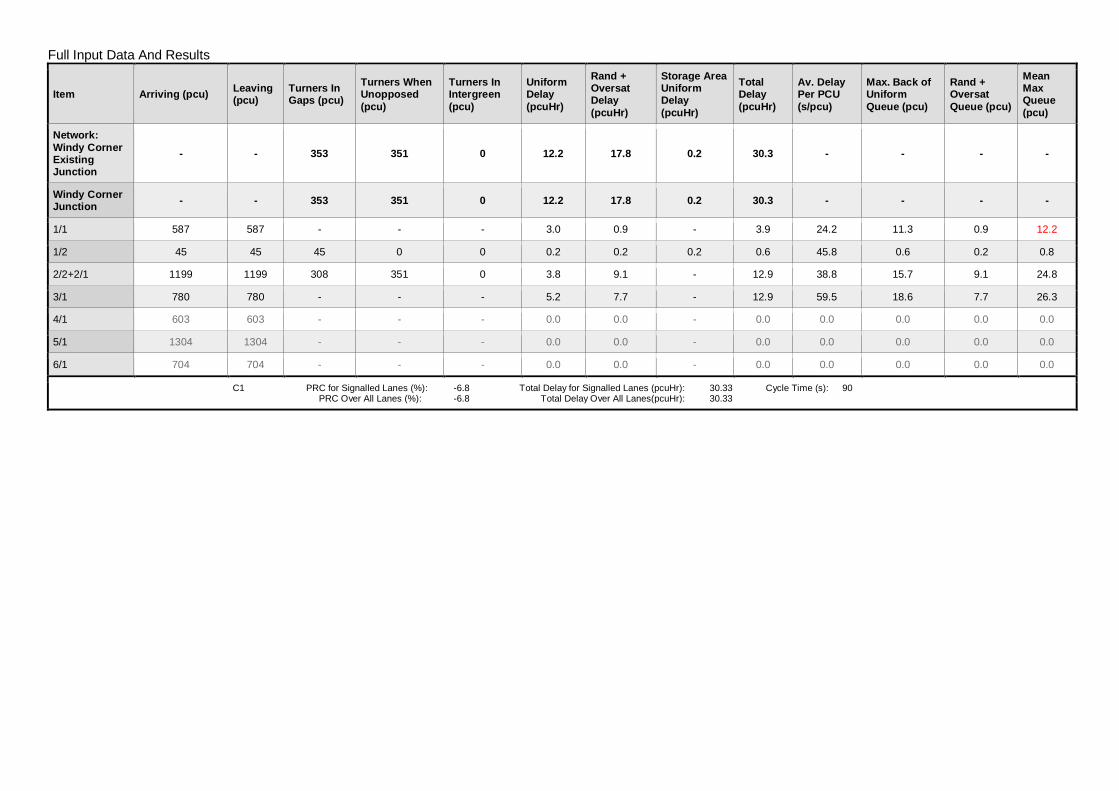
Full Input Data And Results
Item Arriving (pcu) Leaving(pcu)
Turners InGaps (pcu)
Turners WhenUnopposed(pcu)
Turners InIntergreen(pcu)
UniformDelay(pcuHr)
Rand +OversatDelay(pcuHr)
Storage AreaUniformDelay(pcuHr)
TotalDelay(pcuHr)
Av. DelayPer PCU(s/pcu)
Max. Back ofUniformQueue (pcu)
Rand +OversatQueue (pcu)
MeanMaxQueue(pcu)
Network:Windy CornerExistingJunction
- - 353 351 0 12.2 17.8 0.2 30.3 - - - -
Windy CornerJunction - - 353 351 0 12.2 17.8 0.2 30.3 - - - -
1/1 587 587 - - - 3.0 0.9 - 3.9 24.2 11.3 0.9 12.2
1/2 45 45 45 0 0 0.2 0.2 0.2 0.6 45.8 0.6 0.2 0.8
2/2+2/1 1199 1199 308 351 0 3.8 9.1 - 12.9 38.8 15.7 9.1 24.8
3/1 780 780 - - - 5.2 7.7 - 12.9 59.5 18.6 7.7 26.3
4/1 603 603 - - - 0.0 0.0 - 0.0 0.0 0.0 0.0 0.0
5/1 1304 1304 - - - 0.0 0.0 - 0.0 0.0 0.0 0.0 0.0
6/1 704 704 - - - 0.0 0.0 - 0.0 0.0 0.0 0.0 0.0
C1 PRC for Signalled Lanes (%): -6.8 Total Delay for Signalled Lanes (pcuHr): 30.33 Cycle Time (s): 90 PRC Over All Lanes (%): -6.8 Total Delay Over All Lanes(pcuHr): 30.33
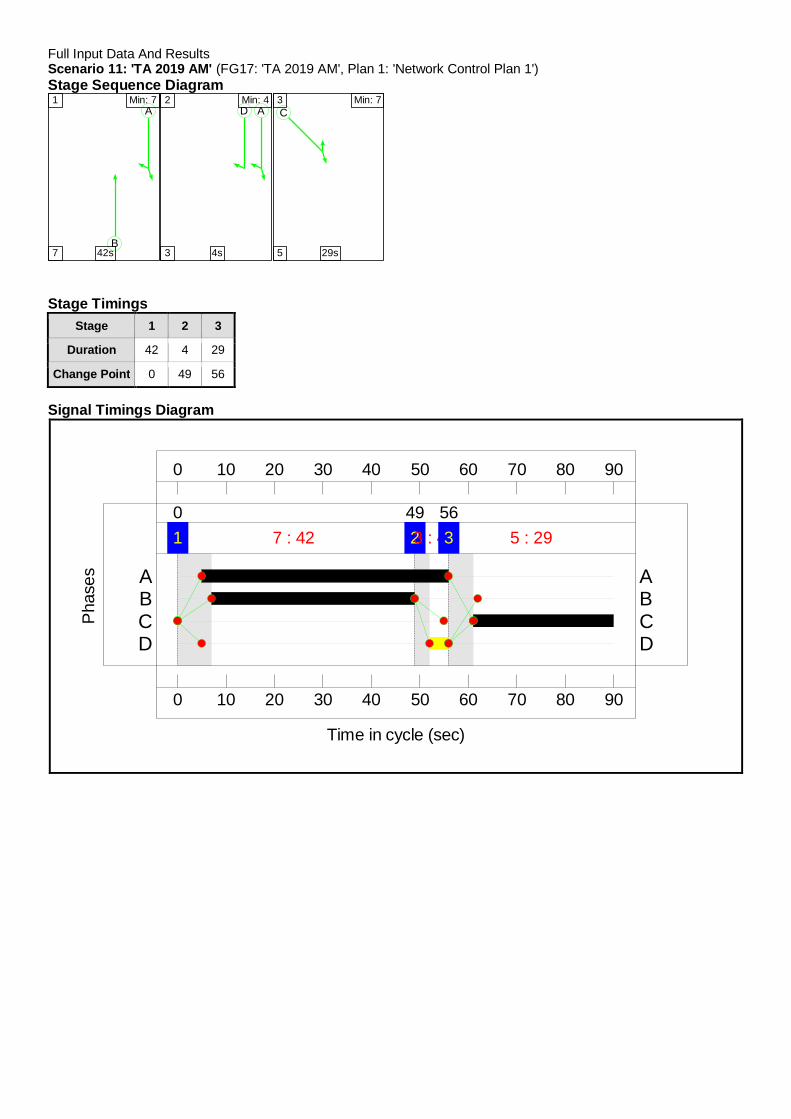
Full Input Data And ResultsScenario 11: 'TA 2019 AM' (FG17: 'TA 2019 AM', Plan 1: 'Network Control Plan 1')Stage Sequence Diagram
A
B
1 Min: 7
7 42s
AD2 Min: 4
3 4s
C3 Min: 7
5 29s
Stage TimingsStage 1 2 3
Duration 42 4 29
Change Point 0 49 56
Signal Timings Diagram
0
0
10
10
20
20
30
30
40
40
50
50
60
60
70
70
80
80
90
90
Time in cycle (sec)
Pha
ses
1 7 : 420
23 : 449
3 5 : 2956
D DC CB BA A

Full Input Data And ResultsNetwork Layout Diagram
Windy Corner JunctionPRC: -6.8 %Total Traffic Delay: 28.5 pcuHr
C1
0
1
49
256
3
90
Arm
1-A
379
Dar
tmou
thR
oad
(nor
th)
12
AAD
Arm2
- A379D
armouth
Road
(south)
1 2
B
Arm 3 - A3022 Brixham Road 1
C
Arm
4-
1
Arm5
-
1
Arm 6 -
1
A
B
C

Full Input Data And Results
Network Results
Item LaneDescription
LaneType
ControllerStream
Position InFiltered Route Full Phase Arrow
PhaseNumGreens
Total Green(s)
ArrowGreen (s)
DemandFlow (pcu)
Sat Flow(pcu/Hr)
Capacity(pcu)
Deg Sat(%)
Network:Windy CornerExistingJunction
- - N/A - - - - - - - - 96.1%
Windy CornerJunction - - N/A - - - - - - - - 96.1%
1/1A379 Dartmouth
Road (north)Ahead
U N/A N/A A 1 51 - 668 1925 1112 60.1%
1/2A379 Dartmouth
Road (north)Right
O N/A N/A A D 1 51 4 56 1649 148 37.7%
2/2+2/1A379 Darmouth
Road (south)Ahead Left
U+O N/A N/A B - 1 42 - 1533 1965:1974 630+969 95.9 :95.9%
3/1 A3022 BrixhamRoad Left Right U N/A N/A C 1 29 - 590 1841 614 96.1%
4/1 U N/A N/A - - - - 632 Inf Inf 0.0%
5/1 U N/A N/A - - - - 1230 Inf Inf 0.0%
6/1 U N/A N/A - - - - 985 Inf Inf 0.0%
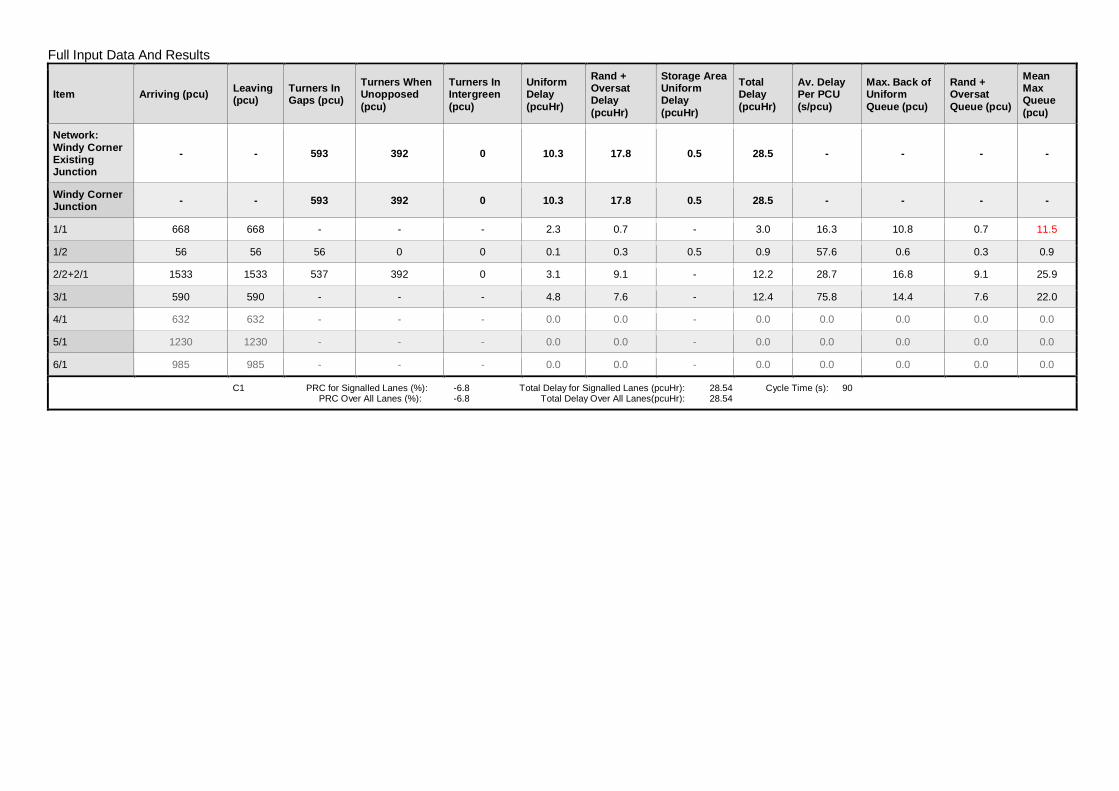
Full Input Data And Results
Item Arriving (pcu) Leaving(pcu)
Turners InGaps (pcu)
Turners WhenUnopposed(pcu)
Turners InIntergreen(pcu)
UniformDelay(pcuHr)
Rand +OversatDelay(pcuHr)
Storage AreaUniformDelay(pcuHr)
TotalDelay(pcuHr)
Av. DelayPer PCU(s/pcu)
Max. Back ofUniformQueue (pcu)
Rand +OversatQueue (pcu)
MeanMaxQueue(pcu)
Network:Windy CornerExistingJunction
- - 593 392 0 10.3 17.8 0.5 28.5 - - - -
Windy CornerJunction - - 593 392 0 10.3 17.8 0.5 28.5 - - - -
1/1 668 668 - - - 2.3 0.7 - 3.0 16.3 10.8 0.7 11.5
1/2 56 56 56 0 0 0.1 0.3 0.5 0.9 57.6 0.6 0.3 0.9
2/2+2/1 1533 1533 537 392 0 3.1 9.1 - 12.2 28.7 16.8 9.1 25.9
3/1 590 590 - - - 4.8 7.6 - 12.4 75.8 14.4 7.6 22.0
4/1 632 632 - - - 0.0 0.0 - 0.0 0.0 0.0 0.0 0.0
5/1 1230 1230 - - - 0.0 0.0 - 0.0 0.0 0.0 0.0 0.0
6/1 985 985 - - - 0.0 0.0 - 0.0 0.0 0.0 0.0 0.0
C1 PRC for Signalled Lanes (%): -6.8 Total Delay for Signalled Lanes (pcuHr): 28.54 Cycle Time (s): 90 PRC Over All Lanes (%): -6.8 Total Delay Over All Lanes(pcuHr): 28.54
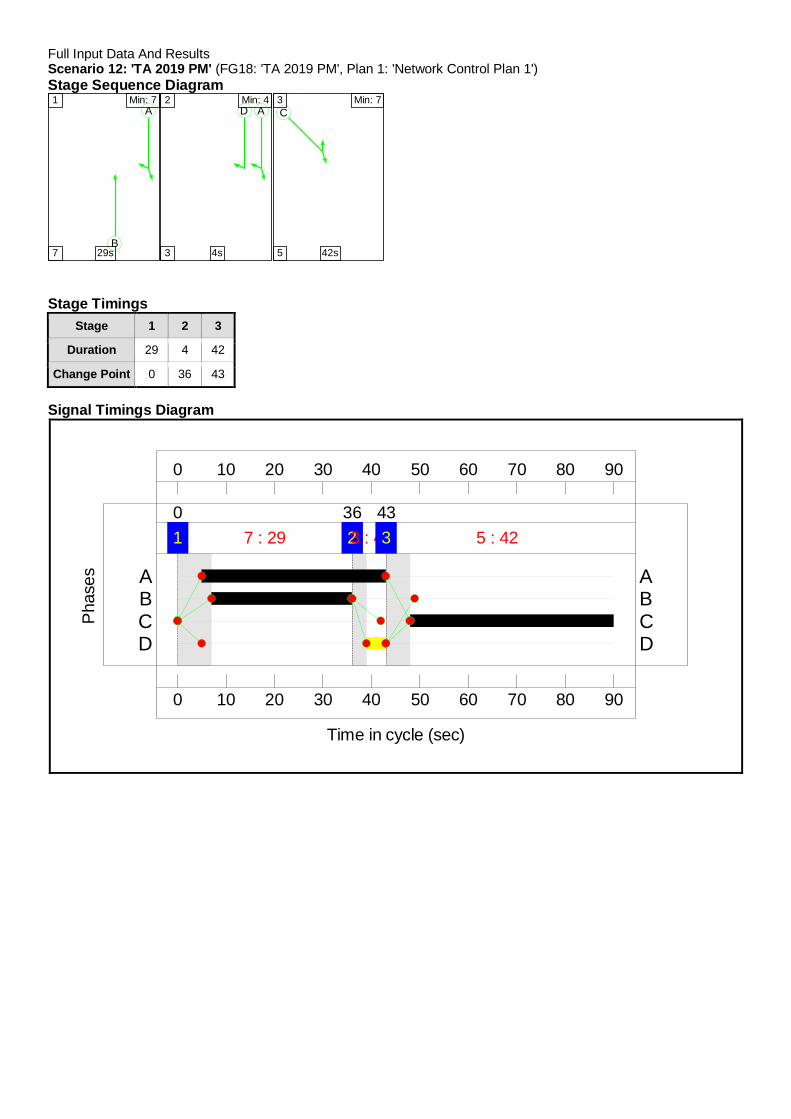
Full Input Data And ResultsScenario 12: 'TA 2019 PM' (FG18: 'TA 2019 PM', Plan 1: 'Network Control Plan 1')Stage Sequence Diagram
A
B
1 Min: 7
7 29s
AD2 Min: 4
3 4s
C3 Min: 7
5 42s
Stage TimingsStage 1 2 3
Duration 29 4 42
Change Point 0 36 43
Signal Timings Diagram
0
0
10
10
20
20
30
30
40
40
50
50
60
60
70
70
80
80
90
90
Time in cycle (sec)
Pha
ses
1 7 : 290
23 : 436
3 5 : 4243
D DC CB BA A

Full Input Data And ResultsNetwork Layout Diagram
Windy Corner JunctionPRC: -15.6 %Total Traffic Delay: 77.3 pcuHr
C1
0
1
36
2
43
3 90
Arm
1- A
379
Dar
tmou
thR
oad
(nor
th)
12
AAD
Arm2
- A379D
armouth
Road(south)
1 2
B
Arm 3 - A3022 Brixham Road 1
C
Arm
4-
1
Arm5
-
1
Arm 6 -
1
A
B
C

Full Input Data And Results
Network Results
Item LaneDescription
LaneType
ControllerStream
Position InFiltered Route Full Phase Arrow
PhaseNumGreens
Total Green(s)
ArrowGreen (s)
DemandFlow (pcu)
Sat Flow(pcu/Hr)
Capacity(pcu)
Deg Sat(%)
Network:Windy CornerExistingJunction
- - N/A - - - - - - - - 104.0%
Windy CornerJunction - - N/A - - - - - - - - 104.0%
1/1A379 Dartmouth
Road (north)Ahead
U N/A N/A A 1 38 - 587 1925 834 70.4%
1/2A379 Dartmouth
Road (north)Right
O N/A N/A A D 1 38 4 47 1649 136 34.5%
2/2+2/1A379 Darmouth
Road (south)Ahead Left
U+O N/A N/A B - 1 29 - 1316 1965:1974 522+750 103.5 :103.5%
3/1 A3022 BrixhamRoad Left Right U N/A N/A C 1 42 - 913 1837 878 104.0%
4/1 U N/A N/A - - - - 605 Inf Inf 0.0%
5/1 U N/A N/A - - - - 1435 Inf Inf 0.0%
6/1 U N/A N/A - - - - 823 Inf Inf 0.0%

Full Input Data And Results
Item Arriving (pcu) Leaving(pcu)
Turners InGaps (pcu)
Turners WhenUnopposed(pcu)
Turners InIntergreen(pcu)
UniformDelay(pcuHr)
Rand +OversatDelay(pcuHr)
Storage AreaUniformDelay(pcuHr)
TotalDelay(pcuHr)
Av. DelayPer PCU(s/pcu)
Max. Back ofUniformQueue (pcu)
Rand +OversatQueue (pcu)
Mean MaxQueue(pcu)
Network:Windy CornerExistingJunction
- - 370 453 0 16.9 60.1 0.3 77.3 - - - -
Windy CornerJunction - - 370 453 0 16.9 60.1 0.3 77.3 - - - -
1/1 587 587 - - - 3.4 1.2 - 4.6 28.0 11.9 1.2 13.1
1/2 47 47 47 0 0 0.2 0.3 0.3 0.8 60.7 0.7 0.3 0.9
2/2+2/1 1316 1298 323 453 0 5.4 32.3 - 37.7 103.2 23.9 32.3 56.2
3/1 913 878 - - - 7.9 26.3 - 34.2 135.0 23.8 26.3 50.2
4/1 584 584 - - - 0.0 0.0 - 0.0 0.0 0.0 0.0 0.0
5/1 1402 1402 - - - 0.0 0.0 - 0.0 0.0 0.0 0.0 0.0
6/1 823 823 - - - 0.0 0.0 - 0.0 0.0 0.0 0.0 0.0
C1 PRC for Signalled Lanes (%): -15.6 Total Delay for Signalled Lanes (pcuHr): 77.32 Cycle Time (s): 90 PRC Over All Lanes (%): -15.6 Total Delay Over All Lanes(pcuHr): 77.32

Full Input Data And ResultsScenario 15: 'TA 2024 AM' (FG21: 'TA 2024 AM', Plan 1: 'Network Control Plan 1')Stage Sequence Diagram
A
B
1 Min: 7
7 41s
AD2 Min: 4
3 4s
C3 Min: 7
5 30s
Stage TimingsStage 1 2 3
Duration 41 4 30
Change Point 0 48 55
Signal Timings Diagram
0
0
10
10
20
20
30
30
40
40
50
50
60
60
70
70
80
80
90
90
Time in cycle (sec)
Pha
ses
1 7 : 410
23 : 448
3 5 : 3055
D DC CB BA A
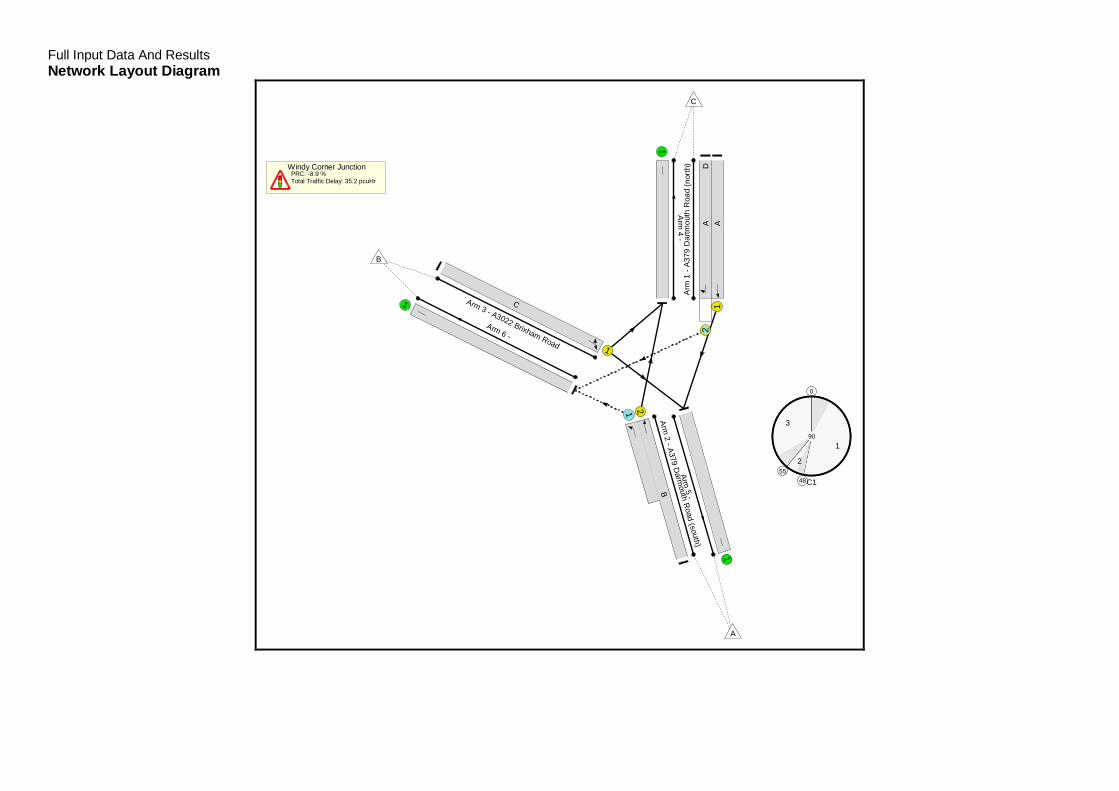
Full Input Data And ResultsNetwork Layout Diagram
Windy Corner JunctionPRC: -8.9 %Total Traffic Delay: 35.2 pcuHr
C1
0
1
48
255
390
Arm
1-A
379
Dar
tmou
thR
oad
(nor
th)
12
AAD
Arm2
- A379D
armouth
Road
(south)
1 2
B
Arm 3 - A3022 Brixham Road 1
C
Arm
4-
1
Arm5
-
1
Arm 6 -
1
A
B
C

Full Input Data And Results
Network Results
Item LaneDescription
LaneType
ControllerStream
Position InFiltered Route Full Phase Arrow
PhaseNumGreens
Total Green(s)
ArrowGreen (s)
DemandFlow (pcu)
Sat Flow(pcu/Hr)
Capacity(pcu)
Deg Sat(%)
Network:Windy CornerExistingJunction
- - N/A - - - - - - - - 98.0%
Windy CornerJunction - - N/A - - - - - - - - 98.0%
1/1A379 Dartmouth
Road (north)Ahead
U N/A N/A A 1 50 - 668 1925 1091 61.2%
1/2A379 Dartmouth
Road (north)Right
O N/A N/A A D 1 50 4 57 1649 146 39.2%
2/2+2/1A379 Darmouth
Road (south)Ahead Left
U+O N/A N/A B - 1 41 - 1572 1965:1974 616+988 98.0 :98.0%
3/1 A3022 BrixhamRoad Left Right U N/A N/A C 1 30 - 620 1842 634 97.7%
4/1 U N/A N/A - - - - 632 Inf Inf 0.0%
5/1 U N/A N/A - - - - 1260 Inf Inf 0.0%
6/1 U N/A N/A - - - - 1025 Inf Inf 0.0%
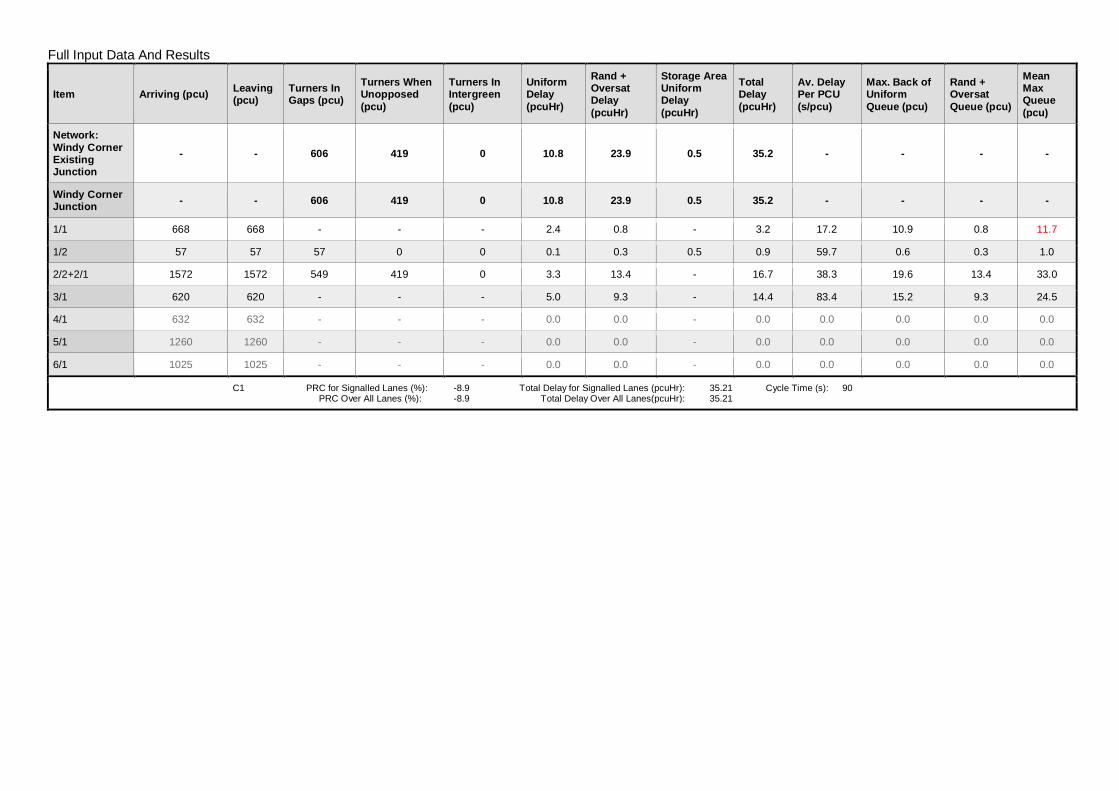
Full Input Data And Results
Item Arriving (pcu) Leaving(pcu)
Turners InGaps (pcu)
Turners WhenUnopposed(pcu)
Turners InIntergreen(pcu)
UniformDelay(pcuHr)
Rand +OversatDelay(pcuHr)
Storage AreaUniformDelay(pcuHr)
TotalDelay(pcuHr)
Av. DelayPer PCU(s/pcu)
Max. Back ofUniformQueue (pcu)
Rand +OversatQueue (pcu)
MeanMaxQueue(pcu)
Network:Windy CornerExistingJunction
- - 606 419 0 10.8 23.9 0.5 35.2 - - - -
Windy CornerJunction - - 606 419 0 10.8 23.9 0.5 35.2 - - - -
1/1 668 668 - - - 2.4 0.8 - 3.2 17.2 10.9 0.8 11.7
1/2 57 57 57 0 0 0.1 0.3 0.5 0.9 59.7 0.6 0.3 1.0
2/2+2/1 1572 1572 549 419 0 3.3 13.4 - 16.7 38.3 19.6 13.4 33.0
3/1 620 620 - - - 5.0 9.3 - 14.4 83.4 15.2 9.3 24.5
4/1 632 632 - - - 0.0 0.0 - 0.0 0.0 0.0 0.0 0.0
5/1 1260 1260 - - - 0.0 0.0 - 0.0 0.0 0.0 0.0 0.0
6/1 1025 1025 - - - 0.0 0.0 - 0.0 0.0 0.0 0.0 0.0
C1 PRC for Signalled Lanes (%): -8.9 Total Delay for Signalled Lanes (pcuHr): 35.21 Cycle Time (s): 90 PRC Over All Lanes (%): -8.9 Total Delay Over All Lanes(pcuHr): 35.21

Full Input Data And ResultsScenario 16: 'TA 2024 PM' (FG22: 'TA 2024 PM', Plan 1: 'Network Control Plan 1')Stage Sequence Diagram
A
B
1 Min: 7
7 28s
AD2 Min: 4
3 4s
C3 Min: 7
5 43s
Stage TimingsStage 1 2 3
Duration 28 4 43
Change Point 0 35 42
Signal Timings Diagram
0
0
10
10
20
20
30
30
40
40
50
50
60
60
70
70
80
80
90
90
Time in cycle (sec)
Pha
ses
1 7 : 280
23 : 435
3 5 : 4342
D DC CB BA A

Full Input Data And ResultsNetwork Layout Diagram
Windy Corner JunctionPRC: -17.9 %Total Traffic Delay: 102.3 pcuHr
C1
0
1
352
42
3 90
Arm
1-A
379
Dar
tmou
thR
oad
(nor
th)
12
AAD
Arm2
- A379
Darm
outhR
oad(south)
1 2
B
Arm 3 - A3022 Brixham Road 1
C
Arm
4-
1
Arm5
-
1
Arm 6 -
1
A
B
C

Full Input Data And Results
Network Results
Item LaneDescription
LaneType
ControllerStream
Position InFiltered Route Full Phase Arrow
PhaseNumGreens
Total Green(s)
ArrowGreen (s)
DemandFlow (pcu)
Sat Flow(pcu/Hr)
Capacity(pcu)
Deg Sat(%)
Network:Windy CornerExistingJunction
- - N/A - - - - - - - - 106.1%
Windy CornerJunction - - N/A - - - - - - - - 106.1%
1/1A379 Dartmouth
Road (north)Ahead
U N/A N/A A 1 37 - 587 1925 813 72.2%
1/2A379 Dartmouth
Road (north)Right
O N/A N/A A D 1 37 4 47 1649 133 35.2%
2/2+2/1A379 Darmouth
Road (south)Ahead Left
U+O N/A N/A B - 1 28 - 1373 1965:1974 509+785 106.1 :106.1%
3/1 A3022 BrixhamRoad Left Right U N/A N/A C 1 43 - 953 1838 899 106.1%
4/1 U N/A N/A - - - - 605 Inf Inf 0.0%
5/1 U N/A N/A - - - - 1475 Inf Inf 0.0%
6/1 U N/A N/A - - - - 880 Inf Inf 0.0%

Full Input Data And Results
Item Arriving (pcu) Leaving(pcu)
Turners InGaps (pcu)
Turners WhenUnopposed(pcu)
Turners InIntergreen(pcu)
UniformDelay(pcuHr)
Rand +OversatDelay(pcuHr)
Storage AreaUniformDelay(pcuHr)
TotalDelay(pcuHr)
Av. DelayPer PCU(s/pcu)
Max. Back ofUniformQueue (pcu)
Rand +OversatQueue (pcu)
Mean MaxQueue(pcu)
Network:Windy CornerExistingJunction
- - 339 541 0 19.4 82.6 0.4 102.3 - - - -
Windy CornerJunction - - 339 541 0 19.4 82.6 0.4 102.3 - - - -
1/1 587 587 - - - 3.5 1.3 - 4.8 29.5 12.1 1.3 13.4
1/2 47 47 47 0 0 0.2 0.3 0.4 0.9 65.8 0.7 0.3 1.0
2/2+2/1 1373 1342 292 541 0 6.5 46.8 - 53.4 140.0 29.5 46.8 76.3
3/1 953 899 - - - 9.1 34.2 - 43.3 163.5 25.8 34.2 59.9
4/1 570 570 - - - 0.0 0.0 - 0.0 0.0 0.0 0.0 0.0
5/1 1424 1424 - - - 0.0 0.0 - 0.0 0.0 0.0 0.0 0.0
6/1 880 880 - - - 0.0 0.0 - 0.0 0.0 0.0 0.0 0.0
C1 PRC for Signalled Lanes (%): -17.9 Total Delay for Signalled Lanes (pcuHr): 102.33 Cycle Time (s): 90 PRC Over All Lanes (%): -17.9 Total Delay Over All Lanes(pcuHr): 102.33
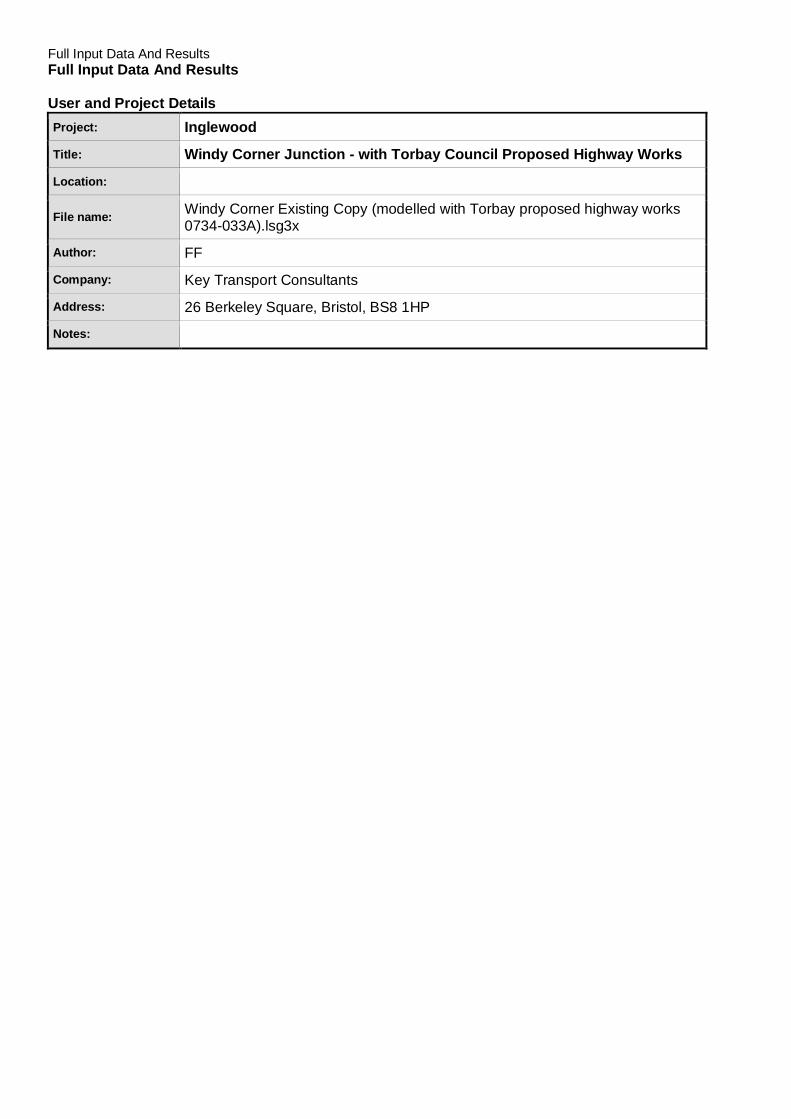
Full Input Data And ResultsFull Input Data And Results
User and Project DetailsProject: Inglewood
Title: Windy Corner Junction - with Torbay Council Proposed Highway Works
Location:
File name: Windy Corner Existing Copy (modelled with Torbay proposed highway works0734-033A).lsg3x
Author: FF
Company: Key Transport Consultants
Address: 26 Berkeley Square, Bristol, BS8 1HP
Notes:

Full Input Data And Results
Network Layout Diagram
Windy Corner Junction
Arm
1-A
379
Dar
tmou
thR
oad
(nor
th)
12
1/1
1/2
Arm2
- A379
Darm
outhR
oad(south)
1 22/1
2/2
Arm 3 - A3022 Brixham Road 13/1
Arm
4-
14/1
Arm
5-
15/1
Arm 6 -
16/1
A
B
C
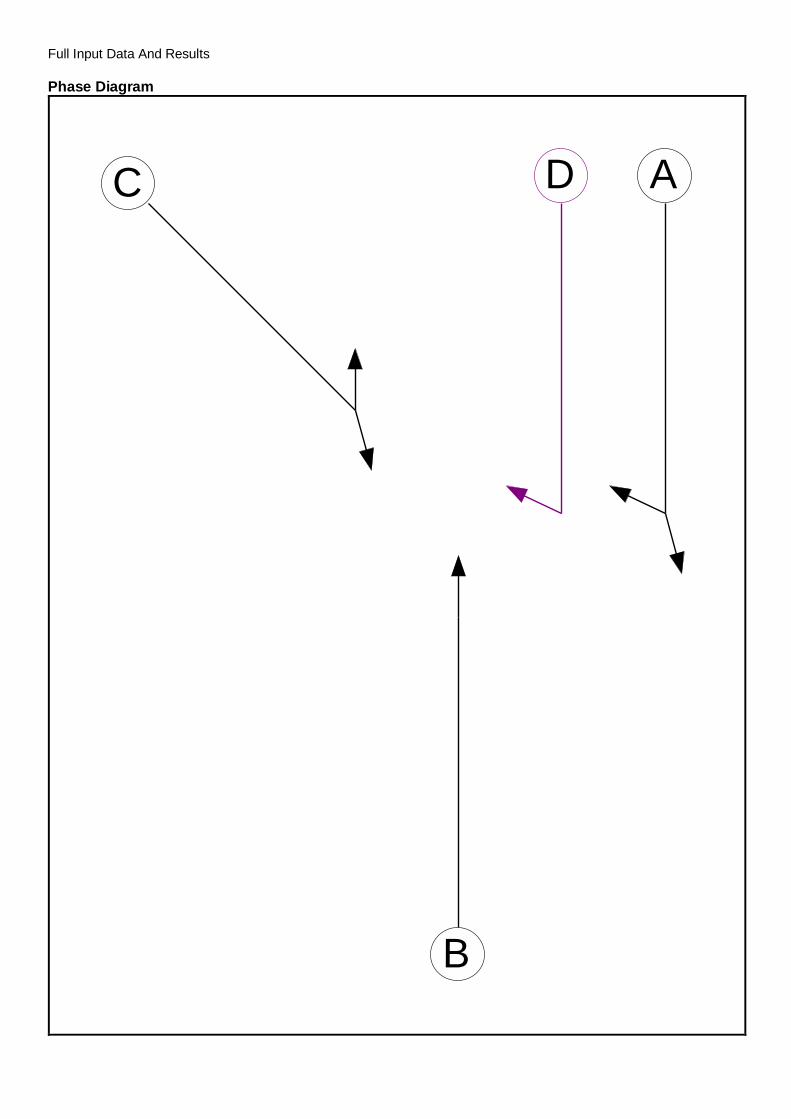
Full Input Data And Results
Phase Diagram
A
B
C D

Full Input Data And Results
Phase Input DataPhase Name Phase Type Assoc. Phase Street Min Cont Min
A Traffic 7 7
B Traffic 7 7
C Traffic 7 7
D Ind. Arrow A 4 4
Phase Intergreens MatrixStarting Phase
TerminatingPhase
A B C D
A - - 5 -
B - - 6 3
C 5 7 - 5
D - 6 5 -
Phases in StageStage No. Phases in Stage
1 A B
2 A D
3 C
Stage DiagramA
B
C D1 Min >= 7
A
B
C D2 Min >= 4
A
B
C D3 Min >= 7
Phase DelaysTerm. Stage Start Stage Phase Type Value Cont value
1 3 A Losing 1 1
Prohibited Stage ChangeTo Stage
FromStage
1 2 3
1 3 6
2 6 5
3 7 5

Full Input Data And ResultsGive-Way Lane Input DataJunction: Windy Corner Junction
Lane MovementMax Flow
whenGiving Way
(PCU/Hr)
Min Flowwhen
Giving Way(PCU/Hr)
OpposingLane
Opp. LaneCoeff.
Opp.Mvmnts.
Right TurnStorage (PCU)
Non-BlockingStorage(PCU)
RTF Right TurnMove up (s)
Max Turnsin Intergreen
(PCU)
1/2(A379 Dartmouth Road (north)) 6/1 (Right) 1439 0
2/1 1.09 All3.00 - 0.50 3 2.00
2/2 1.09 All
2/1(A379 Darmouth Road (south)) 6/1 (Left) 1940 0 1/2 1.09 All - - - - -
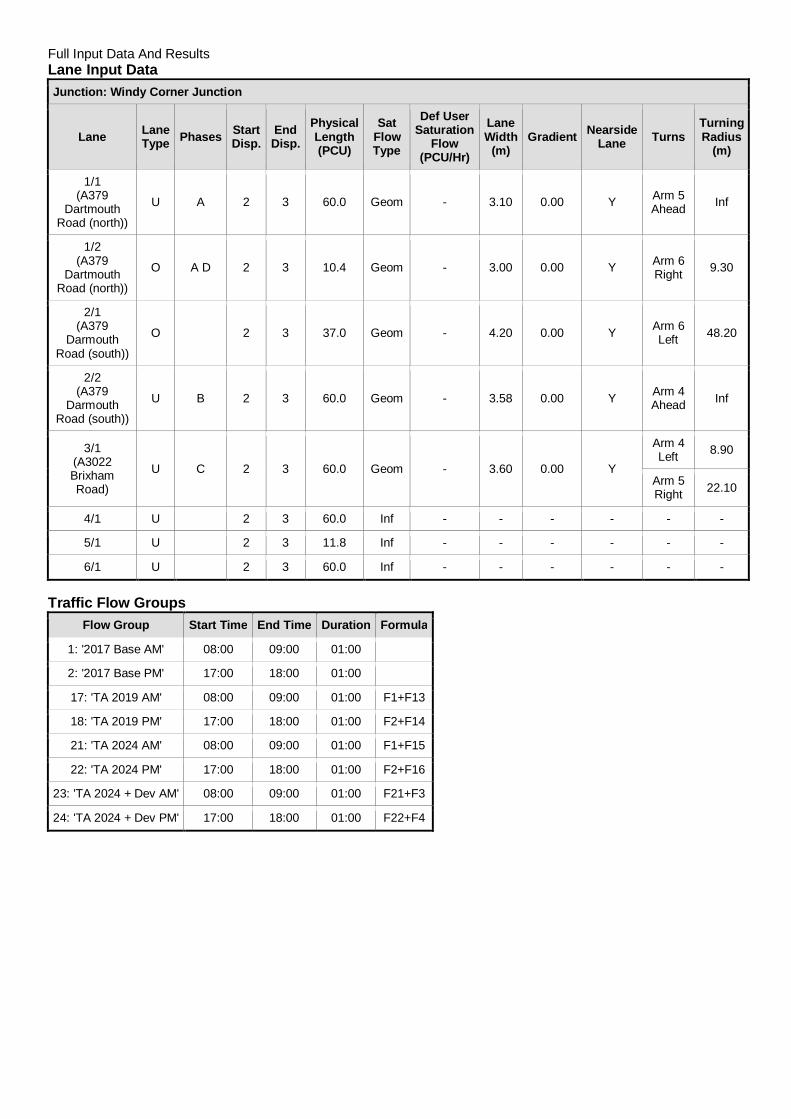
Full Input Data And ResultsLane Input DataJunction: Windy Corner Junction
Lane LaneType Phases Start
Disp.EndDisp.
PhysicalLength(PCU)
SatFlowType
Def UserSaturation
Flow(PCU/Hr)
LaneWidth
(m)Gradient Nearside
Lane TurnsTurningRadius
(m)
1/1(A379
DartmouthRoad (north))
U A 2 3 60.0 Geom - 3.10 0.00 Y Arm 5Ahead Inf
1/2(A379
DartmouthRoad (north))
O A D 2 3 10.4 Geom - 3.00 0.00 Y Arm 6Right 9.30
2/1(A379
DarmouthRoad (south))
O 2 3 37.0 Geom - 4.20 0.00 Y Arm 6Left 48.20
2/2(A379
DarmouthRoad (south))
U B 2 3 60.0 Geom - 3.58 0.00 Y Arm 4Ahead Inf
3/1(A3022BrixhamRoad)
U C 2 3 60.0 Geom - 3.60 0.00 Y
Arm 4Left 8.90
Arm 5Right 22.10
4/1 U 2 3 60.0 Inf - - - - - -
5/1 U 2 3 11.8 Inf - - - - - -
6/1 U 2 3 60.0 Inf - - - - - -
Traffic Flow GroupsFlow Group Start Time End Time Duration Formula
1: '2017 Base AM' 08:00 09:00 01:00
2: '2017 Base PM' 17:00 18:00 01:00
17: 'TA 2019 AM' 08:00 09:00 01:00 F1+F13
18: 'TA 2019 PM' 17:00 18:00 01:00 F2+F14
21: 'TA 2024 AM' 08:00 09:00 01:00 F1+F15
22: 'TA 2024 PM' 17:00 18:00 01:00 F2+F16
23: 'TA 2024 + Dev AM' 08:00 09:00 01:00 F21+F3
24: 'TA 2024 + Dev PM' 17:00 18:00 01:00 F22+F4
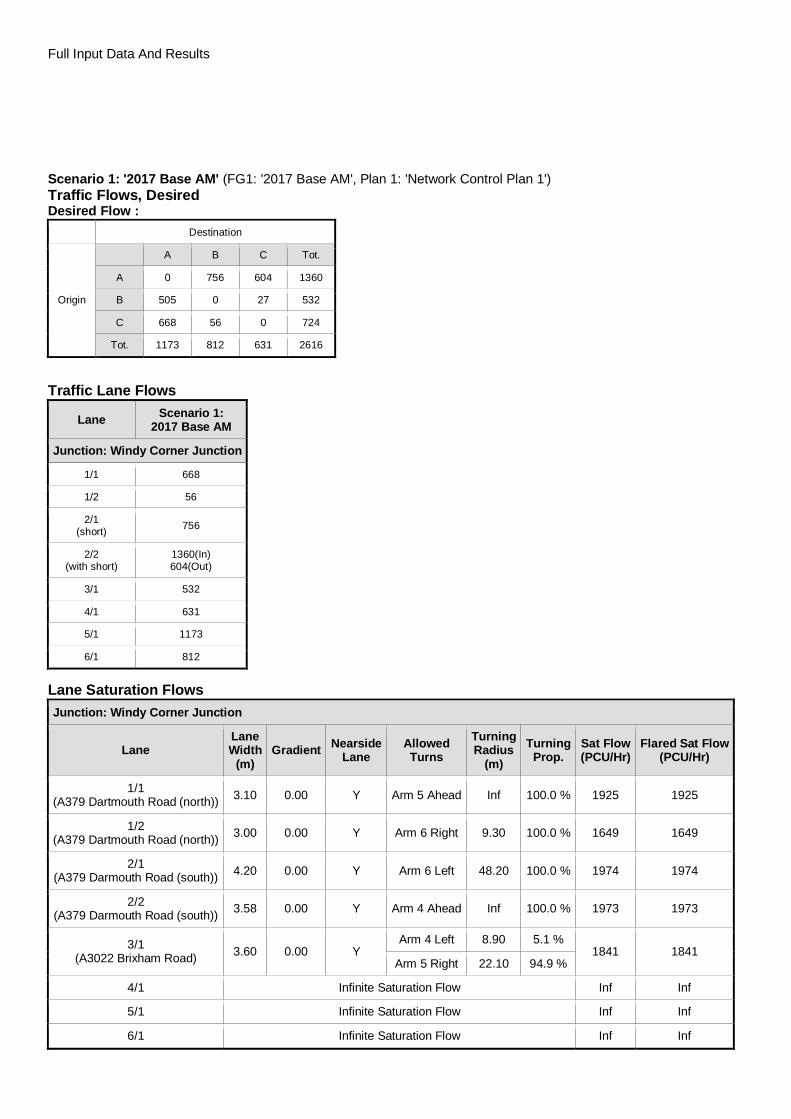
Full Input Data And Results
Scenario 1: '2017 Base AM' (FG1: '2017 Base AM', Plan 1: 'Network Control Plan 1')Traffic Flows, DesiredDesired Flow :
Destination
Origin
A B C Tot.
A 0 756 604 1360
B 505 0 27 532
C 668 56 0 724
Tot. 1173 812 631 2616
Traffic Lane Flows
Lane Scenario 1:2017 Base AM
Junction: Windy Corner Junction
1/1 668
1/2 56
2/1(short) 756
2/2(with short)
1360(In)604(Out)
3/1 532
4/1 631
5/1 1173
6/1 812
Lane Saturation FlowsJunction: Windy Corner Junction
LaneLaneWidth
(m)Gradient Nearside
LaneAllowedTurns
TurningRadius
(m)Turning
Prop.Sat Flow(PCU/Hr)
Flared Sat Flow(PCU/Hr)
1/1(A379 Dartmouth Road (north)) 3.10 0.00 Y Arm 5 Ahead Inf 100.0 % 1925 1925
1/2(A379 Dartmouth Road (north)) 3.00 0.00 Y Arm 6 Right 9.30 100.0 % 1649 1649
2/1(A379 Darmouth Road (south)) 4.20 0.00 Y Arm 6 Left 48.20 100.0 % 1974 1974
2/2(A379 Darmouth Road (south)) 3.58 0.00 Y Arm 4 Ahead Inf 100.0 % 1973 1973
3/1(A3022 Brixham Road) 3.60 0.00 Y
Arm 4 Left 8.90 5.1 %1841 1841
Arm 5 Right 22.10 94.9 %
4/1 Infinite Saturation Flow Inf Inf
5/1 Infinite Saturation Flow Inf Inf
6/1 Infinite Saturation Flow Inf Inf

Full Input Data And Results
Scenario 2: '2017 Base PM' (FG2: '2017 Base PM', Plan 1: 'Network Control Plan 1')Traffic Flows, DesiredDesired Flow :
Destination
Origin
A B C Tot.
A 0 659 540 1199
B 717 0 63 780
C 587 45 0 632
Tot. 1304 704 603 2611
Traffic Lane Flows
Lane Scenario 2:2017 Base PM
Junction: Windy Corner Junction
1/1 587
1/2 45
2/1(short) 659
2/2(with short)
1199(In)540(Out)
3/1 780
4/1 603
5/1 1304
6/1 704
Lane Saturation FlowsJunction: Windy Corner Junction
LaneLaneWidth
(m)Gradient Nearside
LaneAllowedTurns
TurningRadius
(m)Turning
Prop.Sat Flow(PCU/Hr)
Flared Sat Flow(PCU/Hr)
1/1(A379 Dartmouth Road (north)) 3.10 0.00 Y Arm 5 Ahead Inf 100.0 % 1925 1925
1/2(A379 Dartmouth Road (north)) 3.00 0.00 Y Arm 6 Right 9.30 100.0 % 1649 1649
2/1(A379 Darmouth Road (south)) 4.20 0.00 Y Arm 6 Left 48.20 100.0 % 1974 1974
2/2(A379 Darmouth Road (south)) 3.58 0.00 Y Arm 4 Ahead Inf 100.0 % 1973 1973
3/1(A3022 Brixham Road) 3.60 0.00 Y
Arm 4 Left 8.90 8.1 %1835 1835
Arm 5 Right 22.10 91.9 %
4/1 Infinite Saturation Flow Inf Inf
5/1 Infinite Saturation Flow Inf Inf
6/1 Infinite Saturation Flow Inf Inf

Full Input Data And Results
Scenario 11: 'TA 2019 AM' (FG17: 'TA 2019 AM', Plan 1: 'Network Control Plan 1')Traffic Flows, DesiredDesired Flow :
Destination
Origin
A B C Tot.
A 0 929 604 1533
B 562 0 28 590
C 668 56 0 724
Tot. 1230 985 632 2847
Traffic Lane Flows
Lane Scenario 11:TA 2019 AM
Junction: Windy Corner Junction
1/1 668
1/2 56
2/1(short) 929
2/2(with short)
1533(In)604(Out)
3/1 590
4/1 632
5/1 1230
6/1 985
Lane Saturation FlowsJunction: Windy Corner Junction
LaneLaneWidth
(m)Gradient Nearside
LaneAllowedTurns
TurningRadius
(m)Turning
Prop.Sat Flow(PCU/Hr)
Flared Sat Flow(PCU/Hr)
1/1(A379 Dartmouth Road (north)) 3.10 0.00 Y Arm 5 Ahead Inf 100.0 % 1925 1925
1/2(A379 Dartmouth Road (north)) 3.00 0.00 Y Arm 6 Right 9.30 100.0 % 1649 1649
2/1(A379 Darmouth Road (south)) 4.20 0.00 Y Arm 6 Left 48.20 100.0 % 1974 1974
2/2(A379 Darmouth Road (south)) 3.58 0.00 Y Arm 4 Ahead Inf 100.0 % 1973 1973
3/1(A3022 Brixham Road) 3.60 0.00 Y
Arm 4 Left 8.90 4.7 %1841 1841
Arm 5 Right 22.10 95.3 %
4/1 Infinite Saturation Flow Inf Inf
5/1 Infinite Saturation Flow Inf Inf
6/1 Infinite Saturation Flow Inf Inf

Full Input Data And Results
Scenario 12: 'TA 2019 PM' (FG18: 'TA 2019 PM', Plan 1: 'Network Control Plan 1')Traffic Flows, DesiredDesired Flow :
Destination
Origin
A B C Tot.
A 0 776 540 1316
B 848 0 65 913
C 587 47 0 634
Tot. 1435 823 605 2863
Traffic Lane Flows
Lane Scenario 12:TA 2019 PM
Junction: Windy Corner Junction
1/1 587
1/2 47
2/1(short) 776
2/2(with short)
1316(In)540(Out)
3/1 913
4/1 605
5/1 1435
6/1 823
Lane Saturation FlowsJunction: Windy Corner Junction
LaneLaneWidth
(m)Gradient Nearside
LaneAllowedTurns
TurningRadius
(m)Turning
Prop.Sat Flow(PCU/Hr)
Flared Sat Flow(PCU/Hr)
1/1(A379 Dartmouth Road (north)) 3.10 0.00 Y Arm 5 Ahead Inf 100.0 % 1925 1925
1/2(A379 Dartmouth Road (north)) 3.00 0.00 Y Arm 6 Right 9.30 100.0 % 1649 1649
2/1(A379 Darmouth Road (south)) 4.20 0.00 Y Arm 6 Left 48.20 100.0 % 1974 1974
2/2(A379 Darmouth Road (south)) 3.58 0.00 Y Arm 4 Ahead Inf 100.0 % 1973 1973
3/1(A3022 Brixham Road) 3.60 0.00 Y
Arm 4 Left 8.90 7.1 %1837 1837
Arm 5 Right 22.10 92.9 %
4/1 Infinite Saturation Flow Inf Inf
5/1 Infinite Saturation Flow Inf Inf
6/1 Infinite Saturation Flow Inf Inf
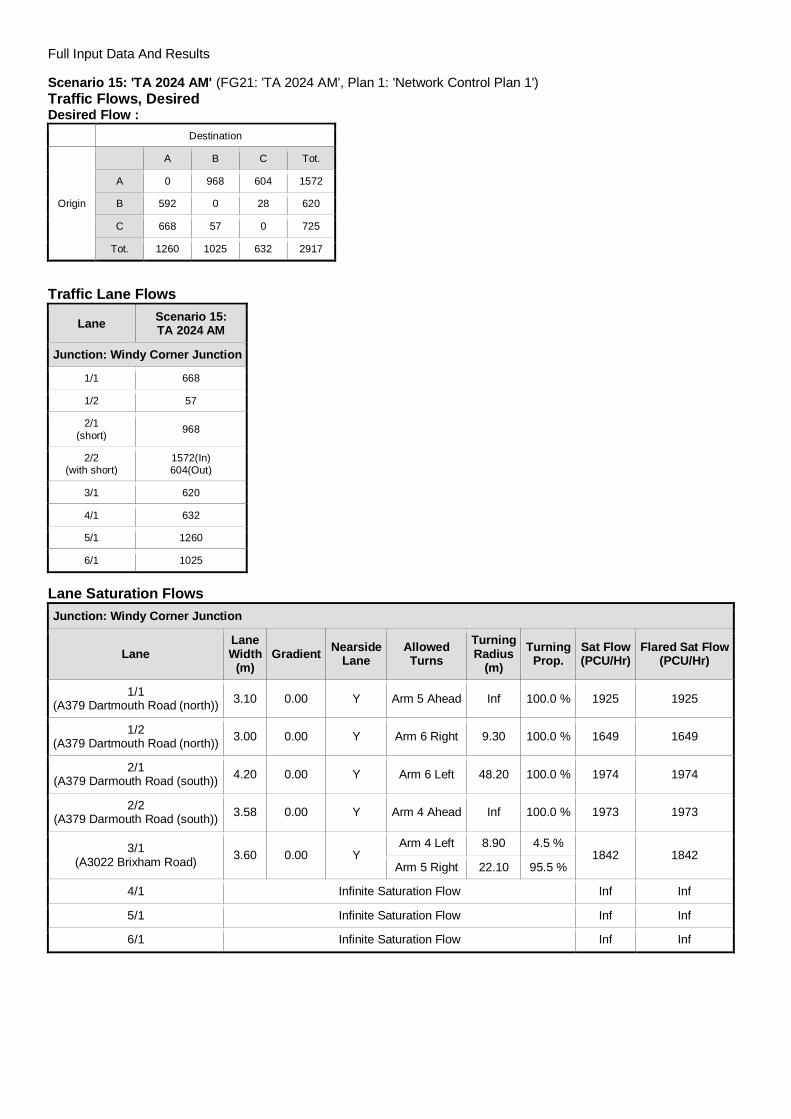
Full Input Data And Results
Scenario 15: 'TA 2024 AM' (FG21: 'TA 2024 AM', Plan 1: 'Network Control Plan 1')Traffic Flows, DesiredDesired Flow :
Destination
Origin
A B C Tot.
A 0 968 604 1572
B 592 0 28 620
C 668 57 0 725
Tot. 1260 1025 632 2917
Traffic Lane Flows
Lane Scenario 15:TA 2024 AM
Junction: Windy Corner Junction
1/1 668
1/2 57
2/1(short) 968
2/2(with short)
1572(In)604(Out)
3/1 620
4/1 632
5/1 1260
6/1 1025
Lane Saturation FlowsJunction: Windy Corner Junction
LaneLaneWidth
(m)Gradient Nearside
LaneAllowedTurns
TurningRadius
(m)Turning
Prop.Sat Flow(PCU/Hr)
Flared Sat Flow(PCU/Hr)
1/1(A379 Dartmouth Road (north)) 3.10 0.00 Y Arm 5 Ahead Inf 100.0 % 1925 1925
1/2(A379 Dartmouth Road (north)) 3.00 0.00 Y Arm 6 Right 9.30 100.0 % 1649 1649
2/1(A379 Darmouth Road (south)) 4.20 0.00 Y Arm 6 Left 48.20 100.0 % 1974 1974
2/2(A379 Darmouth Road (south)) 3.58 0.00 Y Arm 4 Ahead Inf 100.0 % 1973 1973
3/1(A3022 Brixham Road) 3.60 0.00 Y
Arm 4 Left 8.90 4.5 %1842 1842
Arm 5 Right 22.10 95.5 %
4/1 Infinite Saturation Flow Inf Inf
5/1 Infinite Saturation Flow Inf Inf
6/1 Infinite Saturation Flow Inf Inf

Full Input Data And Results
Scenario 16: 'TA 2024 PM' (FG22: 'TA 2024 PM', Plan 1: 'Network Control Plan 1')Traffic Flows, DesiredDesired Flow :
Destination
Origin
A B C Tot.
A 0 833 540 1373
B 888 0 65 953
C 587 47 0 634
Tot. 1475 880 605 2960
Traffic Lane Flows
Lane Scenario 16:TA 2024 PM
Junction: Windy Corner Junction
1/1 587
1/2 47
2/1(short) 833
2/2(with short)
1373(In)540(Out)
3/1 953
4/1 605
5/1 1475
6/1 880
Lane Saturation FlowsJunction: Windy Corner Junction
LaneLaneWidth
(m)Gradient Nearside
LaneAllowedTurns
TurningRadius
(m)Turning
Prop.Sat Flow(PCU/Hr)
Flared Sat Flow(PCU/Hr)
1/1(A379 Dartmouth Road (north)) 3.10 0.00 Y Arm 5 Ahead Inf 100.0 % 1925 1925
1/2(A379 Dartmouth Road (north)) 3.00 0.00 Y Arm 6 Right 9.30 100.0 % 1649 1649
2/1(A379 Darmouth Road (south)) 4.20 0.00 Y Arm 6 Left 48.20 100.0 % 1974 1974
2/2(A379 Darmouth Road (south)) 3.58 0.00 Y Arm 4 Ahead Inf 100.0 % 1973 1973
3/1(A3022 Brixham Road) 3.60 0.00 Y
Arm 4 Left 8.90 6.8 %1838 1838
Arm 5 Right 22.10 93.2 %
4/1 Infinite Saturation Flow Inf Inf
5/1 Infinite Saturation Flow Inf Inf
6/1 Infinite Saturation Flow Inf Inf
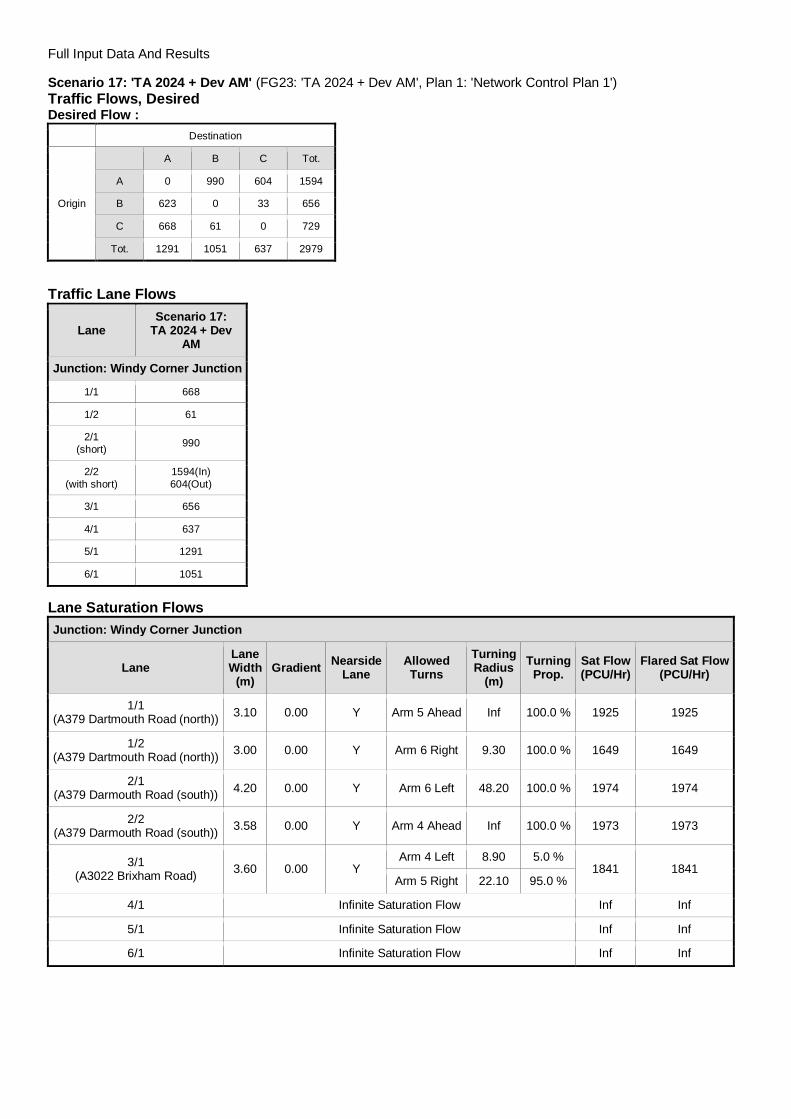
Full Input Data And Results
Scenario 17: 'TA 2024 + Dev AM' (FG23: 'TA 2024 + Dev AM', Plan 1: 'Network Control Plan 1')Traffic Flows, DesiredDesired Flow :
Destination
Origin
A B C Tot.
A 0 990 604 1594
B 623 0 33 656
C 668 61 0 729
Tot. 1291 1051 637 2979
Traffic Lane Flows
LaneScenario 17:
TA 2024 + DevAM
Junction: Windy Corner Junction
1/1 668
1/2 61
2/1(short) 990
2/2(with short)
1594(In)604(Out)
3/1 656
4/1 637
5/1 1291
6/1 1051
Lane Saturation FlowsJunction: Windy Corner Junction
LaneLaneWidth
(m)Gradient Nearside
LaneAllowedTurns
TurningRadius
(m)Turning
Prop.Sat Flow(PCU/Hr)
Flared Sat Flow(PCU/Hr)
1/1(A379 Dartmouth Road (north)) 3.10 0.00 Y Arm 5 Ahead Inf 100.0 % 1925 1925
1/2(A379 Dartmouth Road (north)) 3.00 0.00 Y Arm 6 Right 9.30 100.0 % 1649 1649
2/1(A379 Darmouth Road (south)) 4.20 0.00 Y Arm 6 Left 48.20 100.0 % 1974 1974
2/2(A379 Darmouth Road (south)) 3.58 0.00 Y Arm 4 Ahead Inf 100.0 % 1973 1973
3/1(A3022 Brixham Road) 3.60 0.00 Y
Arm 4 Left 8.90 5.0 %1841 1841
Arm 5 Right 22.10 95.0 %
4/1 Infinite Saturation Flow Inf Inf
5/1 Infinite Saturation Flow Inf Inf
6/1 Infinite Saturation Flow Inf Inf

Full Input Data And Results
Scenario 18: 'TA 2024 + Dev PM' (FG24: 'TA 2024 + Dev PM', Plan 1: 'Network Control Plan 1')Traffic Flows, DesiredDesired Flow :
Destination
Origin
A B C Tot.
A 0 860 540 1400
B 907 0 68 975
C 587 51 0 638
Tot. 1494 911 608 3013
Traffic Lane Flows
LaneScenario 18:
TA 2024 + DevPM
Junction: Windy Corner Junction
1/1 587
1/2 51
2/1(short) 860
2/2(with short)
1400(In)540(Out)
3/1 975
4/1 608
5/1 1494
6/1 911
Lane Saturation FlowsJunction: Windy Corner Junction
LaneLaneWidth
(m)Gradient Nearside
LaneAllowedTurns
TurningRadius
(m)Turning
Prop.Sat Flow(PCU/Hr)
Flared Sat Flow(PCU/Hr)
1/1(A379 Dartmouth Road (north)) 3.10 0.00 Y Arm 5 Ahead Inf 100.0 % 1925 1925
1/2(A379 Dartmouth Road (north)) 3.00 0.00 Y Arm 6 Right 9.30 100.0 % 1649 1649
2/1(A379 Darmouth Road (south)) 4.20 0.00 Y Arm 6 Left 48.20 100.0 % 1974 1974
2/2(A379 Darmouth Road (south)) 3.58 0.00 Y Arm 4 Ahead Inf 100.0 % 1973 1973
3/1(A3022 Brixham Road) 3.60 0.00 Y
Arm 4 Left 8.90 7.0 %1837 1837
Arm 5 Right 22.10 93.0 %
4/1 Infinite Saturation Flow Inf Inf
5/1 Infinite Saturation Flow Inf Inf
6/1 Infinite Saturation Flow Inf Inf
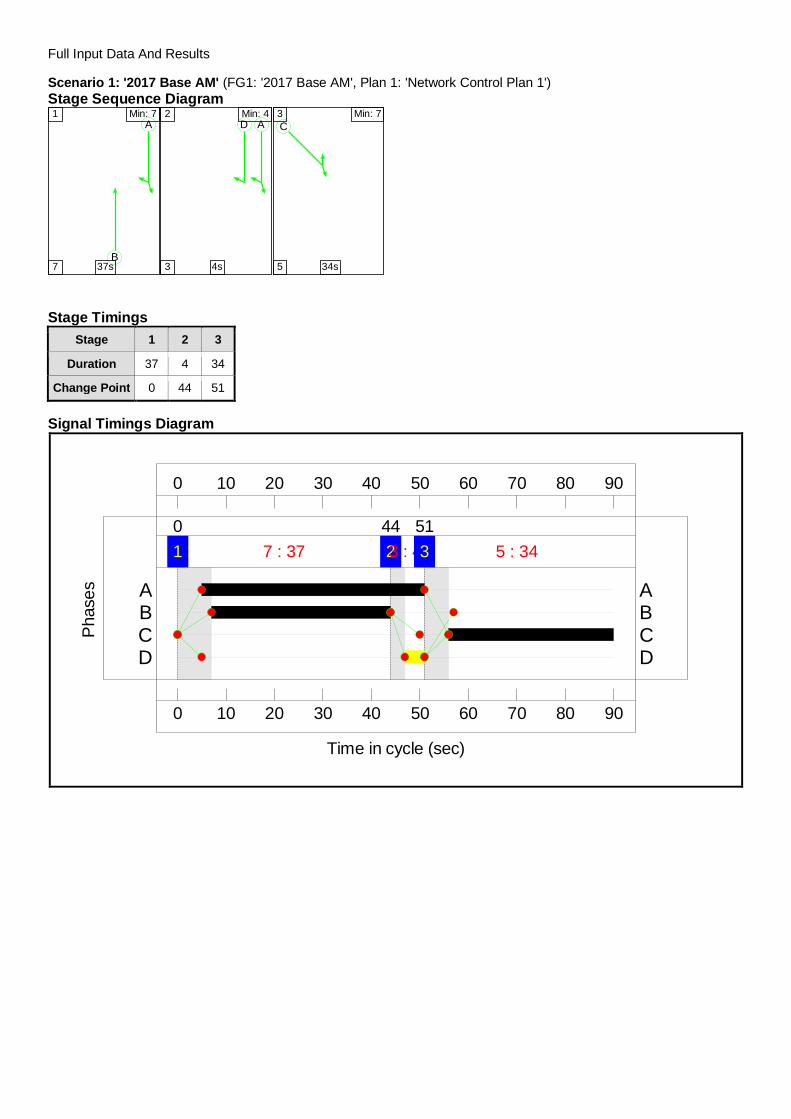
Full Input Data And Results
Scenario 1: '2017 Base AM' (FG1: '2017 Base AM', Plan 1: 'Network Control Plan 1')Stage Sequence Diagram
A
B
1 Min: 7
7 37s
AD2 Min: 4
3 4s
C3 Min: 7
5 34s
Stage TimingsStage 1 2 3
Duration 37 4 34
Change Point 0 44 51
Signal Timings Diagram
0
0
10
10
20
20
30
30
40
40
50
50
60
60
70
70
80
80
90
90
Time in cycle (sec)
Pha
ses
1 7 : 370
23 : 444
3 5 : 3451
D DC CB BA A
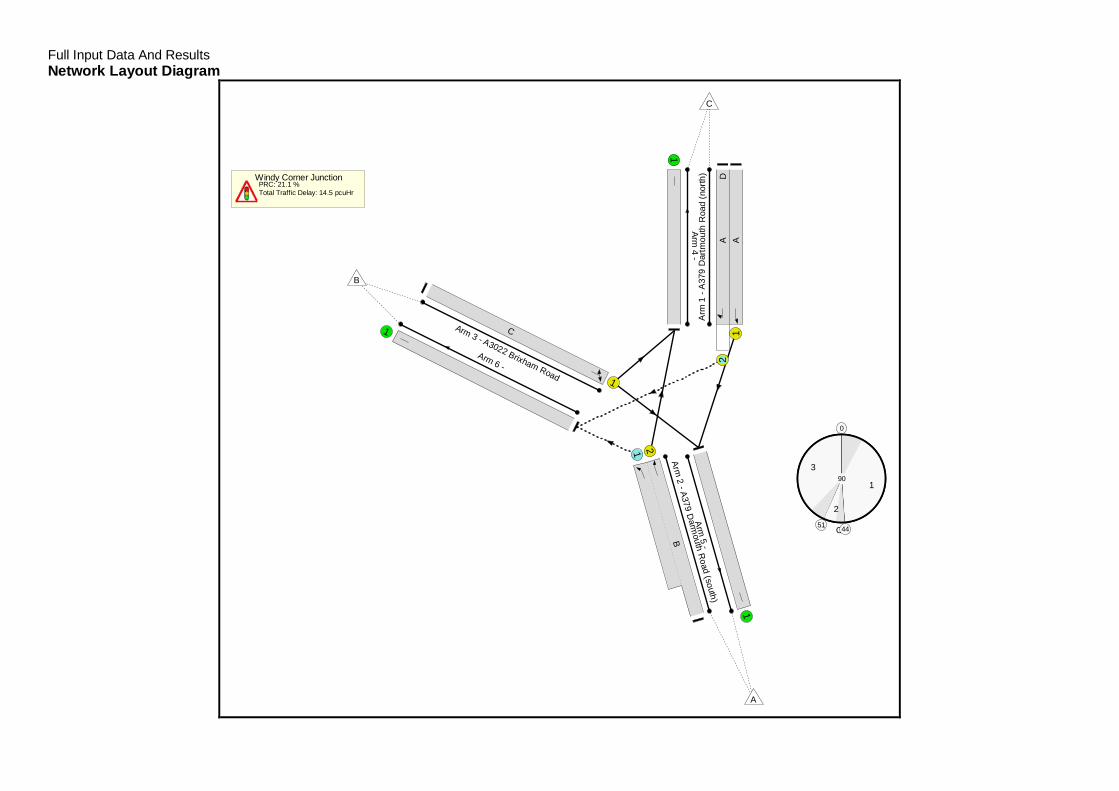
Full Input Data And ResultsNetwork Layout Diagram
Windy Corner JunctionPRC: 21.1 %Total Traffic Delay: 14.5 pcuHr
C1
0
1
44
2
51
390
Arm
1-A
379
Da r
tmou
thR
oad
(nor
th)
12
AAD
Arm2
- A379D
armouth
Road
(south)
1 2
B
Arm 3 - A3022 Brixham Road 1
C
Arm4
-
1
Arm5
-
1
Arm 6 -
1
A
B
C

Full Input Data And Results
Network Results
Item LaneDescription
LaneType
ControllerStream
Position InFiltered Route Full Phase Arrow
PhaseNumGreens
Total Green(s)
ArrowGreen (s)
DemandFlow (pcu)
Sat Flow(pcu/Hr)
Capacity(pcu)
Deg Sat(%)
Network: WindyCorner Junction -with Torbay CouncilProposed HighwayWorks
- - N/A - - - - - - - - 74.3%
Windy CornerJunction - - N/A - - - - - - - - 74.3%
1/1A379 Dartmouth
Road (north)Ahead
U N/A N/A A 1 46 - 668 1925 1005 66.4%
1/2A379 Dartmouth
Road (north)Right
O N/A N/A A D 1 46 4 56 1649 161 34.8%
2/2+2/1A379 Darmouth
Road (south)Ahead Left
U+O N/A N/A B - 1 37 - 1360 1973:1974 833+1097 72.5 :68.9%
3/1 A3022 BrixhamRoad Left Right U N/A N/A C 1 34 - 532 1841 716 74.3%
4/1 U N/A N/A - - - - 631 Inf Inf 0.0%
5/1 U N/A N/A - - - - 1173 Inf Inf 0.0%
6/1 U N/A N/A - - - - 812 Inf Inf 0.0%

Full Input Data And Results
Item Arriving (pcu) Leaving(pcu)
Turners InGaps (pcu)
Turners WhenUnopposed(pcu)
Turners InIntergreen(pcu)
UniformDelay(pcuHr)
Rand +OversatDelay(pcuHr)
StorageAreaUniformDelay(pcuHr)
TotalDelay(pcuHr)
Av. DelayPer PCU(s/pcu)
Max. Back ofUniformQueue (pcu)
Rand +OversatQueue (pcu)
MeanMaxQueue(pcu)
Network: WindyCorner Junction -with Torbay CouncilProposed HighwayWorks
- - 451 361 0 10.2 3.9 0.4 14.5 - - - -
Windy CornerJunction - - 451 361 0 10.2 3.9 0.4 14.5 - - - -
1/1 668 668 - - - 2.9 1.0 - 3.9 21.0 12.1 1.0 13.0
1/2 56 56 56 0 0 0.2 0.3 0.4 0.8 52.5 0.7 0.3 0.9
2/2+2/1 1360 1360 395 361 0 3.6 1.2 - 4.8 12.8 12.4 1.2 13.6
3/1 532 532 - - - 3.5 1.4 - 4.9 33.3 11.4 1.4 12.8
4/1 631 631 - - - 0.0 0.0 - 0.0 0.0 0.0 0.0 0.0
5/1 1173 1173 - - - 0.0 0.0 - 0.0 0.0 0.0 0.0 0.0
6/1 812 812 - - - 0.0 0.0 - 0.0 0.0 0.0 0.0 0.0
C1 PRC for Signalled Lanes (%): 21.1 Total Delay for Signalled Lanes (pcuHr): 14.46 Cycle Time (s): 90 PRC Over All Lanes (%): 21.1 Total Delay Over All Lanes(pcuHr): 14.46
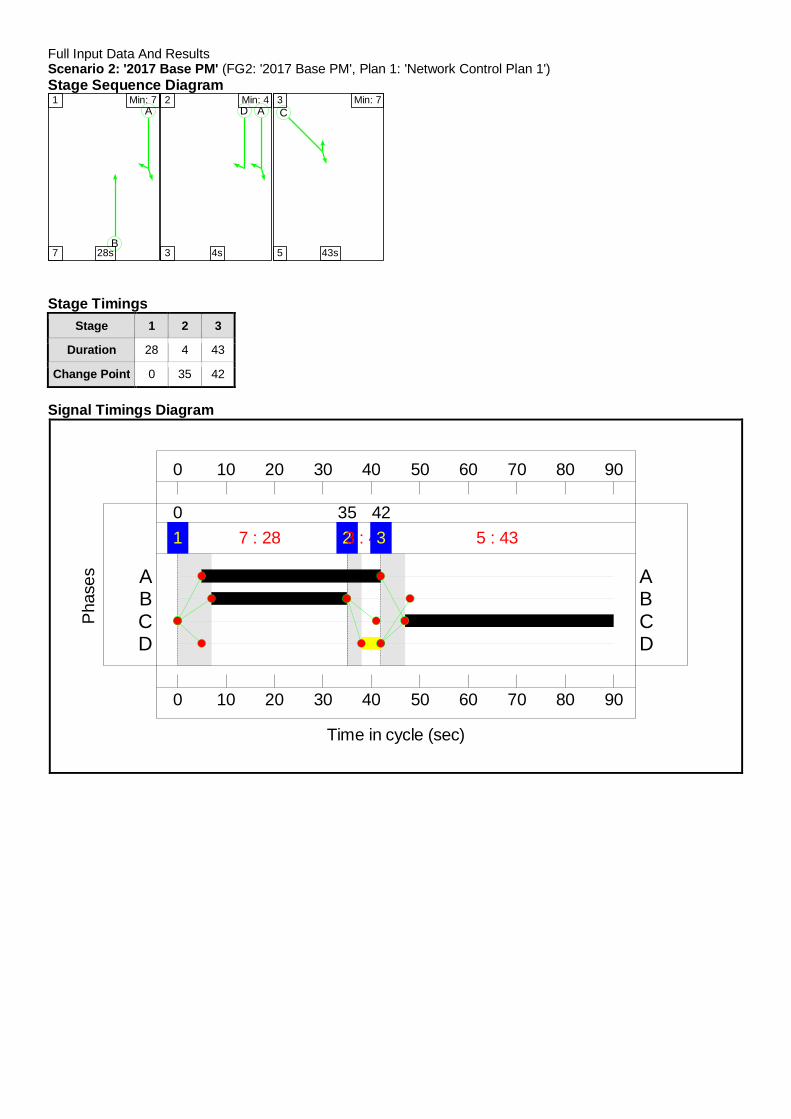
Full Input Data And ResultsScenario 2: '2017 Base PM' (FG2: '2017 Base PM', Plan 1: 'Network Control Plan 1')Stage Sequence Diagram
A
B
1 Min: 7
7 28s
AD2 Min: 4
3 4s
C3 Min: 7
5 43s
Stage TimingsStage 1 2 3
Duration 28 4 43
Change Point 0 35 42
Signal Timings Diagram
0
0
10
10
20
20
30
30
40
40
50
50
60
60
70
70
80
80
90
90
Time in cycle (sec)
Pha
ses
1 7 : 280
23 : 435
3 5 : 4342
D DC CB BA A
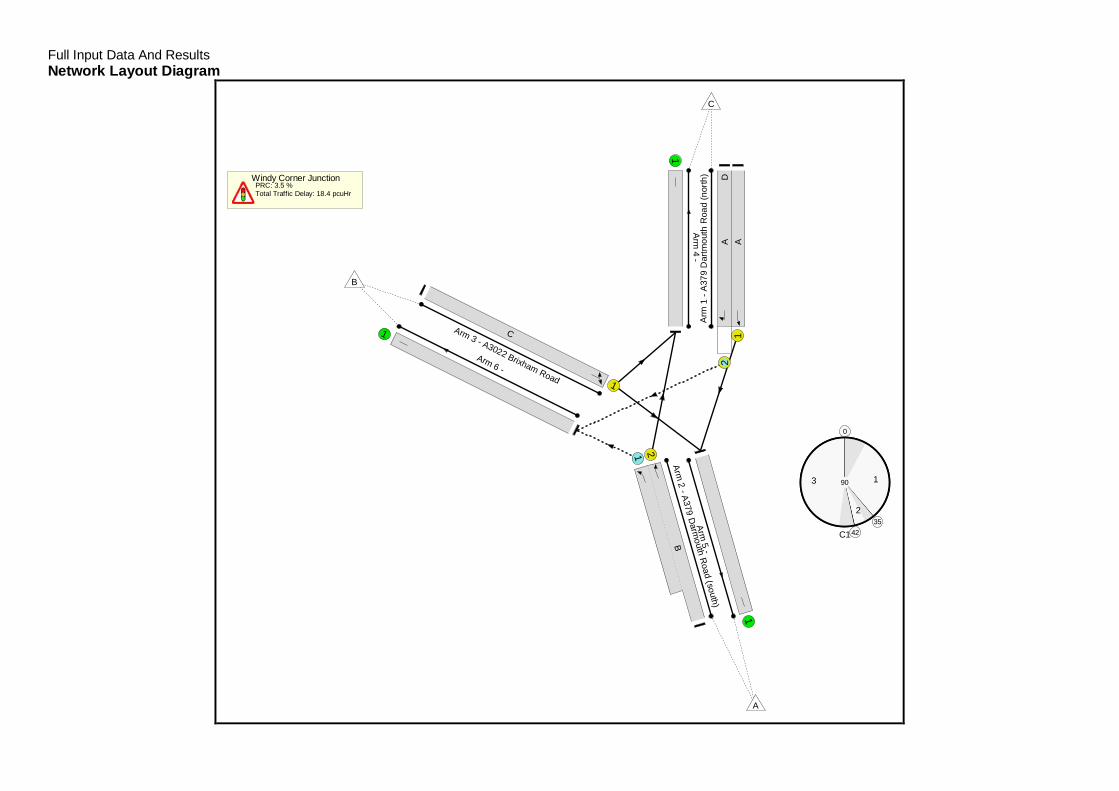
Full Input Data And ResultsNetwork Layout Diagram
Windy Corner JunctionPRC: 3.5 %Total Traffic Delay: 18.4 pcuHr
C1
0
1
352
42
3 90
Arm
1-A
379
Dar
tmou
thR
oad
(nor
th)
12
AAD
Arm2
- A379D
armouth
Road
(south)
1 2
B
Arm 3 - A3022 Brixham Road 1
C
Arm
4-
1
Arm5
-
1Arm 6 -
1
A
B
C

Full Input Data And Results
Network Results
Item LaneDescription
LaneType
ControllerStream
Position InFiltered Route Full Phase Arrow
PhaseNumGreens
Total Green(s)
ArrowGreen (s)
DemandFlow (pcu)
Sat Flow(pcu/Hr)
Capacity(pcu)
Deg Sat(%)
Network: WindyCorner Junction -with Torbay CouncilProposed HighwayWorks
- - N/A - - - - - - - - 86.9%
Windy CornerJunction - - N/A - - - - - - - - 86.9%
1/1A379 Dartmouth
Road (north)Ahead
U N/A N/A A 1 37 - 587 1925 813 72.2%
1/2A379 Dartmouth
Road (north)Right
O N/A N/A A D 1 37 4 45 1649 177 25.4%
2/2+2/1A379 Darmouth
Road (south)Ahead Left
U+O N/A N/A B - 1 28 - 1199 1973:1974 636+1085 84.9 :60.8%
3/1 A3022 BrixhamRoad Left Right U N/A N/A C 1 43 - 780 1835 897 86.9%
4/1 U N/A N/A - - - - 603 Inf Inf 0.0%
5/1 U N/A N/A - - - - 1304 Inf Inf 0.0%
6/1 U N/A N/A - - - - 704 Inf Inf 0.0%

Full Input Data And Results
Item Arriving (pcu) Leaving(pcu)
Turners InGaps (pcu)
Turners WhenUnopposed(pcu)
Turners InIntergreen(pcu)
UniformDelay(pcuHr)
Rand +OversatDelay(pcuHr)
StorageAreaUniformDelay(pcuHr)
TotalDelay(pcuHr)
Av. DelayPer PCU(s/pcu)
Max. Back ofUniformQueue (pcu)
Rand +OversatQueue (pcu)
MeanMaxQueue(pcu)
Network: WindyCorner Junction -with Torbay CouncilProposed HighwayWorks
- - 323 381 0 12.4 5.8 0.2 18.4 - - - -
Windy CornerJunction - - 323 381 0 12.4 5.8 0.2 18.4 - - - -
1/1 587 587 - - - 3.5 1.3 - 4.8 29.5 12.1 1.3 13.4
1/2 45 45 45 0 0 0.2 0.2 0.2 0.6 46.0 0.7 0.2 0.8
2/2+2/1 1199 1199 278 381 0 4.3 1.1 - 5.4 16.3 12.5 1.1 13.6
3/1 780 780 - - - 4.4 3.2 - 7.6 35.0 17.3 3.2 20.5
4/1 603 603 - - - 0.0 0.0 - 0.0 0.0 0.0 0.0 0.0
5/1 1304 1304 - - - 0.0 0.0 - 0.0 0.0 0.0 0.0 0.0
6/1 704 704 - - - 0.0 0.0 - 0.0 0.0 0.0 0.0 0.0
C1 PRC for Signalled Lanes (%): 3.5 Total Delay for Signalled Lanes (pcuHr): 18.39 Cycle Time (s): 90 PRC Over All Lanes (%): 3.5 Total Delay Over All Lanes(pcuHr): 18.39

Full Input Data And ResultsScenario 11: 'TA 2019 AM' (FG17: 'TA 2019 AM', Plan 1: 'Network Control Plan 1')Stage Sequence Diagram
A
B
1 Min: 7
7 35s
AD2 Min: 4
3 4s
C3 Min: 7
5 36s
Stage TimingsStage 1 2 3
Duration 35 4 36
Change Point 0 42 49
Signal Timings Diagram
0
0
10
10
20
20
30
30
40
40
50
50
60
60
70
70
80
80
90
90
Time in cycle (sec)
Pha
ses
1 7 : 350
23 : 442
3 5 : 3649
D DC CB BA A
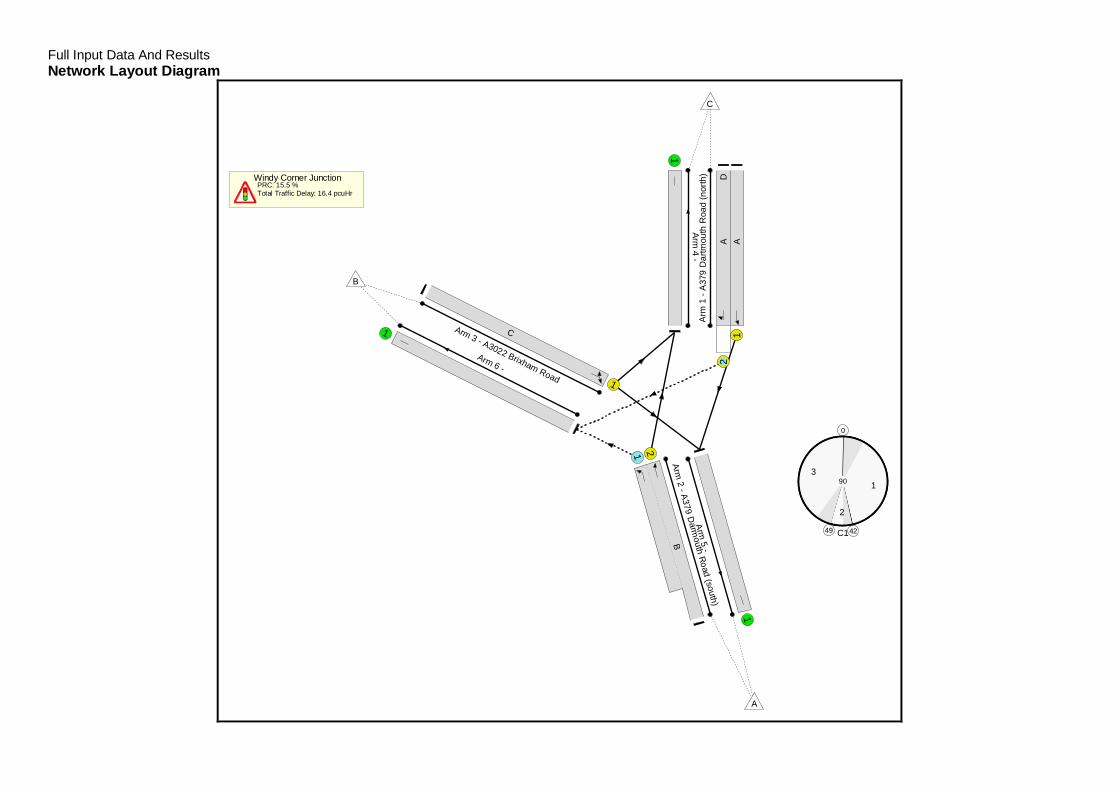
Full Input Data And ResultsNetwork Layout Diagram
Windy Corner JunctionPRC: 15.5 %Total Traffic Delay: 16.4 pcuHr
C1
0
1
42
2
49
390
Arm
1- A
379
Dar
tmou
thR
oad
(nor
th)
12
AAD
Arm2
- A379D
armouth
Road(south)
1 2
B
Arm 3 - A3022 Brixham Road 1
C
Arm4
-
1
Arm5
-
1
Arm 6 -
1
A
B
C

Full Input Data And Results
Network Results
Item LaneDescription
LaneType
ControllerStream
Position InFiltered Route Full Phase Arrow
PhaseNumGreens
Total Green(s)
ArrowGreen (s)
DemandFlow (pcu)
Sat Flow(pcu/Hr)
Capacity(pcu)
Deg Sat(%)
Network: WindyCorner Junction -with Torbay CouncilProposed HighwayWorks
- - N/A - - - - - - - - 78.0%
Windy CornerJunction - - N/A - - - - - - - - 78.0%
1/1A379 Dartmouth
Road (north)Ahead
U N/A N/A A 1 44 - 668 1925 962 69.4%
1/2A379 Dartmouth
Road (north)Right
O N/A N/A A D 1 44 4 56 1649 148 37.7%
2/2+2/1A379 Darmouth
Road (south)Ahead Left
U+O N/A N/A B - 1 35 - 1533 1973:1974 778+1196 77.7 :77.7%
3/1 A3022 BrixhamRoad Left Right U N/A N/A C 1 36 - 590 1841 757 78.0%
4/1 U N/A N/A - - - - 632 Inf Inf 0.0%
5/1 U N/A N/A - - - - 1230 Inf Inf 0.0%
6/1 U N/A N/A - - - - 985 Inf Inf 0.0%

Full Input Data And Results
Item Arriving (pcu) Leaving(pcu)
Turners InGaps (pcu)
Turners WhenUnopposed(pcu)
Turners InIntergreen(pcu)
UniformDelay(pcuHr)
Rand +OversatDelay(pcuHr)
StorageAreaUniformDelay(pcuHr)
TotalDelay(pcuHr)
Av. DelayPer PCU(s/pcu)
Max. Back ofUniformQueue (pcu)
Rand +OversatQueue (pcu)
MeanMaxQueue(pcu)
Network: WindyCorner Junction -with Torbay CouncilProposed HighwayWorks
- - 521 465 0 11.1 4.9 0.4 16.4 - - - -
Windy CornerJunction - - 521 465 0 11.1 4.9 0.4 16.4 - - - -
1/1 668 668 - - - 3.2 1.1 - 4.3 23.3 12.6 1.1 13.7
1/2 56 56 56 0 0 0.2 0.3 0.4 0.9 58.2 0.7 0.3 1.0
2/2+2/1 1533 1533 465 465 0 3.9 1.7 - 5.6 13.3 12.9 1.7 14.6
3/1 590 590 - - - 3.8 1.7 - 5.5 33.5 12.6 1.7 14.4
4/1 632 632 - - - 0.0 0.0 - 0.0 0.0 0.0 0.0 0.0
5/1 1230 1230 - - - 0.0 0.0 - 0.0 0.0 0.0 0.0 0.0
6/1 985 985 - - - 0.0 0.0 - 0.0 0.0 0.0 0.0 0.0
C1 PRC for Signalled Lanes (%): 15.5 Total Delay for Signalled Lanes (pcuHr): 16.37 Cycle Time (s): 90 PRC Over All Lanes (%): 15.5 Total Delay Over All Lanes(pcuHr): 16.37

Full Input Data And ResultsScenario 12: 'TA 2019 PM' (FG18: 'TA 2019 PM', Plan 1: 'Network Control Plan 1')Stage Sequence Diagram
A
B
1 Min: 7
7 25s
AD2 Min: 4
3 4s
C3 Min: 7
5 46s
Stage TimingsStage 1 2 3
Duration 25 4 46
Change Point 0 32 39
Signal Timings Diagram
0
0
10
10
20
20
30
30
40
40
50
50
60
60
70
70
80
80
90
90
Time in cycle (sec)
Pha
ses
1 7 : 250
23 : 432
3 5 : 4639
D DC CB BA A
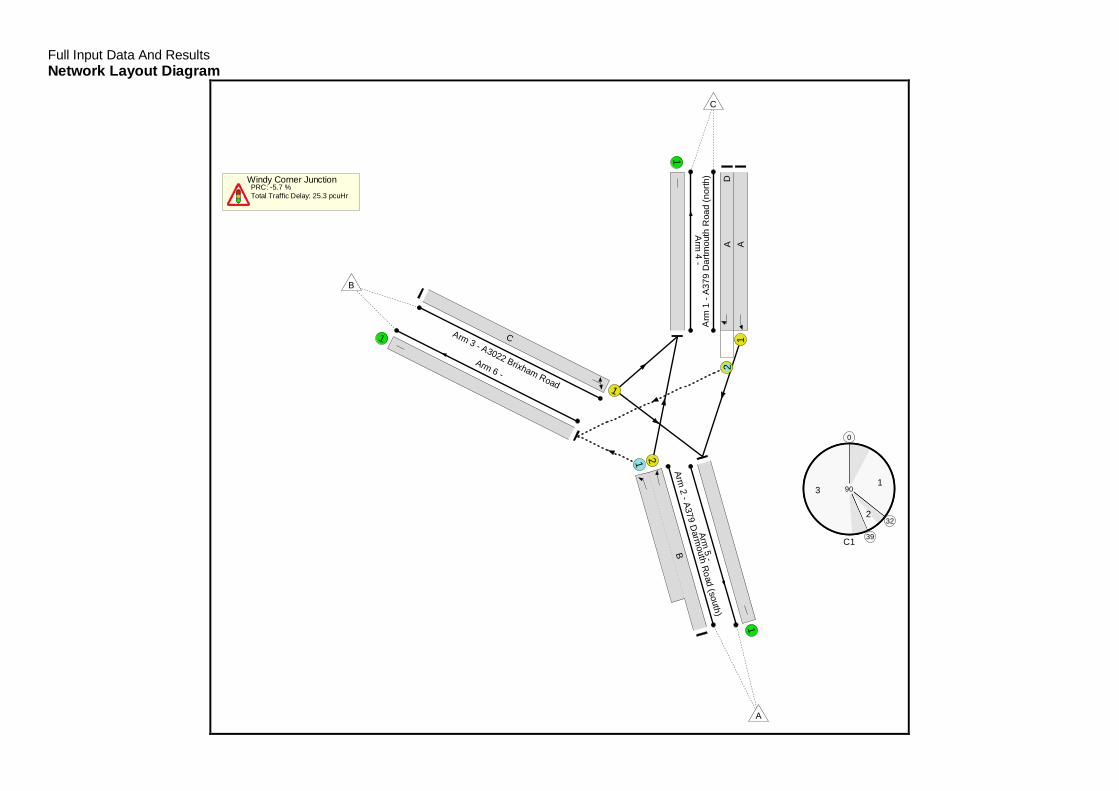
Full Input Data And ResultsNetwork Layout Diagram
Windy Corner JunctionPRC: -5.7 %Total Traffic Delay: 25.3 pcuHr
C1
0
1
322
39
3 90
Arm
1-A
379
Dar
tmou
thR
oad
(nor
th)
12
AAD
Arm2
- A379D
armouth
Road
(south)
1 2
B
Arm 3 - A3022 Brixham Road 1
C
Arm
4-
1
Arm5
-
1Arm 6 -
1
A
B
C
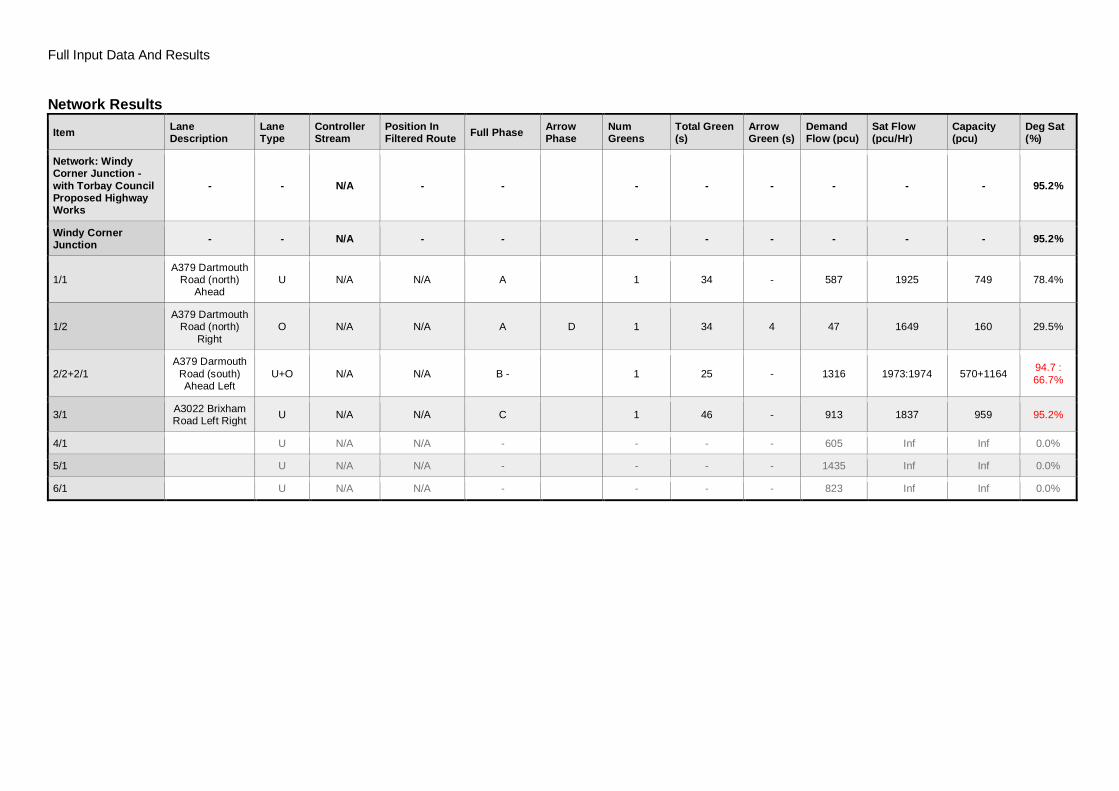
Full Input Data And Results
Network Results
Item LaneDescription
LaneType
ControllerStream
Position InFiltered Route Full Phase Arrow
PhaseNumGreens
Total Green(s)
ArrowGreen (s)
DemandFlow (pcu)
Sat Flow(pcu/Hr)
Capacity(pcu)
Deg Sat(%)
Network: WindyCorner Junction -with Torbay CouncilProposed HighwayWorks
- - N/A - - - - - - - - 95.2%
Windy CornerJunction - - N/A - - - - - - - - 95.2%
1/1A379 Dartmouth
Road (north)Ahead
U N/A N/A A 1 34 - 587 1925 749 78.4%
1/2A379 Dartmouth
Road (north)Right
O N/A N/A A D 1 34 4 47 1649 160 29.5%
2/2+2/1A379 Darmouth
Road (south)Ahead Left
U+O N/A N/A B - 1 25 - 1316 1973:1974 570+1164 94.7 :66.7%
3/1 A3022 BrixhamRoad Left Right U N/A N/A C 1 46 - 913 1837 959 95.2%
4/1 U N/A N/A - - - - 605 Inf Inf 0.0%
5/1 U N/A N/A - - - - 1435 Inf Inf 0.0%
6/1 U N/A N/A - - - - 823 Inf Inf 0.0%
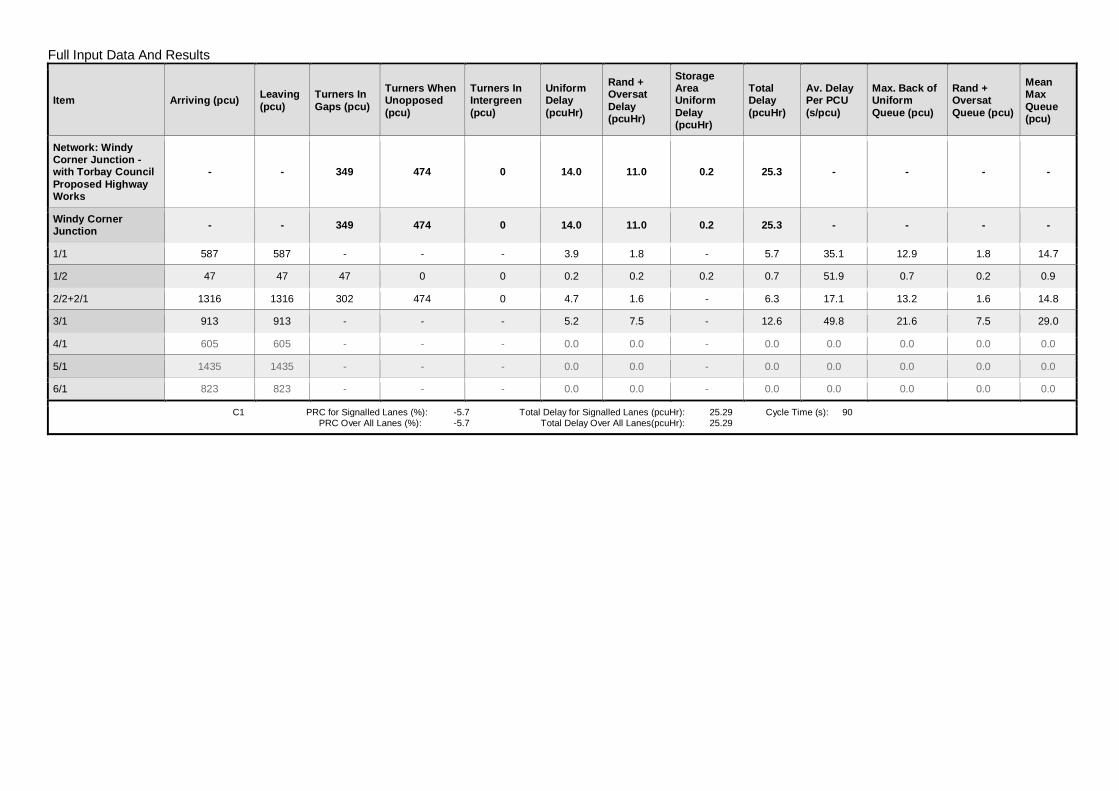
Full Input Data And Results
Item Arriving (pcu) Leaving(pcu)
Turners InGaps (pcu)
Turners WhenUnopposed(pcu)
Turners InIntergreen(pcu)
UniformDelay(pcuHr)
Rand +OversatDelay(pcuHr)
StorageAreaUniformDelay(pcuHr)
TotalDelay(pcuHr)
Av. DelayPer PCU(s/pcu)
Max. Back ofUniformQueue (pcu)
Rand +OversatQueue (pcu)
MeanMaxQueue(pcu)
Network: WindyCorner Junction -with Torbay CouncilProposed HighwayWorks
- - 349 474 0 14.0 11.0 0.2 25.3 - - - -
Windy CornerJunction - - 349 474 0 14.0 11.0 0.2 25.3 - - - -
1/1 587 587 - - - 3.9 1.8 - 5.7 35.1 12.9 1.8 14.7
1/2 47 47 47 0 0 0.2 0.2 0.2 0.7 51.9 0.7 0.2 0.9
2/2+2/1 1316 1316 302 474 0 4.7 1.6 - 6.3 17.1 13.2 1.6 14.8
3/1 913 913 - - - 5.2 7.5 - 12.6 49.8 21.6 7.5 29.0
4/1 605 605 - - - 0.0 0.0 - 0.0 0.0 0.0 0.0 0.0
5/1 1435 1435 - - - 0.0 0.0 - 0.0 0.0 0.0 0.0 0.0
6/1 823 823 - - - 0.0 0.0 - 0.0 0.0 0.0 0.0 0.0
C1 PRC for Signalled Lanes (%): -5.7 Total Delay for Signalled Lanes (pcuHr): 25.29 Cycle Time (s): 90 PRC Over All Lanes (%): -5.7 Total Delay Over All Lanes(pcuHr): 25.29
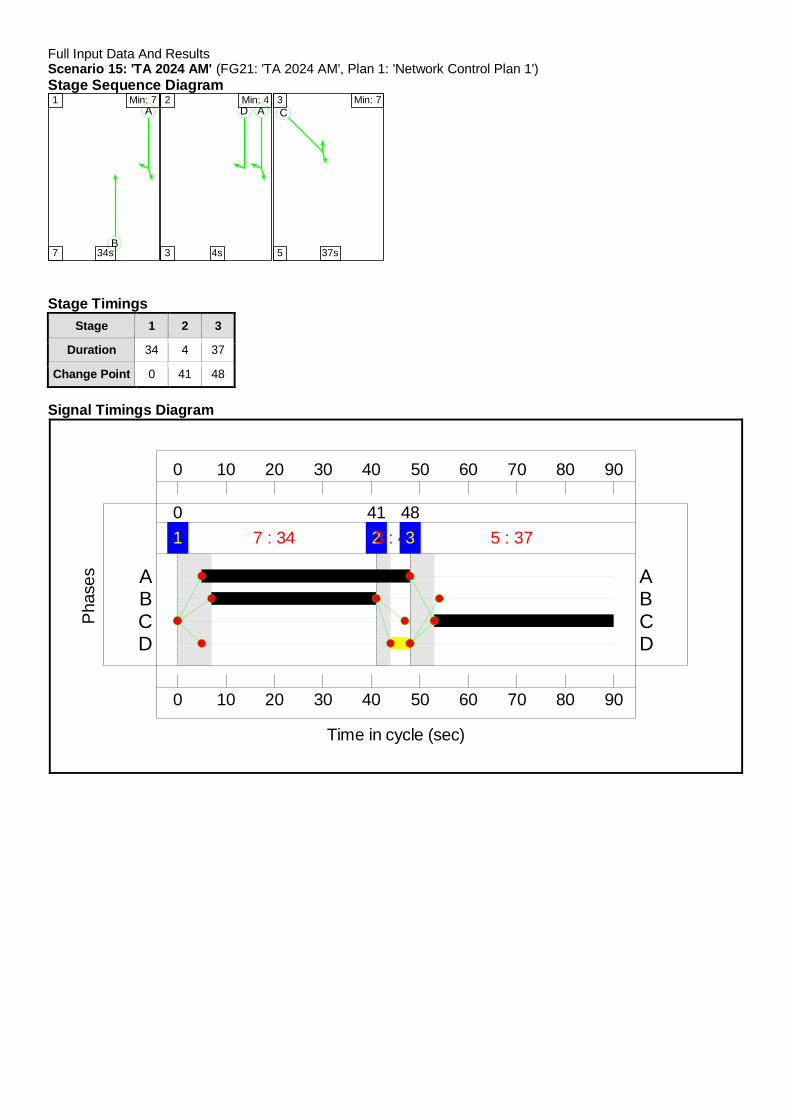
Full Input Data And ResultsScenario 15: 'TA 2024 AM' (FG21: 'TA 2024 AM', Plan 1: 'Network Control Plan 1')Stage Sequence Diagram
A
B
1 Min: 7
7 34s
AD2 Min: 4
3 4s
C3 Min: 7
5 37s
Stage TimingsStage 1 2 3
Duration 34 4 37
Change Point 0 41 48
Signal Timings Diagram
0
0
10
10
20
20
30
30
40
40
50
50
60
60
70
70
80
80
90
90
Time in cycle (sec)
Pha
ses
1 7 : 340
23 : 441
3 5 : 3748
D DC CB BA A

Full Input Data And ResultsNetwork Layout Diagram
Windy Corner JunctionPRC: 12.9 %Total Traffic Delay: 17.3 pcuHr
C1
0
1
41
2
48
390
Arm
1-A
379
Dar
tmou
thR
oad
(nor
th)
12
AAD
Arm
2- A
379D
armouth
Road
(south)
1 2
B
Arm 3 - A3022 Brixham Road 1
C
Arm
4-
1
Arm5
-
1
Arm 6 -
1
A
B
C

Full Input Data And Results
Network Results
Item LaneDescription
LaneType
ControllerStream
Position InFiltered Route Full Phase Arrow
PhaseNumGreens
Total Green(s)
ArrowGreen (s)
DemandFlow (pcu)
Sat Flow(pcu/Hr)
Capacity(pcu)
Deg Sat(%)
Network: WindyCorner Junction -with Torbay CouncilProposed HighwayWorks
- - N/A - - - - - - - - 79.7%
Windy CornerJunction - - N/A - - - - - - - - 79.7%
1/1A379 Dartmouth
Road (north)Ahead
U N/A N/A A 1 43 - 668 1925 941 71.0%
1/2A379 Dartmouth
Road (north)Right
O N/A N/A A D 1 43 4 57 1649 146 39.2%
2/2+2/1A379 Darmouth
Road (south)Ahead Left
U+O N/A N/A B - 1 34 - 1572 1973:1974 758+1215 79.7 :79.7%
3/1 A3022 BrixhamRoad Left Right U N/A N/A C 1 37 - 620 1842 778 79.7%
4/1 U N/A N/A - - - - 632 Inf Inf 0.0%
5/1 U N/A N/A - - - - 1260 Inf Inf 0.0%
6/1 U N/A N/A - - - - 1025 Inf Inf 0.0%
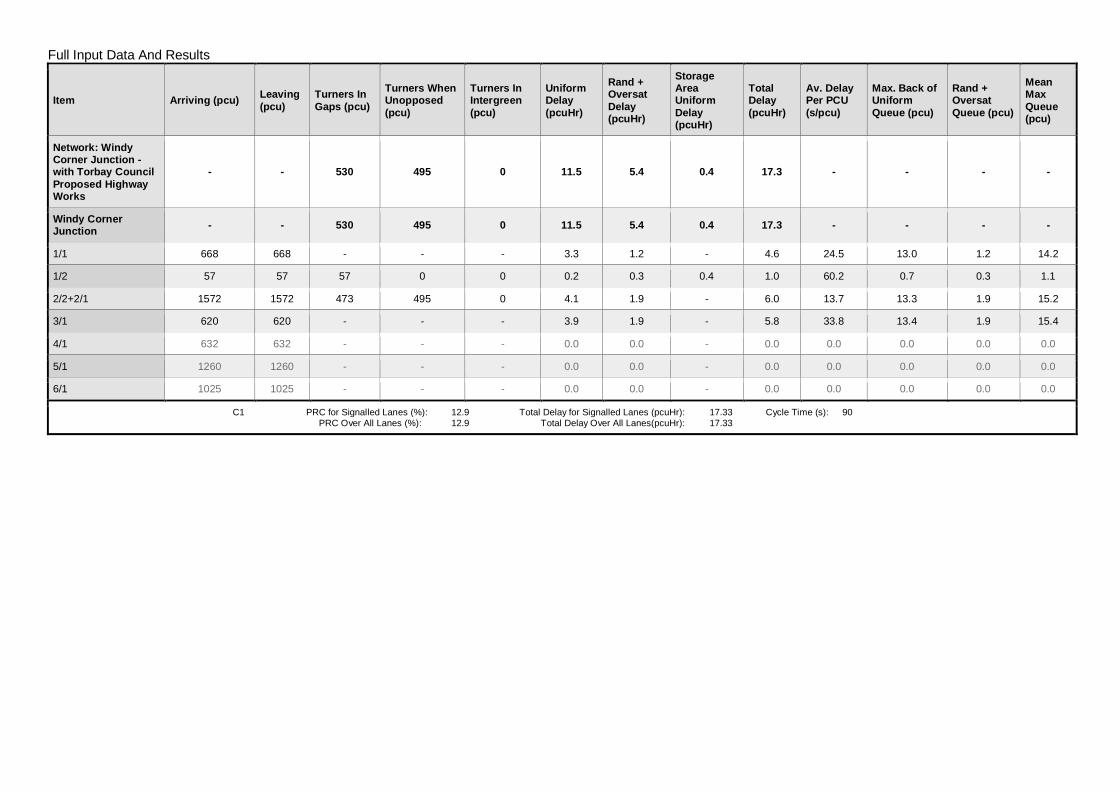
Full Input Data And Results
Item Arriving (pcu) Leaving(pcu)
Turners InGaps (pcu)
Turners WhenUnopposed(pcu)
Turners InIntergreen(pcu)
UniformDelay(pcuHr)
Rand +OversatDelay(pcuHr)
StorageAreaUniformDelay(pcuHr)
TotalDelay(pcuHr)
Av. DelayPer PCU(s/pcu)
Max. Back ofUniformQueue (pcu)
Rand +OversatQueue (pcu)
MeanMaxQueue(pcu)
Network: WindyCorner Junction -with Torbay CouncilProposed HighwayWorks
- - 530 495 0 11.5 5.4 0.4 17.3 - - - -
Windy CornerJunction - - 530 495 0 11.5 5.4 0.4 17.3 - - - -
1/1 668 668 - - - 3.3 1.2 - 4.6 24.5 13.0 1.2 14.2
1/2 57 57 57 0 0 0.2 0.3 0.4 1.0 60.2 0.7 0.3 1.1
2/2+2/1 1572 1572 473 495 0 4.1 1.9 - 6.0 13.7 13.3 1.9 15.2
3/1 620 620 - - - 3.9 1.9 - 5.8 33.8 13.4 1.9 15.4
4/1 632 632 - - - 0.0 0.0 - 0.0 0.0 0.0 0.0 0.0
5/1 1260 1260 - - - 0.0 0.0 - 0.0 0.0 0.0 0.0 0.0
6/1 1025 1025 - - - 0.0 0.0 - 0.0 0.0 0.0 0.0 0.0
C1 PRC for Signalled Lanes (%): 12.9 Total Delay for Signalled Lanes (pcuHr): 17.33 Cycle Time (s): 90 PRC Over All Lanes (%): 12.9 Total Delay Over All Lanes(pcuHr): 17.33
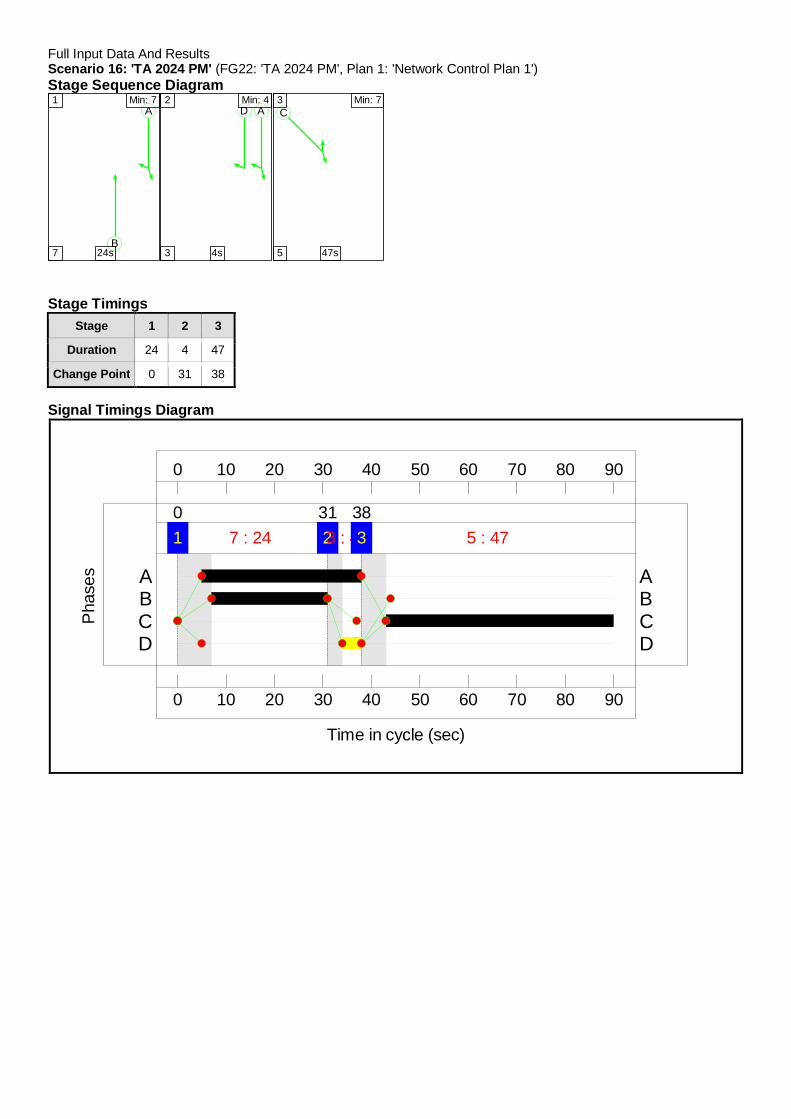
Full Input Data And ResultsScenario 16: 'TA 2024 PM' (FG22: 'TA 2024 PM', Plan 1: 'Network Control Plan 1')Stage Sequence Diagram
A
B
1 Min: 7
7 24s
AD2 Min: 4
3 4s
C3 Min: 7
5 47s
Stage TimingsStage 1 2 3
Duration 24 4 47
Change Point 0 31 38
Signal Timings Diagram
0
0
10
10
20
20
30
30
40
40
50
50
60
60
70
70
80
80
90
90
Time in cycle (sec)
Pha
ses
1 7 : 240
23 : 431
3 5 : 4738
D DC CB BA A
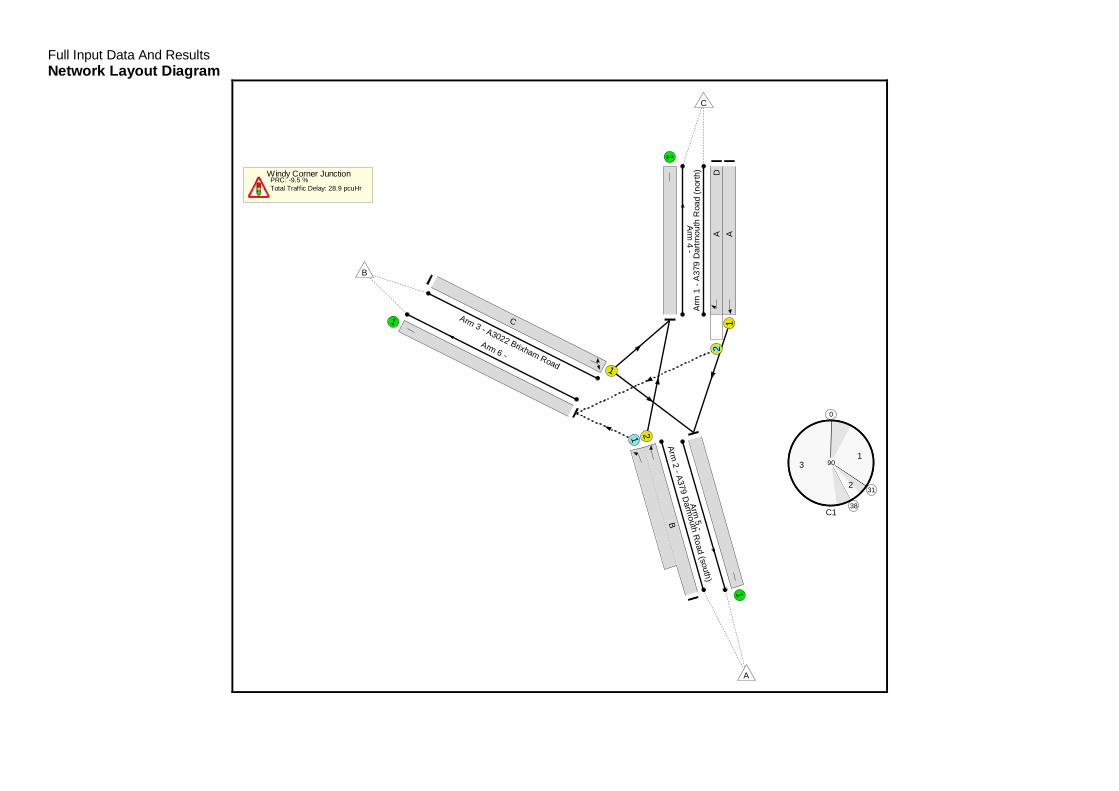
Full Input Data And ResultsNetwork Layout Diagram
Windy Corner JunctionPRC: -9.5 %Total Traffic Delay: 28.9 pcuHr
C1
0
1
312
38
3 90
Arm
1-A
379
Dar
tmou
thR
oad
(nor
th)
12
AAD
Arm2
- A379D
armouth
Road
(south)
1 2
B
Arm 3 - A3022 Brixham Road 1
C
Arm
4-
1
Arm5
-
1
Arm 6 -
1
A
B
C
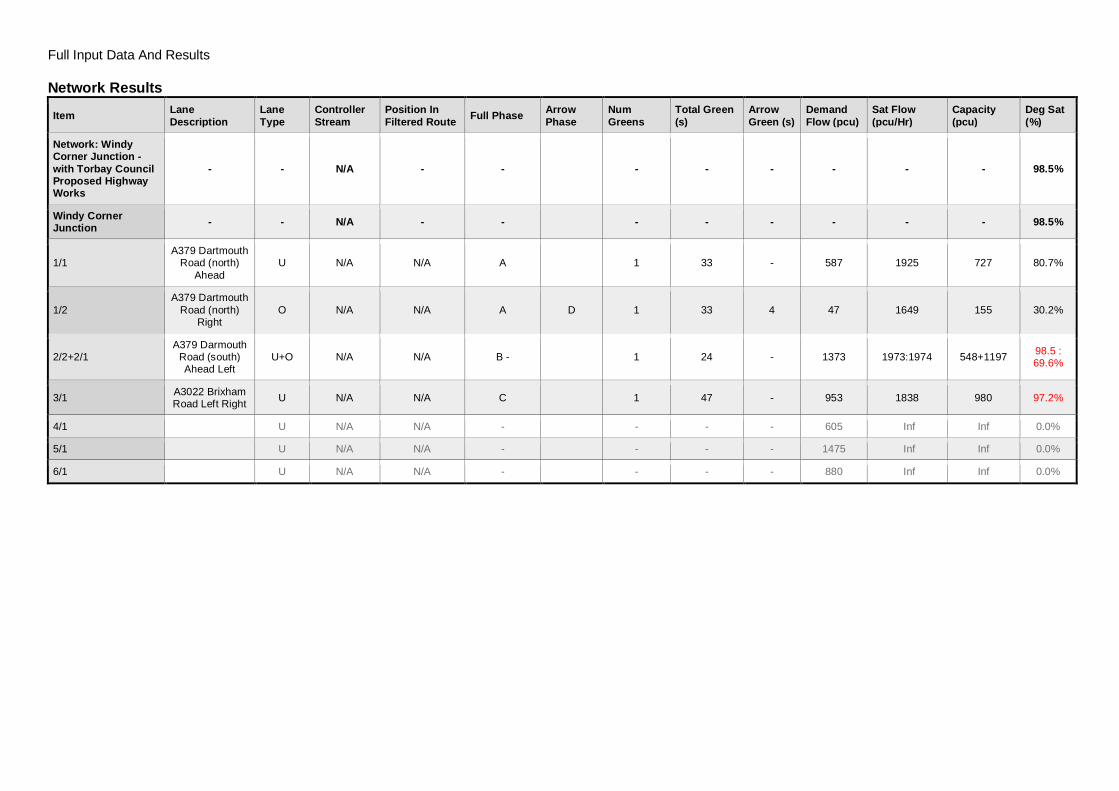
Full Input Data And Results
Network Results
Item LaneDescription
LaneType
ControllerStream
Position InFiltered Route Full Phase Arrow
PhaseNumGreens
Total Green(s)
ArrowGreen (s)
DemandFlow (pcu)
Sat Flow(pcu/Hr)
Capacity(pcu)
Deg Sat(%)
Network: WindyCorner Junction -with Torbay CouncilProposed HighwayWorks
- - N/A - - - - - - - - 98.5%
Windy CornerJunction - - N/A - - - - - - - - 98.5%
1/1A379 Dartmouth
Road (north)Ahead
U N/A N/A A 1 33 - 587 1925 727 80.7%
1/2A379 Dartmouth
Road (north)Right
O N/A N/A A D 1 33 4 47 1649 155 30.2%
2/2+2/1A379 Darmouth
Road (south)Ahead Left
U+O N/A N/A B - 1 24 - 1373 1973:1974 548+1197 98.5 :69.6%
3/1 A3022 BrixhamRoad Left Right U N/A N/A C 1 47 - 953 1838 980 97.2%
4/1 U N/A N/A - - - - 605 Inf Inf 0.0%
5/1 U N/A N/A - - - - 1475 Inf Inf 0.0%
6/1 U N/A N/A - - - - 880 Inf Inf 0.0%

Full Input Data And Results
Item Arriving (pcu) Leaving(pcu)
Turners InGaps (pcu)
Turners WhenUnopposed(pcu)
Turners InIntergreen(pcu)
UniformDelay(pcuHr)
Rand +OversatDelay(pcuHr)
StorageAreaUniformDelay(pcuHr)
TotalDelay(pcuHr)
Av. DelayPer PCU(s/pcu)
Max. Back ofUniformQueue (pcu)
Rand +OversatQueue (pcu)
MeanMaxQueue(pcu)
Network: WindyCorner Junction -with Torbay CouncilProposed HighwayWorks
- - 362 518 0 14.6 14.1 0.2 28.9 - - - -
Windy CornerJunction - - 362 518 0 14.6 14.1 0.2 28.9 - - - -
1/1 587 587 - - - 4.1 2.0 - 6.1 37.5 13.0 2.0 15.1
1/2 47 47 47 0 0 0.2 0.2 0.2 0.7 53.4 0.7 0.2 1.0
2/2+2/1 1373 1373 315 518 0 4.8 1.8 - 6.7 17.5 13.4 1.8 15.2
3/1 953 953 - - - 5.4 10.1 - 15.4 58.3 23.0 10.1 33.1
4/1 605 605 - - - 0.0 0.0 - 0.0 0.0 0.0 0.0 0.0
5/1 1475 1475 - - - 0.0 0.0 - 0.0 0.0 0.0 0.0 0.0
6/1 880 880 - - - 0.0 0.0 - 0.0 0.0 0.0 0.0 0.0
C1 PRC for Signalled Lanes (%): -9.5 Total Delay for Signalled Lanes (pcuHr): 28.94 Cycle Time (s): 90 PRC Over All Lanes (%): -9.5 Total Delay Over All Lanes(pcuHr): 28.94
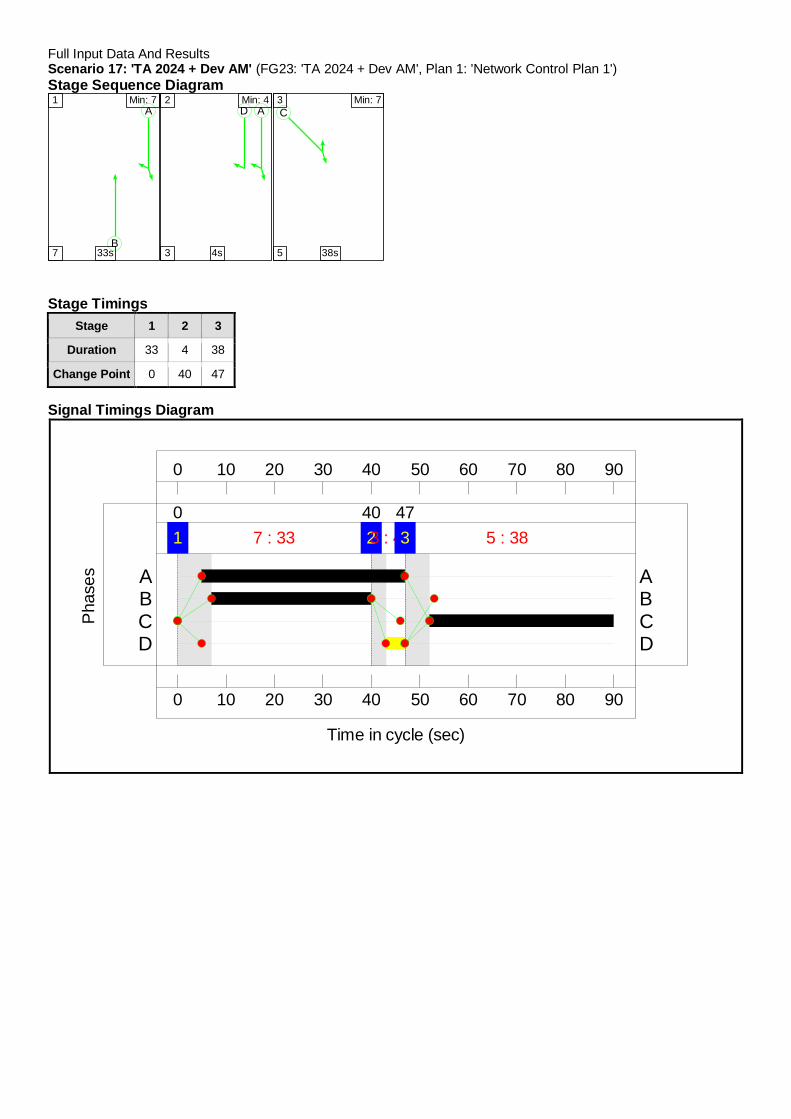
Full Input Data And ResultsScenario 17: 'TA 2024 + Dev AM' (FG23: 'TA 2024 + Dev AM', Plan 1: 'Network Control Plan 1')Stage Sequence Diagram
A
B
1 Min: 7
7 33s
AD2 Min: 4
3 4s
C3 Min: 7
5 38s
Stage TimingsStage 1 2 3
Duration 33 4 38
Change Point 0 40 47
Signal Timings Diagram
0
0
10
10
20
20
30
30
40
40
50
50
60
60
70
70
80
80
90
90
Time in cycle (sec)
Pha
ses
1 7 : 330
23 : 440
3 5 : 3847
D DC CB BA A
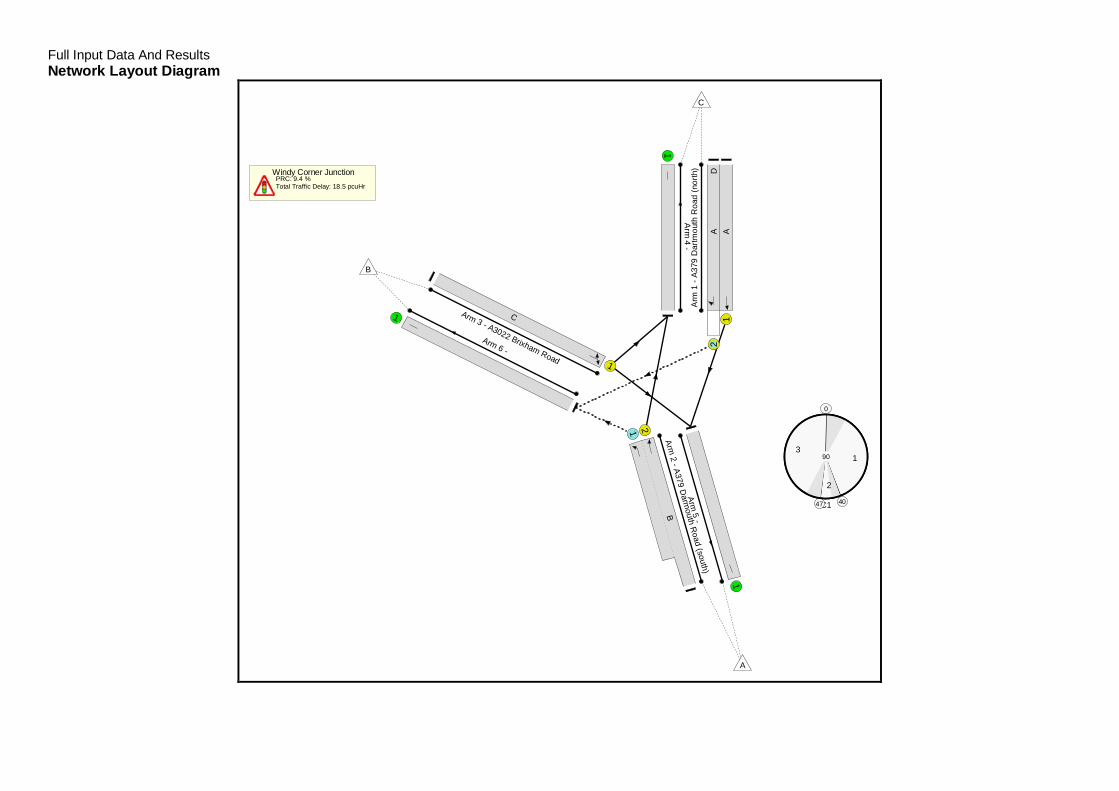
Full Input Data And ResultsNetwork Layout Diagram
Windy Corner JunctionPRC: 9.4 %Total Traffic Delay: 18.5 pcuHr
C1
0
1
40
2
47
390
Arm
1-A
379
Dar
tmou
thR
oad
(nor
th)
12
AAD
Arm2
- A379D
armouth
Road
(south)
1 2
B
Arm 3 - A3022 Brixham Road 1
C
Arm
4-
1
Arm5
-
1
Arm 6 -
1
A
B
C
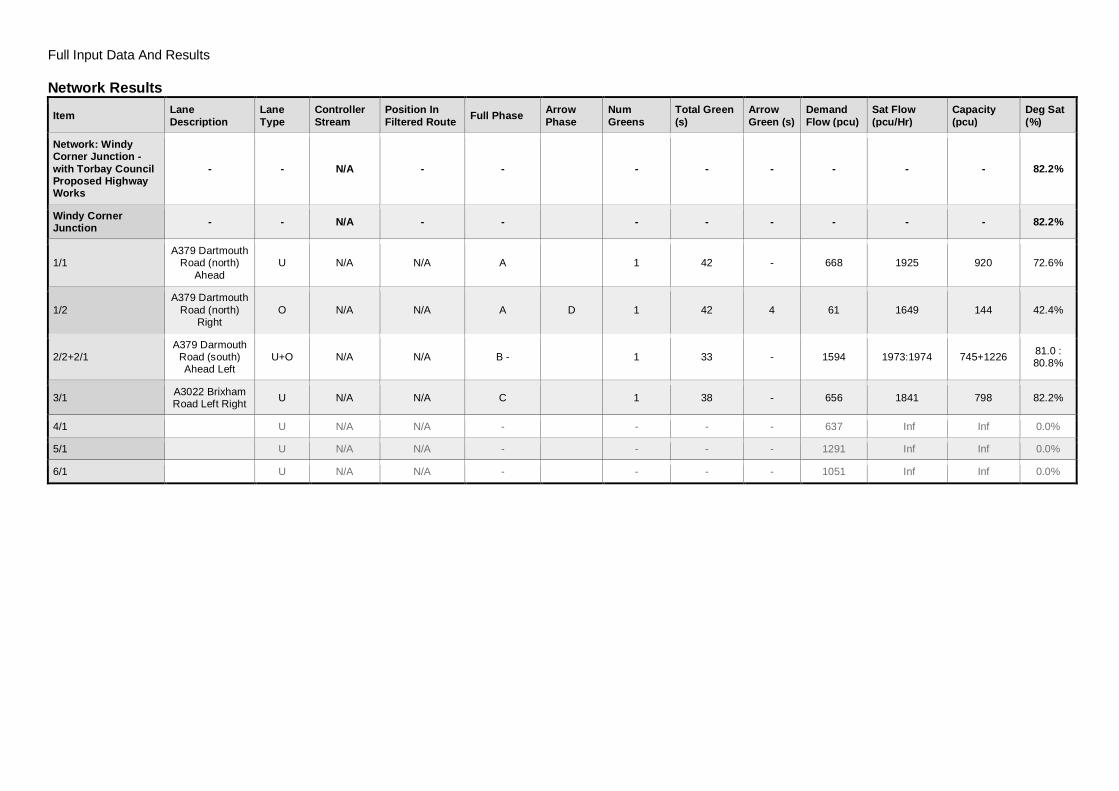
Full Input Data And Results
Network Results
Item LaneDescription
LaneType
ControllerStream
Position InFiltered Route Full Phase Arrow
PhaseNumGreens
Total Green(s)
ArrowGreen (s)
DemandFlow (pcu)
Sat Flow(pcu/Hr)
Capacity(pcu)
Deg Sat(%)
Network: WindyCorner Junction -with Torbay CouncilProposed HighwayWorks
- - N/A - - - - - - - - 82.2%
Windy CornerJunction - - N/A - - - - - - - - 82.2%
1/1A379 Dartmouth
Road (north)Ahead
U N/A N/A A 1 42 - 668 1925 920 72.6%
1/2A379 Dartmouth
Road (north)Right
O N/A N/A A D 1 42 4 61 1649 144 42.4%
2/2+2/1A379 Darmouth
Road (south)Ahead Left
U+O N/A N/A B - 1 33 - 1594 1973:1974 745+1226 81.0 :80.8%
3/1 A3022 BrixhamRoad Left Right U N/A N/A C 1 38 - 656 1841 798 82.2%
4/1 U N/A N/A - - - - 637 Inf Inf 0.0%
5/1 U N/A N/A - - - - 1291 Inf Inf 0.0%
6/1 U N/A N/A - - - - 1051 Inf Inf 0.0%

Full Input Data And Results
Item Arriving (pcu) Leaving(pcu)
Turners InGaps (pcu)
Turners WhenUnopposed(pcu)
Turners InIntergreen(pcu)
UniformDelay(pcuHr)
Rand +OversatDelay(pcuHr)
StorageAreaUniformDelay(pcuHr)
TotalDelay(pcuHr)
Av. DelayPer PCU(s/pcu)
Max. Back ofUniformQueue (pcu)
Rand +OversatQueue (pcu)
MeanMaxQueue(pcu)
Network: WindyCorner Junction -with Torbay CouncilProposed HighwayWorks
- - 534 517 0 12.0 6.0 0.5 18.5 - - - -
Windy CornerJunction - - 534 517 0 12.0 6.0 0.5 18.5 - - - -
1/1 668 668 - - - 3.5 1.3 - 4.8 25.9 13.2 1.3 14.5
1/2 61 61 61 0 0 0.2 0.4 0.5 1.1 62.9 0.8 0.4 1.2
2/2+2/1 1594 1594 473 517 0 4.2 2.1 - 6.3 14.2 13.4 2.1 15.5
3/1 656 656 - - - 4.1 2.2 - 6.3 34.8 14.4 2.2 16.6
4/1 637 637 - - - 0.0 0.0 - 0.0 0.0 0.0 0.0 0.0
5/1 1291 1291 - - - 0.0 0.0 - 0.0 0.0 0.0 0.0 0.0
6/1 1051 1051 - - - 0.0 0.0 - 0.0 0.0 0.0 0.0 0.0
C1 PRC for Signalled Lanes (%): 9.4 Total Delay for Signalled Lanes (pcuHr): 18.50 Cycle Time (s): 90 PRC Over All Lanes (%): 9.4 Total Delay Over All Lanes(pcuHr): 18.50
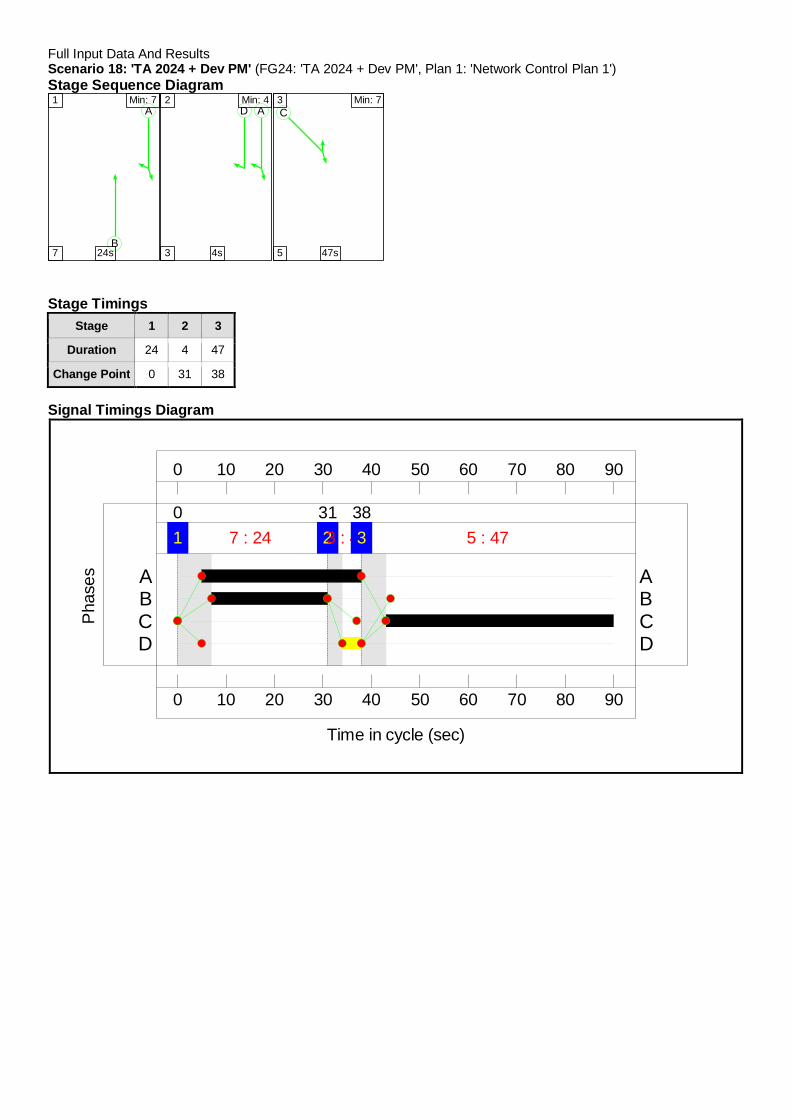
Full Input Data And ResultsScenario 18: 'TA 2024 + Dev PM' (FG24: 'TA 2024 + Dev PM', Plan 1: 'Network Control Plan 1')Stage Sequence Diagram
A
B
1 Min: 7
7 24s
AD2 Min: 4
3 4s
C3 Min: 7
5 47s
Stage TimingsStage 1 2 3
Duration 24 4 47
Change Point 0 31 38
Signal Timings Diagram
0
0
10
10
20
20
30
30
40
40
50
50
60
60
70
70
80
80
90
90
Time in cycle (sec)
Pha
ses
1 7 : 240
23 : 431
3 5 : 4738
D DC CB BA A

Full Input Data And ResultsNetwork Layout Diagram
Windy Corner JunctionPRC: -10.6 %Total Traffic Delay: 33.8 pcuHr
C1
0
1
312
38
3 90
Arm
1-A
379
Dar
tmou
thR
oad
(nor
th)
12
AAD
Arm2
- A379D
armouth
Road(south)
1 2
B
Arm 3 - A3022 Brixham Road 1
C
Arm4
-
1
Arm5
-
1Arm 6 -
1
A
B
C
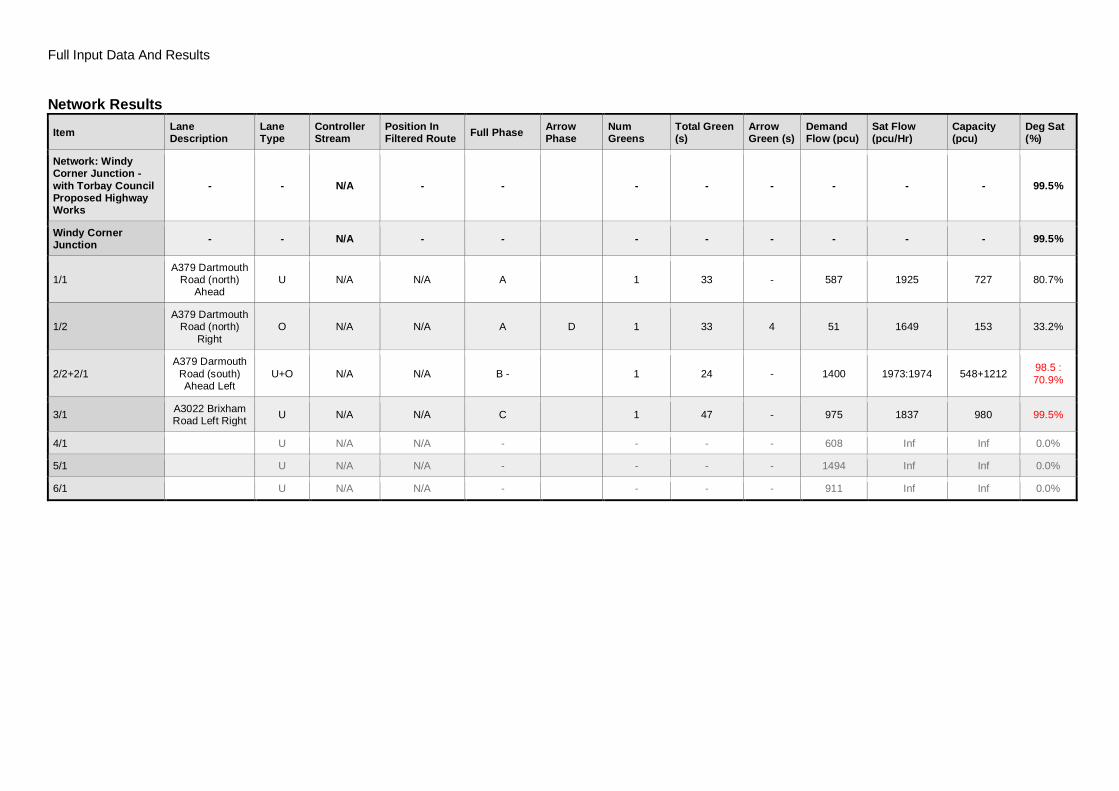
Full Input Data And Results
Network Results
Item LaneDescription
LaneType
ControllerStream
Position InFiltered Route Full Phase Arrow
PhaseNumGreens
Total Green(s)
ArrowGreen (s)
DemandFlow (pcu)
Sat Flow(pcu/Hr)
Capacity(pcu)
Deg Sat(%)
Network: WindyCorner Junction -with Torbay CouncilProposed HighwayWorks
- - N/A - - - - - - - - 99.5%
Windy CornerJunction - - N/A - - - - - - - - 99.5%
1/1A379 Dartmouth
Road (north)Ahead
U N/A N/A A 1 33 - 587 1925 727 80.7%
1/2A379 Dartmouth
Road (north)Right
O N/A N/A A D 1 33 4 51 1649 153 33.2%
2/2+2/1A379 Darmouth
Road (south)Ahead Left
U+O N/A N/A B - 1 24 - 1400 1973:1974 548+1212 98.5 :70.9%
3/1 A3022 BrixhamRoad Left Right U N/A N/A C 1 47 - 975 1837 980 99.5%
4/1 U N/A N/A - - - - 608 Inf Inf 0.0%
5/1 U N/A N/A - - - - 1494 Inf Inf 0.0%
6/1 U N/A N/A - - - - 911 Inf Inf 0.0%

Full Input Data And Results
Item Arriving (pcu) Leaving(pcu)
Turners InGaps (pcu)
Turners WhenUnopposed(pcu)
Turners InIntergreen(pcu)
UniformDelay(pcuHr)
Rand +OversatDelay(pcuHr)
StorageAreaUniformDelay(pcuHr)
TotalDelay(pcuHr)
Av. DelayPer PCU(s/pcu)
Max. Back ofUniformQueue (pcu)
Rand +OversatQueue (pcu)
MeanMaxQueue(pcu)
Network: WindyCorner Junction -with Torbay CouncilProposed HighwayWorks
- - 376 535 0 14.8 18.7 0.3 33.8 - - - -
Windy CornerJunction - - 376 535 0 14.8 18.7 0.3 33.8 - - - -
1/1 587 587 - - - 4.1 2.0 - 6.1 37.5 13.0 2.0 15.1
1/2 51 51 51 0 0 0.3 0.2 0.3 0.8 55.3 0.8 0.2 1.1
2/2+2/1 1400 1400 325 535 0 4.8 1.9 - 6.8 17.4 13.4 1.9 15.3
3/1 975 975 - - - 5.7 14.5 - 20.1 74.3 24.1 14.5 38.6
4/1 608 608 - - - 0.0 0.0 - 0.0 0.0 0.0 0.0 0.0
5/1 1494 1494 - - - 0.0 0.0 - 0.0 0.0 0.0 0.0 0.0
6/1 911 911 - - - 0.0 0.0 - 0.0 0.0 0.0 0.0 0.0
C1 PRC for Signalled Lanes (%): -10.6 Total Delay for Signalled Lanes (pcuHr): 33.81 Cycle Time (s): 90 PRC Over All Lanes (%): -10.6 Total Delay Over All Lanes(pcuHr): 33.81
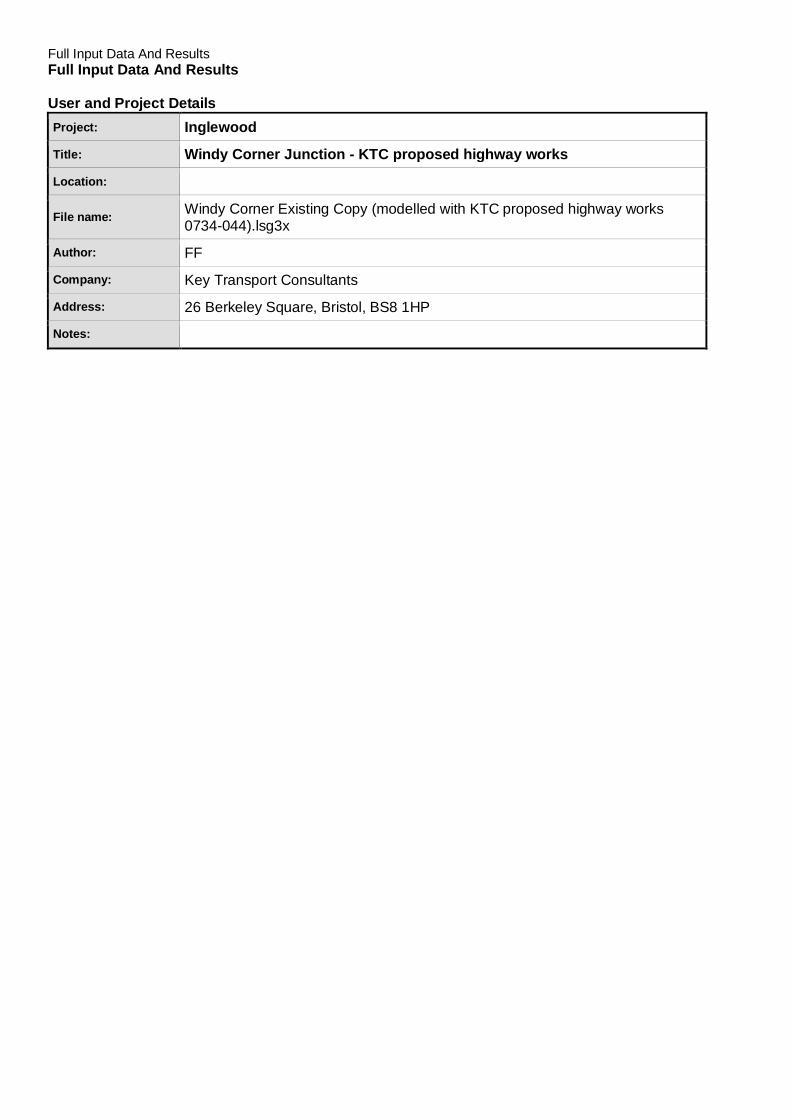
Full Input Data And ResultsFull Input Data And Results
User and Project DetailsProject: Inglewood
Title: Windy Corner Junction - KTC proposed highway works
Location:
File name: Windy Corner Existing Copy (modelled with KTC proposed highway works0734-044).lsg3x
Author: FF
Company: Key Transport Consultants
Address: 26 Berkeley Square, Bristol, BS8 1HP
Notes:
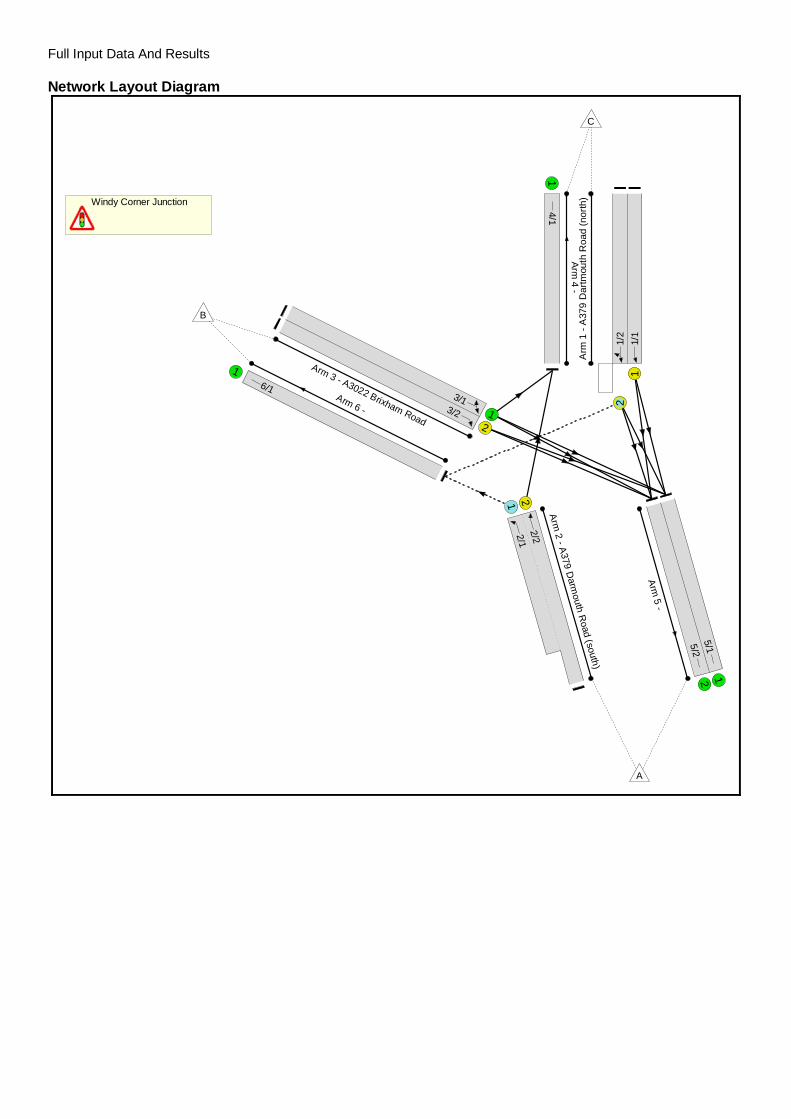
Full Input Data And Results
Network Layout Diagram
Windy Corner Junction
Arm
1-A
379
Dar
tmou
thR
oad
(nor
th)
12
1/1
1/2
Arm2
- A379D
armouth
Road
(south)
1 22/1
2/2
Arm 3 - A3022 Brixham Road1
2
3/13/2
Arm4
-
14/1
Arm5
-
125/15/2
Arm 6 -
16/1
A
B
C
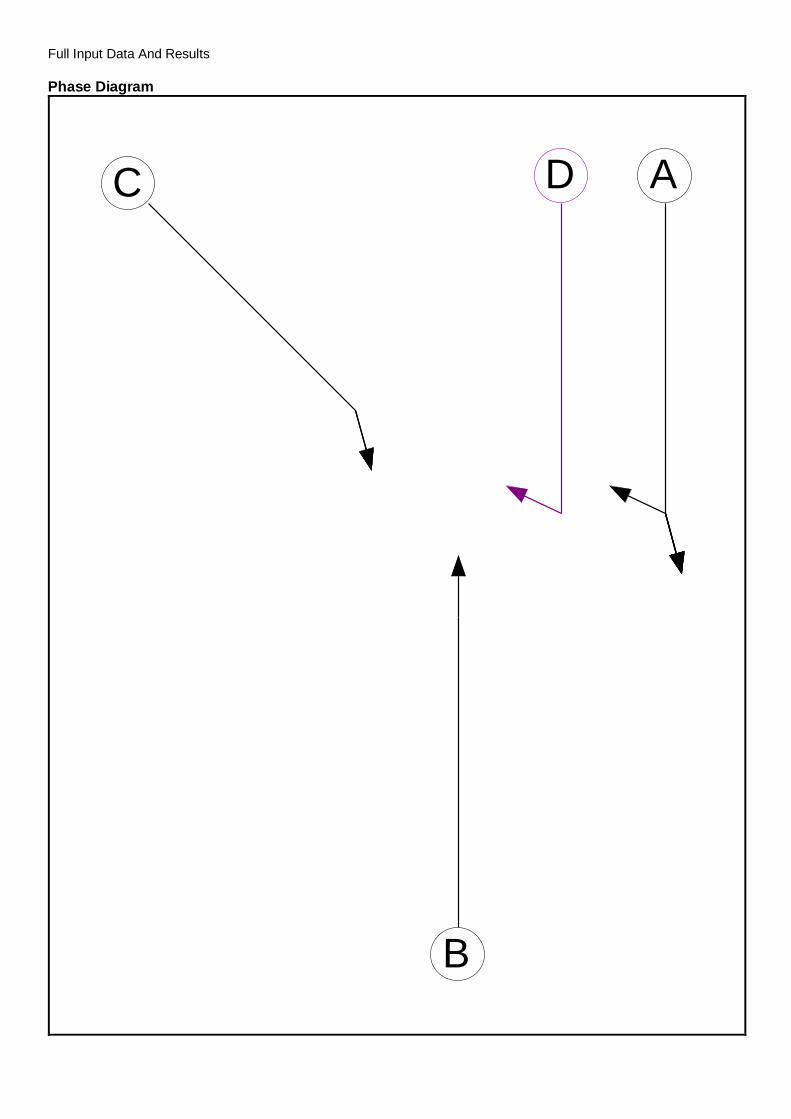
Full Input Data And Results
Phase Diagram
A
B
C D
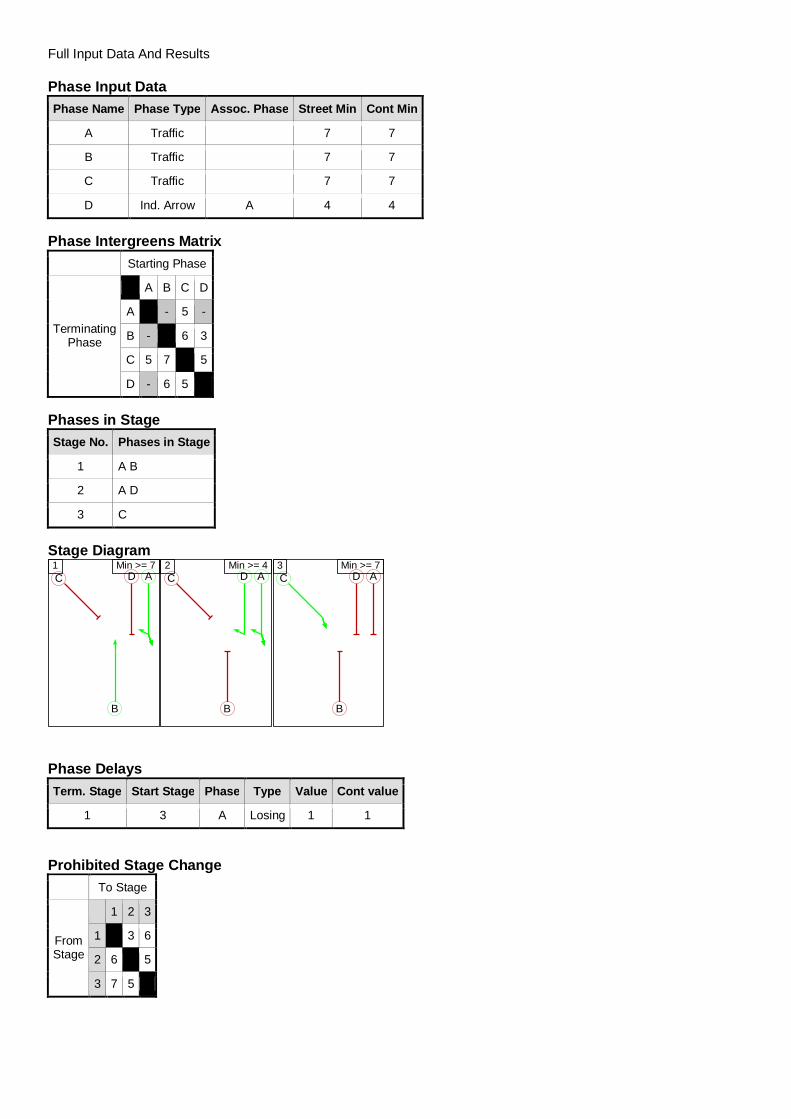
Full Input Data And Results
Phase Input DataPhase Name Phase Type Assoc. Phase Street Min Cont Min
A Traffic 7 7
B Traffic 7 7
C Traffic 7 7
D Ind. Arrow A 4 4
Phase Intergreens MatrixStarting Phase
TerminatingPhase
A B C D
A - - 5 -
B - - 6 3
C 5 7 - 5
D - 6 5 -
Phases in StageStage No. Phases in Stage
1 A B
2 A D
3 C
Stage DiagramA
B
C D1 Min >= 7
A
B
C D2 Min >= 4
A
B
C D3 Min >= 7
Phase DelaysTerm. Stage Start Stage Phase Type Value Cont value
1 3 A Losing 1 1
Prohibited Stage ChangeTo Stage
FromStage
1 2 3
1 3 6
2 6 5
3 7 5
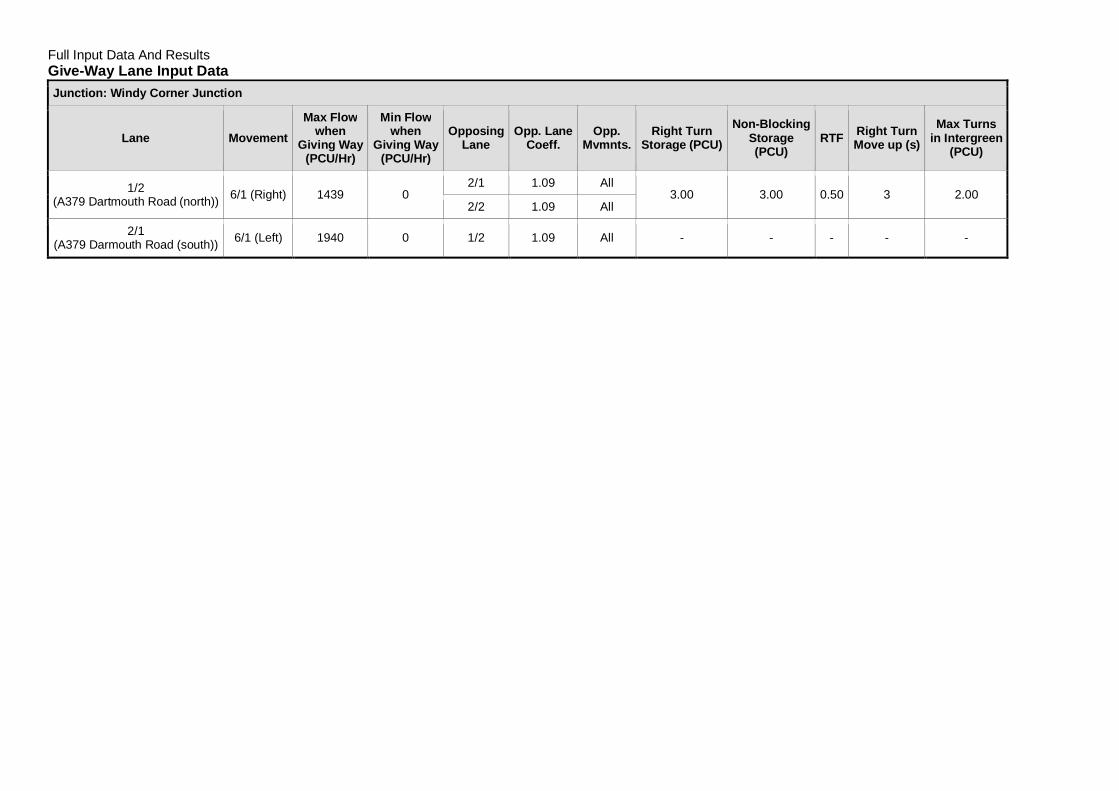
Full Input Data And ResultsGive-Way Lane Input DataJunction: Windy Corner Junction
Lane MovementMax Flow
whenGiving Way
(PCU/Hr)
Min Flowwhen
Giving Way(PCU/Hr)
OpposingLane
Opp. LaneCoeff.
Opp.Mvmnts.
Right TurnStorage (PCU)
Non-BlockingStorage(PCU)
RTF Right TurnMove up (s)
Max Turnsin Intergreen
(PCU)
1/2(A379 Dartmouth Road (north)) 6/1 (Right) 1439 0
2/1 1.09 All3.00 3.00 0.50 3 2.00
2/2 1.09 All
2/1(A379 Darmouth Road (south)) 6/1 (Left) 1940 0 1/2 1.09 All - - - - -
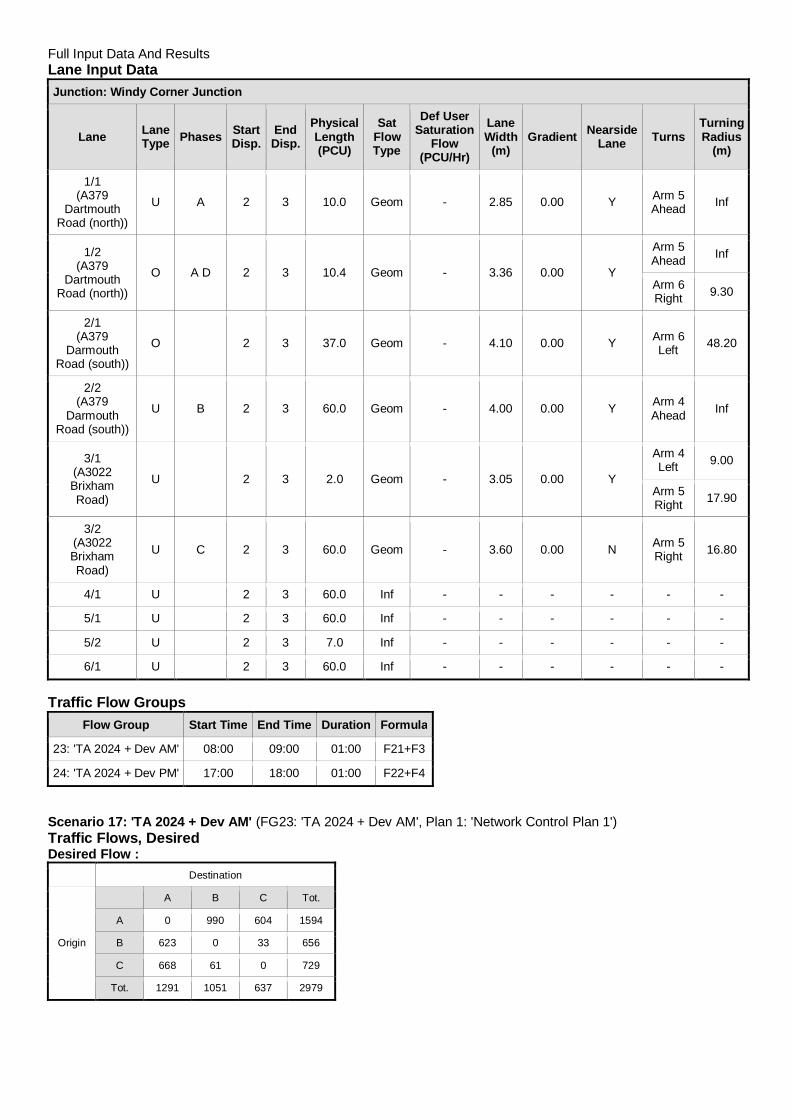
Full Input Data And ResultsLane Input DataJunction: Windy Corner Junction
Lane LaneType Phases Start
Disp.EndDisp.
PhysicalLength(PCU)
SatFlowType
Def UserSaturation
Flow(PCU/Hr)
LaneWidth
(m)Gradient Nearside
Lane TurnsTurningRadius
(m)
1/1(A379
DartmouthRoad (north))
U A 2 3 10.0 Geom - 2.85 0.00 Y Arm 5Ahead Inf
1/2(A379
DartmouthRoad (north))
O A D 2 3 10.4 Geom - 3.36 0.00 Y
Arm 5Ahead Inf
Arm 6Right 9.30
2/1(A379
DarmouthRoad (south))
O 2 3 37.0 Geom - 4.10 0.00 Y Arm 6Left 48.20
2/2(A379
DarmouthRoad (south))
U B 2 3 60.0 Geom - 4.00 0.00 Y Arm 4Ahead Inf
3/1(A3022BrixhamRoad)
U 2 3 2.0 Geom - 3.05 0.00 Y
Arm 4Left 9.00
Arm 5Right 17.90
3/2(A3022BrixhamRoad)
U C 2 3 60.0 Geom - 3.60 0.00 N Arm 5Right 16.80
4/1 U 2 3 60.0 Inf - - - - - -
5/1 U 2 3 60.0 Inf - - - - - -
5/2 U 2 3 7.0 Inf - - - - - -
6/1 U 2 3 60.0 Inf - - - - - -
Traffic Flow GroupsFlow Group Start Time End Time Duration Formula
23: 'TA 2024 + Dev AM' 08:00 09:00 01:00 F21+F3
24: 'TA 2024 + Dev PM' 17:00 18:00 01:00 F22+F4
Scenario 17: 'TA 2024 + Dev AM' (FG23: 'TA 2024 + Dev AM', Plan 1: 'Network Control Plan 1')Traffic Flows, DesiredDesired Flow :
Destination
Origin
A B C Tot.
A 0 990 604 1594
B 623 0 33 656
C 668 61 0 729
Tot. 1291 1051 637 2979
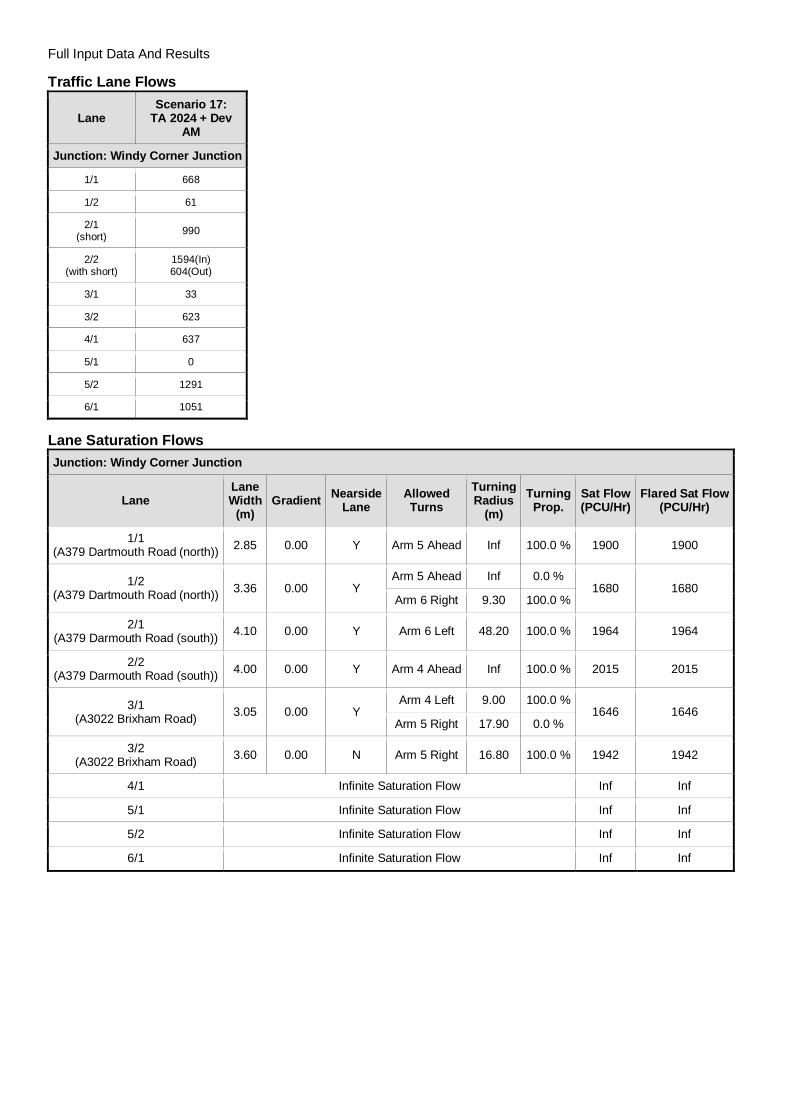
Full Input Data And Results
Traffic Lane Flows
LaneScenario 17:
TA 2024 + DevAM
Junction: Windy Corner Junction
1/1 668
1/2 61
2/1(short) 990
2/2(with short)
1594(In)604(Out)
3/1 33
3/2 623
4/1 637
5/1 0
5/2 1291
6/1 1051
Lane Saturation FlowsJunction: Windy Corner Junction
LaneLaneWidth
(m)Gradient Nearside
LaneAllowedTurns
TurningRadius
(m)Turning
Prop.Sat Flow(PCU/Hr)
Flared Sat Flow(PCU/Hr)
1/1(A379 Dartmouth Road (north)) 2.85 0.00 Y Arm 5 Ahead Inf 100.0 % 1900 1900
1/2(A379 Dartmouth Road (north)) 3.36 0.00 Y
Arm 5 Ahead Inf 0.0 %1680 1680
Arm 6 Right 9.30 100.0 %
2/1(A379 Darmouth Road (south)) 4.10 0.00 Y Arm 6 Left 48.20 100.0 % 1964 1964
2/2(A379 Darmouth Road (south)) 4.00 0.00 Y Arm 4 Ahead Inf 100.0 % 2015 2015
3/1(A3022 Brixham Road) 3.05 0.00 Y
Arm 4 Left 9.00 100.0 %1646 1646
Arm 5 Right 17.90 0.0 %
3/2(A3022 Brixham Road) 3.60 0.00 N Arm 5 Right 16.80 100.0 % 1942 1942
4/1 Infinite Saturation Flow Inf Inf
5/1 Infinite Saturation Flow Inf Inf
5/2 Infinite Saturation Flow Inf Inf
6/1 Infinite Saturation Flow Inf Inf
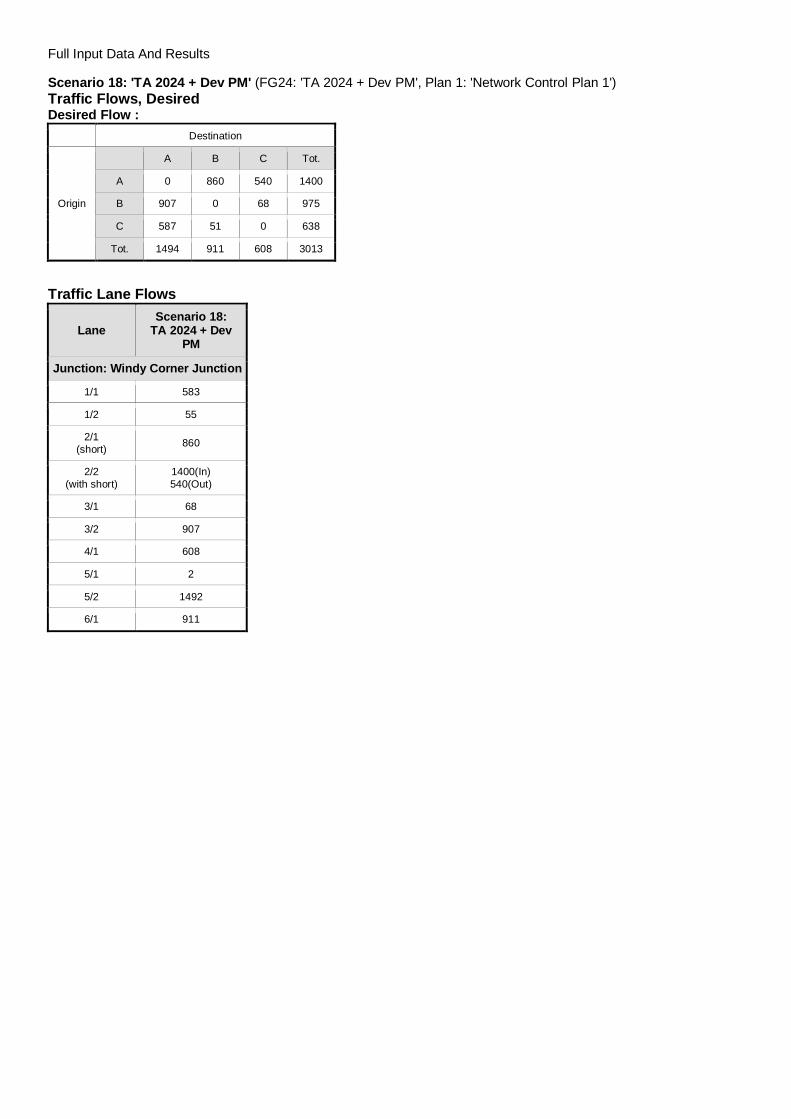
Full Input Data And Results
Scenario 18: 'TA 2024 + Dev PM' (FG24: 'TA 2024 + Dev PM', Plan 1: 'Network Control Plan 1')Traffic Flows, DesiredDesired Flow :
Destination
Origin
A B C Tot.
A 0 860 540 1400
B 907 0 68 975
C 587 51 0 638
Tot. 1494 911 608 3013
Traffic Lane Flows
LaneScenario 18:
TA 2024 + DevPM
Junction: Windy Corner Junction
1/1 583
1/2 55
2/1(short) 860
2/2(with short)
1400(In)540(Out)
3/1 68
3/2 907
4/1 608
5/1 2
5/2 1492
6/1 911
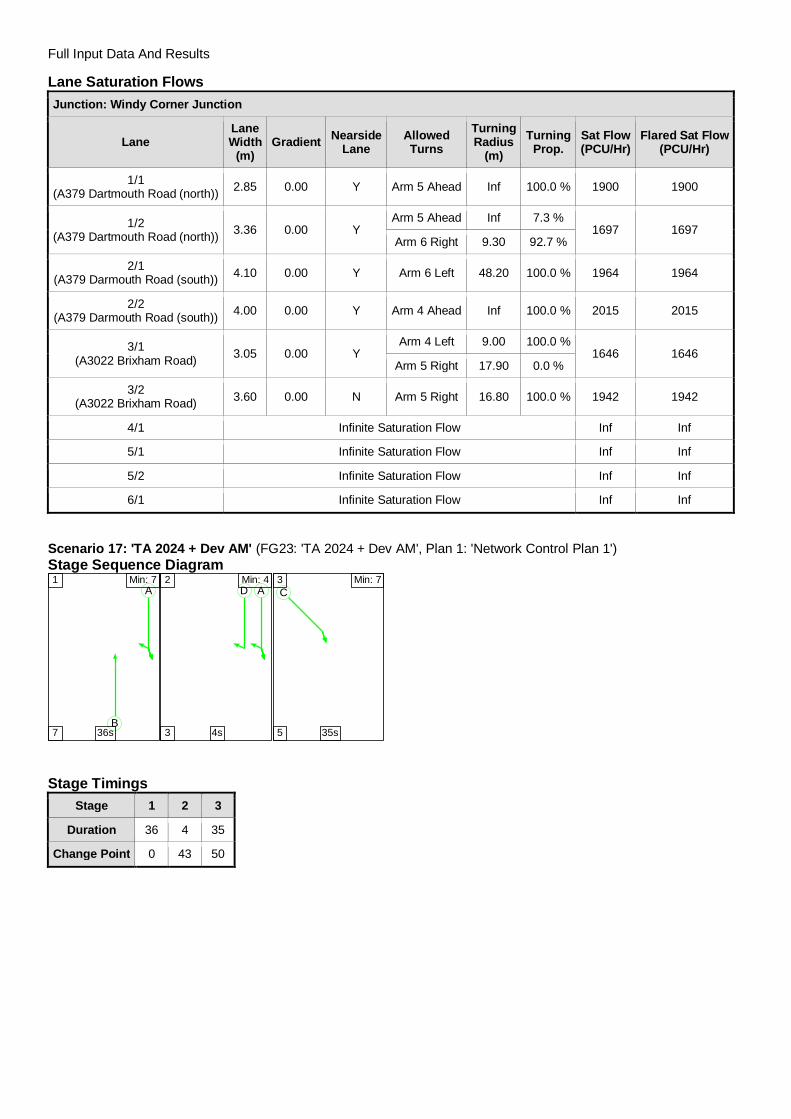
Full Input Data And Results
Lane Saturation FlowsJunction: Windy Corner Junction
LaneLaneWidth
(m)Gradient Nearside
LaneAllowedTurns
TurningRadius
(m)Turning
Prop.Sat Flow(PCU/Hr)
Flared Sat Flow(PCU/Hr)
1/1(A379 Dartmouth Road (north)) 2.85 0.00 Y Arm 5 Ahead Inf 100.0 % 1900 1900
1/2(A379 Dartmouth Road (north)) 3.36 0.00 Y
Arm 5 Ahead Inf 7.3 %1697 1697
Arm 6 Right 9.30 92.7 %
2/1(A379 Darmouth Road (south)) 4.10 0.00 Y Arm 6 Left 48.20 100.0 % 1964 1964
2/2(A379 Darmouth Road (south)) 4.00 0.00 Y Arm 4 Ahead Inf 100.0 % 2015 2015
3/1(A3022 Brixham Road) 3.05 0.00 Y
Arm 4 Left 9.00 100.0 %1646 1646
Arm 5 Right 17.90 0.0 %
3/2(A3022 Brixham Road) 3.60 0.00 N Arm 5 Right 16.80 100.0 % 1942 1942
4/1 Infinite Saturation Flow Inf Inf
5/1 Infinite Saturation Flow Inf Inf
5/2 Infinite Saturation Flow Inf Inf
6/1 Infinite Saturation Flow Inf Inf
Scenario 17: 'TA 2024 + Dev AM' (FG23: 'TA 2024 + Dev AM', Plan 1: 'Network Control Plan 1')Stage Sequence Diagram
A
B
1 Min: 7
7 36s
AD2 Min: 4
3 4s
C3 Min: 7
5 35s
Stage TimingsStage 1 2 3
Duration 36 4 35
Change Point 0 43 50
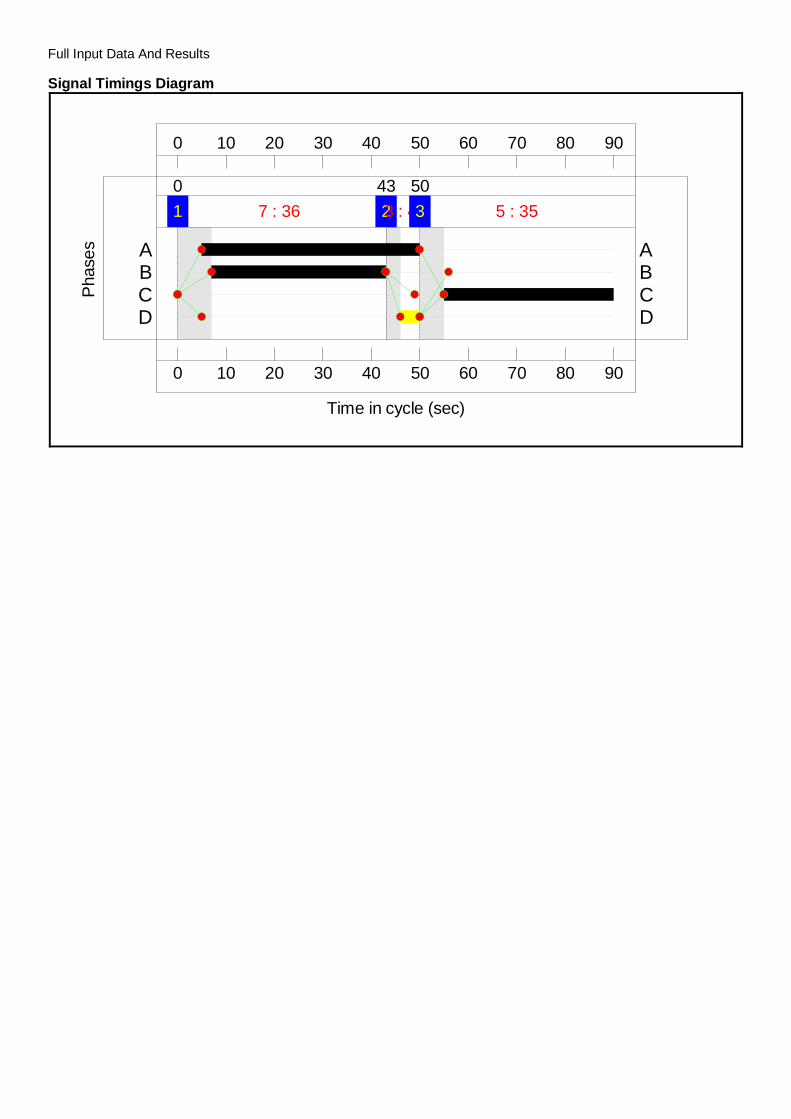
Full Input Data And Results
Signal Timings Diagram
0
0
10
10
20
20
30
30
40
40
50
50
60
60
70
70
80
80
90
90
Time in cycle (sec)
Pha
ses
1 7 : 360
23 : 443
3 5 : 3550
D DC CB BA A
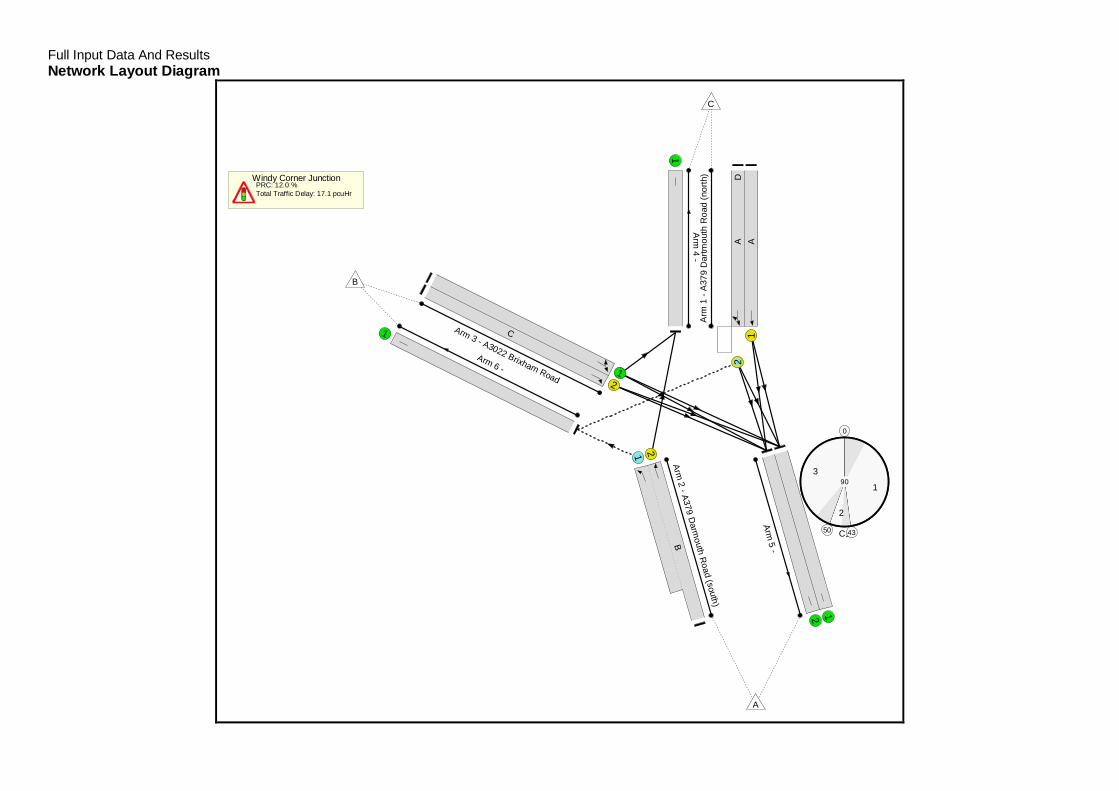
Full Input Data And ResultsNetwork Layout Diagram
Windy Corner JunctionPRC: 12.0 %Total Traffic Delay: 17.1 pcuHr
C1
0
1
43
2
50
390
Arm
1-A
3 79
Dar
tmou
thR
oad
(nor
th)
12
AAD
Arm2
- A379D
armouth
Road
(south)
1 2
B
Arm 3 - A3022 Brixham Road1
2
C
Arm
4-
1
Arm5
-
12
Arm 6 -
1
A
B
C
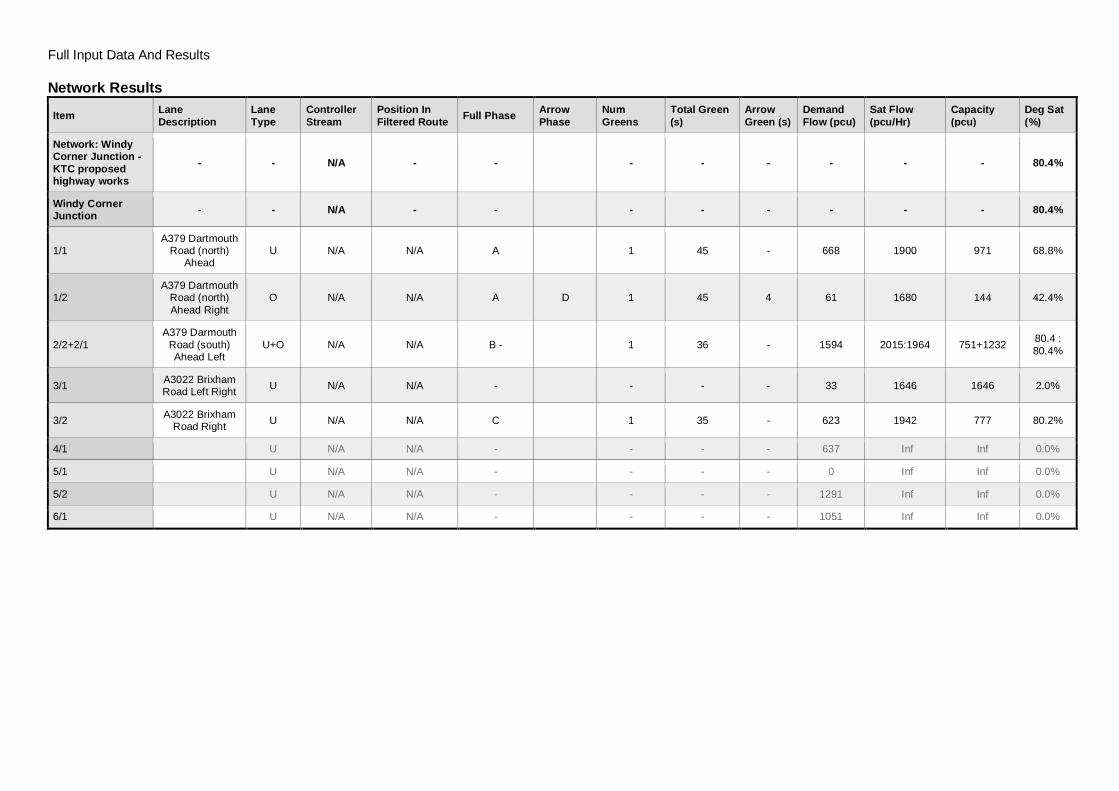
Full Input Data And Results
Network Results
Item LaneDescription
LaneType
ControllerStream
Position InFiltered Route Full Phase Arrow
PhaseNumGreens
Total Green(s)
ArrowGreen (s)
DemandFlow (pcu)
Sat Flow(pcu/Hr)
Capacity(pcu)
Deg Sat(%)
Network: WindyCorner Junction -KTC proposedhighway works
- - N/A - - - - - - - - 80.4%
Windy CornerJunction - - N/A - - - - - - - - 80.4%
1/1A379 Dartmouth
Road (north)Ahead
U N/A N/A A 1 45 - 668 1900 971 68.8%
1/2A379 Dartmouth
Road (north)Ahead Right
O N/A N/A A D 1 45 4 61 1680 144 42.4%
2/2+2/1A379 Darmouth
Road (south)Ahead Left
U+O N/A N/A B - 1 36 - 1594 2015:1964 751+1232 80.4 :80.4%
3/1 A3022 BrixhamRoad Left Right U N/A N/A - - - - 33 1646 1646 2.0%
3/2 A3022 BrixhamRoad Right U N/A N/A C 1 35 - 623 1942 777 80.2%
4/1 U N/A N/A - - - - 637 Inf Inf 0.0%
5/1 U N/A N/A - - - - 0 Inf Inf 0.0%
5/2 U N/A N/A - - - - 1291 Inf Inf 0.0%
6/1 U N/A N/A - - - - 1051 Inf Inf 0.0%
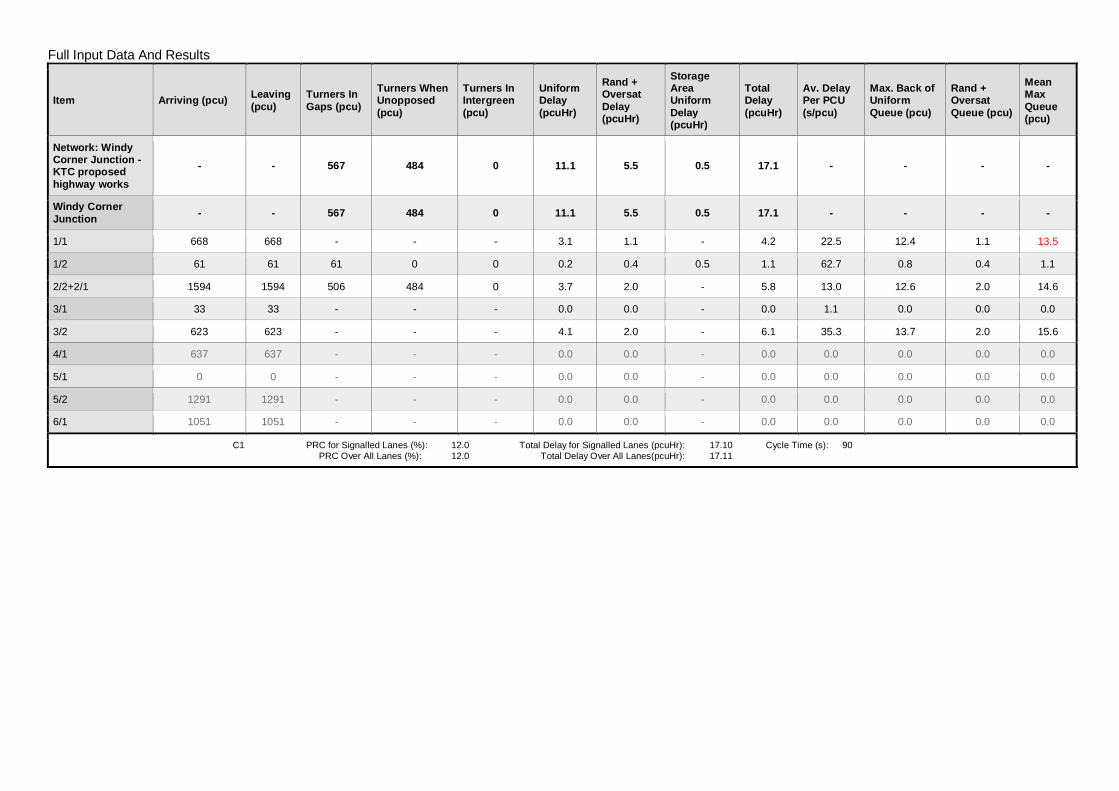
Full Input Data And Results
Item Arriving (pcu) Leaving(pcu)
Turners InGaps (pcu)
Turners WhenUnopposed(pcu)
Turners InIntergreen(pcu)
UniformDelay(pcuHr)
Rand +OversatDelay(pcuHr)
StorageAreaUniformDelay(pcuHr)
TotalDelay(pcuHr)
Av. DelayPer PCU(s/pcu)
Max. Back ofUniformQueue (pcu)
Rand +OversatQueue (pcu)
MeanMaxQueue(pcu)
Network: WindyCorner Junction -KTC proposedhighway works
- - 567 484 0 11.1 5.5 0.5 17.1 - - - -
Windy CornerJunction - - 567 484 0 11.1 5.5 0.5 17.1 - - - -
1/1 668 668 - - - 3.1 1.1 - 4.2 22.5 12.4 1.1 13.5
1/2 61 61 61 0 0 0.2 0.4 0.5 1.1 62.7 0.8 0.4 1.1
2/2+2/1 1594 1594 506 484 0 3.7 2.0 - 5.8 13.0 12.6 2.0 14.6
3/1 33 33 - - - 0.0 0.0 - 0.0 1.1 0.0 0.0 0.0
3/2 623 623 - - - 4.1 2.0 - 6.1 35.3 13.7 2.0 15.6
4/1 637 637 - - - 0.0 0.0 - 0.0 0.0 0.0 0.0 0.0
5/1 0 0 - - - 0.0 0.0 - 0.0 0.0 0.0 0.0 0.0
5/2 1291 1291 - - - 0.0 0.0 - 0.0 0.0 0.0 0.0 0.0
6/1 1051 1051 - - - 0.0 0.0 - 0.0 0.0 0.0 0.0 0.0
C1 PRC for Signalled Lanes (%): 12.0 Total Delay for Signalled Lanes (pcuHr): 17.10 Cycle Time (s): 90 PRC Over All Lanes (%): 12.0 Total Delay Over All Lanes(pcuHr): 17.11
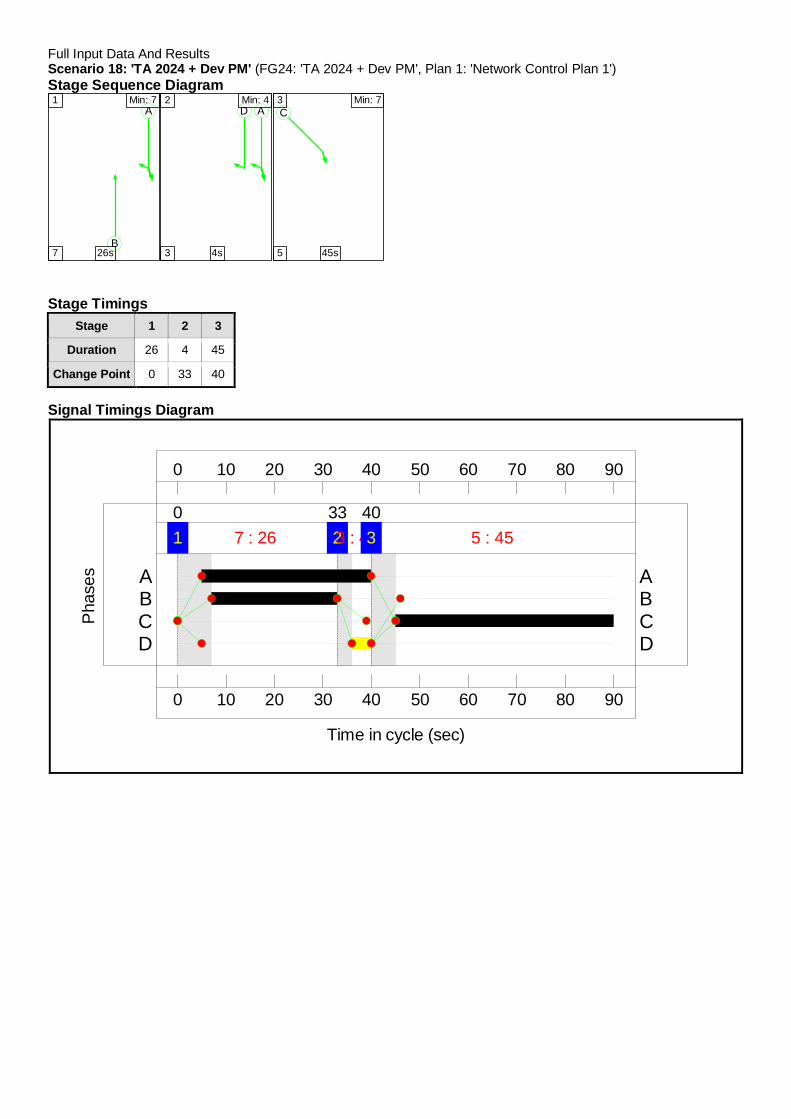
Full Input Data And ResultsScenario 18: 'TA 2024 + Dev PM' (FG24: 'TA 2024 + Dev PM', Plan 1: 'Network Control Plan 1')Stage Sequence Diagram
A
B
1 Min: 7
7 26s
AD2 Min: 4
3 4s
C3 Min: 7
5 45s
Stage TimingsStage 1 2 3
Duration 26 4 45
Change Point 0 33 40
Signal Timings Diagram
0
0
10
10
20
20
30
30
40
40
50
50
60
60
70
70
80
80
90
90
Time in cycle (sec)
Pha
ses
1 7 : 260
23 : 433
3 5 : 4540
D DC CB BA A
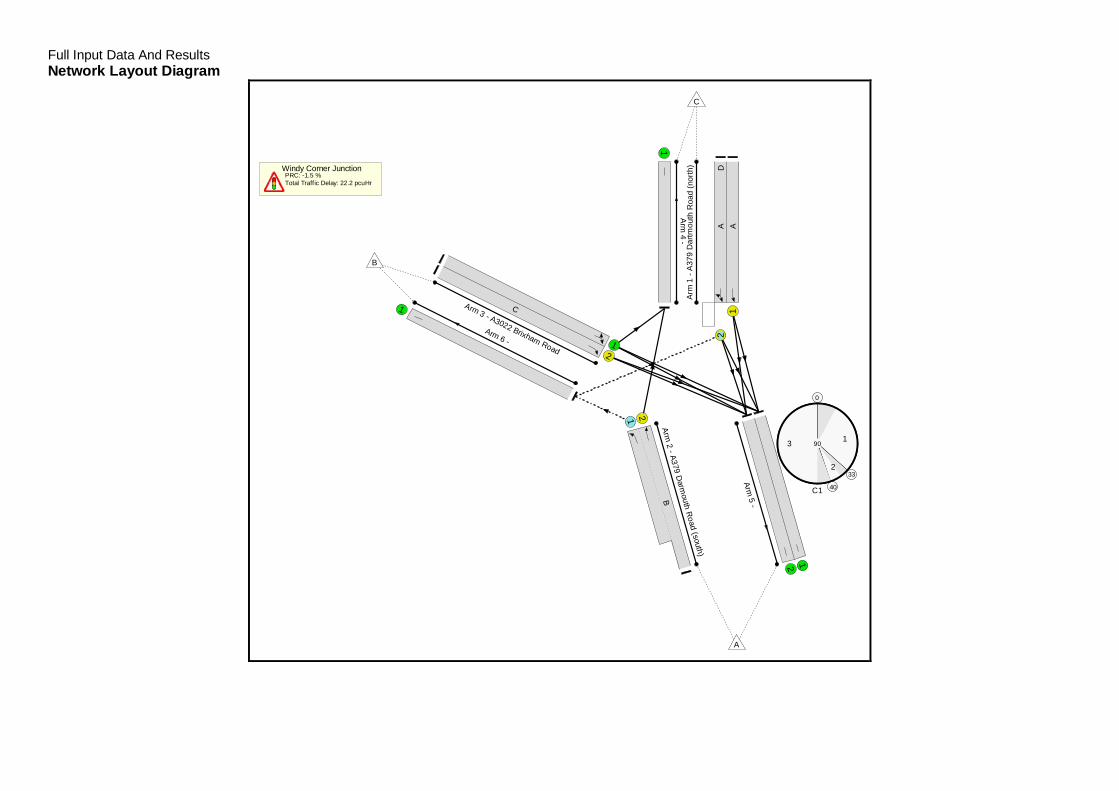
Full Input Data And ResultsNetwork Layout Diagram
Windy Corner JunctionPRC: -1.5 %Total Traffic Delay: 22.2 pcuHr
C1
0
1
332
40
3 90
Arm
1-A
379
Dar
tmo u
thR
oad
(nor
th)
12
AAD
Arm2
- A379D
armouth
Road
(south)
1 2
B
Arm 3 - A3022 Brixham Road1
2
C
Arm
4-
1
Arm5
-
12Arm 6 -
1
A
B
C
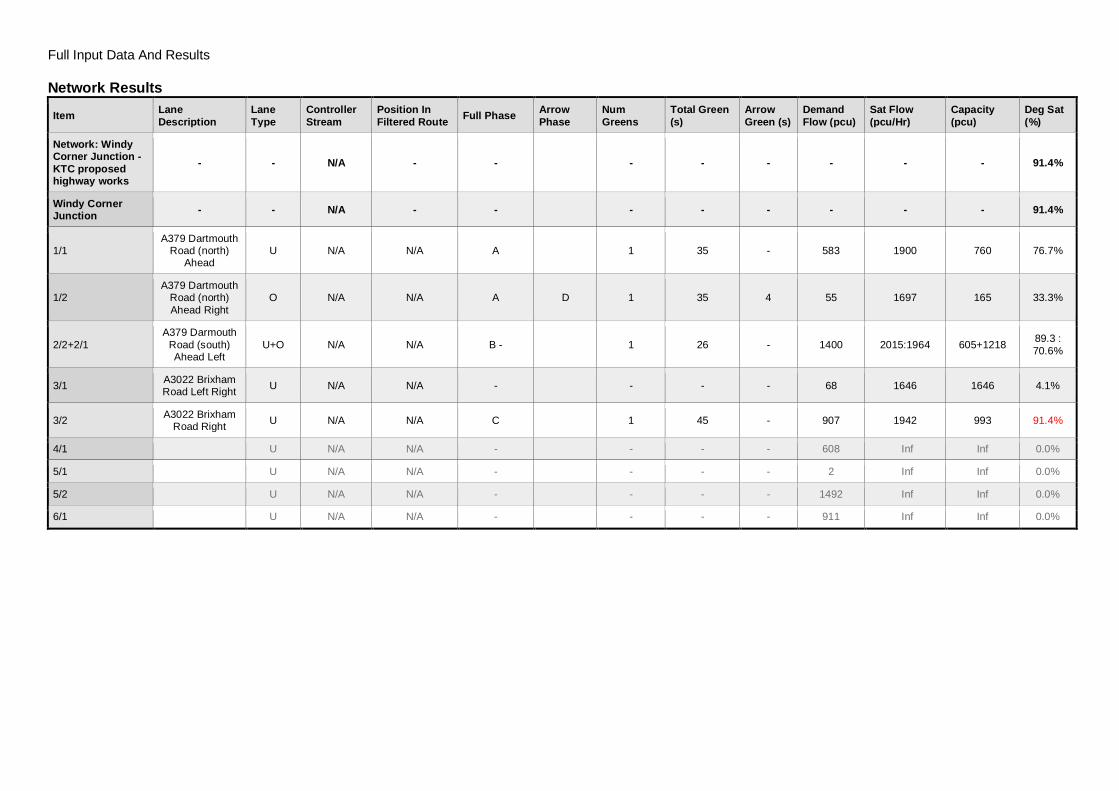
Full Input Data And Results
Network Results
Item LaneDescription
LaneType
ControllerStream
Position InFiltered Route Full Phase Arrow
PhaseNumGreens
Total Green(s)
ArrowGreen (s)
DemandFlow (pcu)
Sat Flow(pcu/Hr)
Capacity(pcu)
Deg Sat(%)
Network: WindyCorner Junction -KTC proposedhighway works
- - N/A - - - - - - - - 91.4%
Windy CornerJunction - - N/A - - - - - - - - 91.4%
1/1A379 Dartmouth
Road (north)Ahead
U N/A N/A A 1 35 - 583 1900 760 76.7%
1/2A379 Dartmouth
Road (north)Ahead Right
O N/A N/A A D 1 35 4 55 1697 165 33.3%
2/2+2/1A379 Darmouth
Road (south)Ahead Left
U+O N/A N/A B - 1 26 - 1400 2015:1964 605+1218 89.3 :70.6%
3/1 A3022 BrixhamRoad Left Right U N/A N/A - - - - 68 1646 1646 4.1%
3/2 A3022 BrixhamRoad Right U N/A N/A C 1 45 - 907 1942 993 91.4%
4/1 U N/A N/A - - - - 608 Inf Inf 0.0%
5/1 U N/A N/A - - - - 2 Inf Inf 0.0%
5/2 U N/A N/A - - - - 1492 Inf Inf 0.0%
6/1 U N/A N/A - - - - 911 Inf Inf 0.0%
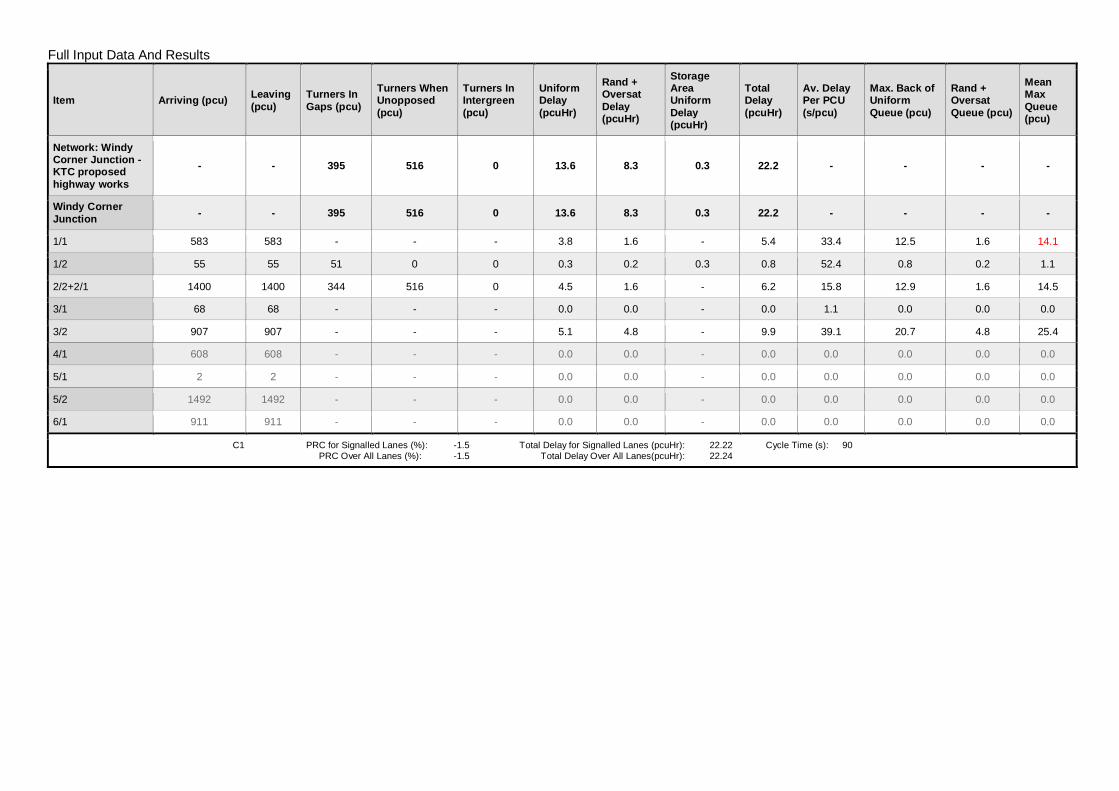
Full Input Data And Results
Item Arriving (pcu) Leaving(pcu)
Turners InGaps (pcu)
Turners WhenUnopposed(pcu)
Turners InIntergreen(pcu)
UniformDelay(pcuHr)
Rand +OversatDelay(pcuHr)
StorageAreaUniformDelay(pcuHr)
TotalDelay(pcuHr)
Av. DelayPer PCU(s/pcu)
Max. Back ofUniformQueue (pcu)
Rand +OversatQueue (pcu)
MeanMaxQueue(pcu)
Network: WindyCorner Junction -KTC proposedhighway works
- - 395 516 0 13.6 8.3 0.3 22.2 - - - -
Windy CornerJunction - - 395 516 0 13.6 8.3 0.3 22.2 - - - -
1/1 583 583 - - - 3.8 1.6 - 5.4 33.4 12.5 1.6 14.1
1/2 55 55 51 0 0 0.3 0.2 0.3 0.8 52.4 0.8 0.2 1.1
2/2+2/1 1400 1400 344 516 0 4.5 1.6 - 6.2 15.8 12.9 1.6 14.5
3/1 68 68 - - - 0.0 0.0 - 0.0 1.1 0.0 0.0 0.0
3/2 907 907 - - - 5.1 4.8 - 9.9 39.1 20.7 4.8 25.4
4/1 608 608 - - - 0.0 0.0 - 0.0 0.0 0.0 0.0 0.0
5/1 2 2 - - - 0.0 0.0 - 0.0 0.0 0.0 0.0 0.0
5/2 1492 1492 - - - 0.0 0.0 - 0.0 0.0 0.0 0.0 0.0
6/1 911 911 - - - 0.0 0.0 - 0.0 0.0 0.0 0.0 0.0
C1 PRC for Signalled Lanes (%): -1.5 Total Delay for Signalled Lanes (pcuHr): 22.22 Cycle Time (s): 90 PRC Over All Lanes (%): -1.5 Total Delay Over All Lanes(pcuHr): 22.24

Appendix TAA1-K
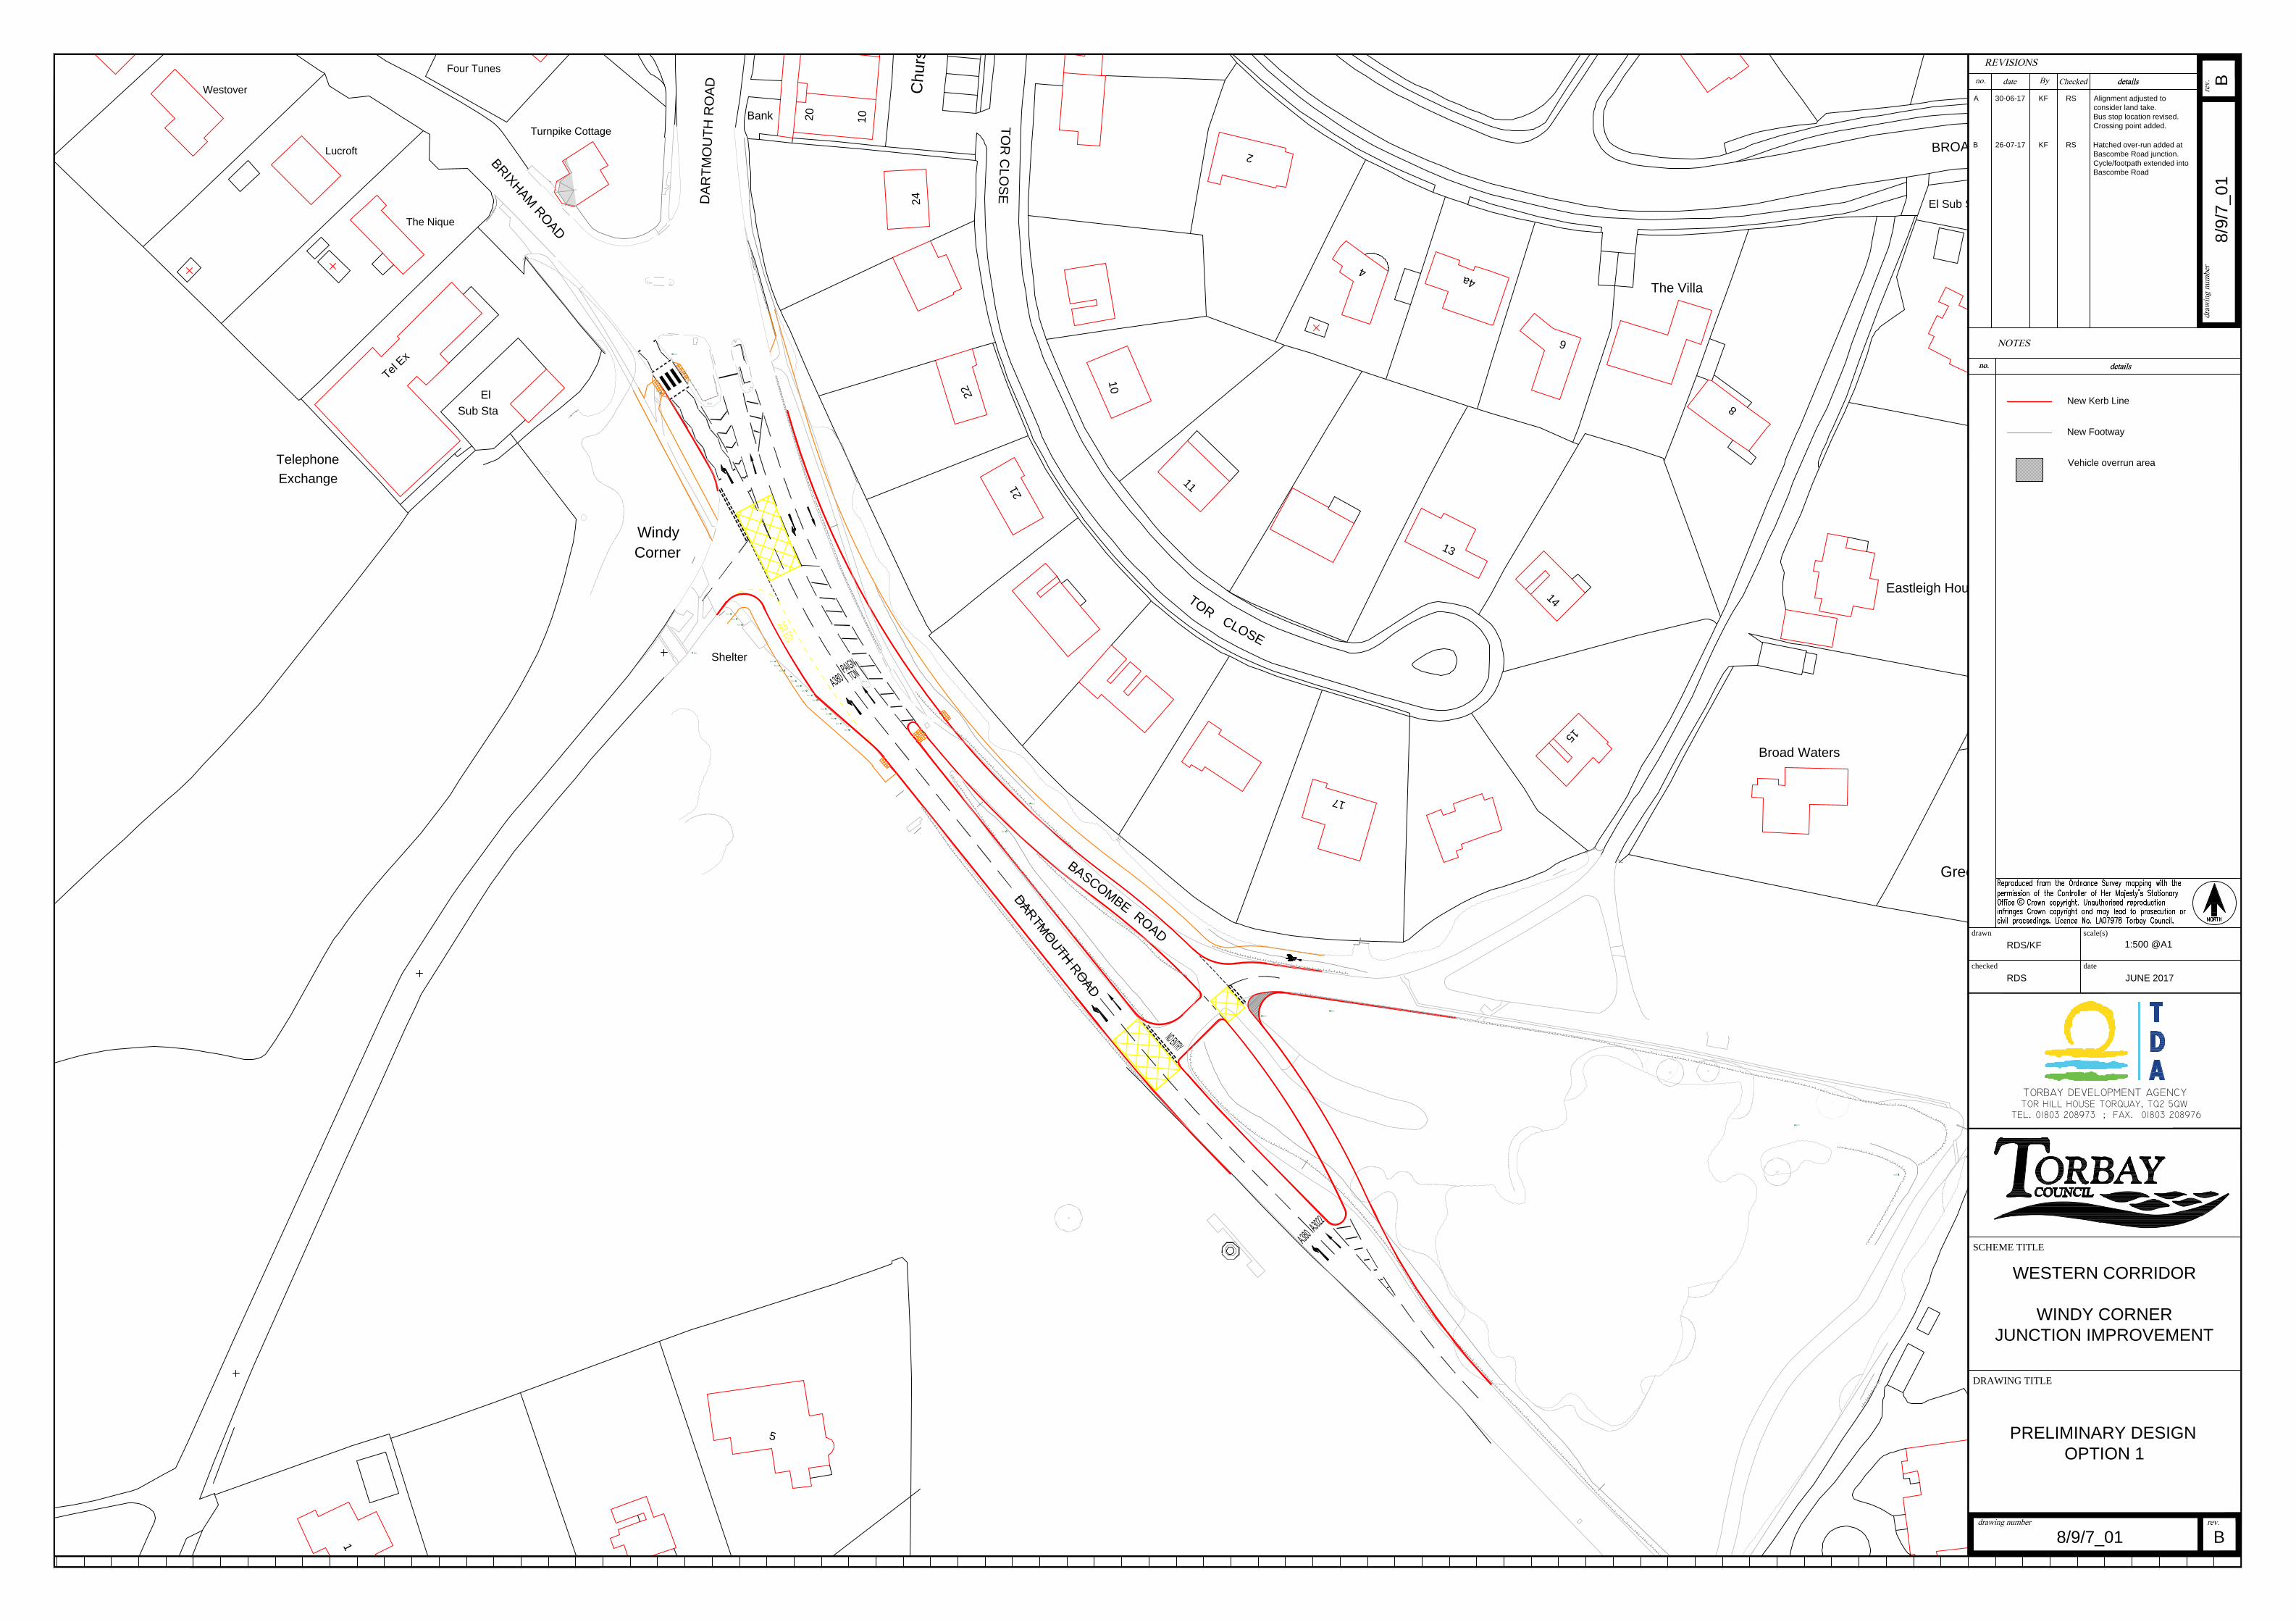
Bol
D
A
R
T
M
O
U
T
H
R
O
A
D
B
A
S
C
O
M
B
E
R
O
A
D
Shelter
Windy
Corner
Telephone
Exchange
1
5
1
1
1
3
2
1
1
7
T
O
R
C
L
O
S
E
1
4
1
5
Eastleigh House
Broad Waters
Greenover
DA
RT
MO
UT
H R
OA
D
TO
R C
LO
SE
B
R
I
X
H
A
M
R
O
A
D
Churston B
roadw
ay
Bank
Four Tunes
Turnpike Cottage
Westover
Lucroft
The Nique
T
e
l
E
x
El
Sub Sta
4
a
4
2
10
20
24
1
0
2
2
BROADSANDS
The Villa
El Sub Sta
6
8
RLEL
EL
Bol
Bol
Bol
Bol
Bol
Bol
Bol
Bol
Bol
Bol
Bol
Bol
Bol
Bol
Bol
Bol
Bol
Bol
Bol
Bol
Bol
Bol
Bol
Bol
Bol
Bol
Bol
Bol
BolBol
Bol
Bol
Bol
PRELIMINARY DESIGN
OPTION 1
8/9/7_01 B
WESTERN CORRIDOR
WINDY CORNER
JUNCTION IMPROVEMENT
RDS
RDS/KF
JUNE 2017
1:500 @A1
8/9/7_01
B
DRAWING TITLE
SCHEME TITLE
drawn
checked
scale(s)
date
New Kerb Line
New Footway
A 30-06-17 KF RS Alignment adjusted to
consider land take.
Bus stop location revised.
Crossing point added.
B 26-07-17 KF RS Hatched over-run added at
Bascombe Road junction.
Cycle/footpath extended into
Bascombe Road
Vehicle overrun area
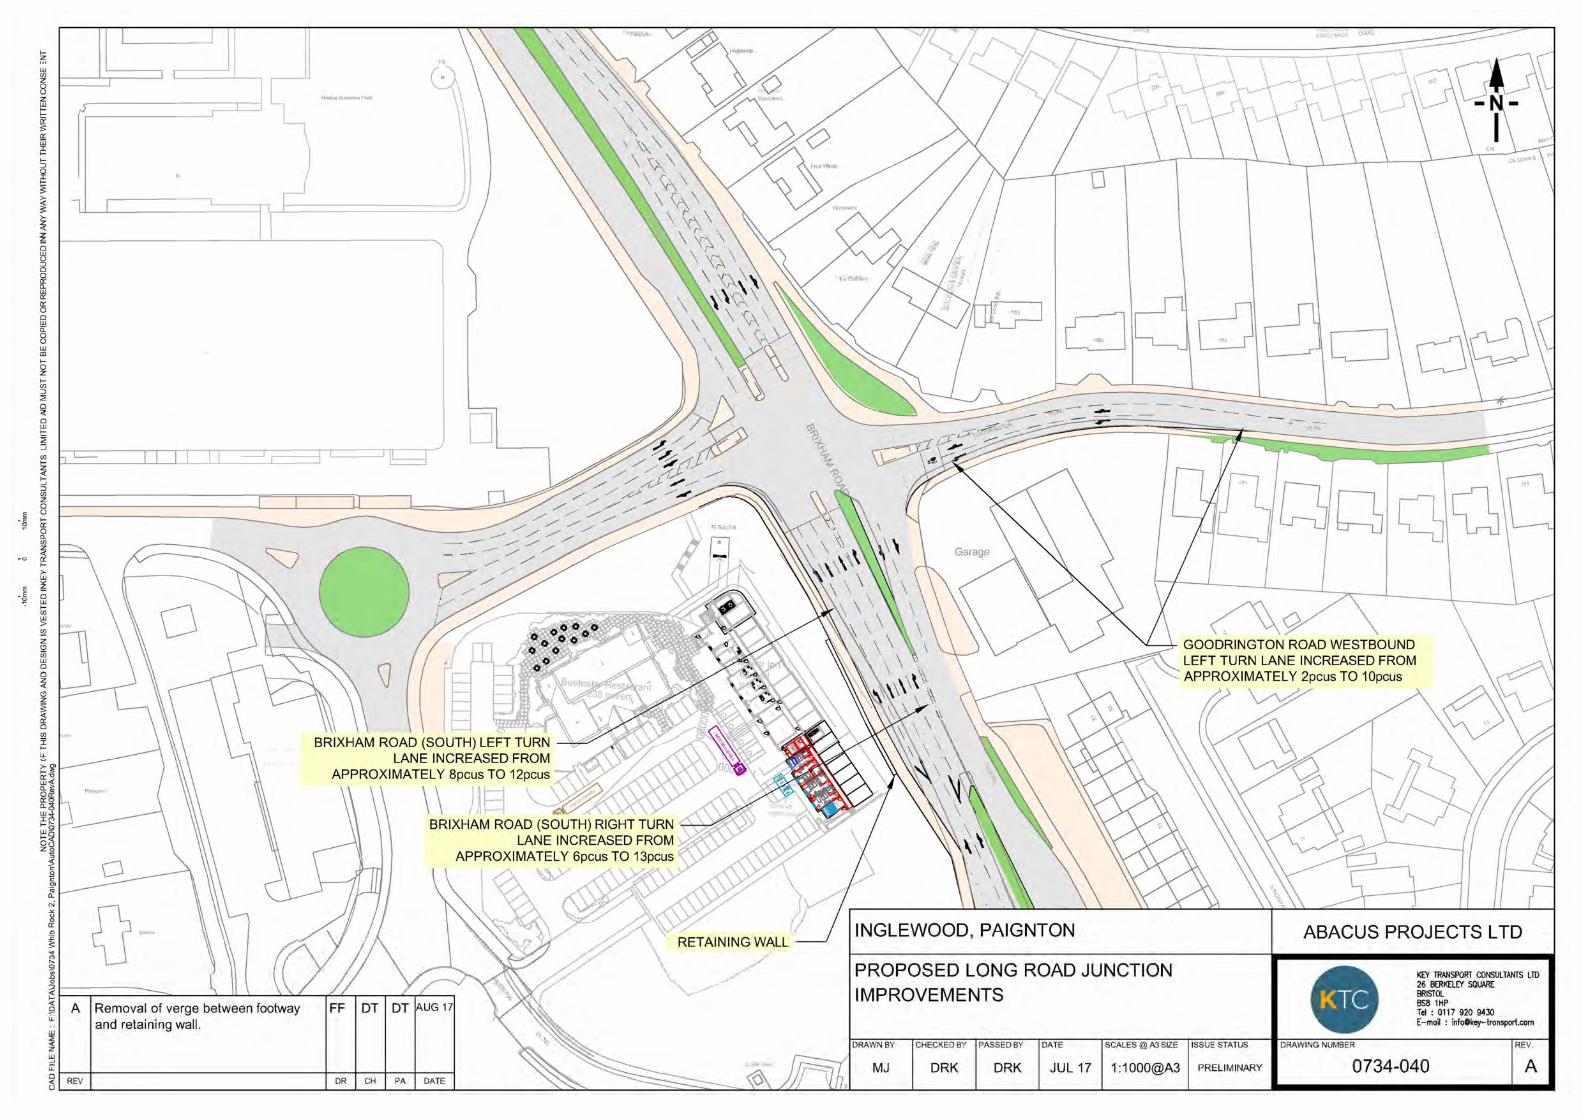
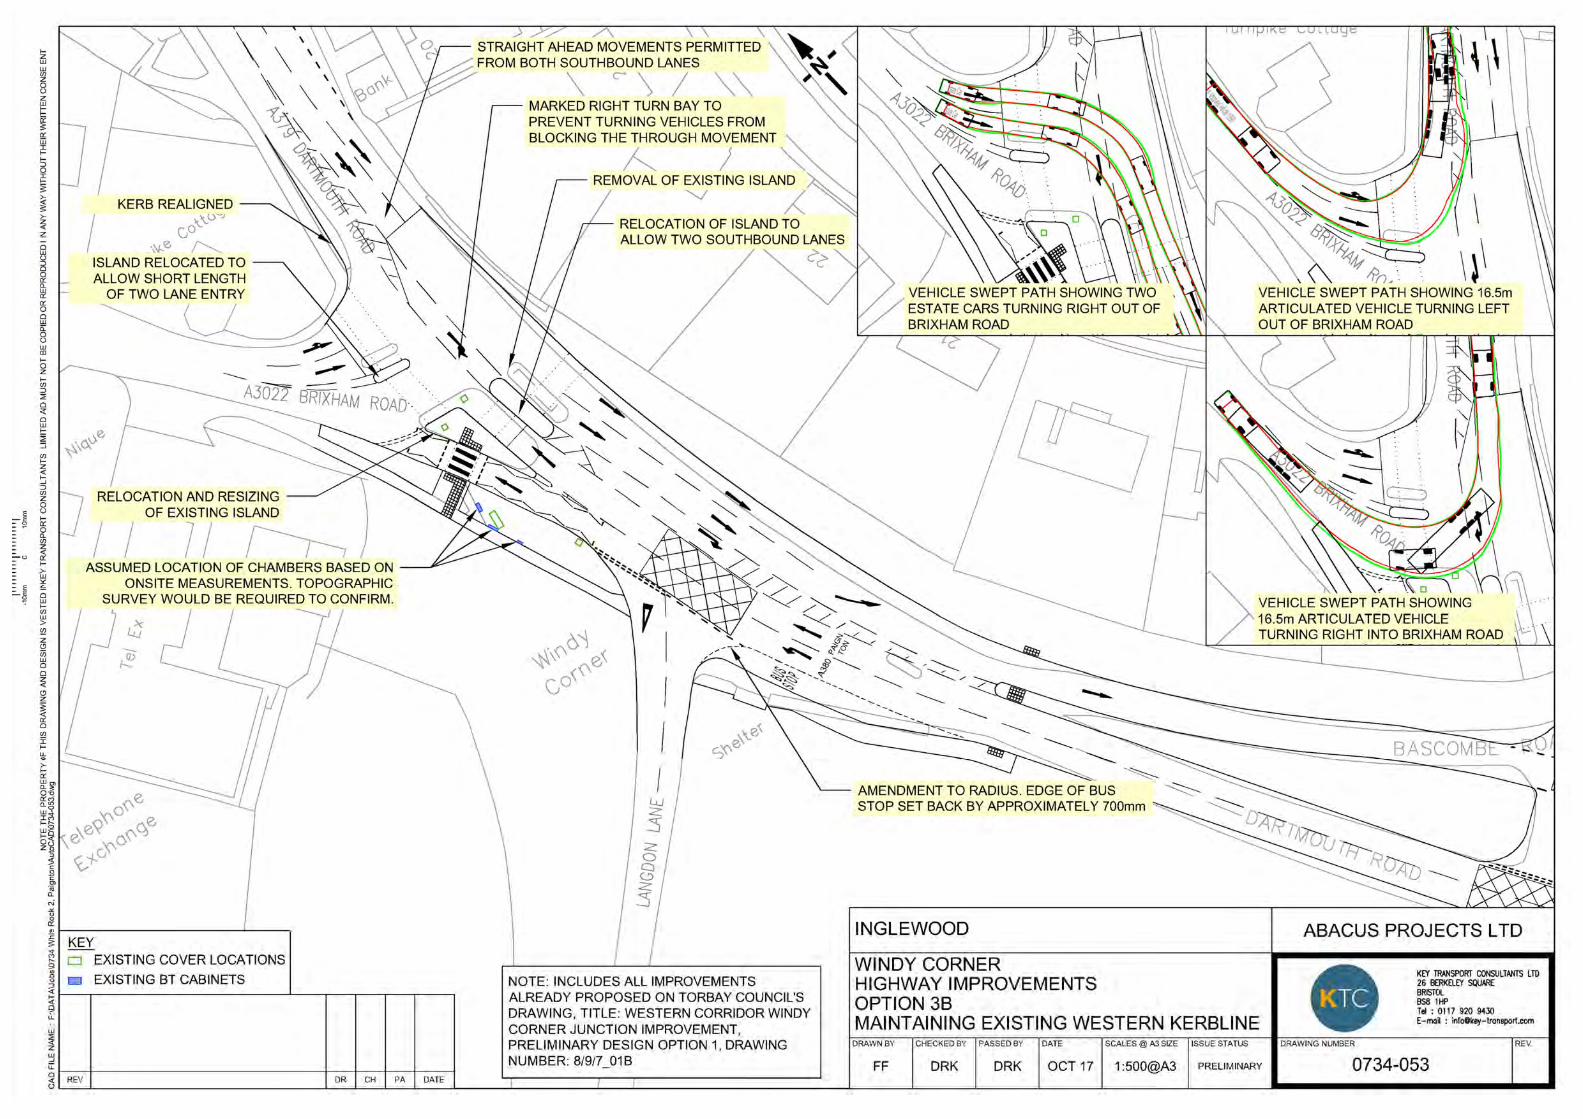

Appendix TAA1-L
Filename: Proposed Site Access 0734-032 - updated development flows.arc8 Path: F:\DATA\Jobs\0734 White Rock 2, Paignton\Technical\ARCADY\December Report generation date: 20/12/2017 14:19:28
» (Default Analysis Set) - 2017 Base, AM » (Default Analysis Set) - 2017 Base, PM » (Default Analysis Set) - 2019 Base, AM » (Default Analysis Set) - 2019 Base, PM » (Default Analysis Set) - 2024 Base, AM » (Default Analysis Set) - 2024 Base, PM » (Default Analysis Set) - 2024 Base + Dev, AM » (Default Analysis Set) - 2024 Base + Dev, PM
Junctions 8ARCADY 8 - Roundabout Module
Version: 8.0.4.487 [15039,24/03/2014]
© Copyright TRL Limited, 2017
For sales and distribution information, program advice and maintenance, contact TRL:
Tel: +44 (0)1344 770758 email: [email protected] Web: http://www.trlsoftware.co.uk
The users of this computer program for the solution of an engineering problem are in no way relieved of their responsibility for the correctness of the solution
Generated on 20/12/2017 14:19:37 using Junctions 8 (8.0.4.487)
1
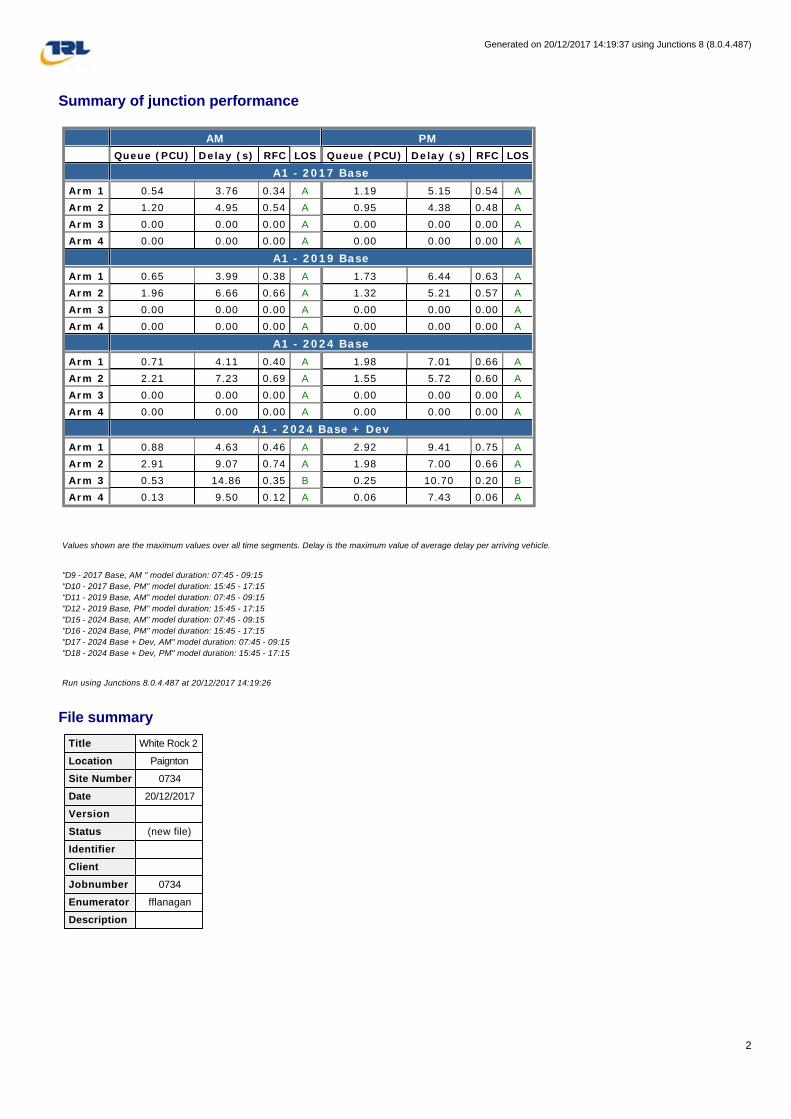
Summary of junction performance
Values shown are the maximum values over all time segments. Delay is the maximum value of average delay per arriving vehicle.
"D9 - 2017 Base, AM " model duration: 07:45 - 09:15
"D10 - 2017 Base, PM" model duration: 15:45 - 17:15
"D11 - 2019 Base, AM" model duration: 07:45 - 09:15
"D12 - 2019 Base, PM" model duration: 15:45 - 17:15
"D15 - 2024 Base, AM" model duration: 07:45 - 09:15
"D16 - 2024 Base, PM" model duration: 15:45 - 17:15
"D17 - 2024 Base + Dev, AM" model duration: 07:45 - 09:15
"D18 - 2024 Base + Dev, PM" model duration: 15:45 - 17:15
Run using Junctions 8.0.4.487 at 20/12/2017 14:19:26
File summary
AM PM
Queue (PCU) Delay (s) RFC LOS Queue (PCU) Delay (s) RFC LOS
A1 - 2017 Base
Arm 1 0.54 3.76 0.34 A 1.19 5.15 0.54 A
Arm 2 1.20 4.95 0.54 A 0.95 4.38 0.48 A
Arm 3 0.00 0.00 0.00 A 0.00 0.00 0.00 A
Arm 4 0.00 0.00 0.00 A 0.00 0.00 0.00 A
A1 - 2019 Base
Arm 1 0.65 3.99 0.38 A 1.73 6.44 0.63 A
Arm 2 1.96 6.66 0.66 A 1.32 5.21 0.57 A
Arm 3 0.00 0.00 0.00 A 0.00 0.00 0.00 A
Arm 4 0.00 0.00 0.00 A 0.00 0.00 0.00 A
A1 - 2024 Base
Arm 1 0.71 4.11 0.40 A 1.98 7.01 0.66 A
Arm 2 2.21 7.23 0.69 A 1.55 5.72 0.60 A
Arm 3 0.00 0.00 0.00 A 0.00 0.00 0.00 A
Arm 4 0.00 0.00 0.00 A 0.00 0.00 0.00 A
A1 - 2024 Base + Dev
Arm 1 0.88 4.63 0.46 A 2.92 9.41 0.75 A
Arm 2 2.91 9.07 0.74 A 1.98 7.00 0.66 A
Arm 3 0.53 14.86 0.35 B 0.25 10.70 0.20 B
Arm 4 0.13 9.50 0.12 A 0.06 7.43 0.06 A
Title White Rock 2
Location Paignton
Site Number 0734
Date 20/12/2017
Version
Status (new file)
Identifier
Client
Jobnumber 0734
Enumerator fflanagan
Description
Generated on 20/12/2017 14:19:37 using Junctions 8 (8.0.4.487)
2
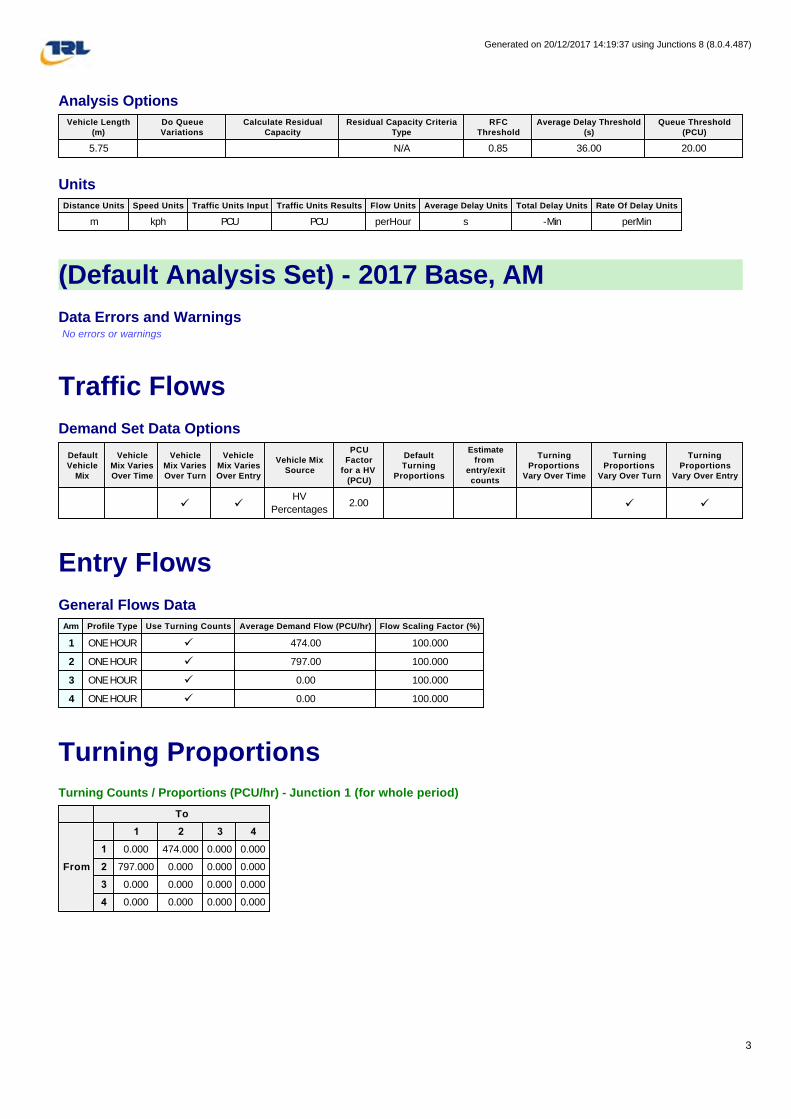
Analysis Options
Units
(Default Analysis Set) - 2017 Base, AM
Data Errors and Warnings No errors or warnings
Traffic Flows
Demand Set Data Options
Entry Flows
General Flows Data
Turning Proportions
Turning Counts / Proportions (PCU/hr) - Junction 1 (for whole period)
Vehicle Length (m)
Do Queue Variations
Calculate Residual Capacity
Residual Capacity Criteria Type
RFC Threshold
Average Delay Threshold (s)
Queue Threshold (PCU)
5.75 N/A 0.85 36.00 20.00
Distance Units Speed Units Traffic Units Input Traffic Units Results Flow Units Average Delay Units Total Delay Units Rate Of Delay Units
m kph PCU PCU perHour s -Min perMin
Default Vehicle
Mix
Vehicle Mix Varies Over Time
Vehicle Mix Varies Over Turn
Vehicle Mix Varies Over Entry
Vehicle Mix Source
PCU Factor
for a HV (PCU)
Default Turning
Proportions
Estimate from
entry/exit counts
Turning Proportions
Vary Over Time
Turning Proportions
Vary Over Turn
Turning Proportions
Vary Over Entry
ü üHV
Percentages2.00 ü ü
Arm Profile Type Use Turning Counts Average Demand Flow (PCU/hr) Flow Scaling Factor (%)
1 ONE HOUR ü 474.00 100.000
2 ONE HOUR ü 797.00 100.000
3 ONE HOUR ü 0.00 100.000
4 ONE HOUR ü 0.00 100.000
To
From
1 2 3 4
1 0.000 474.000 0.000 0.000
2 797.000 0.000 0.000 0.000
3 0.000 0.000 0.000 0.000
4 0.000 0.000 0.000 0.000
Generated on 20/12/2017 14:19:37 using Junctions 8 (8.0.4.487)
3
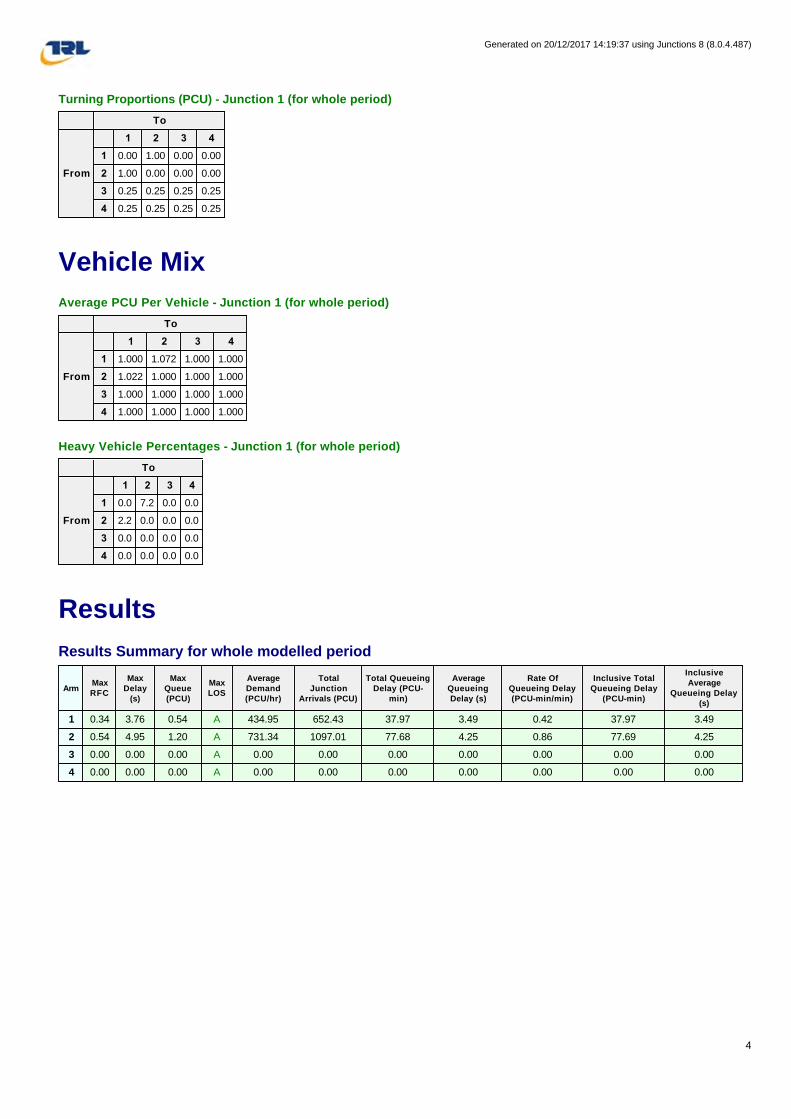
Turning Proportions (PCU) - Junction 1 (for whole period)
Vehicle Mix
Average PCU Per Vehicle - Junction 1 (for whole period)
Heavy Vehicle Percentages - Junction 1 (for whole period)
Results
Results Summary for whole modelled period
To
From
1 2 3 4
1 0.00 1.00 0.00 0.00
2 1.00 0.00 0.00 0.00
3 0.25 0.25 0.25 0.25
4 0.25 0.25 0.25 0.25
To
From
1 2 3 4
1 1.000 1.072 1.000 1.000
2 1.022 1.000 1.000 1.000
3 1.000 1.000 1.000 1.000
4 1.000 1.000 1.000 1.000
To
From
1 2 3 4
1 0.0 7.2 0.0 0.0
2 2.2 0.0 0.0 0.0
3 0.0 0.0 0.0 0.0
4 0.0 0.0 0.0 0.0
ArmMax RFC
Max Delay
(s)
Max Queue (PCU)
Max LOS
Average Demand (PCU/hr)
Total Junction
Arrivals (PCU)
Total Queueing Delay (PCU-
min)
Average Queueing Delay (s)
Rate Of Queueing Delay (PCU-min/min)
Inclusive Total Queueing Delay
(PCU-min)
Inclusive Average
Queueing Delay (s)
1 0.34 3.76 0.54 A 434.95 652.43 37.97 3.49 0.42 37.97 3.49
2 0.54 4.95 1.20 A 731.34 1097.01 77.68 4.25 0.86 77.69 4.25
3 0.00 0.00 0.00 A 0.00 0.00 0.00 0.00 0.00 0.00 0.00
4 0.00 0.00 0.00 A 0.00 0.00 0.00 0.00 0.00 0.00 0.00
Generated on 20/12/2017 14:19:37 using Junctions 8 (8.0.4.487)
4
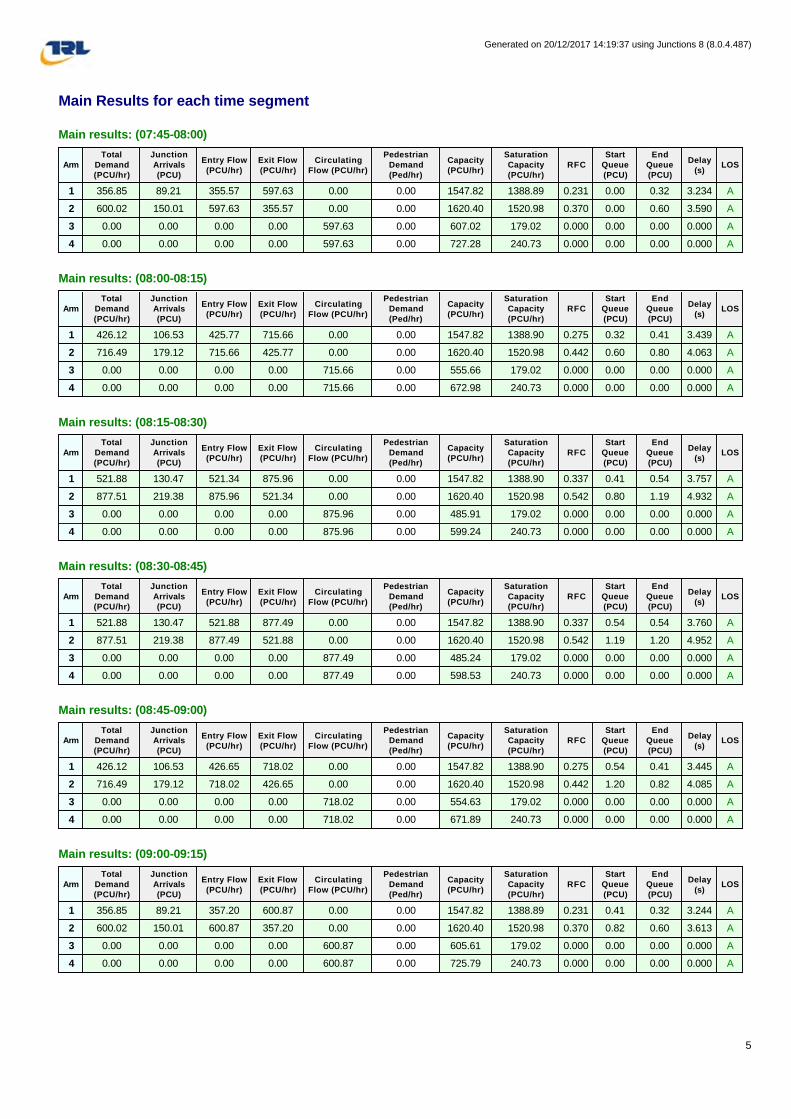
Main Results for each time segment
Main results: (07:45-08:00)
Main results: (08:00-08:15)
Main results: (08:15-08:30)
Main results: (08:30-08:45)
Main results: (08:45-09:00)
Main results: (09:00-09:15)
ArmTotal
Demand (PCU/hr)
Junction Arrivals (PCU)
Entry Flow (PCU/hr)
Exit Flow (PCU/hr)
Circulating Flow (PCU/hr)
Pedestrian Demand (Ped/hr)
Capacity (PCU/hr)
Saturation Capacity (PCU/hr)
RFCStart
Queue (PCU)
End Queue (PCU)
Delay (s)
LOS
1 356.85 89.21 355.57 597.63 0.00 0.00 1547.82 1388.89 0.231 0.00 0.32 3.234 A
2 600.02 150.01 597.63 355.57 0.00 0.00 1620.40 1520.98 0.370 0.00 0.60 3.590 A
3 0.00 0.00 0.00 0.00 597.63 0.00 607.02 179.02 0.000 0.00 0.00 0.000 A
4 0.00 0.00 0.00 0.00 597.63 0.00 727.28 240.73 0.000 0.00 0.00 0.000 A
ArmTotal
Demand (PCU/hr)
Junction Arrivals (PCU)
Entry Flow (PCU/hr)
Exit Flow (PCU/hr)
Circulating Flow (PCU/hr)
Pedestrian Demand (Ped/hr)
Capacity (PCU/hr)
Saturation Capacity (PCU/hr)
RFCStart
Queue (PCU)
End Queue (PCU)
Delay (s)
LOS
1 426.12 106.53 425.77 715.66 0.00 0.00 1547.82 1388.90 0.275 0.32 0.41 3.439 A
2 716.49 179.12 715.66 425.77 0.00 0.00 1620.40 1520.98 0.442 0.60 0.80 4.063 A
3 0.00 0.00 0.00 0.00 715.66 0.00 555.66 179.02 0.000 0.00 0.00 0.000 A
4 0.00 0.00 0.00 0.00 715.66 0.00 672.98 240.73 0.000 0.00 0.00 0.000 A
ArmTotal
Demand (PCU/hr)
Junction Arrivals (PCU)
Entry Flow (PCU/hr)
Exit Flow (PCU/hr)
Circulating Flow (PCU/hr)
Pedestrian Demand (Ped/hr)
Capacity (PCU/hr)
Saturation Capacity (PCU/hr)
RFCStart
Queue (PCU)
End Queue (PCU)
Delay (s)
LOS
1 521.88 130.47 521.34 875.96 0.00 0.00 1547.82 1388.90 0.337 0.41 0.54 3.757 A
2 877.51 219.38 875.96 521.34 0.00 0.00 1620.40 1520.98 0.542 0.80 1.19 4.932 A
3 0.00 0.00 0.00 0.00 875.96 0.00 485.91 179.02 0.000 0.00 0.00 0.000 A
4 0.00 0.00 0.00 0.00 875.96 0.00 599.24 240.73 0.000 0.00 0.00 0.000 A
ArmTotal
Demand (PCU/hr)
Junction Arrivals (PCU)
Entry Flow (PCU/hr)
Exit Flow (PCU/hr)
Circulating Flow (PCU/hr)
Pedestrian Demand (Ped/hr)
Capacity (PCU/hr)
Saturation Capacity (PCU/hr)
RFCStart
Queue (PCU)
End Queue (PCU)
Delay (s)
LOS
1 521.88 130.47 521.88 877.49 0.00 0.00 1547.82 1388.90 0.337 0.54 0.54 3.760 A
2 877.51 219.38 877.49 521.88 0.00 0.00 1620.40 1520.98 0.542 1.19 1.20 4.952 A
3 0.00 0.00 0.00 0.00 877.49 0.00 485.24 179.02 0.000 0.00 0.00 0.000 A
4 0.00 0.00 0.00 0.00 877.49 0.00 598.53 240.73 0.000 0.00 0.00 0.000 A
ArmTotal
Demand (PCU/hr)
Junction Arrivals (PCU)
Entry Flow (PCU/hr)
Exit Flow (PCU/hr)
Circulating Flow (PCU/hr)
Pedestrian Demand (Ped/hr)
Capacity (PCU/hr)
Saturation Capacity (PCU/hr)
RFCStart
Queue (PCU)
End Queue (PCU)
Delay (s)
LOS
1 426.12 106.53 426.65 718.02 0.00 0.00 1547.82 1388.90 0.275 0.54 0.41 3.445 A
2 716.49 179.12 718.02 426.65 0.00 0.00 1620.40 1520.98 0.442 1.20 0.82 4.085 A
3 0.00 0.00 0.00 0.00 718.02 0.00 554.63 179.02 0.000 0.00 0.00 0.000 A
4 0.00 0.00 0.00 0.00 718.02 0.00 671.89 240.73 0.000 0.00 0.00 0.000 A
ArmTotal
Demand (PCU/hr)
Junction Arrivals (PCU)
Entry Flow (PCU/hr)
Exit Flow (PCU/hr)
Circulating Flow (PCU/hr)
Pedestrian Demand (Ped/hr)
Capacity (PCU/hr)
Saturation Capacity (PCU/hr)
RFCStart
Queue (PCU)
End Queue (PCU)
Delay (s)
LOS
1 356.85 89.21 357.20 600.87 0.00 0.00 1547.82 1388.89 0.231 0.41 0.32 3.244 A
2 600.02 150.01 600.87 357.20 0.00 0.00 1620.40 1520.98 0.370 0.82 0.60 3.613 A
3 0.00 0.00 0.00 0.00 600.87 0.00 605.61 179.02 0.000 0.00 0.00 0.000 A
4 0.00 0.00 0.00 0.00 600.87 0.00 725.79 240.73 0.000 0.00 0.00 0.000 A
Generated on 20/12/2017 14:19:37 using Junctions 8 (8.0.4.487)
5
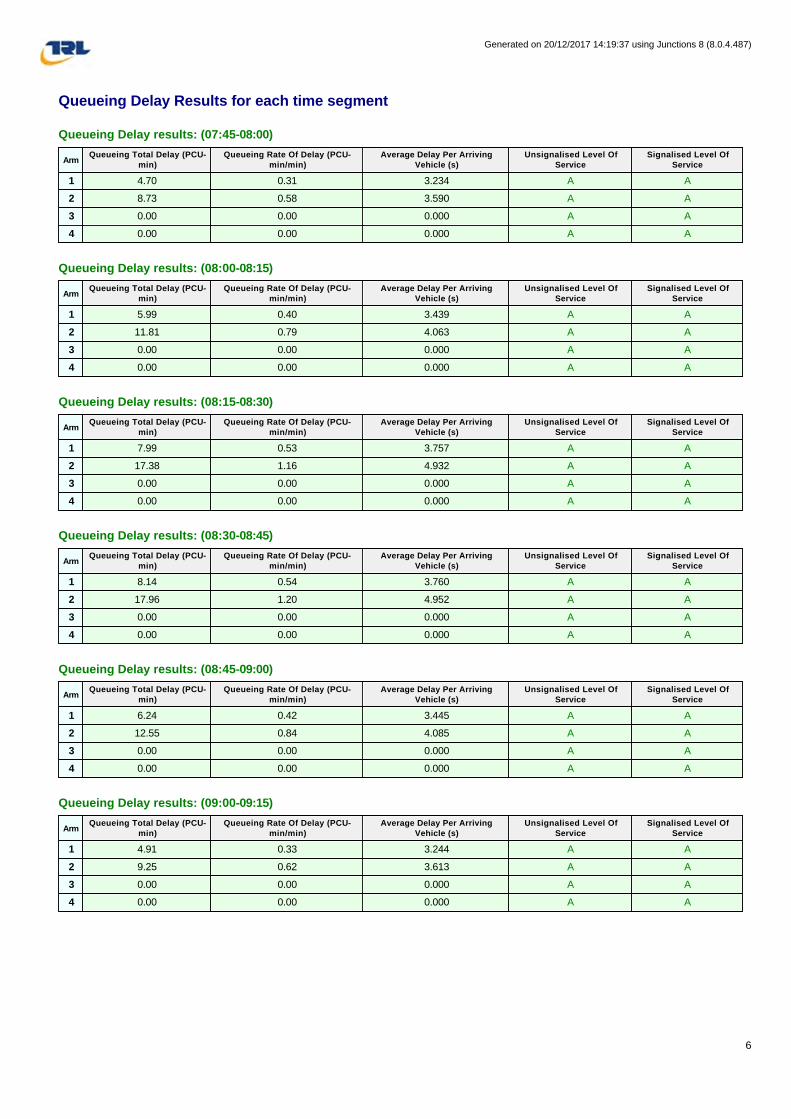
Queueing Delay Results for each time segment
Queueing Delay results: (07:45-08:00)
Queueing Delay results: (08:00-08:15)
Queueing Delay results: (08:15-08:30)
Queueing Delay results: (08:30-08:45)
Queueing Delay results: (08:45-09:00)
Queueing Delay results: (09:00-09:15)
ArmQueueing Total Delay (PCU-
min)Queueing Rate Of Delay (PCU-
min/min)Average Delay Per Arriving
Vehicle (s)Unsignalised Level Of
ServiceSignalised Level Of
Service
1 4.70 0.31 3.234 A A
2 8.73 0.58 3.590 A A
3 0.00 0.00 0.000 A A
4 0.00 0.00 0.000 A A
ArmQueueing Total Delay (PCU-
min)Queueing Rate Of Delay (PCU-
min/min)Average Delay Per Arriving
Vehicle (s)Unsignalised Level Of
ServiceSignalised Level Of
Service
1 5.99 0.40 3.439 A A
2 11.81 0.79 4.063 A A
3 0.00 0.00 0.000 A A
4 0.00 0.00 0.000 A A
ArmQueueing Total Delay (PCU-
min)Queueing Rate Of Delay (PCU-
min/min)Average Delay Per Arriving
Vehicle (s)Unsignalised Level Of
ServiceSignalised Level Of
Service
1 7.99 0.53 3.757 A A
2 17.38 1.16 4.932 A A
3 0.00 0.00 0.000 A A
4 0.00 0.00 0.000 A A
ArmQueueing Total Delay (PCU-
min)Queueing Rate Of Delay (PCU-
min/min)Average Delay Per Arriving
Vehicle (s)Unsignalised Level Of
ServiceSignalised Level Of
Service
1 8.14 0.54 3.760 A A
2 17.96 1.20 4.952 A A
3 0.00 0.00 0.000 A A
4 0.00 0.00 0.000 A A
ArmQueueing Total Delay (PCU-
min)Queueing Rate Of Delay (PCU-
min/min)Average Delay Per Arriving
Vehicle (s)Unsignalised Level Of
ServiceSignalised Level Of
Service
1 6.24 0.42 3.445 A A
2 12.55 0.84 4.085 A A
3 0.00 0.00 0.000 A A
4 0.00 0.00 0.000 A A
ArmQueueing Total Delay (PCU-
min)Queueing Rate Of Delay (PCU-
min/min)Average Delay Per Arriving
Vehicle (s)Unsignalised Level Of
ServiceSignalised Level Of
Service
1 4.91 0.33 3.244 A A
2 9.25 0.62 3.613 A A
3 0.00 0.00 0.000 A A
4 0.00 0.00 0.000 A A
Generated on 20/12/2017 14:19:37 using Junctions 8 (8.0.4.487)
6

(Default Analysis Set) - 2017 Base, PM
Data Errors and Warnings No errors or warnings
Traffic Flows
Demand Set Data Options
Entry Flows
General Flows Data
Turning Proportions
Turning Counts / Proportions (PCU/hr) - Junction 1 (for whole period)
Turning Proportions (PCU) - Junction 1 (for whole period)
Default Vehicle
Mix
Vehicle Mix Varies Over Time
Vehicle Mix Varies Over Turn
Vehicle Mix Varies Over Entry
Vehicle Mix Source
PCU Factor
for a HV (PCU)
Default Turning
Proportions
Estimate from
entry/exit counts
Turning Proportions
Vary Over Time
Turning Proportions
Vary Over Turn
Turning Proportions
Vary Over Entry
ü üHV
Percentages2.00 ü ü
Arm Profile Type Use Turning Counts Average Demand Flow (PCU/hr) Flow Scaling Factor (%)
1 ONE HOUR ü 757.00 100.000
2 ONE HOUR ü 709.00 100.000
3 ONE HOUR ü 0.00 100.000
4 ONE HOUR ü 0.00 100.000
To
From
1 2 3 4
1 0.000 757.000 0.000 0.000
2 709.000 0.000 0.000 0.000
3 0.000 0.000 0.000 0.000
4 0.000 0.000 0.000 0.000
To
From
1 2 3 4
1 0.00 1.00 0.00 0.00
2 1.00 0.00 0.00 0.00
3 0.25 0.25 0.25 0.25
4 0.25 0.25 0.25 0.25
Generated on 20/12/2017 14:19:37 using Junctions 8 (8.0.4.487)
7
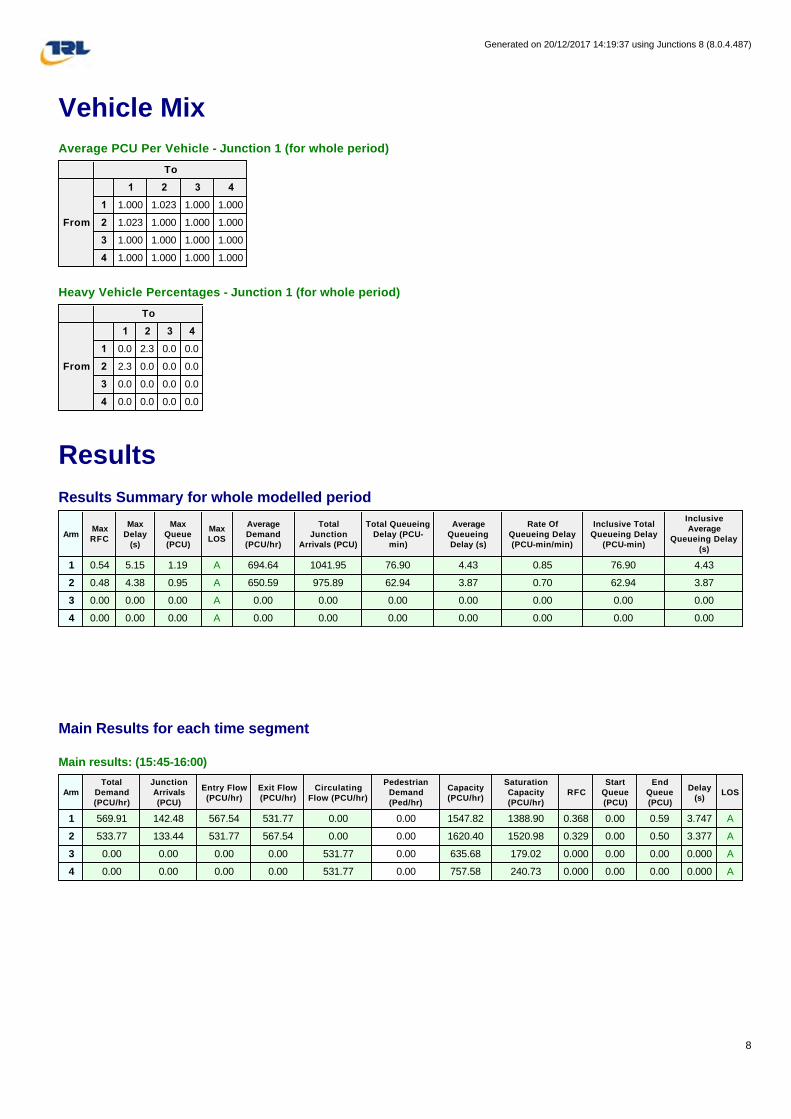
Vehicle Mix
Average PCU Per Vehicle - Junction 1 (for whole period)
Heavy Vehicle Percentages - Junction 1 (for whole period)
Results
Results Summary for whole modelled period
Main Results for each time segment
Main results: (15:45-16:00)
To
From
1 2 3 4
1 1.000 1.023 1.000 1.000
2 1.023 1.000 1.000 1.000
3 1.000 1.000 1.000 1.000
4 1.000 1.000 1.000 1.000
To
From
1 2 3 4
1 0.0 2.3 0.0 0.0
2 2.3 0.0 0.0 0.0
3 0.0 0.0 0.0 0.0
4 0.0 0.0 0.0 0.0
ArmMax RFC
Max Delay
(s)
Max Queue (PCU)
Max LOS
Average Demand (PCU/hr)
Total Junction
Arrivals (PCU)
Total Queueing Delay (PCU-
min)
Average Queueing Delay (s)
Rate Of Queueing Delay (PCU-min/min)
Inclusive Total Queueing Delay
(PCU-min)
Inclusive Average
Queueing Delay (s)
1 0.54 5.15 1.19 A 694.64 1041.95 76.90 4.43 0.85 76.90 4.43
2 0.48 4.38 0.95 A 650.59 975.89 62.94 3.87 0.70 62.94 3.87
3 0.00 0.00 0.00 A 0.00 0.00 0.00 0.00 0.00 0.00 0.00
4 0.00 0.00 0.00 A 0.00 0.00 0.00 0.00 0.00 0.00 0.00
ArmTotal
Demand (PCU/hr)
Junction Arrivals (PCU)
Entry Flow (PCU/hr)
Exit Flow (PCU/hr)
Circulating Flow (PCU/hr)
Pedestrian Demand (Ped/hr)
Capacity (PCU/hr)
Saturation Capacity (PCU/hr)
RFCStart
Queue (PCU)
End Queue (PCU)
Delay (s)
LOS
1 569.91 142.48 567.54 531.77 0.00 0.00 1547.82 1388.90 0.368 0.00 0.59 3.747 A
2 533.77 133.44 531.77 567.54 0.00 0.00 1620.40 1520.98 0.329 0.00 0.50 3.377 A
3 0.00 0.00 0.00 0.00 531.77 0.00 635.68 179.02 0.000 0.00 0.00 0.000 A
4 0.00 0.00 0.00 0.00 531.77 0.00 757.58 240.73 0.000 0.00 0.00 0.000 A
Generated on 20/12/2017 14:19:37 using Junctions 8 (8.0.4.487)
8
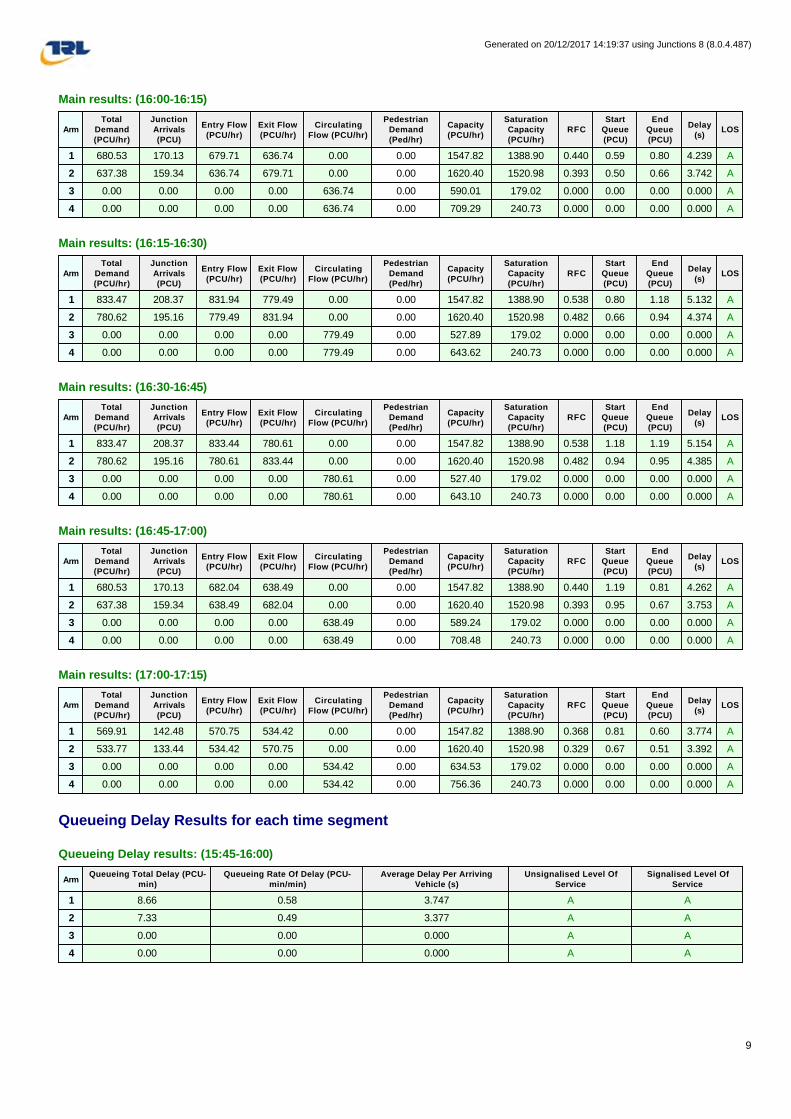
Main results: (16:00-16:15)
Main results: (16:15-16:30)
Main results: (16:30-16:45)
Main results: (16:45-17:00)
Main results: (17:00-17:15)
Queueing Delay Results for each time segment
Queueing Delay results: (15:45-16:00)
ArmTotal
Demand (PCU/hr)
Junction Arrivals (PCU)
Entry Flow (PCU/hr)
Exit Flow (PCU/hr)
Circulating Flow (PCU/hr)
Pedestrian Demand (Ped/hr)
Capacity (PCU/hr)
Saturation Capacity (PCU/hr)
RFCStart
Queue (PCU)
End Queue (PCU)
Delay (s)
LOS
1 680.53 170.13 679.71 636.74 0.00 0.00 1547.82 1388.90 0.440 0.59 0.80 4.239 A
2 637.38 159.34 636.74 679.71 0.00 0.00 1620.40 1520.98 0.393 0.50 0.66 3.742 A
3 0.00 0.00 0.00 0.00 636.74 0.00 590.01 179.02 0.000 0.00 0.00 0.000 A
4 0.00 0.00 0.00 0.00 636.74 0.00 709.29 240.73 0.000 0.00 0.00 0.000 A
ArmTotal
Demand (PCU/hr)
Junction Arrivals (PCU)
Entry Flow (PCU/hr)
Exit Flow (PCU/hr)
Circulating Flow (PCU/hr)
Pedestrian Demand (Ped/hr)
Capacity (PCU/hr)
Saturation Capacity (PCU/hr)
RFCStart
Queue (PCU)
End Queue (PCU)
Delay (s)
LOS
1 833.47 208.37 831.94 779.49 0.00 0.00 1547.82 1388.90 0.538 0.80 1.18 5.132 A
2 780.62 195.16 779.49 831.94 0.00 0.00 1620.40 1520.98 0.482 0.66 0.94 4.374 A
3 0.00 0.00 0.00 0.00 779.49 0.00 527.89 179.02 0.000 0.00 0.00 0.000 A
4 0.00 0.00 0.00 0.00 779.49 0.00 643.62 240.73 0.000 0.00 0.00 0.000 A
ArmTotal
Demand (PCU/hr)
Junction Arrivals (PCU)
Entry Flow (PCU/hr)
Exit Flow (PCU/hr)
Circulating Flow (PCU/hr)
Pedestrian Demand (Ped/hr)
Capacity (PCU/hr)
Saturation Capacity (PCU/hr)
RFCStart
Queue (PCU)
End Queue (PCU)
Delay (s)
LOS
1 833.47 208.37 833.44 780.61 0.00 0.00 1547.82 1388.90 0.538 1.18 1.19 5.154 A
2 780.62 195.16 780.61 833.44 0.00 0.00 1620.40 1520.98 0.482 0.94 0.95 4.385 A
3 0.00 0.00 0.00 0.00 780.61 0.00 527.40 179.02 0.000 0.00 0.00 0.000 A
4 0.00 0.00 0.00 0.00 780.61 0.00 643.10 240.73 0.000 0.00 0.00 0.000 A
ArmTotal
Demand (PCU/hr)
Junction Arrivals (PCU)
Entry Flow (PCU/hr)
Exit Flow (PCU/hr)
Circulating Flow (PCU/hr)
Pedestrian Demand (Ped/hr)
Capacity (PCU/hr)
Saturation Capacity (PCU/hr)
RFCStart
Queue (PCU)
End Queue (PCU)
Delay (s)
LOS
1 680.53 170.13 682.04 638.49 0.00 0.00 1547.82 1388.90 0.440 1.19 0.81 4.262 A
2 637.38 159.34 638.49 682.04 0.00 0.00 1620.40 1520.98 0.393 0.95 0.67 3.753 A
3 0.00 0.00 0.00 0.00 638.49 0.00 589.24 179.02 0.000 0.00 0.00 0.000 A
4 0.00 0.00 0.00 0.00 638.49 0.00 708.48 240.73 0.000 0.00 0.00 0.000 A
ArmTotal
Demand (PCU/hr)
Junction Arrivals (PCU)
Entry Flow (PCU/hr)
Exit Flow (PCU/hr)
Circulating Flow (PCU/hr)
Pedestrian Demand (Ped/hr)
Capacity (PCU/hr)
Saturation Capacity (PCU/hr)
RFCStart
Queue (PCU)
End Queue (PCU)
Delay (s)
LOS
1 569.91 142.48 570.75 534.42 0.00 0.00 1547.82 1388.90 0.368 0.81 0.60 3.774 A
2 533.77 133.44 534.42 570.75 0.00 0.00 1620.40 1520.98 0.329 0.67 0.51 3.392 A
3 0.00 0.00 0.00 0.00 534.42 0.00 634.53 179.02 0.000 0.00 0.00 0.000 A
4 0.00 0.00 0.00 0.00 534.42 0.00 756.36 240.73 0.000 0.00 0.00 0.000 A
ArmQueueing Total Delay (PCU-
min)Queueing Rate Of Delay (PCU-
min/min)Average Delay Per Arriving
Vehicle (s)Unsignalised Level Of
ServiceSignalised Level Of
Service
1 8.66 0.58 3.747 A A
2 7.33 0.49 3.377 A A
3 0.00 0.00 0.000 A A
4 0.00 0.00 0.000 A A
Generated on 20/12/2017 14:19:37 using Junctions 8 (8.0.4.487)
9
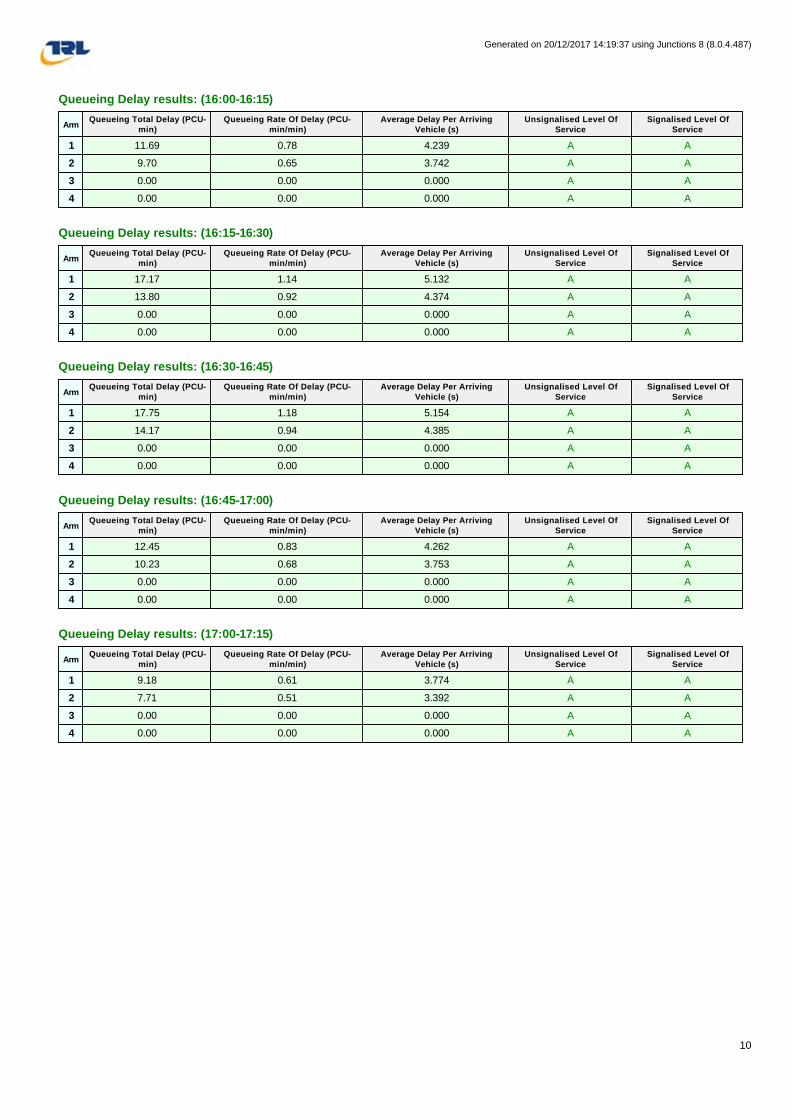
Queueing Delay results: (16:00-16:15)
Queueing Delay results: (16:15-16:30)
Queueing Delay results: (16:30-16:45)
Queueing Delay results: (16:45-17:00)
Queueing Delay results: (17:00-17:15)
ArmQueueing Total Delay (PCU-
min)Queueing Rate Of Delay (PCU-
min/min)Average Delay Per Arriving
Vehicle (s)Unsignalised Level Of
ServiceSignalised Level Of
Service
1 11.69 0.78 4.239 A A
2 9.70 0.65 3.742 A A
3 0.00 0.00 0.000 A A
4 0.00 0.00 0.000 A A
ArmQueueing Total Delay (PCU-
min)Queueing Rate Of Delay (PCU-
min/min)Average Delay Per Arriving
Vehicle (s)Unsignalised Level Of
ServiceSignalised Level Of
Service
1 17.17 1.14 5.132 A A
2 13.80 0.92 4.374 A A
3 0.00 0.00 0.000 A A
4 0.00 0.00 0.000 A A
ArmQueueing Total Delay (PCU-
min)Queueing Rate Of Delay (PCU-
min/min)Average Delay Per Arriving
Vehicle (s)Unsignalised Level Of
ServiceSignalised Level Of
Service
1 17.75 1.18 5.154 A A
2 14.17 0.94 4.385 A A
3 0.00 0.00 0.000 A A
4 0.00 0.00 0.000 A A
ArmQueueing Total Delay (PCU-
min)Queueing Rate Of Delay (PCU-
min/min)Average Delay Per Arriving
Vehicle (s)Unsignalised Level Of
ServiceSignalised Level Of
Service
1 12.45 0.83 4.262 A A
2 10.23 0.68 3.753 A A
3 0.00 0.00 0.000 A A
4 0.00 0.00 0.000 A A
ArmQueueing Total Delay (PCU-
min)Queueing Rate Of Delay (PCU-
min/min)Average Delay Per Arriving
Vehicle (s)Unsignalised Level Of
ServiceSignalised Level Of
Service
1 9.18 0.61 3.774 A A
2 7.71 0.51 3.392 A A
3 0.00 0.00 0.000 A A
4 0.00 0.00 0.000 A A
Generated on 20/12/2017 14:19:37 using Junctions 8 (8.0.4.487)
10

(Default Analysis Set) - 2019 Base, AM
Data Errors and Warnings No errors or warnings
Traffic Flows
Demand Set Data Options
Entry Flows
General Flows Data
Turning Proportions
Turning Counts / Proportions (PCU/hr) - Junction 1 (for whole period)
Turning Proportions (PCU) - Junction 1 (for whole period)
Default Vehicle
Mix
Vehicle Mix Varies Over Time
Vehicle Mix Varies Over Turn
Vehicle Mix Varies Over Entry
Vehicle Mix Source
PCU Factor
for a HV (PCU)
Default Turning
Proportions
Estimate from
entry/exit counts
Turning Proportions
Vary Over Time
Turning Proportions
Vary Over Turn
Turning Proportions
Vary Over Entry
ü üHV
Percentages2.00 ü ü
Arm Profile Type Use Turning Counts Average Demand Flow (PCU/hr) Flow Scaling Factor (%)
1 ONE HOUR ü 533.00 100.000
2 ONE HOUR ü 972.00 100.000
3 ONE HOUR ü 0.00 100.000
4 ONE HOUR ü 0.00 100.000
To
From
1 2 3 4
1 0.000 533.000 0.000 0.000
2 972.000 0.000 0.000 0.000
3 0.000 0.000 0.000 0.000
4 0.000 0.000 0.000 0.000
To
From
1 2 3 4
1 0.00 1.00 0.00 0.00
2 1.00 0.00 0.00 0.00
3 0.25 0.25 0.25 0.25
4 0.25 0.25 0.25 0.25
Generated on 20/12/2017 14:19:37 using Junctions 8 (8.0.4.487)
11

Vehicle Mix
Average PCU Per Vehicle - Junction 1 (for whole period)
Heavy Vehicle Percentages - Junction 1 (for whole period)
Results
Results Summary for whole modelled period
Main Results for each time segment
Main results: (07:45-08:00)
To
From
1 2 3 4
1 1.000 1.064 1.000 1.000
2 1.019 1.000 1.000 1.000
3 1.000 1.000 1.000 1.000
4 1.000 1.000 1.000 1.000
To
From
1 2 3 4
1 0.0 6.4 0.0 0.0
2 1.9 0.0 0.0 0.0
3 0.0 0.0 0.0 0.0
4 0.0 0.0 0.0 0.0
ArmMax RFC
Max Delay
(s)
Max Queue (PCU)
Max LOS
Average Demand (PCU/hr)
Total Junction
Arrivals (PCU)
Total Queueing Delay (PCU-
min)
Average Queueing Delay (s)
Rate Of Queueing Delay (PCU-min/min)
Inclusive Total Queueing Delay
(PCU-min)
Inclusive Average
Queueing Delay (s)
1 0.38 3.99 0.65 A 489.09 733.64 44.66 3.65 0.50 44.67 3.65
2 0.66 6.66 1.96 A 891.92 1337.89 118.16 5.30 1.31 118.17 5.30
3 0.00 0.00 0.00 A 0.00 0.00 0.00 0.00 0.00 0.00 0.00
4 0.00 0.00 0.00 A 0.00 0.00 0.00 0.00 0.00 0.00 0.00
ArmTotal
Demand (PCU/hr)
Junction Arrivals (PCU)
Entry Flow (PCU/hr)
Exit Flow (PCU/hr)
Circulating Flow (PCU/hr)
Pedestrian Demand (Ped/hr)
Capacity (PCU/hr)
Saturation Capacity (PCU/hr)
RFCStart
Queue (PCU)
End Queue (PCU)
Delay (s)
LOS
1 401.27 100.32 399.79 728.44 0.00 0.00 1547.82 1388.90 0.259 0.00 0.37 3.332 A
2 731.77 182.94 728.44 399.79 0.00 0.00 1620.40 1520.98 0.452 0.00 0.83 4.098 A
3 0.00 0.00 0.00 0.00 728.44 0.00 550.10 179.02 0.000 0.00 0.00 0.000 A
4 0.00 0.00 0.00 0.00 728.44 0.00 667.10 240.73 0.000 0.00 0.00 0.000 A
Generated on 20/12/2017 14:19:37 using Junctions 8 (8.0.4.487)
12

Main results: (08:00-08:15)
Main results: (08:15-08:30)
Main results: (08:30-08:45)
Main results: (08:45-09:00)
Main results: (09:00-09:15)
Queueing Delay Results for each time segment
Queueing Delay results: (07:45-08:00)
ArmTotal
Demand (PCU/hr)
Junction Arrivals (PCU)
Entry Flow (PCU/hr)
Exit Flow (PCU/hr)
Circulating Flow (PCU/hr)
Pedestrian Demand (Ped/hr)
Capacity (PCU/hr)
Saturation Capacity (PCU/hr)
RFCStart
Queue (PCU)
End Queue (PCU)
Delay (s)
LOS
1 479.16 119.79 478.74 872.42 0.00 0.00 1547.82 1388.90 0.310 0.37 0.47 3.580 A
2 873.81 218.45 872.42 478.74 0.00 0.00 1620.40 1520.98 0.539 0.83 1.18 4.895 A
3 0.00 0.00 0.00 0.00 872.42 0.00 487.44 179.02 0.000 0.00 0.00 0.000 A
4 0.00 0.00 0.00 0.00 872.42 0.00 600.86 240.73 0.000 0.00 0.00 0.000 A
ArmTotal
Demand (PCU/hr)
Junction Arrivals (PCU)
Entry Flow (PCU/hr)
Exit Flow (PCU/hr)
Circulating Flow (PCU/hr)
Pedestrian Demand (Ped/hr)
Capacity (PCU/hr)
Saturation Capacity (PCU/hr)
RFCStart
Queue (PCU)
End Queue (PCU)
Delay (s)
LOS
1 586.84 146.71 586.16 1067.14 0.00 0.00 1547.82 1388.90 0.379 0.47 0.65 3.980 A
2 1070.19 267.55 1067.14 586.16 0.00 0.00 1620.40 1520.98 0.660 1.18 1.94 6.593 A
3 0.00 0.00 0.00 0.00 1067.14 0.00 402.71 179.02 0.000 0.00 0.00 0.000 A
4 0.00 0.00 0.00 0.00 1067.14 0.00 511.28 240.73 0.000 0.00 0.00 0.000 A
ArmTotal
Demand (PCU/hr)
Junction Arrivals (PCU)
Entry Flow (PCU/hr)
Exit Flow (PCU/hr)
Circulating Flow (PCU/hr)
Pedestrian Demand (Ped/hr)
Capacity (PCU/hr)
Saturation Capacity (PCU/hr)
RFCStart
Queue (PCU)
End Queue (PCU)
Delay (s)
LOS
1 586.84 146.71 586.84 1070.11 0.00 0.00 1547.82 1388.90 0.379 0.65 0.65 3.985 A
2 1070.19 267.55 1070.11 586.84 0.00 0.00 1620.40 1520.98 0.660 1.94 1.96 6.663 A
3 0.00 0.00 0.00 0.00 1070.11 0.00 401.41 179.02 0.000 0.00 0.00 0.000 A
4 0.00 0.00 0.00 0.00 1070.11 0.00 509.92 240.73 0.000 0.00 0.00 0.000 A
ArmTotal
Demand (PCU/hr)
Junction Arrivals (PCU)
Entry Flow (PCU/hr)
Exit Flow (PCU/hr)
Circulating Flow (PCU/hr)
Pedestrian Demand (Ped/hr)
Capacity (PCU/hr)
Saturation Capacity (PCU/hr)
RFCStart
Queue (PCU)
End Queue (PCU)
Delay (s)
LOS
1 479.16 119.79 479.83 876.83 0.00 0.00 1547.82 1388.90 0.310 0.65 0.48 3.590 A
2 873.81 218.45 876.83 479.83 0.00 0.00 1620.40 1520.98 0.539 1.96 1.21 4.954 A
3 0.00 0.00 0.00 0.00 876.83 0.00 485.53 179.02 0.000 0.00 0.00 0.000 A
4 0.00 0.00 0.00 0.00 876.83 0.00 598.84 240.73 0.000 0.00 0.00 0.000 A
ArmTotal
Demand (PCU/hr)
Junction Arrivals (PCU)
Entry Flow (PCU/hr)
Exit Flow (PCU/hr)
Circulating Flow (PCU/hr)
Pedestrian Demand (Ped/hr)
Capacity (PCU/hr)
Saturation Capacity (PCU/hr)
RFCStart
Queue (PCU)
End Queue (PCU)
Delay (s)
LOS
1 401.27 100.32 401.69 733.21 0.00 0.00 1547.82 1388.90 0.259 0.48 0.37 3.342 A
2 731.77 182.94 733.21 401.69 0.00 0.00 1620.40 1520.98 0.452 1.21 0.85 4.142 A
3 0.00 0.00 0.00 0.00 733.21 0.00 548.02 179.02 0.000 0.00 0.00 0.000 A
4 0.00 0.00 0.00 0.00 733.21 0.00 664.91 240.73 0.000 0.00 0.00 0.000 A
ArmQueueing Total Delay (PCU-
min)Queueing Rate Of Delay (PCU-
min/min)Average Delay Per Arriving
Vehicle (s)Unsignalised Level Of
ServiceSignalised Level Of
Service
1 5.44 0.36 3.332 A A
2 12.11 0.81 4.098 A A
3 0.00 0.00 0.000 A A
4 0.00 0.00 0.000 A A
Generated on 20/12/2017 14:19:37 using Junctions 8 (8.0.4.487)
13

Queueing Delay results: (08:00-08:15)
Queueing Delay results: (08:15-08:30)
Queueing Delay results: (08:30-08:45)
Queueing Delay results: (08:45-09:00)
Queueing Delay results: (09:00-09:15)
ArmQueueing Total Delay (PCU-
min)Queueing Rate Of Delay (PCU-
min/min)Average Delay Per Arriving
Vehicle (s)Unsignalised Level Of
ServiceSignalised Level Of
Service
1 7.00 0.47 3.580 A A
2 17.20 1.15 4.895 A A
3 0.00 0.00 0.000 A A
4 0.00 0.00 0.000 A A
ArmQueueing Total Delay (PCU-
min)Queueing Rate Of Delay (PCU-
min/min)Average Delay Per Arriving
Vehicle (s)Unsignalised Level Of
ServiceSignalised Level Of
Service
1 9.49 0.63 3.980 A A
2 27.83 1.86 6.593 A A
3 0.00 0.00 0.000 A A
4 0.00 0.00 0.000 A A
ArmQueueing Total Delay (PCU-
min)Queueing Rate Of Delay (PCU-
min/min)Average Delay Per Arriving
Vehicle (s)Unsignalised Level Of
ServiceSignalised Level Of
Service
1 9.70 0.65 3.985 A A
2 29.30 1.95 6.663 A A
3 0.00 0.00 0.000 A A
4 0.00 0.00 0.000 A A
ArmQueueing Total Delay (PCU-
min)Queueing Rate Of Delay (PCU-
min/min)Average Delay Per Arriving
Vehicle (s)Unsignalised Level Of
ServiceSignalised Level Of
Service
1 7.33 0.49 3.590 A A
2 18.72 1.25 4.954 A A
3 0.00 0.00 0.000 A A
4 0.00 0.00 0.000 A A
ArmQueueing Total Delay (PCU-
min)Queueing Rate Of Delay (PCU-
min/min)Average Delay Per Arriving
Vehicle (s)Unsignalised Level Of
ServiceSignalised Level Of
Service
1 5.70 0.38 3.342 A A
2 13.00 0.87 4.142 A A
3 0.00 0.00 0.000 A A
4 0.00 0.00 0.000 A A
Generated on 20/12/2017 14:19:37 using Junctions 8 (8.0.4.487)
14
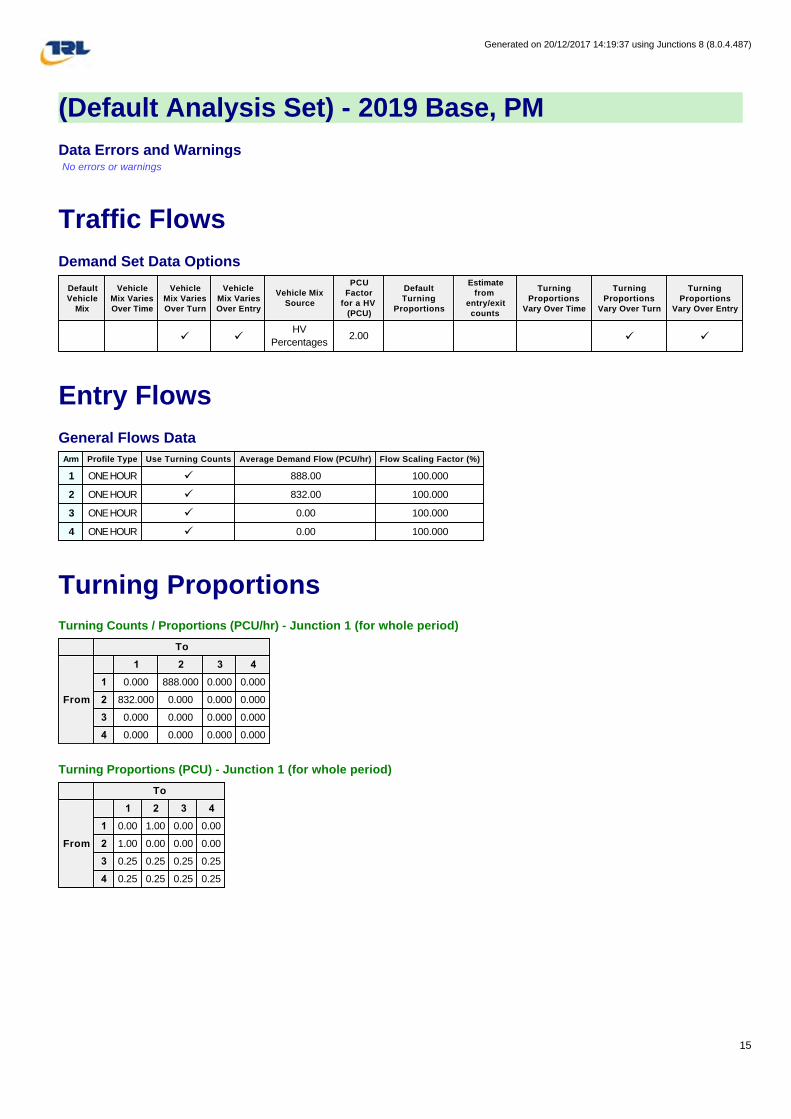
(Default Analysis Set) - 2019 Base, PM
Data Errors and Warnings No errors or warnings
Traffic Flows
Demand Set Data Options
Entry Flows
General Flows Data
Turning Proportions
Turning Counts / Proportions (PCU/hr) - Junction 1 (for whole period)
Turning Proportions (PCU) - Junction 1 (for whole period)
Default Vehicle
Mix
Vehicle Mix Varies Over Time
Vehicle Mix Varies Over Turn
Vehicle Mix Varies Over Entry
Vehicle Mix Source
PCU Factor
for a HV (PCU)
Default Turning
Proportions
Estimate from
entry/exit counts
Turning Proportions
Vary Over Time
Turning Proportions
Vary Over Turn
Turning Proportions
Vary Over Entry
ü üHV
Percentages2.00 ü ü
Arm Profile Type Use Turning Counts Average Demand Flow (PCU/hr) Flow Scaling Factor (%)
1 ONE HOUR ü 888.00 100.000
2 ONE HOUR ü 832.00 100.000
3 ONE HOUR ü 0.00 100.000
4 ONE HOUR ü 0.00 100.000
To
From
1 2 3 4
1 0.000 888.000 0.000 0.000
2 832.000 0.000 0.000 0.000
3 0.000 0.000 0.000 0.000
4 0.000 0.000 0.000 0.000
To
From
1 2 3 4
1 0.00 1.00 0.00 0.00
2 1.00 0.00 0.00 0.00
3 0.25 0.25 0.25 0.25
4 0.25 0.25 0.25 0.25
Generated on 20/12/2017 14:19:37 using Junctions 8 (8.0.4.487)
15

Vehicle Mix
Average PCU Per Vehicle - Junction 1 (for whole period)
Heavy Vehicle Percentages - Junction 1 (for whole period)
Results
Results Summary for whole modelled period
Main Results for each time segment
Main results: (15:45-16:00)
To
From
1 2 3 4
1 1.000 1.020 1.000 1.000
2 1.020 1.000 1.000 1.000
3 1.000 1.000 1.000 1.000
4 1.000 1.000 1.000 1.000
To
From
1 2 3 4
1 0.0 2.0 0.0 0.0
2 2.0 0.0 0.0 0.0
3 0.0 0.0 0.0 0.0
4 0.0 0.0 0.0 0.0
ArmMax RFC
Max Delay
(s)
Max Queue (PCU)
Max LOS
Average Demand (PCU/hr)
Total Junction
Arrivals (PCU)
Total Queueing Delay (PCU-
min)
Average Queueing Delay (s)
Rate Of Queueing Delay (PCU-min/min)
Inclusive Total Queueing Delay
(PCU-min)
Inclusive Average
Queueing Delay (s)
1 0.63 6.44 1.73 A 814.84 1222.27 106.52 5.23 1.18 106.53 5.23
2 0.57 5.21 1.32 A 763.46 1145.19 84.28 4.42 0.94 84.29 4.42
3 0.00 0.00 0.00 A 0.00 0.00 0.00 0.00 0.00 0.00 0.00
4 0.00 0.00 0.00 A 0.00 0.00 0.00 0.00 0.00 0.00 0.00
ArmTotal
Demand (PCU/hr)
Junction Arrivals (PCU)
Entry Flow (PCU/hr)
Exit Flow (PCU/hr)
Circulating Flow (PCU/hr)
Pedestrian Demand (Ped/hr)
Capacity (PCU/hr)
Saturation Capacity (PCU/hr)
RFCStart
Queue (PCU)
End Queue (PCU)
Delay (s)
LOS
1 668.53 167.13 665.46 623.82 0.00 0.00 1547.82 1388.89 0.432 0.00 0.77 4.148 A
2 626.37 156.59 623.82 665.46 0.00 0.00 1620.40 1520.98 0.387 0.00 0.64 3.675 A
3 0.00 0.00 0.00 0.00 623.82 0.00 595.63 179.02 0.000 0.00 0.00 0.000 A
4 0.00 0.00 0.00 0.00 623.82 0.00 715.23 240.73 0.000 0.00 0.00 0.000 A
Generated on 20/12/2017 14:19:37 using Junctions 8 (8.0.4.487)
16
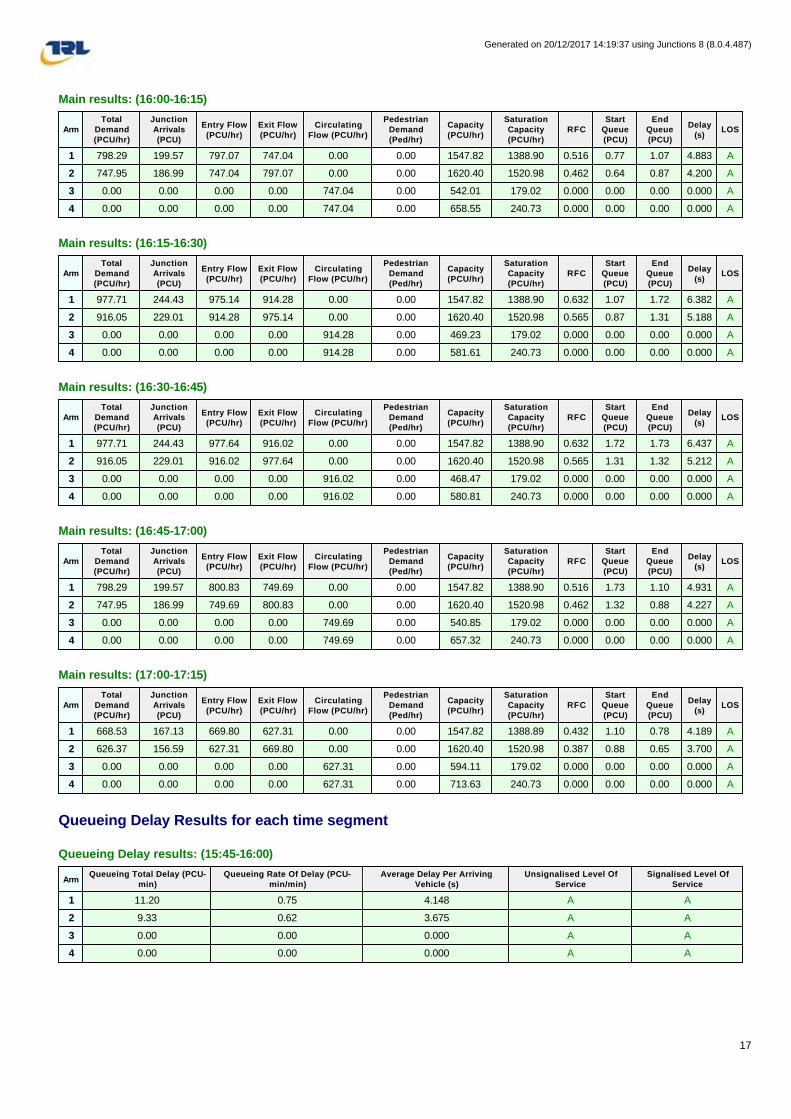
Main results: (16:00-16:15)
Main results: (16:15-16:30)
Main results: (16:30-16:45)
Main results: (16:45-17:00)
Main results: (17:00-17:15)
Queueing Delay Results for each time segment
Queueing Delay results: (15:45-16:00)
ArmTotal
Demand (PCU/hr)
Junction Arrivals (PCU)
Entry Flow (PCU/hr)
Exit Flow (PCU/hr)
Circulating Flow (PCU/hr)
Pedestrian Demand (Ped/hr)
Capacity (PCU/hr)
Saturation Capacity (PCU/hr)
RFCStart
Queue (PCU)
End Queue (PCU)
Delay (s)
LOS
1 798.29 199.57 797.07 747.04 0.00 0.00 1547.82 1388.90 0.516 0.77 1.07 4.883 A
2 747.95 186.99 747.04 797.07 0.00 0.00 1620.40 1520.98 0.462 0.64 0.87 4.200 A
3 0.00 0.00 0.00 0.00 747.04 0.00 542.01 179.02 0.000 0.00 0.00 0.000 A
4 0.00 0.00 0.00 0.00 747.04 0.00 658.55 240.73 0.000 0.00 0.00 0.000 A
ArmTotal
Demand (PCU/hr)
Junction Arrivals (PCU)
Entry Flow (PCU/hr)
Exit Flow (PCU/hr)
Circulating Flow (PCU/hr)
Pedestrian Demand (Ped/hr)
Capacity (PCU/hr)
Saturation Capacity (PCU/hr)
RFCStart
Queue (PCU)
End Queue (PCU)
Delay (s)
LOS
1 977.71 244.43 975.14 914.28 0.00 0.00 1547.82 1388.90 0.632 1.07 1.72 6.382 A
2 916.05 229.01 914.28 975.14 0.00 0.00 1620.40 1520.98 0.565 0.87 1.31 5.188 A
3 0.00 0.00 0.00 0.00 914.28 0.00 469.23 179.02 0.000 0.00 0.00 0.000 A
4 0.00 0.00 0.00 0.00 914.28 0.00 581.61 240.73 0.000 0.00 0.00 0.000 A
ArmTotal
Demand (PCU/hr)
Junction Arrivals (PCU)
Entry Flow (PCU/hr)
Exit Flow (PCU/hr)
Circulating Flow (PCU/hr)
Pedestrian Demand (Ped/hr)
Capacity (PCU/hr)
Saturation Capacity (PCU/hr)
RFCStart
Queue (PCU)
End Queue (PCU)
Delay (s)
LOS
1 977.71 244.43 977.64 916.02 0.00 0.00 1547.82 1388.90 0.632 1.72 1.73 6.437 A
2 916.05 229.01 916.02 977.64 0.00 0.00 1620.40 1520.98 0.565 1.31 1.32 5.212 A
3 0.00 0.00 0.00 0.00 916.02 0.00 468.47 179.02 0.000 0.00 0.00 0.000 A
4 0.00 0.00 0.00 0.00 916.02 0.00 580.81 240.73 0.000 0.00 0.00 0.000 A
ArmTotal
Demand (PCU/hr)
Junction Arrivals (PCU)
Entry Flow (PCU/hr)
Exit Flow (PCU/hr)
Circulating Flow (PCU/hr)
Pedestrian Demand (Ped/hr)
Capacity (PCU/hr)
Saturation Capacity (PCU/hr)
RFCStart
Queue (PCU)
End Queue (PCU)
Delay (s)
LOS
1 798.29 199.57 800.83 749.69 0.00 0.00 1547.82 1388.90 0.516 1.73 1.10 4.931 A
2 747.95 186.99 749.69 800.83 0.00 0.00 1620.40 1520.98 0.462 1.32 0.88 4.227 A
3 0.00 0.00 0.00 0.00 749.69 0.00 540.85 179.02 0.000 0.00 0.00 0.000 A
4 0.00 0.00 0.00 0.00 749.69 0.00 657.32 240.73 0.000 0.00 0.00 0.000 A
ArmTotal
Demand (PCU/hr)
Junction Arrivals (PCU)
Entry Flow (PCU/hr)
Exit Flow (PCU/hr)
Circulating Flow (PCU/hr)
Pedestrian Demand (Ped/hr)
Capacity (PCU/hr)
Saturation Capacity (PCU/hr)
RFCStart
Queue (PCU)
End Queue (PCU)
Delay (s)
LOS
1 668.53 167.13 669.80 627.31 0.00 0.00 1547.82 1388.89 0.432 1.10 0.78 4.189 A
2 626.37 156.59 627.31 669.80 0.00 0.00 1620.40 1520.98 0.387 0.88 0.65 3.700 A
3 0.00 0.00 0.00 0.00 627.31 0.00 594.11 179.02 0.000 0.00 0.00 0.000 A
4 0.00 0.00 0.00 0.00 627.31 0.00 713.63 240.73 0.000 0.00 0.00 0.000 A
ArmQueueing Total Delay (PCU-
min)Queueing Rate Of Delay (PCU-
min/min)Average Delay Per Arriving
Vehicle (s)Unsignalised Level Of
ServiceSignalised Level Of
Service
1 11.20 0.75 4.148 A A
2 9.33 0.62 3.675 A A
3 0.00 0.00 0.000 A A
4 0.00 0.00 0.000 A A
Generated on 20/12/2017 14:19:37 using Junctions 8 (8.0.4.487)
17
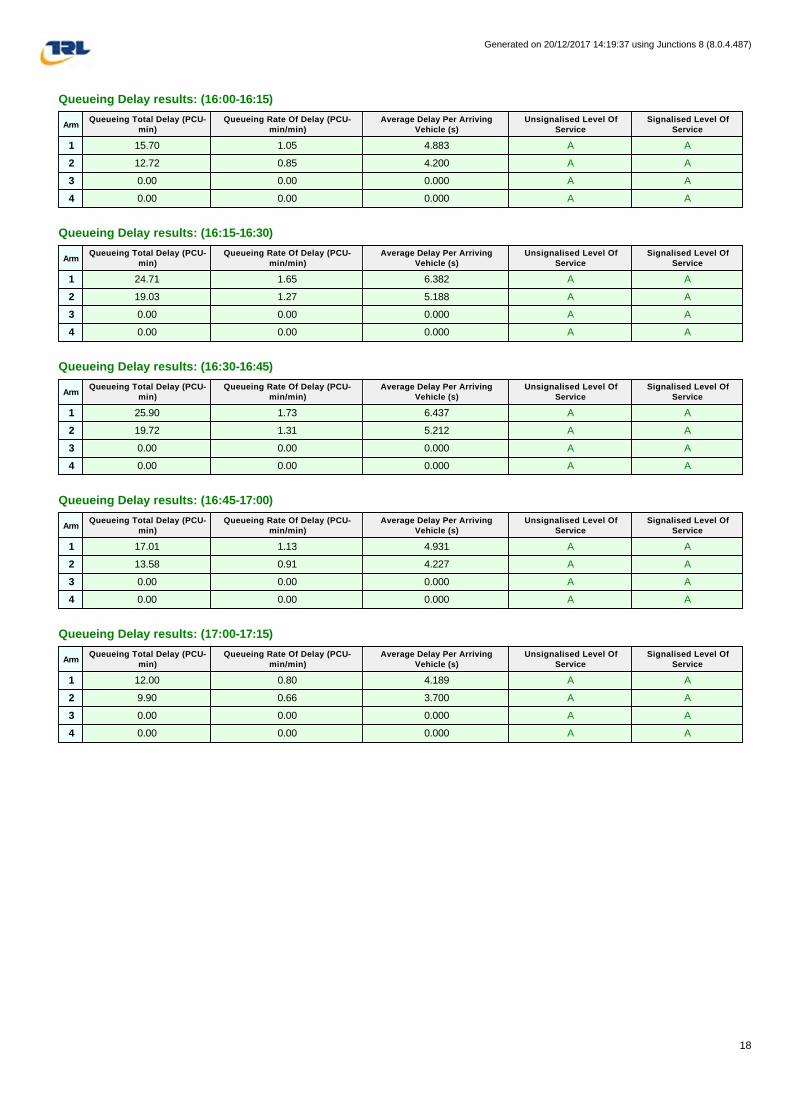
Queueing Delay results: (16:00-16:15)
Queueing Delay results: (16:15-16:30)
Queueing Delay results: (16:30-16:45)
Queueing Delay results: (16:45-17:00)
Queueing Delay results: (17:00-17:15)
ArmQueueing Total Delay (PCU-
min)Queueing Rate Of Delay (PCU-
min/min)Average Delay Per Arriving
Vehicle (s)Unsignalised Level Of
ServiceSignalised Level Of
Service
1 15.70 1.05 4.883 A A
2 12.72 0.85 4.200 A A
3 0.00 0.00 0.000 A A
4 0.00 0.00 0.000 A A
ArmQueueing Total Delay (PCU-
min)Queueing Rate Of Delay (PCU-
min/min)Average Delay Per Arriving
Vehicle (s)Unsignalised Level Of
ServiceSignalised Level Of
Service
1 24.71 1.65 6.382 A A
2 19.03 1.27 5.188 A A
3 0.00 0.00 0.000 A A
4 0.00 0.00 0.000 A A
ArmQueueing Total Delay (PCU-
min)Queueing Rate Of Delay (PCU-
min/min)Average Delay Per Arriving
Vehicle (s)Unsignalised Level Of
ServiceSignalised Level Of
Service
1 25.90 1.73 6.437 A A
2 19.72 1.31 5.212 A A
3 0.00 0.00 0.000 A A
4 0.00 0.00 0.000 A A
ArmQueueing Total Delay (PCU-
min)Queueing Rate Of Delay (PCU-
min/min)Average Delay Per Arriving
Vehicle (s)Unsignalised Level Of
ServiceSignalised Level Of
Service
1 17.01 1.13 4.931 A A
2 13.58 0.91 4.227 A A
3 0.00 0.00 0.000 A A
4 0.00 0.00 0.000 A A
ArmQueueing Total Delay (PCU-
min)Queueing Rate Of Delay (PCU-
min/min)Average Delay Per Arriving
Vehicle (s)Unsignalised Level Of
ServiceSignalised Level Of
Service
1 12.00 0.80 4.189 A A
2 9.90 0.66 3.700 A A
3 0.00 0.00 0.000 A A
4 0.00 0.00 0.000 A A
Generated on 20/12/2017 14:19:37 using Junctions 8 (8.0.4.487)
18

(Default Analysis Set) - 2024 Base, AM
Data Errors and Warnings No errors or warnings
Traffic Flows
Demand Set Data Options
Entry Flows
General Flows Data
Turning Proportions
Turning Counts / Proportions (PCU/hr) - Junction 1 (for whole period)
Turning Proportions (PCU) - Junction 1 (for whole period)
Default Vehicle
Mix
Vehicle Mix Varies Over Time
Vehicle Mix Varies Over Turn
Vehicle Mix Varies Over Entry
Vehicle Mix Source
PCU Factor
for a HV (PCU)
Default Turning
Proportions
Estimate from
entry/exit counts
Turning Proportions
Vary Over Time
Turning Proportions
Vary Over Turn
Turning Proportions
Vary Over Entry
ü üHV
Percentages2.00 ü ü
Arm Profile Type Use Turning Counts Average Demand Flow (PCU/hr) Flow Scaling Factor (%)
1 ONE HOUR ü 563.00 100.000
2 ONE HOUR ü 1012.00 100.000
3 ONE HOUR ü 0.00 100.000
4 ONE HOUR ü 0.00 100.000
To
From
1 2 3 4
1 0.000 563.000 0.000 0.000
2 1012.000 0.000 0.000 0.000
3 0.000 0.000 0.000 0.000
4 0.000 0.000 0.000 0.000
To
From
1 2 3 4
1 0.00 1.00 0.00 0.00
2 1.00 0.00 0.00 0.00
3 0.25 0.25 0.25 0.25
4 0.25 0.25 0.25 0.25
Generated on 20/12/2017 14:19:37 using Junctions 8 (8.0.4.487)
19

Vehicle Mix
Average PCU Per Vehicle - Junction 1 (for whole period)
Heavy Vehicle Percentages - Junction 1 (for whole period)
Results
Results Summary for whole modelled period
Main Results for each time segment
Main results: (07:45-08:00)
To
From
1 2 3 4
1 1.000 1.060 1.000 1.000
2 1.018 1.000 1.000 1.000
3 1.000 1.000 1.000 1.000
4 1.000 1.000 1.000 1.000
To
From
1 2 3 4
1 0.0 6.0 0.0 0.0
2 1.8 0.0 0.0 0.0
3 0.0 0.0 0.0 0.0
4 0.0 0.0 0.0 0.0
ArmMax RFC
Max Delay
(s)
Max Queue (PCU)
Max LOS
Average Demand (PCU/hr)
Total Junction
Arrivals (PCU)
Total Queueing Delay (PCU-
min)
Average Queueing Delay (s)
Rate Of Queueing Delay (PCU-min/min)
Inclusive Total Queueing Delay
(PCU-min)
Inclusive Average
Queueing Delay (s)
1 0.40 4.11 0.71 A 516.62 774.93 48.33 3.74 0.54 48.33 3.74
2 0.69 7.23 2.21 A 928.63 1392.94 130.53 5.62 1.45 130.54 5.62
3 0.00 0.00 0.00 A 0.00 0.00 0.00 0.00 0.00 0.00 0.00
4 0.00 0.00 0.00 A 0.00 0.00 0.00 0.00 0.00 0.00 0.00
ArmTotal
Demand (PCU/hr)
Junction Arrivals (PCU)
Entry Flow (PCU/hr)
Exit Flow (PCU/hr)
Circulating Flow (PCU/hr)
Pedestrian Demand (Ped/hr)
Capacity (PCU/hr)
Saturation Capacity (PCU/hr)
RFCStart
Queue (PCU)
End Queue (PCU)
Delay (s)
LOS
1 423.86 105.96 422.27 758.30 0.00 0.00 1547.82 1388.90 0.274 0.00 0.40 3.386 A
2 761.89 190.47 758.30 422.27 0.00 0.00 1620.40 1520.98 0.470 0.00 0.90 4.233 A
3 0.00 0.00 0.00 0.00 758.30 0.00 537.10 179.02 0.000 0.00 0.00 0.000 A
4 0.00 0.00 0.00 0.00 758.30 0.00 653.36 240.73 0.000 0.00 0.00 0.000 A
Generated on 20/12/2017 14:19:37 using Junctions 8 (8.0.4.487)
20
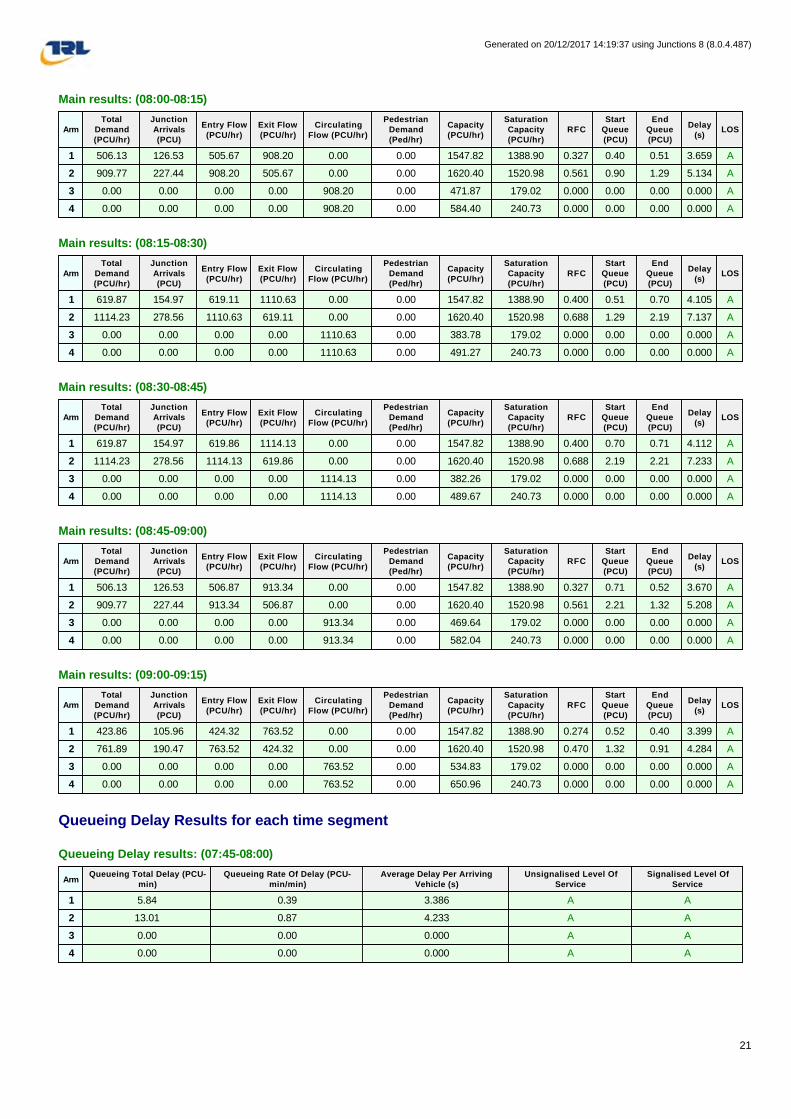
Main results: (08:00-08:15)
Main results: (08:15-08:30)
Main results: (08:30-08:45)
Main results: (08:45-09:00)
Main results: (09:00-09:15)
Queueing Delay Results for each time segment
Queueing Delay results: (07:45-08:00)
ArmTotal
Demand (PCU/hr)
Junction Arrivals (PCU)
Entry Flow (PCU/hr)
Exit Flow (PCU/hr)
Circulating Flow (PCU/hr)
Pedestrian Demand (Ped/hr)
Capacity (PCU/hr)
Saturation Capacity (PCU/hr)
RFCStart
Queue (PCU)
End Queue (PCU)
Delay (s)
LOS
1 506.13 126.53 505.67 908.20 0.00 0.00 1547.82 1388.90 0.327 0.40 0.51 3.659 A
2 909.77 227.44 908.20 505.67 0.00 0.00 1620.40 1520.98 0.561 0.90 1.29 5.134 A
3 0.00 0.00 0.00 0.00 908.20 0.00 471.87 179.02 0.000 0.00 0.00 0.000 A
4 0.00 0.00 0.00 0.00 908.20 0.00 584.40 240.73 0.000 0.00 0.00 0.000 A
ArmTotal
Demand (PCU/hr)
Junction Arrivals (PCU)
Entry Flow (PCU/hr)
Exit Flow (PCU/hr)
Circulating Flow (PCU/hr)
Pedestrian Demand (Ped/hr)
Capacity (PCU/hr)
Saturation Capacity (PCU/hr)
RFCStart
Queue (PCU)
End Queue (PCU)
Delay (s)
LOS
1 619.87 154.97 619.11 1110.63 0.00 0.00 1547.82 1388.90 0.400 0.51 0.70 4.105 A
2 1114.23 278.56 1110.63 619.11 0.00 0.00 1620.40 1520.98 0.688 1.29 2.19 7.137 A
3 0.00 0.00 0.00 0.00 1110.63 0.00 383.78 179.02 0.000 0.00 0.00 0.000 A
4 0.00 0.00 0.00 0.00 1110.63 0.00 491.27 240.73 0.000 0.00 0.00 0.000 A
ArmTotal
Demand (PCU/hr)
Junction Arrivals (PCU)
Entry Flow (PCU/hr)
Exit Flow (PCU/hr)
Circulating Flow (PCU/hr)
Pedestrian Demand (Ped/hr)
Capacity (PCU/hr)
Saturation Capacity (PCU/hr)
RFCStart
Queue (PCU)
End Queue (PCU)
Delay (s)
LOS
1 619.87 154.97 619.86 1114.13 0.00 0.00 1547.82 1388.90 0.400 0.70 0.71 4.112 A
2 1114.23 278.56 1114.13 619.86 0.00 0.00 1620.40 1520.98 0.688 2.19 2.21 7.233 A
3 0.00 0.00 0.00 0.00 1114.13 0.00 382.26 179.02 0.000 0.00 0.00 0.000 A
4 0.00 0.00 0.00 0.00 1114.13 0.00 489.67 240.73 0.000 0.00 0.00 0.000 A
ArmTotal
Demand (PCU/hr)
Junction Arrivals (PCU)
Entry Flow (PCU/hr)
Exit Flow (PCU/hr)
Circulating Flow (PCU/hr)
Pedestrian Demand (Ped/hr)
Capacity (PCU/hr)
Saturation Capacity (PCU/hr)
RFCStart
Queue (PCU)
End Queue (PCU)
Delay (s)
LOS
1 506.13 126.53 506.87 913.34 0.00 0.00 1547.82 1388.90 0.327 0.71 0.52 3.670 A
2 909.77 227.44 913.34 506.87 0.00 0.00 1620.40 1520.98 0.561 2.21 1.32 5.208 A
3 0.00 0.00 0.00 0.00 913.34 0.00 469.64 179.02 0.000 0.00 0.00 0.000 A
4 0.00 0.00 0.00 0.00 913.34 0.00 582.04 240.73 0.000 0.00 0.00 0.000 A
ArmTotal
Demand (PCU/hr)
Junction Arrivals (PCU)
Entry Flow (PCU/hr)
Exit Flow (PCU/hr)
Circulating Flow (PCU/hr)
Pedestrian Demand (Ped/hr)
Capacity (PCU/hr)
Saturation Capacity (PCU/hr)
RFCStart
Queue (PCU)
End Queue (PCU)
Delay (s)
LOS
1 423.86 105.96 424.32 763.52 0.00 0.00 1547.82 1388.90 0.274 0.52 0.40 3.399 A
2 761.89 190.47 763.52 424.32 0.00 0.00 1620.40 1520.98 0.470 1.32 0.91 4.284 A
3 0.00 0.00 0.00 0.00 763.52 0.00 534.83 179.02 0.000 0.00 0.00 0.000 A
4 0.00 0.00 0.00 0.00 763.52 0.00 650.96 240.73 0.000 0.00 0.00 0.000 A
ArmQueueing Total Delay (PCU-
min)Queueing Rate Of Delay (PCU-
min/min)Average Delay Per Arriving
Vehicle (s)Unsignalised Level Of
ServiceSignalised Level Of
Service
1 5.84 0.39 3.386 A A
2 13.01 0.87 4.233 A A
3 0.00 0.00 0.000 A A
4 0.00 0.00 0.000 A A
Generated on 20/12/2017 14:19:37 using Junctions 8 (8.0.4.487)
21
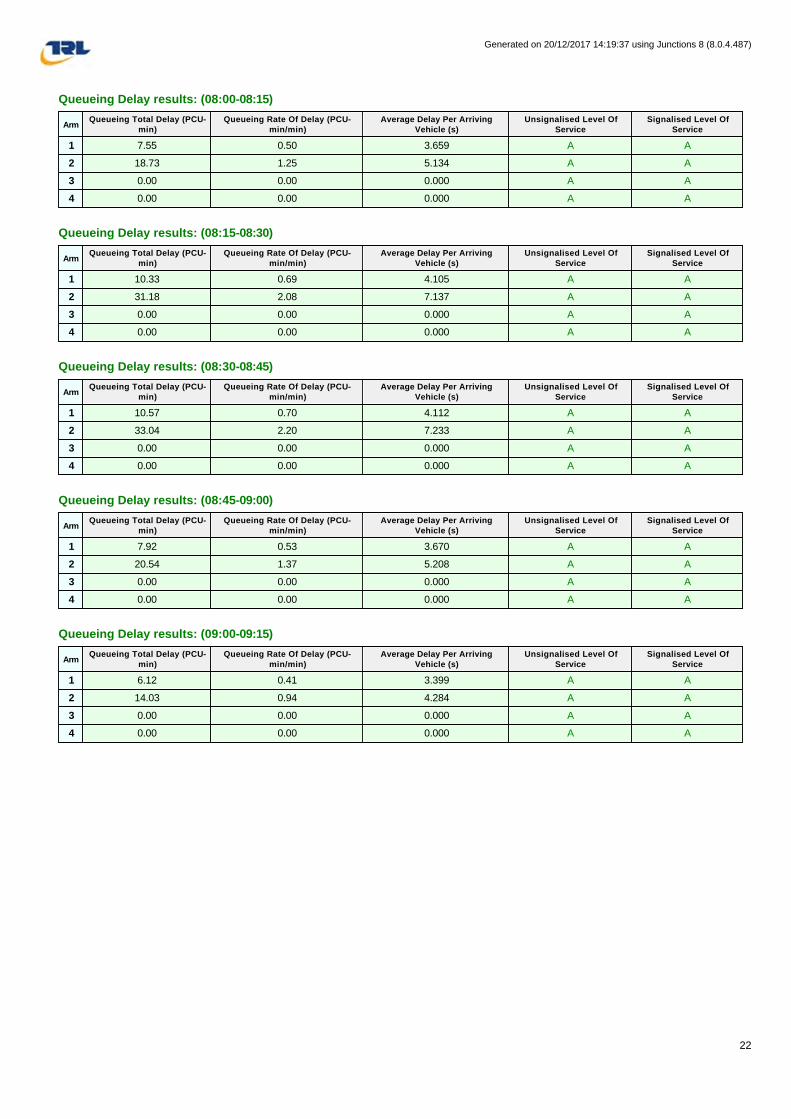
Queueing Delay results: (08:00-08:15)
Queueing Delay results: (08:15-08:30)
Queueing Delay results: (08:30-08:45)
Queueing Delay results: (08:45-09:00)
Queueing Delay results: (09:00-09:15)
ArmQueueing Total Delay (PCU-
min)Queueing Rate Of Delay (PCU-
min/min)Average Delay Per Arriving
Vehicle (s)Unsignalised Level Of
ServiceSignalised Level Of
Service
1 7.55 0.50 3.659 A A
2 18.73 1.25 5.134 A A
3 0.00 0.00 0.000 A A
4 0.00 0.00 0.000 A A
ArmQueueing Total Delay (PCU-
min)Queueing Rate Of Delay (PCU-
min/min)Average Delay Per Arriving
Vehicle (s)Unsignalised Level Of
ServiceSignalised Level Of
Service
1 10.33 0.69 4.105 A A
2 31.18 2.08 7.137 A A
3 0.00 0.00 0.000 A A
4 0.00 0.00 0.000 A A
ArmQueueing Total Delay (PCU-
min)Queueing Rate Of Delay (PCU-
min/min)Average Delay Per Arriving
Vehicle (s)Unsignalised Level Of
ServiceSignalised Level Of
Service
1 10.57 0.70 4.112 A A
2 33.04 2.20 7.233 A A
3 0.00 0.00 0.000 A A
4 0.00 0.00 0.000 A A
ArmQueueing Total Delay (PCU-
min)Queueing Rate Of Delay (PCU-
min/min)Average Delay Per Arriving
Vehicle (s)Unsignalised Level Of
ServiceSignalised Level Of
Service
1 7.92 0.53 3.670 A A
2 20.54 1.37 5.208 A A
3 0.00 0.00 0.000 A A
4 0.00 0.00 0.000 A A
ArmQueueing Total Delay (PCU-
min)Queueing Rate Of Delay (PCU-
min/min)Average Delay Per Arriving
Vehicle (s)Unsignalised Level Of
ServiceSignalised Level Of
Service
1 6.12 0.41 3.399 A A
2 14.03 0.94 4.284 A A
3 0.00 0.00 0.000 A A
4 0.00 0.00 0.000 A A
Generated on 20/12/2017 14:19:37 using Junctions 8 (8.0.4.487)
22
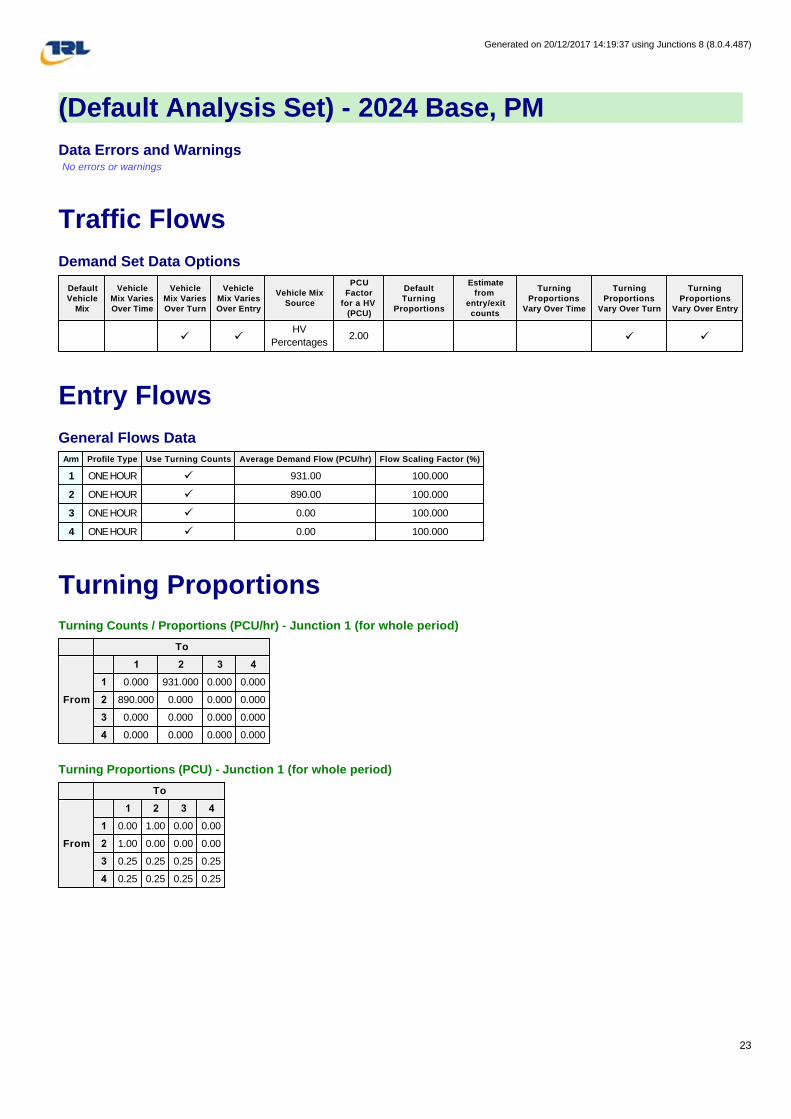
(Default Analysis Set) - 2024 Base, PM
Data Errors and Warnings No errors or warnings
Traffic Flows
Demand Set Data Options
Entry Flows
General Flows Data
Turning Proportions
Turning Counts / Proportions (PCU/hr) - Junction 1 (for whole period)
Turning Proportions (PCU) - Junction 1 (for whole period)
Default Vehicle
Mix
Vehicle Mix Varies Over Time
Vehicle Mix Varies Over Turn
Vehicle Mix Varies Over Entry
Vehicle Mix Source
PCU Factor
for a HV (PCU)
Default Turning
Proportions
Estimate from
entry/exit counts
Turning Proportions
Vary Over Time
Turning Proportions
Vary Over Turn
Turning Proportions
Vary Over Entry
ü üHV
Percentages2.00 ü ü
Arm Profile Type Use Turning Counts Average Demand Flow (PCU/hr) Flow Scaling Factor (%)
1 ONE HOUR ü 931.00 100.000
2 ONE HOUR ü 890.00 100.000
3 ONE HOUR ü 0.00 100.000
4 ONE HOUR ü 0.00 100.000
To
From
1 2 3 4
1 0.000 931.000 0.000 0.000
2 890.000 0.000 0.000 0.000
3 0.000 0.000 0.000 0.000
4 0.000 0.000 0.000 0.000
To
From
1 2 3 4
1 0.00 1.00 0.00 0.00
2 1.00 0.00 0.00 0.00
3 0.25 0.25 0.25 0.25
4 0.25 0.25 0.25 0.25
Generated on 20/12/2017 14:19:37 using Junctions 8 (8.0.4.487)
23

Vehicle Mix
Average PCU Per Vehicle - Junction 1 (for whole period)
Heavy Vehicle Percentages - Junction 1 (for whole period)
Results
Results Summary for whole modelled period
Main Results for each time segment
Main results: (15:45-16:00)
To
From
1 2 3 4
1 1.000 1.019 1.000 1.000
2 1.018 1.000 1.000 1.000
3 1.000 1.000 1.000 1.000
4 1.000 1.000 1.000 1.000
To
From
1 2 3 4
1 0.0 1.9 0.0 0.0
2 1.8 0.0 0.0 0.0
3 0.0 0.0 0.0 0.0
4 0.0 0.0 0.0 0.0
ArmMax RFC
Max Delay
(s)
Max Queue (PCU)
Max LOS
Average Demand (PCU/hr)
Total Junction
Arrivals (PCU)
Total Queueing Delay (PCU-
min)
Average Queueing Delay (s)
Rate Of Queueing Delay (PCU-min/min)
Inclusive Total Queueing Delay
(PCU-min)
Inclusive Average
Queueing Delay (s)
1 0.66 7.01 1.98 A 854.30 1281.45 118.86 5.57 1.32 118.88 5.57
2 0.60 5.72 1.55 A 816.68 1225.02 96.64 4.73 1.07 96.65 4.73
3 0.00 0.00 0.00 A 0.00 0.00 0.00 0.00 0.00 0.00 0.00
4 0.00 0.00 0.00 A 0.00 0.00 0.00 0.00 0.00 0.00 0.00
ArmTotal
Demand (PCU/hr)
Junction Arrivals (PCU)
Entry Flow (PCU/hr)
Exit Flow (PCU/hr)
Circulating Flow (PCU/hr)
Pedestrian Demand (Ped/hr)
Capacity (PCU/hr)
Saturation Capacity (PCU/hr)
RFCStart
Queue (PCU)
End Queue (PCU)
Delay (s)
LOS
1 700.91 175.23 697.56 667.19 0.00 0.00 1547.82 1388.90 0.453 0.00 0.84 4.298 A
2 670.04 167.51 667.19 697.56 0.00 0.00 1620.40 1520.98 0.414 0.00 0.71 3.833 A
3 0.00 0.00 0.00 0.00 667.19 0.00 576.76 179.02 0.000 0.00 0.00 0.000 A
4 0.00 0.00 0.00 0.00 667.19 0.00 695.28 240.73 0.000 0.00 0.00 0.000 A
Generated on 20/12/2017 14:19:37 using Junctions 8 (8.0.4.487)
24

Main results: (16:00-16:15)
Main results: (16:15-16:30)
Main results: (16:30-16:45)
Main results: (16:45-17:00)
Main results: (17:00-17:15)
Queueing Delay Results for each time segment
Queueing Delay results: (15:45-16:00)
ArmTotal
Demand (PCU/hr)
Junction Arrivals (PCU)
Entry Flow (PCU/hr)
Exit Flow (PCU/hr)
Circulating Flow (PCU/hr)
Pedestrian Demand (Ped/hr)
Capacity (PCU/hr)
Saturation Capacity (PCU/hr)
RFCStart
Queue (PCU)
End Queue (PCU)
Delay (s)
LOS
1 836.95 209.24 835.55 799.01 0.00 0.00 1547.82 1388.90 0.541 0.84 1.19 5.139 A
2 800.09 200.02 799.01 835.55 0.00 0.00 1620.40 1520.98 0.494 0.71 0.98 4.456 A
3 0.00 0.00 0.00 0.00 799.01 0.00 519.39 179.02 0.000 0.00 0.00 0.000 A
4 0.00 0.00 0.00 0.00 799.01 0.00 634.64 240.73 0.000 0.00 0.00 0.000 A
ArmTotal
Demand (PCU/hr)
Junction Arrivals (PCU)
Entry Flow (PCU/hr)
Exit Flow (PCU/hr)
Circulating Flow (PCU/hr)
Pedestrian Demand (Ped/hr)
Capacity (PCU/hr)
Saturation Capacity (PCU/hr)
RFCStart
Queue (PCU)
End Queue (PCU)
Delay (s)
LOS
1 1025.05 256.26 1021.97 977.71 0.00 0.00 1547.82 1388.90 0.662 1.19 1.95 6.934 A
2 979.91 244.98 977.71 1021.97 0.00 0.00 1620.40 1520.98 0.605 0.98 1.53 5.683 A
3 0.00 0.00 0.00 0.00 977.71 0.00 441.63 179.02 0.000 0.00 0.00 0.000 A
4 0.00 0.00 0.00 0.00 977.71 0.00 552.43 240.73 0.000 0.00 0.00 0.000 A
ArmTotal
Demand (PCU/hr)
Junction Arrivals (PCU)
Entry Flow (PCU/hr)
Exit Flow (PCU/hr)
Circulating Flow (PCU/hr)
Pedestrian Demand (Ped/hr)
Capacity (PCU/hr)
Saturation Capacity (PCU/hr)
RFCStart
Queue (PCU)
End Queue (PCU)
Delay (s)
LOS
1 1025.05 256.26 1024.97 979.86 0.00 0.00 1547.82 1388.90 0.662 1.95 1.98 7.013 A
2 979.91 244.98 979.86 1024.97 0.00 0.00 1620.40 1520.98 0.605 1.53 1.55 5.721 A
3 0.00 0.00 0.00 0.00 979.86 0.00 440.69 179.02 0.000 0.00 0.00 0.000 A
4 0.00 0.00 0.00 0.00 979.86 0.00 551.44 240.73 0.000 0.00 0.00 0.000 A
ArmTotal
Demand (PCU/hr)
Junction Arrivals (PCU)
Entry Flow (PCU/hr)
Exit Flow (PCU/hr)
Circulating Flow (PCU/hr)
Pedestrian Demand (Ped/hr)
Capacity (PCU/hr)
Saturation Capacity (PCU/hr)
RFCStart
Queue (PCU)
End Queue (PCU)
Delay (s)
LOS
1 836.95 209.24 840.00 802.26 0.00 0.00 1547.82 1388.90 0.541 1.98 1.21 5.206 A
2 800.09 200.02 802.26 840.00 0.00 0.00 1620.40 1520.98 0.494 1.55 1.00 4.490 A
3 0.00 0.00 0.00 0.00 802.26 0.00 517.98 179.02 0.000 0.00 0.00 0.000 A
4 0.00 0.00 0.00 0.00 802.26 0.00 633.14 240.73 0.000 0.00 0.00 0.000 A
ArmTotal
Demand (PCU/hr)
Junction Arrivals (PCU)
Entry Flow (PCU/hr)
Exit Flow (PCU/hr)
Circulating Flow (PCU/hr)
Pedestrian Demand (Ped/hr)
Capacity (PCU/hr)
Saturation Capacity (PCU/hr)
RFCStart
Queue (PCU)
End Queue (PCU)
Delay (s)
LOS
1 700.91 175.23 702.36 671.16 0.00 0.00 1547.82 1388.90 0.453 1.21 0.85 4.346 A
2 670.04 167.51 671.16 702.36 0.00 0.00 1620.40 1520.98 0.414 1.00 0.72 3.865 A
3 0.00 0.00 0.00 0.00 671.16 0.00 575.03 179.02 0.000 0.00 0.00 0.000 A
4 0.00 0.00 0.00 0.00 671.16 0.00 693.45 240.73 0.000 0.00 0.00 0.000 A
ArmQueueing Total Delay (PCU-
min)Queueing Rate Of Delay (PCU-
min/min)Average Delay Per Arriving
Vehicle (s)Unsignalised Level Of
ServiceSignalised Level Of
Service
1 12.15 0.81 4.298 A A
2 10.39 0.69 3.833 A A
3 0.00 0.00 0.000 A A
4 0.00 0.00 0.000 A A
Generated on 20/12/2017 14:19:37 using Junctions 8 (8.0.4.487)
25

Queueing Delay results: (16:00-16:15)
Queueing Delay results: (16:15-16:30)
Queueing Delay results: (16:30-16:45)
Queueing Delay results: (16:45-17:00)
Queueing Delay results: (17:00-17:15)
ArmQueueing Total Delay (PCU-
min)Queueing Rate Of Delay (PCU-
min/min)Average Delay Per Arriving
Vehicle (s)Unsignalised Level Of
ServiceSignalised Level Of
Service
1 17.28 1.15 5.139 A A
2 14.40 0.96 4.456 A A
3 0.00 0.00 0.000 A A
4 0.00 0.00 0.000 A A
ArmQueueing Total Delay (PCU-
min)Queueing Rate Of Delay (PCU-
min/min)Average Delay Per Arriving
Vehicle (s)Unsignalised Level Of
ServiceSignalised Level Of
Service
1 27.98 1.87 6.934 A A
2 22.18 1.48 5.683 A A
3 0.00 0.00 0.000 A A
4 0.00 0.00 0.000 A A
ArmQueueing Total Delay (PCU-
min)Queueing Rate Of Delay (PCU-
min/min)Average Delay Per Arriving
Vehicle (s)Unsignalised Level Of
ServiceSignalised Level Of
Service
1 29.51 1.97 7.013 A A
2 23.11 1.54 5.721 A A
3 0.00 0.00 0.000 A A
4 0.00 0.00 0.000 A A
ArmQueueing Total Delay (PCU-
min)Queueing Rate Of Delay (PCU-
min/min)Average Delay Per Arriving
Vehicle (s)Unsignalised Level Of
ServiceSignalised Level Of
Service
1 18.86 1.26 5.206 A A
2 15.48 1.03 4.490 A A
3 0.00 0.00 0.000 A A
4 0.00 0.00 0.000 A A
ArmQueueing Total Delay (PCU-
min)Queueing Rate Of Delay (PCU-
min/min)Average Delay Per Arriving
Vehicle (s)Unsignalised Level Of
ServiceSignalised Level Of
Service
1 13.08 0.87 4.346 A A
2 11.08 0.74 3.865 A A
3 0.00 0.00 0.000 A A
4 0.00 0.00 0.000 A A
Generated on 20/12/2017 14:19:37 using Junctions 8 (8.0.4.487)
26

(Default Analysis Set) - 2024 Base + Dev, AM
Data Errors and Warnings No errors or warnings
Traffic Flows
Demand Set Data Options
Entry Flows
General Flows Data
Turning Proportions
Turning Counts / Proportions (PCU/hr) - Junction 1 (for whole period)
Turning Proportions (PCU) - Junction 1 (for whole period)
Default Vehicle
Mix
Vehicle Mix Varies Over Time
Vehicle Mix Varies Over Turn
Vehicle Mix Varies Over Entry
Vehicle Mix Source
PCU Factor
for a HV (PCU)
Default Turning
Proportions
Estimate from
entry/exit counts
Turning Proportions
Vary Over Time
Turning Proportions
Vary Over Turn
Turning Proportions
Vary Over Entry
ü üHV
Percentages2.00 ü ü
Arm Profile Type Use Turning Counts Average Demand Flow (PCU/hr) Flow Scaling Factor (%)
1 ONE HOUR ü 626.00 100.000
2 ONE HOUR ü 1068.00 100.000
3 ONE HOUR ü 119.00 100.000
4 ONE HOUR ü 46.00 100.000
To
From
1 2 3 4
1 0.000 563.000 49.000 14.000
2 1012.000 0.000 51.000 5.000
3 70.000 49.000 0.000 0.000
4 33.000 13.000 0.000 0.000
To
From
1 2 3 4
1 0.00 0.90 0.08 0.02
2 0.95 0.00 0.05 0.00
3 0.59 0.41 0.00 0.00
4 0.72 0.28 0.00 0.00
Generated on 20/12/2017 14:19:37 using Junctions 8 (8.0.4.487)
27

Vehicle Mix
Average PCU Per Vehicle - Junction 1 (for whole period)
Heavy Vehicle Percentages - Junction 1 (for whole period)
Results
Results Summary for whole modelled period
Main Results for each time segment
Main results: (07:45-08:00)
To
From
1 2 3 4
1 1.000 1.060 1.000 1.000
2 1.018 1.000 1.000 1.000
3 1.000 1.000 1.000 1.000
4 1.000 1.000 1.000 1.000
To
From
1 2 3 4
1 0.0 6.0 0.0 0.0
2 1.8 0.0 0.0 0.0
3 0.0 0.0 0.0 0.0
4 0.0 0.0 0.0 0.0
ArmMax RFC
Max Delay
(s)
Max Queue (PCU)
Max LOS
Average Demand (PCU/hr)
Total Junction
Arrivals (PCU)
Total Queueing Delay (PCU-
min)
Average Queueing Delay (s)
Rate Of Queueing Delay (PCU-min/min)
Inclusive Total Queueing Delay
(PCU-min)
Inclusive Average
Queueing Delay (s)
1 0.46 4.63 0.88 A 574.43 861.64 58.96 4.11 0.66 58.97 4.11
2 0.74 9.07 2.91 A 980.02 1470.02 161.64 6.60 1.80 161.66 6.60
3 0.35 14.86 0.53 B 109.20 163.79 30.56 11.19 0.34 30.56 11.19
4 0.12 9.50 0.13 A 42.21 63.32 8.22 7.79 0.09 8.22 7.79
ArmTotal
Demand (PCU/hr)
Junction Arrivals (PCU)
Entry Flow (PCU/hr)
Exit Flow (PCU/hr)
Circulating Flow (PCU/hr)
Pedestrian Demand (Ped/hr)
Capacity (PCU/hr)
Saturation Capacity (PCU/hr)
RFCStart
Queue (PCU)
End Queue (PCU)
Delay (s)
LOS
1 471.29 117.82 469.40 834.89 46.28 0.00 1520.59 1456.08 0.310 0.00 0.47 3.602 A
2 804.05 201.01 799.94 468.44 47.24 0.00 1591.96 1532.17 0.505 0.00 1.03 4.599 A
3 89.59 22.40 88.79 74.94 772.24 0.00 531.04 218.01 0.169 0.00 0.20 8.125 A
4 34.63 8.66 34.39 14.24 846.78 0.00 612.66 234.01 0.057 0.00 0.06 6.222 A
Generated on 20/12/2017 14:19:37 using Junctions 8 (8.0.4.487)
28
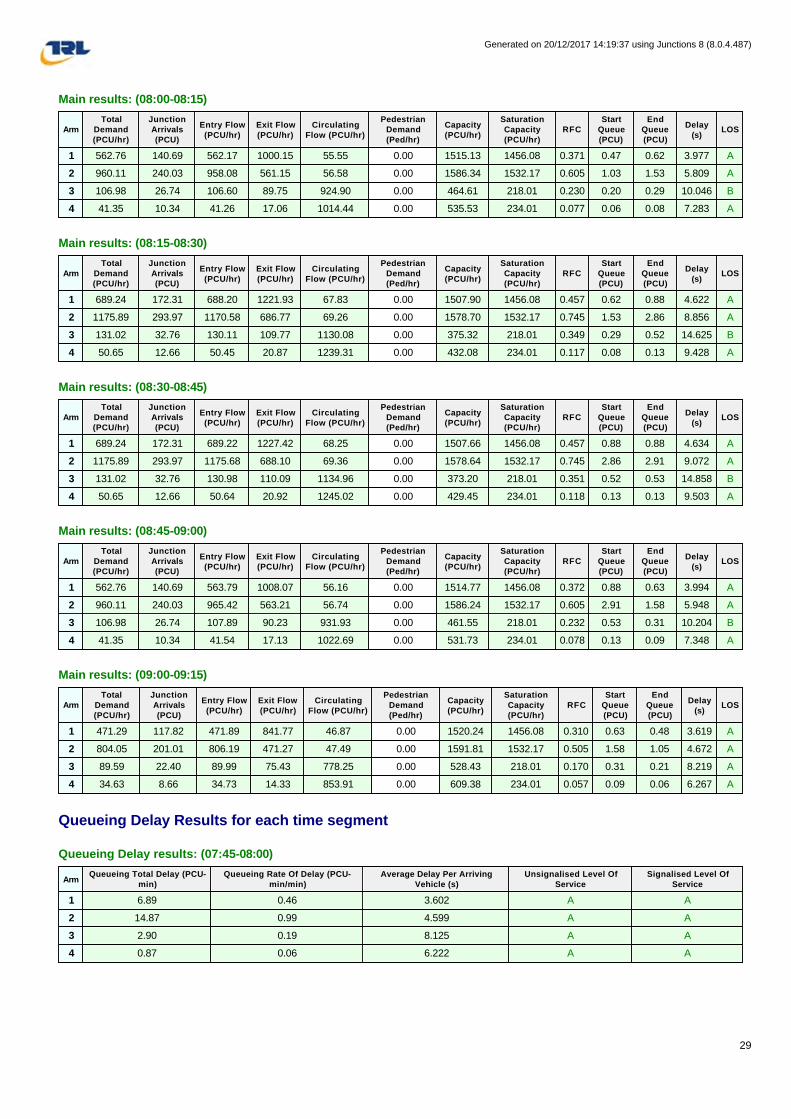
Main results: (08:00-08:15)
Main results: (08:15-08:30)
Main results: (08:30-08:45)
Main results: (08:45-09:00)
Main results: (09:00-09:15)
Queueing Delay Results for each time segment
Queueing Delay results: (07:45-08:00)
ArmTotal
Demand (PCU/hr)
Junction Arrivals (PCU)
Entry Flow (PCU/hr)
Exit Flow (PCU/hr)
Circulating Flow (PCU/hr)
Pedestrian Demand (Ped/hr)
Capacity (PCU/hr)
Saturation Capacity (PCU/hr)
RFCStart
Queue (PCU)
End Queue (PCU)
Delay (s)
LOS
1 562.76 140.69 562.17 1000.15 55.55 0.00 1515.13 1456.08 0.371 0.47 0.62 3.977 A
2 960.11 240.03 958.08 561.15 56.58 0.00 1586.34 1532.17 0.605 1.03 1.53 5.809 A
3 106.98 26.74 106.60 89.75 924.90 0.00 464.61 218.01 0.230 0.20 0.29 10.046 B
4 41.35 10.34 41.26 17.06 1014.44 0.00 535.53 234.01 0.077 0.06 0.08 7.283 A
ArmTotal
Demand (PCU/hr)
Junction Arrivals (PCU)
Entry Flow (PCU/hr)
Exit Flow (PCU/hr)
Circulating Flow (PCU/hr)
Pedestrian Demand (Ped/hr)
Capacity (PCU/hr)
Saturation Capacity (PCU/hr)
RFCStart
Queue (PCU)
End Queue (PCU)
Delay (s)
LOS
1 689.24 172.31 688.20 1221.93 67.83 0.00 1507.90 1456.08 0.457 0.62 0.88 4.622 A
2 1175.89 293.97 1170.58 686.77 69.26 0.00 1578.70 1532.17 0.745 1.53 2.86 8.856 A
3 131.02 32.76 130.11 109.77 1130.08 0.00 375.32 218.01 0.349 0.29 0.52 14.625 B
4 50.65 12.66 50.45 20.87 1239.31 0.00 432.08 234.01 0.117 0.08 0.13 9.428 A
ArmTotal
Demand (PCU/hr)
Junction Arrivals (PCU)
Entry Flow (PCU/hr)
Exit Flow (PCU/hr)
Circulating Flow (PCU/hr)
Pedestrian Demand (Ped/hr)
Capacity (PCU/hr)
Saturation Capacity (PCU/hr)
RFCStart
Queue (PCU)
End Queue (PCU)
Delay (s)
LOS
1 689.24 172.31 689.22 1227.42 68.25 0.00 1507.66 1456.08 0.457 0.88 0.88 4.634 A
2 1175.89 293.97 1175.68 688.10 69.36 0.00 1578.64 1532.17 0.745 2.86 2.91 9.072 A
3 131.02 32.76 130.98 110.09 1134.96 0.00 373.20 218.01 0.351 0.52 0.53 14.858 B
4 50.65 12.66 50.64 20.92 1245.02 0.00 429.45 234.01 0.118 0.13 0.13 9.503 A
ArmTotal
Demand (PCU/hr)
Junction Arrivals (PCU)
Entry Flow (PCU/hr)
Exit Flow (PCU/hr)
Circulating Flow (PCU/hr)
Pedestrian Demand (Ped/hr)
Capacity (PCU/hr)
Saturation Capacity (PCU/hr)
RFCStart
Queue (PCU)
End Queue (PCU)
Delay (s)
LOS
1 562.76 140.69 563.79 1008.07 56.16 0.00 1514.77 1456.08 0.372 0.88 0.63 3.994 A
2 960.11 240.03 965.42 563.21 56.74 0.00 1586.24 1532.17 0.605 2.91 1.58 5.948 A
3 106.98 26.74 107.89 90.23 931.93 0.00 461.55 218.01 0.232 0.53 0.31 10.204 B
4 41.35 10.34 41.54 17.13 1022.69 0.00 531.73 234.01 0.078 0.13 0.09 7.348 A
ArmTotal
Demand (PCU/hr)
Junction Arrivals (PCU)
Entry Flow (PCU/hr)
Exit Flow (PCU/hr)
Circulating Flow (PCU/hr)
Pedestrian Demand (Ped/hr)
Capacity (PCU/hr)
Saturation Capacity (PCU/hr)
RFCStart
Queue (PCU)
End Queue (PCU)
Delay (s)
LOS
1 471.29 117.82 471.89 841.77 46.87 0.00 1520.24 1456.08 0.310 0.63 0.48 3.619 A
2 804.05 201.01 806.19 471.27 47.49 0.00 1591.81 1532.17 0.505 1.58 1.05 4.672 A
3 89.59 22.40 89.99 75.43 778.25 0.00 528.43 218.01 0.170 0.31 0.21 8.219 A
4 34.63 8.66 34.73 14.33 853.91 0.00 609.38 234.01 0.057 0.09 0.06 6.267 A
ArmQueueing Total Delay (PCU-
min)Queueing Rate Of Delay (PCU-
min/min)Average Delay Per Arriving
Vehicle (s)Unsignalised Level Of
ServiceSignalised Level Of
Service
1 6.89 0.46 3.602 A A
2 14.87 0.99 4.599 A A
3 2.90 0.19 8.125 A A
4 0.87 0.06 6.222 A A
Generated on 20/12/2017 14:19:37 using Junctions 8 (8.0.4.487)
29
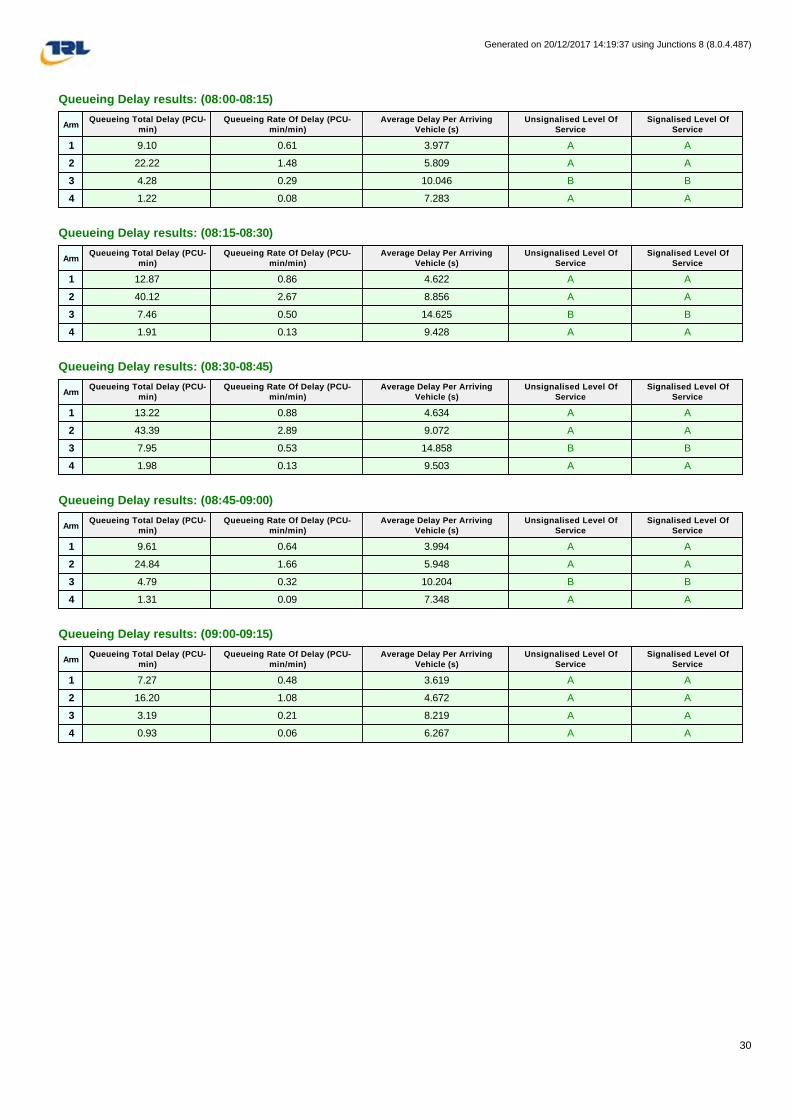
Queueing Delay results: (08:00-08:15)
Queueing Delay results: (08:15-08:30)
Queueing Delay results: (08:30-08:45)
Queueing Delay results: (08:45-09:00)
Queueing Delay results: (09:00-09:15)
ArmQueueing Total Delay (PCU-
min)Queueing Rate Of Delay (PCU-
min/min)Average Delay Per Arriving
Vehicle (s)Unsignalised Level Of
ServiceSignalised Level Of
Service
1 9.10 0.61 3.977 A A
2 22.22 1.48 5.809 A A
3 4.28 0.29 10.046 B B
4 1.22 0.08 7.283 A A
ArmQueueing Total Delay (PCU-
min)Queueing Rate Of Delay (PCU-
min/min)Average Delay Per Arriving
Vehicle (s)Unsignalised Level Of
ServiceSignalised Level Of
Service
1 12.87 0.86 4.622 A A
2 40.12 2.67 8.856 A A
3 7.46 0.50 14.625 B B
4 1.91 0.13 9.428 A A
ArmQueueing Total Delay (PCU-
min)Queueing Rate Of Delay (PCU-
min/min)Average Delay Per Arriving
Vehicle (s)Unsignalised Level Of
ServiceSignalised Level Of
Service
1 13.22 0.88 4.634 A A
2 43.39 2.89 9.072 A A
3 7.95 0.53 14.858 B B
4 1.98 0.13 9.503 A A
ArmQueueing Total Delay (PCU-
min)Queueing Rate Of Delay (PCU-
min/min)Average Delay Per Arriving
Vehicle (s)Unsignalised Level Of
ServiceSignalised Level Of
Service
1 9.61 0.64 3.994 A A
2 24.84 1.66 5.948 A A
3 4.79 0.32 10.204 B B
4 1.31 0.09 7.348 A A
ArmQueueing Total Delay (PCU-
min)Queueing Rate Of Delay (PCU-
min/min)Average Delay Per Arriving
Vehicle (s)Unsignalised Level Of
ServiceSignalised Level Of
Service
1 7.27 0.48 3.619 A A
2 16.20 1.08 4.672 A A
3 3.19 0.21 8.219 A A
4 0.93 0.06 6.267 A A
Generated on 20/12/2017 14:19:37 using Junctions 8 (8.0.4.487)
30
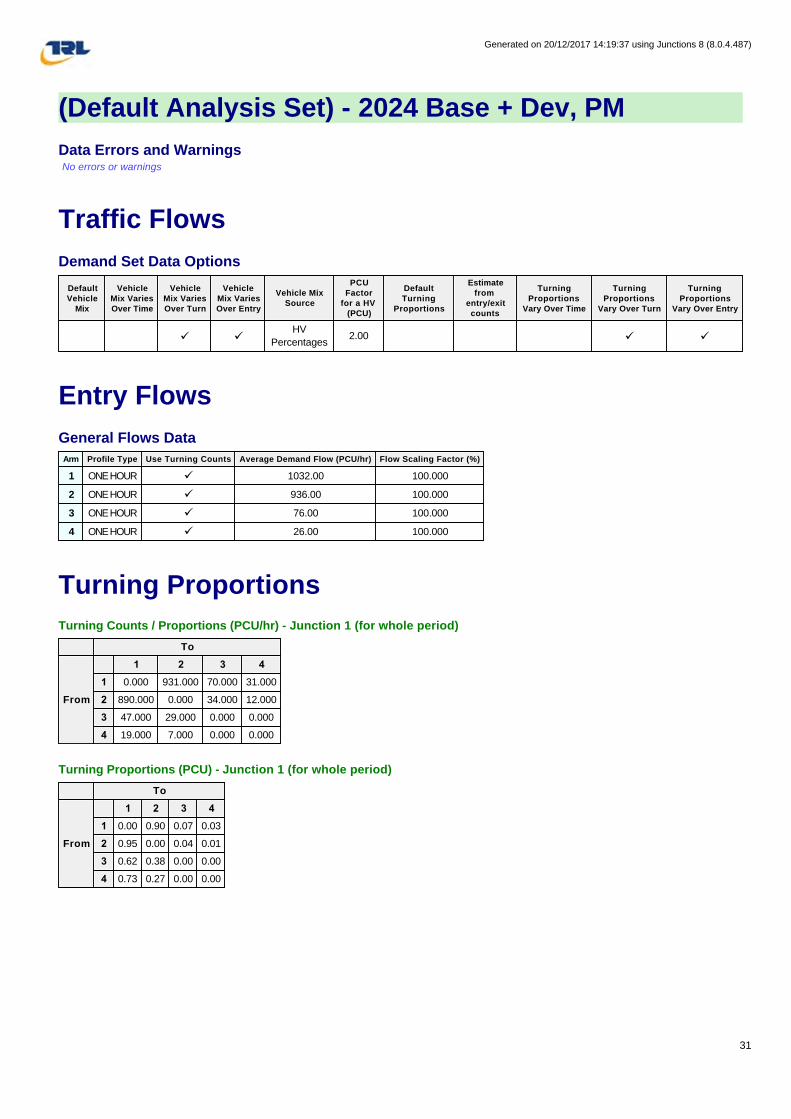
(Default Analysis Set) - 2024 Base + Dev, PM
Data Errors and Warnings No errors or warnings
Traffic Flows
Demand Set Data Options
Entry Flows
General Flows Data
Turning Proportions
Turning Counts / Proportions (PCU/hr) - Junction 1 (for whole period)
Turning Proportions (PCU) - Junction 1 (for whole period)
Default Vehicle
Mix
Vehicle Mix Varies Over Time
Vehicle Mix Varies Over Turn
Vehicle Mix Varies Over Entry
Vehicle Mix Source
PCU Factor
for a HV (PCU)
Default Turning
Proportions
Estimate from
entry/exit counts
Turning Proportions
Vary Over Time
Turning Proportions
Vary Over Turn
Turning Proportions
Vary Over Entry
ü üHV
Percentages2.00 ü ü
Arm Profile Type Use Turning Counts Average Demand Flow (PCU/hr) Flow Scaling Factor (%)
1 ONE HOUR ü 1032.00 100.000
2 ONE HOUR ü 936.00 100.000
3 ONE HOUR ü 76.00 100.000
4 ONE HOUR ü 26.00 100.000
To
From
1 2 3 4
1 0.000 931.000 70.000 31.000
2 890.000 0.000 34.000 12.000
3 47.000 29.000 0.000 0.000
4 19.000 7.000 0.000 0.000
To
From
1 2 3 4
1 0.00 0.90 0.07 0.03
2 0.95 0.00 0.04 0.01
3 0.62 0.38 0.00 0.00
4 0.73 0.27 0.00 0.00
Generated on 20/12/2017 14:19:37 using Junctions 8 (8.0.4.487)
31

Vehicle Mix
Average PCU Per Vehicle - Junction 1 (for whole period)
Heavy Vehicle Percentages - Junction 1 (for whole period)
Results
Results Summary for whole modelled period
Main Results for each time segment
Main results: (15:45-16:00)
Main results: (16:00-16:15)
To
From
1 2 3 4
1 1.000 1.019 1.000 1.000
2 1.018 1.000 1.000 1.000
3 1.000 1.000 1.000 1.000
4 1.000 1.000 1.000 1.000
To
From
1 2 3 4
1 0.0 1.9 0.0 0.0
2 1.8 0.0 0.0 0.0
3 0.0 0.0 0.0 0.0
4 0.0 0.0 0.0 0.0
ArmMax RFC
Max Delay
(s)
Max Queue (PCU)
Max LOS
Average Demand (PCU/hr)
Total Junction
Arrivals (PCU)
Total Queueing Delay (PCU-
min)
Average Queueing Delay (s)
Rate Of Queueing Delay (PCU-min/min)
Inclusive Total Queueing Delay
(PCU-min)
Inclusive Average
Queueing Delay (s)
1 0.75 9.41 2.92 A 946.98 1420.47 162.28 6.85 1.80 162.30 6.86
2 0.66 7.00 1.98 A 858.89 1288.33 117.89 5.49 1.31 117.90 5.49
3 0.20 10.70 0.25 B 69.74 104.61 15.36 8.81 0.17 15.36 8.81
4 0.06 7.43 0.06 A 23.86 35.79 3.85 6.46 0.04 3.85 6.46
ArmTotal
Demand (PCU/hr)
Junction Arrivals (PCU)
Entry Flow (PCU/hr)
Exit Flow (PCU/hr)
Circulating Flow (PCU/hr)
Pedestrian Demand (Ped/hr)
Capacity (PCU/hr)
Saturation Capacity (PCU/hr)
RFCStart
Queue (PCU)
End Queue (PCU)
Delay (s)
LOS
1 776.94 194.24 772.80 716.26 26.90 0.00 1531.99 1464.33 0.507 0.00 1.04 4.797 A
2 704.67 176.17 701.40 724.07 75.63 0.00 1574.86 1534.11 0.447 0.00 0.82 4.177 A
3 57.22 14.30 56.77 77.90 699.14 0.00 562.85 204.61 0.102 0.00 0.11 7.107 A
4 19.57 4.89 19.45 32.21 723.70 0.00 669.28 237.01 0.029 0.00 0.03 5.540 A
Generated on 20/12/2017 14:19:37 using Junctions 8 (8.0.4.487)
32
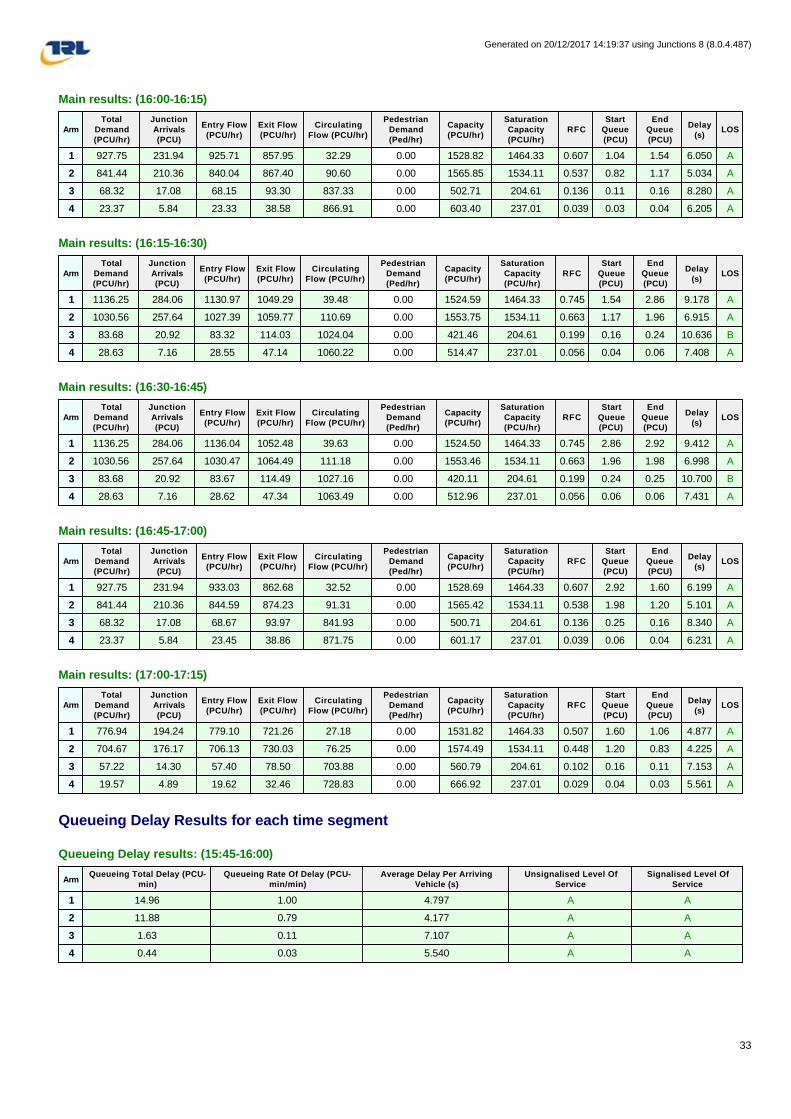
Main results: (16:00-16:15)
Main results: (16:15-16:30)
Main results: (16:30-16:45)
Main results: (16:45-17:00)
Main results: (17:00-17:15)
Queueing Delay Results for each time segment
Queueing Delay results: (15:45-16:00)
ArmTotal
Demand (PCU/hr)
Junction Arrivals (PCU)
Entry Flow (PCU/hr)
Exit Flow (PCU/hr)
Circulating Flow (PCU/hr)
Pedestrian Demand (Ped/hr)
Capacity (PCU/hr)
Saturation Capacity (PCU/hr)
RFCStart
Queue (PCU)
End Queue (PCU)
Delay (s)
LOS
1 927.75 231.94 925.71 857.95 32.29 0.00 1528.82 1464.33 0.607 1.04 1.54 6.050 A
2 841.44 210.36 840.04 867.40 90.60 0.00 1565.85 1534.11 0.537 0.82 1.17 5.034 A
3 68.32 17.08 68.15 93.30 837.33 0.00 502.71 204.61 0.136 0.11 0.16 8.280 A
4 23.37 5.84 23.33 38.58 866.91 0.00 603.40 237.01 0.039 0.03 0.04 6.205 A
ArmTotal
Demand (PCU/hr)
Junction Arrivals (PCU)
Entry Flow (PCU/hr)
Exit Flow (PCU/hr)
Circulating Flow (PCU/hr)
Pedestrian Demand (Ped/hr)
Capacity (PCU/hr)
Saturation Capacity (PCU/hr)
RFCStart
Queue (PCU)
End Queue (PCU)
Delay (s)
LOS
1 1136.25 284.06 1130.97 1049.29 39.48 0.00 1524.59 1464.33 0.745 1.54 2.86 9.178 A
2 1030.56 257.64 1027.39 1059.77 110.69 0.00 1553.75 1534.11 0.663 1.17 1.96 6.915 A
3 83.68 20.92 83.32 114.03 1024.04 0.00 421.46 204.61 0.199 0.16 0.24 10.636 B
4 28.63 7.16 28.55 47.14 1060.22 0.00 514.47 237.01 0.056 0.04 0.06 7.408 A
ArmTotal
Demand (PCU/hr)
Junction Arrivals (PCU)
Entry Flow (PCU/hr)
Exit Flow (PCU/hr)
Circulating Flow (PCU/hr)
Pedestrian Demand (Ped/hr)
Capacity (PCU/hr)
Saturation Capacity (PCU/hr)
RFCStart
Queue (PCU)
End Queue (PCU)
Delay (s)
LOS
1 1136.25 284.06 1136.04 1052.48 39.63 0.00 1524.50 1464.33 0.745 2.86 2.92 9.412 A
2 1030.56 257.64 1030.47 1064.49 111.18 0.00 1553.46 1534.11 0.663 1.96 1.98 6.998 A
3 83.68 20.92 83.67 114.49 1027.16 0.00 420.11 204.61 0.199 0.24 0.25 10.700 B
4 28.63 7.16 28.62 47.34 1063.49 0.00 512.96 237.01 0.056 0.06 0.06 7.431 A
ArmTotal
Demand (PCU/hr)
Junction Arrivals (PCU)
Entry Flow (PCU/hr)
Exit Flow (PCU/hr)
Circulating Flow (PCU/hr)
Pedestrian Demand (Ped/hr)
Capacity (PCU/hr)
Saturation Capacity (PCU/hr)
RFCStart
Queue (PCU)
End Queue (PCU)
Delay (s)
LOS
1 927.75 231.94 933.03 862.68 32.52 0.00 1528.69 1464.33 0.607 2.92 1.60 6.199 A
2 841.44 210.36 844.59 874.23 91.31 0.00 1565.42 1534.11 0.538 1.98 1.20 5.101 A
3 68.32 17.08 68.67 93.97 841.93 0.00 500.71 204.61 0.136 0.25 0.16 8.340 A
4 23.37 5.84 23.45 38.86 871.75 0.00 601.17 237.01 0.039 0.06 0.04 6.231 A
ArmTotal
Demand (PCU/hr)
Junction Arrivals (PCU)
Entry Flow (PCU/hr)
Exit Flow (PCU/hr)
Circulating Flow (PCU/hr)
Pedestrian Demand (Ped/hr)
Capacity (PCU/hr)
Saturation Capacity (PCU/hr)
RFCStart
Queue (PCU)
End Queue (PCU)
Delay (s)
LOS
1 776.94 194.24 779.10 721.26 27.18 0.00 1531.82 1464.33 0.507 1.60 1.06 4.877 A
2 704.67 176.17 706.13 730.03 76.25 0.00 1574.49 1534.11 0.448 1.20 0.83 4.225 A
3 57.22 14.30 57.40 78.50 703.88 0.00 560.79 204.61 0.102 0.16 0.11 7.153 A
4 19.57 4.89 19.62 32.46 728.83 0.00 666.92 237.01 0.029 0.04 0.03 5.561 A
ArmQueueing Total Delay (PCU-
min)Queueing Rate Of Delay (PCU-
min/min)Average Delay Per Arriving
Vehicle (s)Unsignalised Level Of
ServiceSignalised Level Of
Service
1 14.96 1.00 4.797 A A
2 11.88 0.79 4.177 A A
3 1.63 0.11 7.107 A A
4 0.44 0.03 5.540 A A
Generated on 20/12/2017 14:19:37 using Junctions 8 (8.0.4.487)
33
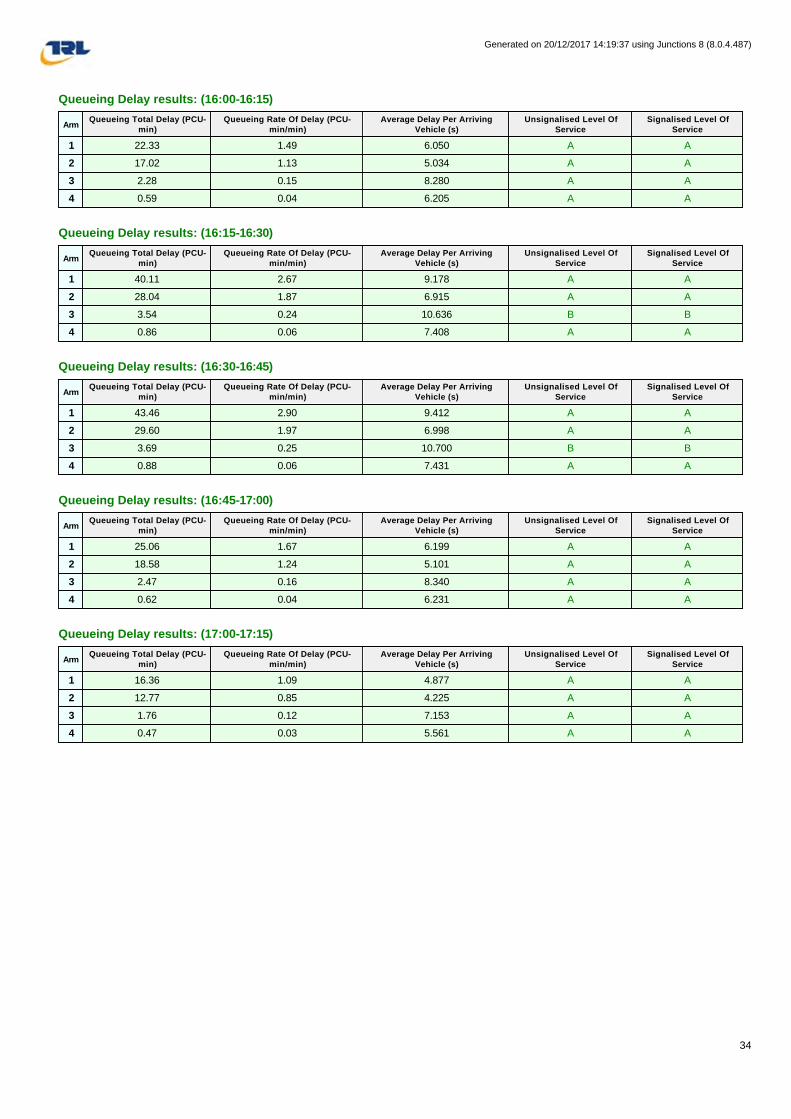
Queueing Delay results: (16:00-16:15)
Queueing Delay results: (16:15-16:30)
Queueing Delay results: (16:30-16:45)
Queueing Delay results: (16:45-17:00)
Queueing Delay results: (17:00-17:15)
ArmQueueing Total Delay (PCU-
min)Queueing Rate Of Delay (PCU-
min/min)Average Delay Per Arriving
Vehicle (s)Unsignalised Level Of
ServiceSignalised Level Of
Service
1 22.33 1.49 6.050 A A
2 17.02 1.13 5.034 A A
3 2.28 0.15 8.280 A A
4 0.59 0.04 6.205 A A
ArmQueueing Total Delay (PCU-
min)Queueing Rate Of Delay (PCU-
min/min)Average Delay Per Arriving
Vehicle (s)Unsignalised Level Of
ServiceSignalised Level Of
Service
1 40.11 2.67 9.178 A A
2 28.04 1.87 6.915 A A
3 3.54 0.24 10.636 B B
4 0.86 0.06 7.408 A A
ArmQueueing Total Delay (PCU-
min)Queueing Rate Of Delay (PCU-
min/min)Average Delay Per Arriving
Vehicle (s)Unsignalised Level Of
ServiceSignalised Level Of
Service
1 43.46 2.90 9.412 A A
2 29.60 1.97 6.998 A A
3 3.69 0.25 10.700 B B
4 0.88 0.06 7.431 A A
ArmQueueing Total Delay (PCU-
min)Queueing Rate Of Delay (PCU-
min/min)Average Delay Per Arriving
Vehicle (s)Unsignalised Level Of
ServiceSignalised Level Of
Service
1 25.06 1.67 6.199 A A
2 18.58 1.24 5.101 A A
3 2.47 0.16 8.340 A A
4 0.62 0.04 6.231 A A
ArmQueueing Total Delay (PCU-
min)Queueing Rate Of Delay (PCU-
min/min)Average Delay Per Arriving
Vehicle (s)Unsignalised Level Of
ServiceSignalised Level Of
Service
1 16.36 1.09 4.877 A A
2 12.77 0.85 4.225 A A
3 1.76 0.12 7.153 A A
4 0.47 0.03 5.561 A A
Generated on 20/12/2017 14:19:37 using Junctions 8 (8.0.4.487)
34