Embed Size (px)
Citation preview

Appendix 5.1 Summer season - Wind frequency classification
Figures in parenthesis represent frequencies

Appendix 5.2 Pmmonwrron -Wind frequency clansification
Figures in parenthesis represent frequencies

Appendix 5.3 Winter aeason - Wind frequency clsarrification
Wind Wind speed category (kmph) direction 1.8 3.6 7.2 14.4 28.8 Total
3 2 1 23 1 45 ENE (1 .a (8.5) (9.3) (0.4) (1 8.1)
13 25 5 43 NE (5.2) ( 1 0.1) (2.0) ( 1 7 v 3 )
1 18 17 3 38 lWNE (0.4) (7.3) (6.9) (1.2) 5.3)
N 15 4 19 (6.0) (1.6) (7.7)
1 34 9 NNW (0.4)
43 (13.7) (3.6) ( 1 7.3)
2 18 3 2 1 NW (0.8) (7.3) (1.2) (8.5)
WNW 1 1 (0.4) (0.4)
1 1 W (0.4) (0.41
WSW 0 (0.0) ,
SW 0 ~,- -* (0.0)
SSW 0 (0.0) 0
S (0.0) , -
SSE 0
--, (0.0)
SE 2 2 (0.8) (0.8)
1 1 10 2 13 ESE (0.4) (0.4) (4.0) (0.8) (5.2)
(0.4)
Total
Figures in parenthesis represent frequencies

Appendix-7.1 Air pollution releaaed by the industrial sector (TPA)
S.NO
1
2
3
4
5
6
7
8
9
10
1 1
I2
1 3
14
15
1 16
1 1 7
) 18 1 I Q
I 20
!I
1 22 I 1 23 I 1 24
25
26
27
Unit
SriBharathi Mill
Anglo French Textile
New Horizon Sugar Mill
Pondy metal steel
Pondicherry Distilleries Ltd
Sica Breweries
Pondicherry Paper Mill
Pondy Extraction
Chemfab chlorates
PondY chlorate
Pondy Co-op.Sugar Mill
Magna Chemicals
Golden paper mill
Guru Paper
Neycer India Ltd.
Shasun drugs and Chemicals
Aravind Chemicals
Sumangala steels
Anbu cement
Mital Is pat
Sarbathi Tuks and s1ee1
Snam Alloys(lni1-l)
Elfotech
Gomathi Steel
Larsan &Tubro
Mohan Breweries
Protchem
3 q S i h c a l
I V.S.K.ferro Alloys I ! 30 R.K.lndust
Year of commencement
I890
1898
1960
1969
1972
1975
1978
1979
1984
1984
1984
1985
1986
1986
1986
1986
1987
1987
1988
1988
1988
1988
1989
1989
1989
1989
1989
1989
1990
199 1
SPM
229.020
40.975
388.976
3.319
96.495
26.999
982.351
122.239
0.012
0.108
652.674
0,006
5 1.453
8.996
22.820
115.329
0.160
188.271
15.834
128.40
9.604
110.160
296.092
15.493
60.608
92.432
12.240
85.954
451.778
1.347
SO^
1.384
0.1 10
0.695
0.124
0.542
0.988
0.857
0.684
0.000
0.162
0.504
0.005
0.045
0,023
0.082
1.160
0.213
0.622
0.076
1.43
0.372
0.322
0.474
0.01 1
2.1 14
0.418
1.175
NO,
0.951
0.093
1.059
0.059
0.3 12
0.256
0.145
0.970
0,000
0.000
0.972
0.003
0.038
0.004
0.341
0.366
0.000
1.087
0.054
0.98
0.048
0349
0.588
0.043
1.404
0.326
0.014
0.629
1.065
0.067
0.682
0.215
0.033

Appendix : 7.1 Continued
S.No
3 1
32
33
34
35
36
37
38
39
40
4 1
42
43
44
45
46
47
48
49
I 50
51
52
53
54
1 5 5 1 56
57
. 58
Unit
Athi yappa Chemicals
Bhuneswari Chemicals
Chemfab Alkalis
Flat Products
Hindustan Lever Ltd.(Bio-Polymer),
ACE Glass container
Pondicheny Co.opt.Dairy
Vijaya Industrial Alcohal
Pondy Rolling Mill
Aurofood
Bharath Starch
Fluorides & Chemicals
J.R.Food
Rishab Intermediate
Hindustan Lever Ltd.(Detergent)
Kavery Alloys
Snam Alloys (Unil-11)
JBA Rerolled Products
Eerger Paints
K.K.Nag
KCP Paper Mill
Ashok Magnetics
Foseco
M.R.F.
Pushpit stcelr
Sar Ispat
liarathacasting
Alagu Lakshmi Industries
Year of wmmeacement
1 992
1992
1992
1992
1992
1992
1992
1992
1993
1994
1994
1994
1994
1995
1996
1996
1996
1996
1997
1997
1997
1998
1998
1998
1998
1998
1998
1999
SPM
17.765
76.058
0.019
8.265
12.501
113.476
27.222
92.023
7.01 1
63.498
1 1 1.392
3.944
56.58
6.122
463.360
14.958
68.800
42.724
8.441
57.022
95.687
17.553
l116
37.659
138.556
41.118
15.3 16
23.595
SOz
2.531
0.108
0.003
0.336
0.278
3.174
1.162
0.222
0.642
0.890
1.770
0.030
1.971
0.085
3.621
0.082
0.841
2.530
0.569
0.792
1.092
1.530
0.119
1.118
0.061
0.242
0.060
0.000
NO,
0.052
0.081
0,001
0,057
0.013
1.478
0.190
0.243
0.047
0.493
0.778
0.014
0.9735
0.033
0.366
0,038
0.249
0.225
0.026
0,015
0.405
1.120
0.187
0.214
0.020
0.319
0.034
0.000

Appendix : 7.1 Continued
S,No
59
60
61
62
63
64
Unit
J.B.A.Stee1
Sri Raj Steels
AKS Alloys
R.K.lndustries
Raja Ganapathy Board Mill
Narmadha Chemicals
Year of commencement
1999
1999
2000
200 1
2002
2002
SPM
57.222
8.262
17.722
28.276
12.622
8.240
SOt
0.386
0.000
0.000
0.637
0.020
0.017
NO,
0.024
0.000
0.000
0.478
0.016
0.013

Appendix 7.2 Annual Water pollution load discharged by the industries
$.No
1
2
3
4
5
6
7
8
9
10
I I
12
13
14
I5
16
17
18
19
20
2 I
22
23
24
25
26
27
28
-. 29
Nameofthe unit
Sri Bharathi Mill
Anglo French Textile
New Horizon Sugar Mills
Pondichcny Co-0pt.Dair-y
Pondicherry Distilleries
Sica Breweries
Hi-design
Pondicheny Paper Mill
Venkatesware, Om
lndofrench Polymers
General Optics
Pondy Agro
Vedha Chemicals,
Pondy Co.op.Sugar,
Hindustan Lever Ltd.(PP)
Magna Chemicals,
Golden Paper
Guru Paper
Pentagon Inorganics
McDowell
Sarbathi
Transmedica
L&l',
Pentafour
Balaji Detergent
Sunfab
Chemfab Alkalies, OM
HLL(BIO),
Mohan Breweries
Year of commencement
1890
1898
1960
1971
1972
1975
1977
I978
198 1
1983
1984
1984
1984
1984
1985
1985
1986
1986
1986
1088
1988
1988
1989
1989
199 1
1991
1 992
1992
1992
TSS
6.833
5.037
44.700
0,109
23.01
7.181
0.019
115.087
0.060
0,008
0.004
0.061
1.360
41.328
0.248
0.336
3.135
2.932
0.008
0.01 7
0.055
0.126
0.086
0.006
0.082
0.018
0,746
23.00
1.672
BOD
12.13 1
9.505
608.580
0.330
177.45
4.541
0.020
124.113
0.032
0.010
0.006
0.501
0.144
151.872
0.144
3.000
6.750
2.705
0.000
0.017
0.056
0.048
0,034
0.002
0.102
0.040
0.000
138.60
0.163
COD
30.394
24.774
1128.456
0.766
479.56
18.234
0.065
511.346
0.1 IS
0.058
0.035
0.808
0.433
510.288
0.396
8.994
13.914
7.267
0.000
0.076
0.135
0.180
0.1 10
0.016
0.312
0.070
0.157
235.20
0.640
O&G
2.685
7.005
12.480
0.020
2.69
1.658
0.002
5.642
0.104
0.002
0.001
0.020
0.091
7.219
0.023
0.048
2.445
0.368
0.008
0.003
0.008
0.024
0.018
0.003
0.018
0.003
0.037
0.86
0.693

Appendix : 73 Continued
6No
30
31
32
33
34
35
36
37
38
39
40
4 1
42
43
44
45
I 46
47
38
49
50
5 1
1 52 I 51
/ 54 1
5 5
' 56
1 57
1 58 / 59
! 60
Name of the unit
OBL
OmkarFineChcmicals
Pondy Flour Mill
Protchem Industries
Shasun Chemicals & Drugs
Shbi capsules
Vijaya Industrial Alcoho
Whirlpool
Navrang India
Tex care
Aurofood,MCP
Bharath Starch
Enteeys Papers Board
Hindustan Motors
Johar Cosmetic
Auronindo Hand Made Paper
Caplin point
Gyan Leather
14ydraulic
Lucas TVS
Pondy Personal Care
Kane Madras
Rishab Intermediate
Sundrarn Fer~ner
Winner Dairq
Hindustan Lever Ltd.(Det)
J . K . F d
New India Palmer Products
Rush Avt
Sical
UCAL ~olymcrs
BOD
0.035
0.068
0.495
131.565
6.907
0,090
17 1.146
0.380
0.020
0.002
0.308
0.033
0.204
0.023
0.146
0.023
0.008
0.032
0.145
0.023
0.392
0.005
0.002
0.030
0.044
0.189
0.390
0.012
0.21 6
0.041
0.014
Yarof
1992
1 992
1992
1 992
1992
1992
1992
1992
1993
1993
1994
1994
1994
1994
1994
1995
1995
1995
1995
1995
1995
1995
1995
1995
1 995
1996
1996
I W 6
1996
1996
1 096
TSS
0.552
0,083
0.602
3.255
1.166
0.017
144.3 15
0.657
0.005
0.003
0.336
0.033
0.104
0.089
0.076
0.006
0.017
0.040
0.032
0.003
0.019
0.013
0 003
0.036
0.049
0.110
5.041
0.002
0.235
0.060
0.058
COD
0.107
0.516
1.142
140.073
38.749
0.136
400.670
0.893
0.168
0.005
1.176
0.108
0.431
0.152
0.347
0.038
0.043
0.074
0.304
0.029
O&G
0.008
0.01 1
0.053
1.182
0.238
0.024
4.523
0.148
0.001
0.001
0.158
0.004
0.017
0.014
0.065
0.000
0.003
0.004
0.019
0,003
0.664 1 0.017
0.012
0.005
0.084
0.124
0.446
23.556
0.022
0.594
0.1 13
0.017
0.003
0.002
0.027
0.005
0.031
2.048
0.001
0.022
0.014
0.010
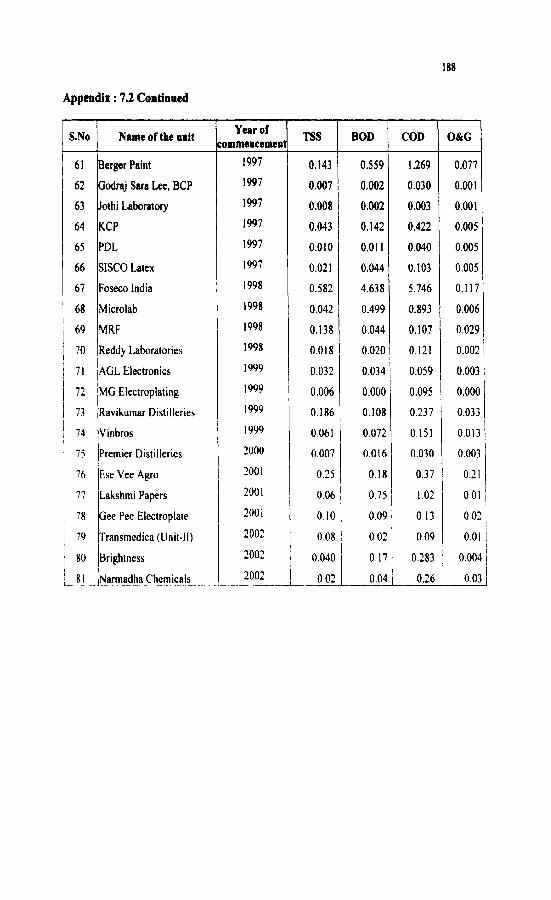
Appendix : 7.2 Continued
S.NO
6 1
62
63
64
65
66
67
68
69
70
7 1
72
73
1 74
75
76
' 77
, 78 I
79 1 I
80
8 l --
TSS
0.143
0.007
0.008
0.043
0.010
0.021
0.582
0.042
0.138
0.018
0.032
0.006
0.186
0.061
0.007
0.25
0.06
0.10
0.08
0.040
0.02
Name of the unit
Berger Paint
Godraj Sara Lee, BCP
Jothi Laboratory
KCP
PDL
SlSCO Latex
Foseco India
Microlab
MRF
Reddy Laboratories
AGL Electronics
MG Electroplating
Ravikurnar Distilleries
Vinbros
Premier Distilleries
Ese Vre Agro
Lakshmi Papers
Gee Pee Electroplate
Transmedicrt (Unit-11)
Brigh~ness
INarmadha Chemicals
Year COmmenc emen
1997
1!997
1997
1997
1997
1997
1998
1998
1998
1998
1999
1999
1999
1 999
2000
200 1
200 1
200 1
2002
2002
2002
OLG
0.077
0.001
0.001
0.005
0.005
0.005
0.1 17
0.006
0.029
0.002
0.003
0.000
0.033
0.013
0.003
0.21
0.01
0.02
0.01
0.004
0.03
BOD
0.559
0.002
0.002
0.142
0.01 1
0.044
4.638
0.499
0.044
0.020
0.034
0.000
0.108
0.072
0.016
0.18
0.75
0.09
0.02
0.17
0.04
COD
1.269
0,030
0.003
0.422
0.040
0.103
5.746
0.893
0.107
0.121
0.059
0.095
0.237
0.151
0.030
0.37
1.02
0.13
0.09
0.283
0.26

Appendix: 7.3 Projected Annual SPM Load (TPA)
Year commencemen
1960
1969
1972
1975
1978
1979
1984
1985
1986
1987
1988
1989
1990
1991
1992
1993
1 994
1995
1 996
1997
1 998
1 999
2000
200 1
2002
Actual Laad
659.0
662.3
758.8
785.8
1768.1
1890.4
2543.2
2543.2
274 1.8
2930.2
3 105.9
3668.8
4 120.5
4121.9
4469.2
4476.2
471 1.6
47 17.8
5315.1
5476.3
5721.1
58 10.2
5827.9
5856.2
5868.8
Projected Lad (BAU)
Projection without ~ ~ u t i o n potential
induetries (ESI)

Appendix: 7.3 Continued
of commencemen
2003
2004
2005
2006
2007
2008
2009
201 0
201 1
2012
2013
20 14
20 15
20 16
201 7
2018
20 19
2020
Pmjeet* Load (IBAU)
5978.0
6087.2
6 1 96.4
6305.6
64 14.8
6524.0
663 3.2
6742.5
685 1.7
6960.9
7070.1
7 179.3
7288.5
7397.7
7506.9
7616.1
7725.3
7834.6
Actual Load Projection withont pollution potential
industries (ESX)
5946.3
6023.9
6101.4
6 178.9
6256.5
6334.0
641 1.5
6489.1
6566.6
6644.2
672 1.7
6799.2
6876.8
6954.3
703 1.9
7 109.4
7 186.9
7264.5
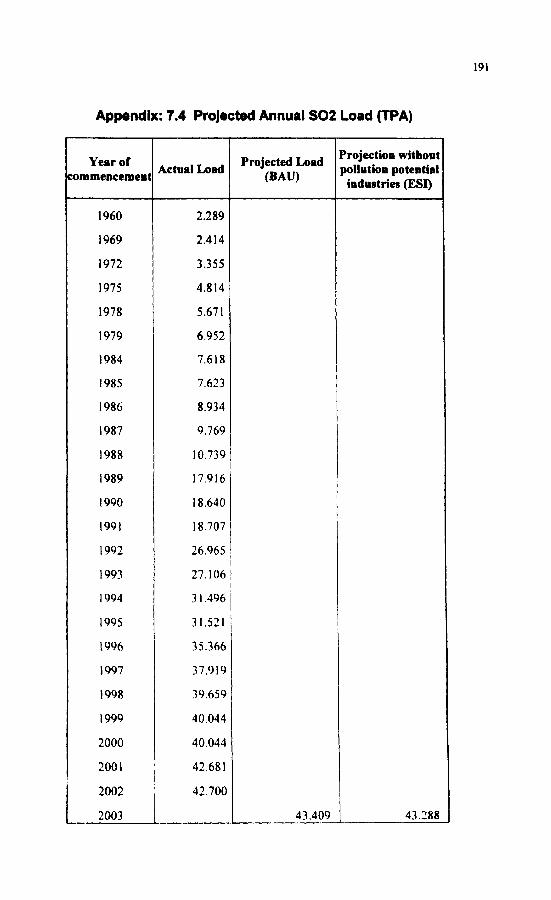
Appendix: 7.4 Projected Annual SO2 Load (TPA)

Appendix: 7.4 Continued
Year of commencement
2004
2005
2006
2007
2008
2009
201 0
201 1
201 2
201 3
20 14
2015
201 6
201 7
2018
2019
2020
Actual Lold P*jected Load (BAU)
44.1 18
44.826
45.535
46.243
46.952
47.661
48369
49.078
49.786
50.495
5 1 204
51.912
52.62 1
53.329
54.038
54.747
55.456
Projection without po~~ution potential
industries (ESI)
43 377
44.465
45.053
45.64 1
46.229
46.8 17
47.405
47.994
48.582
49.170
49.758
50.346
50.934
5 1.522
52.1 1 1
52.699
53.288

Appendix: 7.5 Projected Annual NOx Load (TPA)

Appendix: 7.5 Continued
Year of commencement
2004
2005
2006
2007
2008
2009
2010
201 1
2012
2013
2014
201 5
201 6
2017
2018
2019
2020
Actual Load 'lojated Load (BAU)
2 1.072
2 1.780
22.487
23.195
23.903
24.610
25.318
26.026
26.734
27.441
28.149
28.857
29.564
30.272
30.980
3 1.687
32.395
Projection witbout po~~rtion potentia
industria (ESI)
20.506
20.930
21.355
2 1.780
22.204
22.629
23.053
23.478
23.903
24.327
24.752
25.177
25.601
26.026
26.450
26.875
27.300

Year of commencement
1960 197 1
1972 1975 1977
1978 198 1
1983
1984
1985
1986
1988
Appendix: 7.6 Projected Annual TSS Load (TPA)

Appendix: 7.6 Contlnwd
Year of commencement
201 1
201 2 2013 2014 2015
20 16 2017 201 8 20 19 2020
Actual Lord
Projected Load (BAU)
489.34
497.80 506.27 5 14.74
523.20 53 1.67
540.14
548.60
557.07 565.54
Projection witbout pollution potential industries (ESI)
420.76 42 1.60 422.45
423.30 424.14
424.99 425.84
426.68 427.53
428.38

197
Appondlx:l.? ProJected Annual BOD Load (TPA)
Year of commencement
1960
1971
1972
1975
1977
1978
1981
1983
1984
1985
1986
1988
1989
1990
199 1
1992
1993
1994
1995
1996
1997
1998
1999
2000
200 1
2002
2003
2004
Actual Load
630.22
630.55
808.00
81 2.54
81 2.56
936.67
936.70
936.7 1
1089.23
1092.38
1 108.74
1 108.86
1240.62
1379.22
1379.37
1551.58
155 1.60
1552.3 1
1553.01
1553.88
1377.19
1 382.39
1382.60
1382.62
1383.65
1383.88
Projected Load
1404.18
1424.48
Projection without pollution potential industries (ESI)
1384.70
1385.5 1

Appendix: 7.7 Continued
Year of commencement
2005
2006
2007
2008
2009
2010
201 1
201 2
2013
2014
201 5
2016
201 7
201 8
2019
2020
Projected Load (BAU)
1444.78
1465.08
1485.38
1 505.68
1525.98
1546.28
1566.58
1586.88
1607.18
1627.48
1647.78
1668.08
1688.38
1708.68
1728.98
1749.28
Actual Load
Projection without pollution potenfial industries (ESI)
1386.32
1387.13
1387.94
1388.76
1389.57
139038
1391.19
1392.00
1392.82
1393.63
1394.44
1 395.25
1396.06
1396.88
1397.69
1398.50

Appendix:7.8 Projected Annual COD Load (TPA)

Appendix: 7.8 Continued
Year Of
commencement
200 1
2002
2003
2004
2005
2006
2007
2008
2009
2010
201 1
2012
20 13
2014
20 15
20 16
2017
2018
2019
2020
(BAU)
3 170.26
3225.00
3279.74
3334.48
3389.21
3443.95
3498.69
3553.43
3608.17
3662.90
371 7.64
3772.38
3827.12
3881.116
3936.59
3991 -33
4036.07
4100.81
Actual Load
31 14.89
3 1 15.52
Projection without pollution potential
industries (ESI)
31 18.81
3 122.09
3 125.38
3 128.66
3131.95
3 135.23
3138.51
3141.80
3 145.08
3 148.37
3 15 1.65
3 154.94
3 158.22
3161.50
3 164.79
3 168.07
3171.36
3 174.64

Appendix: 7.9 Projected Annual 011& Grease Load (TPA)

Appendix: 7.9 Continued
Year of commencement
2002
2003
2004
2005
2006
2007
2008
2009
20 10
201 1
20 12
2013
20 14
201 5
2016
201 7
201 8
2019
2020
(BAU)
5 1.43
52.14
52.85
53.56
54.27
54.98
5 5 -69
56.40
57.1 1
57.82
58.53
59.24
59.95
60.67
61.38
Actual Load
50.72
projection without the 6 major pollutiog
induntries (EST)
50.99
5 1.25
51.51
5 1.77
5 2.04
52.30
52.56
52.83
53.09
53.35
53.61
53.88
54.14
54.40
54.66
62.09 1 54.93
62.80
63.51
55.19
55.45

Appendix: 7.10 Projected Annual Ground water consumption (KLA)

Appendix: 7.1 0 Continued
commencement
2006
2007
2008
2009
2010
201 1
20 12
2013
20 14
201 5
2016
2017
2018
2019
2020
Projected JJoad (BAU)
5651 105.8
5833768.8
601643 1.8
6 199094.8
6381757.8
6564420.8
6747083.8
6929746.8
7 1 12409.8
7295072.8
7477735.8
7660398.8
7843061.8
8025724.8
8208387.8
Actual conmamption
Projection without **kr ,,- i,,du*,.ia
(ESI)
5212714.6
5285779.8
5358845.0
5431910.2
5504975.4
5578040.6
565 1 105.8
5724171 .O
5797236.2
5 87030 1 -4
5943366.6
6016431.8
6089497.0
6 162562.2
6235627.4