Embed Size (px)
Citation preview

APPENDIX M
Draft Coordination Act Report

This Page Intentionally Left Blank.


1
Colonel Charles H. Klinge Jr., P.E. Commander, Fort Worth District, US Army Corps of Engineers Fort Worth, TX U.S. Army Corps of Engineers (Attn: Marcia Hackett, CESWF-PER-EC) P.O. Box 17300 Fort Worth, Texas 76102-0300 Dear Colonel Klinge: This letter constitutes the Secretary of the Interior’s report on the Dallas Floodway Project. It is submitted by the U.S. Fish and Wildlife Service (Service) to the U.S. Army Corps of Engineers (Corps) under the authority, and in accordance with, Section 2(b) of the Fish and Wildlife Coordination Act (FWCA) (48 Stat. 401, as amended; 16 U.S.C. 661 et seq.) to accompany the Corps’ final Detailed Project Report. The study was initiated by the Corps under authority of Section 205 of the 1948 Flood Control Act, as amended, to identify potential alternatives to reduce flood damage within the Trinity River watershed within the City of Dallas, Dallas County, Texas. Our report has been coordinated with the Texas Parks and Wildlife Department (TPWD). The purpose of this report is to identify and evaluate anticipated impacts of implementing the proposed project on fish and wildlife resources in the project area within the Trinity River watershed and to recommend conservation measures for resource protection. This report is based on data collected during field investigations conducted by the Service, TPWD, and Corps on August 30 – September 1, 2004; October 12 – 14, 2005; April 25, 2006; coordination with environmental consultants representing Cardno TEC, Inc.; information received from the Corps and the project sponsor, the City of Dallas; and review comments from TPWD. A planning aid report has previously been submitted to the Corps regarding the existing environmental conditions within the project area in November 2010 (USFWS 2010). 1. STUDY AREA An environmental study area was delineated cooperatively by the Corps and the Service. Spatial data provided by the Corps indicate that the study area encompasses approximately 17,141.97 acres located within the City of Dallas, Dallas County, Texas within the Trinity River Basin. The term “Region of Influence,” coined by the Corps, is synonymous with the term “study area.” For consistency, “study area” will be used throughout this report.
The existing Dallas Floodway Levee System, authorized in 1945, extends along the Trinity River upstream from the Atchison, Topeka and Santa Fe (AT&SF) Railroad Bridge at Trinity River Mile (RM) 497.37, to the confluence of the West and Elm Forks at RM 505.50, thence upstream along the West Fork for approximately 2.2 miles and upstream along the Elm Fork approximately 4 miles. Of the 22.6 miles of levees within this reach, the East Levee is 11.7 miles
2
in length and the West Levee is 10.9 miles in length. In addition to the levees, the floodway includes a modified river channel, and structures including seven pumping plants, five pressure conduits, and seven drainage structures. Construction of the existing Dallas Floodway Levee System was completed in 1959. The Dallas Floodway Project study area assessed within this document lies within the existing project boundaries and generally follows the Federal Emergency Management Agency 500-year flood extent.
2. PLAN OF DEVELOPMENT Since the early 1900s, the City of Dallas has been periodically flooded and incurred damages. These flood events present the potential for significant and repetitive economic losses in the study area. A variety of previous studies, reports, and water projects have been conducted regarding flooding and various water resources related to the Dallas Floodway System. A selection of these activities led by the Corps and non-Federal entities including the City of Dallas are described below. 2.1 Historic Dallas Floodway Development A catastrophic flood in 1908 led the City of Dallas to seek protection from Trinity River flooding. Between 1928 and 1932, the Dallas County Levee Improvement District (DCLID) constructed earthen levees to protect the City of Dallas from riverine flooding. The DCLID relocated the confluence of the West and Elm Forks, rerouted the Trinity River by constructing a channel within the leveed floodway, and filled or set aside the original channel for sump storage. These original levees had a total length of 22.6 miles, an average crest width of 6 feet, an average height of 26 feet, and a maximum height of 37 feet (USACE 1955). 2.2 U. S. Army Corps of Engineers To reduce the riverine flood risk within the City of Dallas, Congress authorized the flood control project (commonly referred to as the Dallas Floodway, or the Dallas Floodway Levee System) in 1945, and again in 1950. From August 1952 to June 1955, the Corps produced six reports for design of the Dallas Floodway improvements to the original (DCLID) levees and interior drainage facilities. In May 1960, the non-Federal sponsor for the Dallas Floodway Levee System, the Dallas County Flood Control District (DCFCD) formally accepted the Corps Operation and Maintenance (O&M) Manual for the Dallas Floodway Levee System (USACE 1960). The purpose of the O&M Manual was to furnish detailed information regarding the Dallas Floodway Levee System and its essential features, and to aid local interests in carrying out their obligation under the regulations governing acceptance of a completed project constructed by the Corps. The DCFCD formally transferred O&M responsibilities to the City of Dallas in 1968.

3
In compliance with the National Environmental Policy Act (NEPA), the Trinity River and Tributaries Regional Environmental Impact Statement (TREIS) was prepared by the Corps Fort Worth District to address the proposed increases in floodplain development occurring in the upper Trinity River basin during the Dallas-Fort Worth Metroplex development boom in the mid-1980s (USACE 1988a). Individually or cumulatively, future projects are expected to have the potential to increase flood risk to existing floodplain developments. The Record of Decision (ROD) prepared for the TREIS specified criteria that the Corps would use to evaluate future Section 404 permit applications in the Trinity River Basin; specifically, projects located within the Standard Project Flood (SPF) floodplain of the Elm Fork Trinity River, the West Fork Trinity River, and the main stem of the Trinity River. The TREIS ROD established criteria for actions that require a USACE permit to address hydrologic and hydraulic impacts and mitigation of habitat losses (USACE 1988a). The findings in the TREIS provided the impetus for follow-on studies under the 1988 Upper Trinity River Study Authority (USACE 1988b). In response to the TREIS and ROD, cities and counties in the Trinity River watershed formed the Trinity River Steering Committee (Steering Committee), facilitated by the North Central Texas Council of Governments (NCTCOG). The Steering Committee adopted a Draft Statement of Principles for Common Permit Criteria (in January 1988), a Resolution for a Joint Trinity River Corridor Development Certificate (CDC) Process (in December 1988), and a Regional Policy Position on the Trinity River Corridor (in January 1989). The CDC and the 1988 ROD hydrologic and hydraulic criteria are used to ensure that projects are designed in such a way that there are no flood rises in the water surface profile and that there are no valley storage losses for the 100-year flood and less than 5% valley storage loss for the SPF event. The process requires that a permit applicant prepare a Hydraulic Engineering Center River Analysis System (HEC-RAS) hydraulic model for the proposed project using the current CDC HEC-RAS model as a base condition. The CDC HEC-RAS model was developed to model the hydraulics of water flow through rivers and other channels. It is maintained and usually distributed by the Corps to be used for evaluation of any and all projects that require a Section 404 Permit or a CDC Permit. The Corps initiated the Upper Trinity River Feasibility Study (UTRFS) in response to the authority contained in the U.S. Committee on Environment and Public Works Resolution dated April 22, 1988 and the findings of the 1990 Upper Trinity River Basin Reconnaissance Report. The UTRFS identified approximately 90 potential projects addressing flood risk management, ecosystem restoration, and recreation within the Upper Trinity River Basin (USACE 1988b). Of these 90 projects, three Corps projects were identified that had local sponsorship and were viewed as reasonably foreseeable, including modifications to the Dallas Floodway Project.

4
Initiated in 1996, the Upper Trinity River Basin Programmatic EIS (UTRB PEIS) focused on various potential Corps projects that were identified and investigated as part of the UTRFS. The Corps initiated the study under the 1988 authority. The Dallas Floodway Extension (DFE) Project, authorized by the Flood Control Act of 1965, was initiated in December 2001 to construct the Chain of Wetlands, the Cadillac Heights and Lamar Levees, and recreation features immediately downstream of the existing Dallas Floodway Levee System (USACE 2003). The Corps performed Period Inspection (PI) No. 9 (PI No. 9) using a new inspection template on December 3-5, 2007 (USACE 2009). This inspection was the 9th PI for the East Levee and West Levee, and the first PI for both the Rochester Park Levee and the Central Wastewater Treatment Plant (CWWTP) Levee systems which are components of the DFE Project. All eight prior PIs resulted in an acceptable rating for the Dallas Floodway Levee System. Very specific language and rating criteria described in the new inspection template resulted in an “unacceptable rating” for the Dallas Floodway Levee System meaning that it would not contain a Standard Project Flood. FEMA subsequently de-accredited the Dallas Floodway and began the process of redrawing a new 100-year floodplain map for the City for its National Flood Insurance Program.
2.3 City of Dallas
The approximate 2.8 mile Rochester Park Levee was constructed by the City of Dallas in 1991. The City of Dallas has since maintained the levee as part of their overall project operation and maintenance program. The Rochester Levee protects residential and commercial interests in East Dallas. The approximate 2.6 mile CWWTP Levee was constructed by the City of Dallas in the 1940s and the levee was raised and improved by the City in 1994. The CWWTP Levee protects critical utility infrastructure in South Dallas. At the direction of Congress, these two levee systems were added to the DFE project in 1996. Beginning in the late 1990s and continuing through 2000, the City of Dallas has made improvements to the Trinity River channel, levees, and interior drainage system. These improvements included widening portions of the existing river channel and increasing the height of some portions of the levees to two feet above the 1950s design elevation. 2.3.1 Balanced Vision Plan As a result of floods in 1989 and 1990, the City of Dallas stated its interest in revitalizing a number of projects to restore and expand the level of protection along the Trinity River within the City of Dallas limits. In 1994, the City of Dallas (in conjunction with regional stakeholders) began looking at ways to outline a long-range vision for the entire Trinity River Corridor: to reclaim the Trinity River as a great natural resource, create a great public domain, and achieve a

5
model of environmental stewardship. In the subsequent years of planning and community input, the City of Dallas and stakeholders developed concepts for addressing five key issues:
1. Flood Risk Management (FRM) 2. Environmental Restoration and Management 3. Parks and Recreation 4. Transportation 5. Community and Economic Development
In 2004, the outcome of this effort cumulated in an update to the 2003 report. The Balanced Vision Plan (BVP) contains the FRM features and the ecosystem restoration and recreation features defined in the report prepared by the City of Dallas entitled, The Balanced Vision Plan (BVP) for the Trinity River Corridor, Dallas, Texas, dated December 2003, and amended in March 2004 as summarized in Table 2-1. Table 2-1 Summary of Balanced Vision Plan Elements Category Descriptive Action
BVP Flood Risk Management Levees Raise to 277,000 cfs Flood Height
AT&SF Railroad Bridge Removal of Wood Bridge Segment Removal of Concrete Bridge Segment Removal of Embankment Segments
Levee Flattening Flattening the Riverside Levee Side Slopes to 4:1
Non-structural Flood Control Improvements
Emergency Response Public Awareness/Education Flood Forecasting Warning Systems
BVP Ecosystem and Recreation
Lakes West Dallas Lake Urban Lake Natural Lake
River Realignment and Modification
Wetlands
Marshlands Hampton and Biofiltration Wetlands Cypress Ponds Corinth Wetlands
Athletic Facilities Potential Flex Fields Playgrounds River Access Points
General Features Parking and Public Roads Lighting

6
Category Descriptive Action Vehicular Access Pedestrian Amenities Restrooms
Interior Drainage Outfall Modifications
Pump Station Outfalls Pressure Sewer Outfalls
Able Sump Ponds Recreation and Ecosystem Enhancements The BVP FRM component includes levee raises to provide flood risk management for the 277,000 cubic feet per second (cfs) riverine flood event. Features also include flattening the levee side slopes, removing an embankment, modifying the AT&SF Railroad Bridge, and non-structural public education and flood warning systems. BVP Ecosystem Restoration and Recreation Enhancements include the development of three lakes, modification to the course of the Trinity River, construction of approximately 152 acres of new wetlands, construction of 115 acres of groomed athletic fields, and general elements to improve safety and access to the larger BVP elements. On March 9, 2005, the Dallas City Council adopted the Trinity River Corridor Comprehensive Land Use Plan (TRCCLUP) as a tool for guiding development and investment decisions in the Trinity River Corridor (TRC). In this way, the TRCCLUP guides zoning decisions relating to potential future private development towards land uses that complement identified public BVP elements. Stormwater flooding events have demonstrated that improvements are needed to the East and West Levee Interior Drainage Systems (EWLIDS) to reduce the risk of interior flooding. In March 2006, the need for improving the EWLIDS was demonstrated when a significant local storm caused widespread stormwater flooding in the City of Dallas, resulting in one fatality and significant property damage. 2.3.2 Interior Drainage Plan The Interior Drainage Plan (IDP) consists of proposed improvements to the existing EWLIDS. The objective of the IDP improvements is to provide stormwater FRM for areas served by the EWLIDS from the 100-year storm event. Implementation of the IDP would reduce the stormwater flood risk for structures located with the predicted flood area. The threat of interior flooding within the EWLIDS remains a concern in light of stormwater flooding events including the aforementioned loss of life and substantial property damage during a March 2006 flooding event. Police and Fire-Rescue responded to hundreds of emergency calls

7
from stranded residents and motorists during this storm as well. Upgrading of existing individual pump stations and associated sump areas within the floodway has been an ongoing effort of the City of Dallas in recent years. Ongoing IDP projects include improvements to the Pavaho Pump Station which have been completed and improvements to the Baker and Able Pump Stations are in design or underway. Other proposed IDP projects are depicted in Table 2-2. Table 2-2. Proposed Interior Drainage Plan Improvements Category Descriptive Action
Interior Drainage Plan
East Levee
Demolish Old Hampton Pump Station Construct New Hampton Pump Station Nobles Branch Sump Improvements East Levee Sump Improvements
West Levee
Demolish Charlie Pump Station Construct New Charlie Pump Station Rehabilitate Existing Delta Pump Station Construct New Delta Pumping Station Eagle Ford and Trinity-Portland Sump Improvements Construct New Trinity-Portland Pumping Plant
2.4 Local Features - Section 408 Projects Projects referred to as Local Features are proposed additions or modifications to features within the Dallas Floodway, submitted by the Corps, and require Section 408 review. While Local Features are not part of the Recommended Plan for Dallas Floodway, their implementation does represent a modification to an existing Federal project. As such, these Local Features will be considered as part of the Comprehensive Analysis for Dallas Floodway along with the BVP and IDP features. Local features to be evaluated in the Comprehensive Analysis include the Trinity Parkway, Trinity River Standing Wave, the Santa Fe Trestle Trail, the Pavaho Wetlands, the Dallas Horseshoe Project, the Sylvan Avenue Bridge, Jefferson Bridge, Dallas Water Utilities (DWU) Waterlines, Continental Bridge, the East Bank/West Bank Interceptor Line, and IDP-Phase II pump stations (Charlie, Delta, Pavaho, and Trinity/Portland). 2.5 Trinity Parkway The Trinity Parkway is a proposed toll road that would span approximately 9 miles from the juncture of State Highway 183 and Interstate Highway 35E to US-175/Spur 310. Several route alternatives are being reviewed by the Federal Highway Administration under a separate Environmental Impact Statement (EIS) independent of the Dallas Floodway Project. Because it
8
has the potential to significantly affect the Dallas Floodway Project, it is being considered as part of the Comprehensive Analysis for Dallas Floodway as a Local Feature (USACE 2014). The EIS being prepared by the USACE for the Trinity Parkway includes alternatives placing its construction within and outside the Dallas Floodway Levee System. As part of the Dallas Floodway Comprehensive Analysis, the Trinity Parkway alternative(s) that are within the Dallas Floodway Levee System are being evaluated to determine if they would be hydraulically, geotechnically, and structurally sound. Because, depending on which alternative is selected, the potential construction of this feature could have significant impacts on the BVP FRM and BVP Ecosystem and Recreation features. The implementation guidance for Section 5141 authorization mandated that the comprehensive analyses include both a With and Without Trinity Parkway alternative analyses. The City of Dallas has preliminarily designed two different BVP alternatives to accommodate either scenario. The With Parkway alternative assumes the chosen alignment of the Trinity Parkway will be within the Dallas Floodway Levee System and constructed as a local feature. This alternative includes modifications to the BVP Ecosystem and Recreation features to accommodate the inclusion of the Trinity Parkway within the Dallas Levee System. The Without Parkway alternative assumes Trinity Parkway is not constructed within the contexts of this evaluation or that the recommended alternative selected is one that is located outside of the Dallas Floodway Levee System and would have no bearing on the BVP Ecosystem and Recreation features (USACE 2014). Preliminary designs of the Trinity Parkway are at less than a 35% submittal and show the proposed tollway extending along the face of the East Levee for approximately 5.3 miles, starting at the far downstream end of the Dallas Floodway Levee System at the AT&SF Railroad Bridge before exiting the Floodway just east of the Hampton Pump Station. As proposed, the Trinity Parkway would be built through a combination of elevated earthen berms and bridge structures. The berms and bridges would support six lanes of traffic, three in each direction. Exit and entrance ramps and bridges would be built as needed to merge with existing roadways crossing the Levee System. The earthen berm, built on the face of the East Levee, ranges in height from within a few feet of the top of the levee to an elevation of a few feet above the existing toe of the levee. This fluctuates from upstream to downstream depending on the constraints of bridges and other features within the Dallas Floodway. The Trinity Parkway and its earthen berm are separated from the remainder of the Floodway by a flood separation wall, designed for the 100-year recurrence interval flood event. Supporting the Trinity Parkway and its operation and maintenance goals is a network of access roads that are on the interior of the levee system and on the levee crest (USACE 2014). 3. FISH AND WILDLIFE RESOURCES WITHOUT THE PROJECT Sites were selected in an effort to document biotic communities in the study area. Two general assessment tools were selected for aquatic and terrestrial habitats: TPWD’s Index of Biotic
9
Integrity (IBI) for assessing aquatic life use within a given waterbody and Service’s habitat evaluation procedure (HEP). 3.1 Terrestrial Resources The pre-development landscape of the study area was likely predominantly tall grass prairie with trees along watercourses, sometimes scattered on the prairie or concentrated in certain areas possibly as a result of locally favorable soil conditions or topography. Trees along the mainstem of the Trinity would have been those species tolerant to frequent flooding with additional species less tolerant of flooding found along inflows to the river. With the exception of preserves, small remnants, or native hay meadows, almost nothing remains of the original Blackland Prairie communities (Diggs et al., 1999). Conversion of the Blackland Prairie for agriculture was the most significant cause of the destruction of this ecosystem, with only marginal, steeply sloped land not rapidly brought under cultivation. Once stripped of protective grass, these areas eroded rapidly with disastrous effects. Given the relatively high rainfall and continuing suppression of fire by humans, native trees and shrubs (e.g. eastern red cedar (Juniperus virginiana) and cedar elm (Ulmus crassifoliia), as well as introduced species are able to invade and eventually take over areas that were formerly prairie (Diggs et al., 1999). The study area was further divided into three evaluation groups: the Confluence, Interior Drainage System (IDS), and Mainstem. Each of these areas is expected to be impacted in different ways by the project and was independently analyzed for habitat suitability in order to assess possible differences in their existing conditions. Existing habitat conditions across these groupings also vary due to differences in topography and past impacts. This targeted approach is intended to better illustrate the likely impact of project alternatives on habitat values within these differing reaches. Three terrestrial habitat types were evaluated using the Service’s Habitat Evaluation Procedures (HEP); grassland (4,283.57 acres), bottomland hardwood (1,412.63 acres), and emergent wetland (418.58 acres). A majority (70.05%) of terrestrial habitat in the study area is classified as grassland, much of it managed through mowing and other means. Bottomland hardwood habitats in the study area are largely concentrated upstream with in the Elm Fork and West Fork reaches. Emergent wetlands are scattered throughout but generally concentrated along the mainstem within the downstream two-thirds of the study area. HEP requires the use of Habitat Suitability Index (HSI) models developed for indicator species that best represent groups of species that use existing habitat types. Baseline terrestrial habitat conditions are expressed as a numeric function (HSI value) ranging from 0.0 to 1.0, where 0.0 represents no suitable habitat for an indicator species and 1.0 represents optimum conditions for the species. HSI values ranging from 0.99 to 0.75 represents “good” habitat. HSI values ranging from 0.74 to 0.50 represent habitats considered “average.” HSI values ranging from 0.49 to 0.25 represent habitats considered “below average.” HSI values ranging from 0.24 to 0.01 represent

10
habitats considered “poor.” Habitat Units (HU) are calculated by multiplying the numeric HSI values by the amount of acres of habitat available. The biologist team collected field data on August 30 – September 1, 2004; October 12 – 14, 2005; April 25, 2006. Data were also used for several of the HEP sites that were collected on May 5, 1999, while the Service was conducting another study. In November 2010, the Service provided the Corps with a Planning Aid Report (PAR) containing HEP scores for indicator species selected, HSI values and HUs for each habitat type evaluated, and detailed descriptions of these habitats as observed during fieldwork. The 2010 PAR presented habitat conditions within the study area for the proposed action as they existed in 2010. In addition, the 2010 PAR projected the future conditions with the study area if the Proposed Action were not implemented. As part of that effort, the Service, in coordination with the Corps, compiled a list of planned projects with the study area, and evaluated their potential impacts using HEP. Planning delays resulted in a need to update the 2010 PAR, as several of these planned projects went to construction. Due to this need for updated information, a supplemental PAR (largely assembled by the firm of Cardno TEC, Inc.) was provided to the Corps in May of 2013. This document provided information supplemental to the 2010 PAR including:
1. Revised existing conditions for grasslands. 2. The 2010 PAR considered a project as part of the Future Without Project Condition if it
had not started construction as of December 31, 2009. The Supplemental PAR considered any project that had not begun construction before March 31, 2012 as part of the future condition.
3. Future With Project Conditions chapters provided new information regarding impacts to habitats and habitat values from implementation of Alternatives 2 and 3.
Since that time, the Corps elected to discard the use of several indicator species’ HEP models that are not currently considered fully certified for use by Corps standards. Species no longer included in HEP evaluation for this project are the raccoon, American kestrel, Carolina chickadee, and green heron. Emergent wetlands were then left with data for only a single species (wood duck) for HEP/HSI/HU evaluation. To augment data for emergent wetlands, the HEP model for American coot was also utilized with data collected in the field prior for other emergent wetland species, through examination of photographs taken during data collection for emergent wetlands, and review of aerial photography of the HEP data plots taken in 2004 and 2005. In January 2014, Cardno TEC, Inc. compiled all of these changes to approved HEP species and all new information since the 2010 PAR and provided the resulting figures to the Service and the Corps as a revision to the May 13 Supplement to the 2010 PAR. The most current analysis of
11
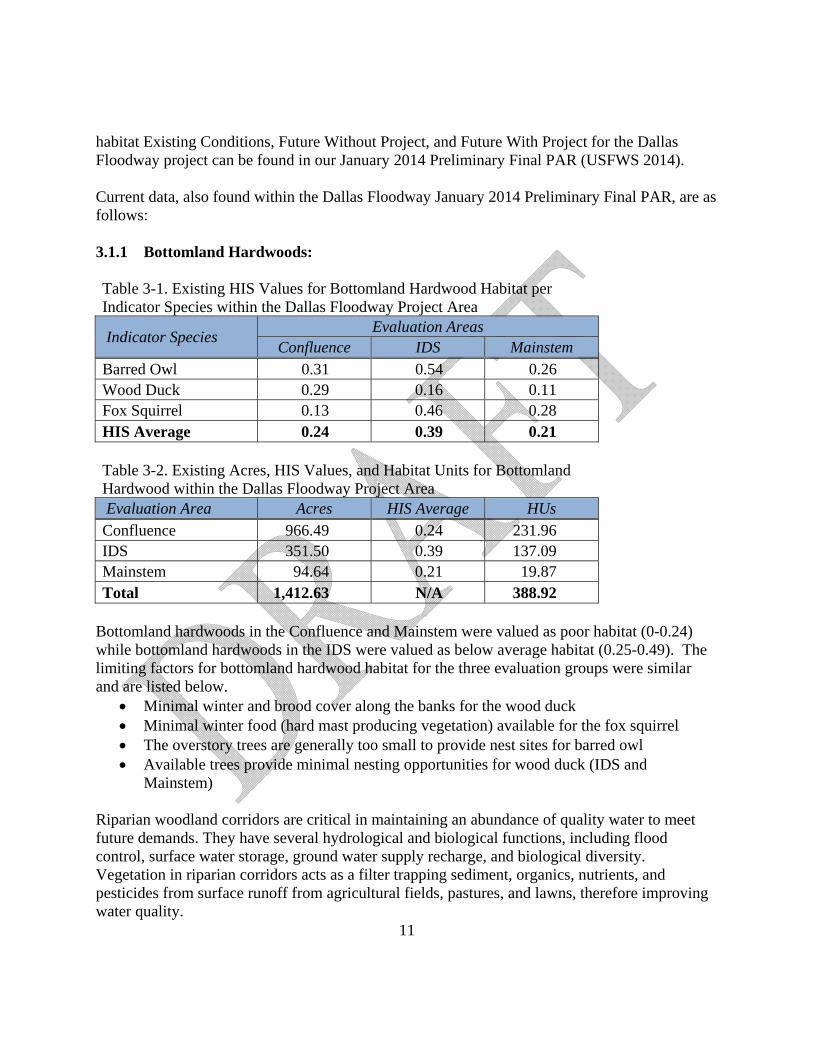
habitat Existing Conditions, Future Without Project, and Future With Project for the Dallas Floodway project can be found in our January 2014 Preliminary Final PAR (USFWS 2014). Current data, also found within the Dallas Floodway January 2014 Preliminary Final PAR, are as follows: 3.1.1 Bottomland Hardwoods: Table 3-1. Existing HIS Values for Bottomland Hardwood Habitat per Indicator Species within the Dallas Floodway Project Area
Indicator Species Evaluation Areas
Confluence IDS Mainstem Barred Owl 0.31 0.54 0.26 Wood Duck 0.29 0.16 0.11 Fox Squirrel 0.13 0.46 0.28 HIS Average 0.24 0.39 0.21
Table 3-2. Existing Acres, HIS Values, and Habitat Units for Bottomland Hardwood within the Dallas Floodway Project Area Evaluation Area Acres HIS Average HUs Confluence 966.49 0.24 231.96 IDS 351.50 0.39 137.09 Mainstem 94.64 0.21 19.87 Total 1,412.63 N/A 388.92
Bottomland hardwoods in the Confluence and Mainstem were valued as poor habitat (0-0.24) while bottomland hardwoods in the IDS were valued as below average habitat (0.25-0.49). The limiting factors for bottomland hardwood habitat for the three evaluation groups were similar and are listed below.
Minimal winter and brood cover along the banks for the wood duck Minimal winter food (hard mast producing vegetation) available for the fox squirrel The overstory trees are generally too small to provide nest sites for barred owl Available trees provide minimal nesting opportunities for wood duck (IDS and
Mainstem)
Riparian woodland corridors are critical in maintaining an abundance of quality water to meet future demands. They have several hydrological and biological functions, including flood control, surface water storage, ground water supply recharge, and biological diversity. Vegetation in riparian corridors acts as a filter trapping sediment, organics, nutrients, and pesticides from surface runoff from agricultural fields, pastures, and lawns, therefore improving water quality.

12
3.1.2 Emergent Wetlands: Table 3-3. Existing HSI Values for Emergent Wetland Habitat per Indicator Species within the Dallas Floodway Project Area
Indicator Species Evaluation Areas
Confluence IDS Mainstem Wood Duck 0.29 0.16 0.11 American Coot 0.31 0.29 0.33 HSI Average 0.30 0.22 0.22
Table 3-4. Existing Acres, HSI Values, and Habitat Units for Emergent Wetland within the Dallas Floodway Project Area Evaluation Area Acres HSI Average HUs Confluence 67.95 0.30 20.39 IDS 87.72 0.22 19.30 Mainstem 262.91 0.22 57.84 Total 418.58 N/A 97.53
Emergent wetland habitats within the Confluence were valued at the lower range of below average quality while emergent wetland habitats in the IDS and Mainstem were valued as poor quality. The limiting factors for emergent wetland habit for the three evaluation groups were similar and are listed below.
Available trees provide minimal nesting opportunities for wood duck Minimal winter and brood cover along the banks for wood duck Minimal nesting and winter cover along the banks for American coot
Emergent wetlands provide food and cover for fish, resident and migratory birds, small mammals, invertebrates, and the predators that feed on these species. Wetlands are important nesting habitat for waterfowl. Wetlands in the project area consists of rushes, sedges, wetland grasses, and aquatic plants located along the edges of the river and creeks, small impoundments, sumps, and seasonally flooded areas. Some of these wetlands are permanent, but most are seasonal. The emergent wetlands in the sump areas along the floodway have the potential of providing relatively good habitat for wildlife species if enhanced with vegetation for cover.

13
3.1.3 Grasslands: Table 3-5. Existing HSI Values for Grassland Habitat per Indicator Species within the Dallas Floodway Project Area
Indicator Species Evaluation Areas
Confluence IDS Mainstem Eastern Meadowlark 0.27 0.54 0.53 Eastern Cottontail 0.59 0.61 0.70 HSI Average 0.43 0.57 0.62
Table 3-6. Existing Acres, HSI Values, and HU for Grassland within the Study Area Evaluation Area Acres HSI Average HUs Confluence 1,573.16 0.43 676.46 IDS 958.26 0.57 546.21 Mainstem 1,752.15 0.62 1,086.33 Total 4,283.57 N/A 2,309.00
Grassland habitats within the Confluence were valued as below average while grassland habitats within the IDS and Mainstem were valued as average. The limiting factors for grassland habitat for the three evaluation groups were the same and listed below.
Distance to perch sites too great for eastern meadowlark Minimal cover for eastern cottontail (shrub/tree and persistent herbaceous vegetation)
Grasslands provide open space, a food source for passerines and the eastern cottontail, and cover for escape and nesting by means of tall grass, scattered brush piles, and shrubs for a variety of animals. Red-tailed hawks hunt for prey in open grasslands. There are two types of grasslands in the study area, managed and unmanaged. Managed grasslands are located in lawns, parks, sump areas and the floodway on and along the levees that are routinely mowed. They are comprised of short native and introduced grasses and forbs, and sometimes scattered trees. A few acres are located on private lands. Unmanaged grasslands are fallow fields also containing a combination of native and introduced grasses, forbs, and trees, but the composition is different from those in the short grass areas. There are very few of these grasslands in the project area.

14
4. Aquatic resources 4.1 Riverine: The aquatic habitat in the project area is limited as a result of numerous and continuous landscape modifications over time. Degradation as a result of urbanization, vegetative maintenance, contaminated stormwater runoff, and conversion of native rangeland to exotic grasses in the associated watershed has led to a narrowing of the riparian corridor and loss of habitat. Much of the river channel through the project area has been subjected to routine mowing making it difficult for woody and certain native herbaceous plants to establish further, an expected byproduct of prior levee and floodway maintenance. A fisheries survey was conducted on the Trinity River in Dallas County, Texas, from August 30 - September 1, 2004, by the Service and the Corps, with technical assistance provided by TPWD (USFWS 2004). The purpose of this survey was to determine baseline fish-community structure within the area of the Trinity River that could be potentially impacted by stream modifications, development, and/or construction activities associated with the proposed Dallas Flood Control Project. Four reaches were selected on the Trinity River to conduct this survey. Reaches 1 and 2 were within the mainstem of the Trinity River while Reaches 3 and 4 were upstream within the Elm Fork and West Fork, respectively. All reaches were located within an area of the river that could be potentially impacted by the proposed project. An IBI provides a means to assess aquatic life use within a given water body using multiple metrics. Two differing IBI methods were utilized:
1. State regional IBI - Accounting for the high variability in fish assemblages in aquatic systems between various ecological regions (eco-regions) in Texas.
Table 3-7. Existing HUs per Habitat Type Within the Study Area Habitat Types Baseline HU Bottomland Hardwood
388.92
Emergent Wetland 97.53 Grassland 2,309.00 Aquatic Riverine 345.77 Open Water 143.76
Total 3,284.98

15
2. Trinity River Basin IBI - regionalized IBI developed specifically for the Trinity River. Results of the state regional IBI assessments demonstrated high aquatic life use values for Reaches 2 (mainstem) and 3 (Elm Fork), while fish assemblages at Reaches 1 (mainstem) and 4 (West Fork) were characterized as intermediate. The fish community within the overall study area was classified as high. Scoring of the Trinity River basin specific IBIs yielded slightly different results. The basin specific aquatic life use value calculated for Reach 1 was intermediate to high, while aquatic life use values were high at Reaches 2 and 4. At Reach 3 and within the overall study area, the fish communities were characterized as high to exceptional. In comparing these 2004 results with previous studies conducted in the area, fish community indices demonstrated a shift to higher aquatic life use values. A greater number of total species, including more species considered intolerant to poor water quality conditions as well as a greater number of individual game fish were encountered during this assessment then had been observed in the past. These observed trends would suggest a recovering system. Table 4-1. Existing HSI Values for Aquatic Riverine Survey Sites within the Dallas Floodway Project Area
Reach Confluence Mainstem 1 - 0.75 2 - 0.87 3 0.90 - 4 0.82 -
Table 4-2. Existing Acres, HSI Values, and Habitat Units for Aquatic Riverine Habitat within the Dallas Floodway Project Area Evaluation Area Acres HSI Average HUs Confluence 132.42 0.90 119.18 IDS 165.18 0.75 123.89 Mainstem 123.73 0.83 102.70 Total 421.33 N/A 345.77
The limiting factors for aquatic riverine habitat for the Confluence and Mainstem are taken from the Service’s 2004 Dallas Floodway IBI report (USFWS 2004) and are listed below. The limiting factors for the IDS are assumed to be the same.
Number of benthic invertivore species (Confluence) Percent of individuals as tolerants (Mainstem) Percent of individuals as omnivores (Confluence and Mainstem) Percent of individuals as invertivores (Mainstem) Number of individuals per seine haul (Confluence and Mainstem)

16
Number of individuals per minute of electro-fishing (Confluence and Mainstem) Percent of individuals with diseases or other anomaly (Confluence) Total number of intolerant species (Confluence)
4.2 Open water systems: A follow-up IBI study was conducted on June 16, 2010 by the Service, Corps, and TPWD targeting open water bodies expected to be similar to the proposed Natural, Urban, and West Dallas Lakes (USACE 2010). This was done to draw assumptions about eventual fish communities expected to be present in these proposed waterbodies that will have no direct inflows, but would periodically be inundated by the Trinity River during heavy rain events at 0.5 to 2.0 year intervals. Since the Trinity River serves as the primary population source for the off-channel waterbodies, it is likely that most of the species within the Trinity River may also be found within these systems. However, species with more specific habitat requirements may not successfully make the transition from lotic to lentic environments. Six open water systems were initially identified to meet initial screening criteria, of which three were later determined feasible for survey: Trammel Crow Lake, Bart Simpson Lake, and Dallas Floodway Extension (DFE) Cell D. IBI metrics were modified accordingly to assess lentic systems. Results of these modified IBI assessments demonstrated high aquatic life use values for Trammel Crow and Bart Simpson Lake, while the fish assemblage at DFE Cell D was characterized as intermediate. Table 4-3.Existing HSI Values for Open Water Survey Sites within the Dallas Floodway Project Area Survey Site HSI Crow Lake 0.77 Bart Simpson Lake 0.77 DFE Wetland Cell D 0.60 Average 0.71
Table 4-4. Existing Acres, HSI Values, and Habitat Units for Open Water within the Dallas Floodway Project Area Evaluation Area Acres HSI Average HUs Confluence 150.93 0.71 107.16 IDS 49.30 0.65 32.05 Mainstem 6.41 0.71 4.55 Total 206.64 N/A 143.76

17
The limiting factors for open water habitat for the three evaluation groups were assumed to be the same as the limiting factors for the open water survey sites (Crow Lake, Bart Simpson Lake, and DFE Wetland Cell D) and are listed below.
Total number of fish species Number of cyprinid species Number of catfish species Number of intolerant species
Riverine fish sampled in 2004 from the Trinity River (discussed prior) showed detectable amounts of organochloride contaminants (USFWS 2004). It is likely that the fish sampled in the open water systems also have these contaminants since they are also utilizing the Trinity River as a primary water and population source. The open water survey sites are also located with a region of the Trinity River currently under a fish consumption advisory due to elevated organochlorine levels. These are legacy contaminants that have not been commercially distributed in the United States for almost 20 years. Most likely, the fish are obtaining these contaminants from the sediments or from the water column through stormwater run-off from the surrounding watershed. 5. Endangered and Threatened Species The federally listed threatened or endangered species known to occur in Dallas County include the endangered whooping crane (Grus americana), interior least tern (Sternula antillarum), black-capped vireo (Vireo atricapilla), golden-cheeked warbler (Setophaga chrysoparia) and the threatened piping plover (Charadrius melodus). Whooping cranes may be encountered in any county in north central Texas during migration. Autumn migration normally begins in mid-September, with most birds arriving on the wintering grounds at Aransas National Wildlife Refuge between late October and mid-November. Spring migration occurs during March and April. Whooping cranes prefer isolated areas away from human activity for feeding and roosting, with vegetated wetlands and wetlands adjacent to cropland being utilized along the migration route. Foods consumed usually include frogs, fish, plant tubers, crayfish, insects, and waste grains in harvested fields. This information as well as additional information on this species may be accessed on the Service’s ECOS website at http://ecos.fws.gov/speciesProfile/profile/speciesProfile.action?spcode=B003. It is possible that whooping cranes may temporarily utilize habitats present within the study area during their annual migration but an encounter would be a rare occurrence. It is unlikely that any of the current activities or proposed modifications to the floodplain would have an adverse impact on this species.

18
The interior least tern nests in colonies on bare to sparsely vegetated sandbars along rivers and streams in Texas from May through August. Nesting areas are ephemeral, changing as sandbars form, move and become vegetated. Because natural nesting sites have become sparse, interior least terns have nested in atypical/non-natural areas, which provide similar habitat requirements. For example, one colony has been nesting for several years at the Southside Wastewater Treatment Plant in Dallas. Non-natural nesting sites include sandpits, exposed areas near reservoirs, gravel levee roads, dredged islands, gravel rooftops, and dike-fields. In recent years, terns have been utilizing artificial habitat more frequently within the Dallas area with small colonies being established in highly developed areas. Ground disturbance related to construction activities near the Trinity River may incidentally create areas that are attractive to least terns for use as potential nesting sites. Should least terns arrive at any of the project areas during the breeding season, the Service should be notified to discuss alternative development plans or the need for consultation under Section 7 of the Endangered Species Act. The golden-cheeked warbler's habitat is generally described as mature (at least 12 feet tall) oak-juniper woodlands, with 50 percent or greater canopy cover, although warblers have been found in habitat with as little as 30 percent canopy cover. Steep, narrow canyons, with deciduous trees located along the drainage bottoms and juniper on the side slopes, provide an ideal mix of vegetation for this species. However, suitable habitat may also occur on hilltops or other relatively flat areas. Ideal habitat areas have a diverse mixture of juniper and hardwood trees, including oaks, hackberry, sycamore, and cedar elm. The black-capped vireo is a habitat specialist, nesting in mid-successional brushy areas (i.e., before the area develops into a mature woodland) where the dominant woody species are oaks, sumacs, persimmon, and other broad-leaved shrubs. Juniper may be common in vireo habitat, but juniper prominence is not essential or even preferred by the birds. Typical nesting habitat is composed of a shrub layer extending from the ground to about six feet covering about 35-55% of the total area, combined with a tree layer that may reach to 30 feet or more. Open, sometimes grassy spaces separate clumps of trees and shrubs. The vireo also depends on broad-leaved shrubs and trees, especially oaks, which provide insects on which the vireo feeds. The habitat evaluation team did not encounter any habitats that appeared suitable for nesting golden-cheeked warblers or black-capped vireos. Therefore, it is unlikely that either species would be present within the study area. The piping plover is considered to be a statewide migrant in Texas. Current information indicates that this species may stop-over during migration in Grayson County, especially near Lake Texoma and the Red River. Winters are spent along the Gulf Coast. Habitat requirements include bare to sparsely vegetated river sandbars for nesting and foraging. Its diet consists mainly of marine worms, mollusks, crustaceans, and insects. Although piping plovers have been seen in Dallas County, an encounter would be expected to be a rare event. Should piping plovers arrive at any of the project areas during the breeding season, the Service should be notified to

19
discuss alternative development plans or the need for consultation under Section 7 of the Endangered Species Act. The bald eagle (Haliaeetus leucocephalus) was listed under the Endangered Species Act in Dallas County but was removed from the list effective August 8, 2007. However, bald eagles are still afforded safeguards under the Migratory Bird Treaty Act and the Bald and Golden Eagle Protection Act. We recommend all activities be conducted in accordance with the Service’s National Bald Eagle Management Guidelines which may be accessed at http://www.fws.gov/migratorybirds/currentbirdissues/management/baldeagle/nationalbaldeaglemanagementguidelines.pdf 6. CONSIDERATION OF PROJECT ALTERNATIVES Ongoing NEPA compliance review by the USACE for the Trinity Parkway includes a review of several alternative alignments, as well as the No-Action Alternative. The City of Dallas has initiated preliminary design of two different versions of the BVP Study Ecosystem and Recreation features for Dallas Floodway, each addressing possible alternatives for the Trinity Parkway. Alternative 1 is a No-Action Alternative also undergoing obligatory consideration. Alternative 2 considers the implementation of the BVP/IDP if the Trinity Parkway is constructed within the Dallas Floodway Project. Alternative 3 considers the implementation of the BVP/IDP if the Trinity Parkway is not constructed within the Dallas Floodway Project. Descriptions of the No-Action Alternative and each Action Alternative follow.
6.1 Alternative 1: The No-Action Alternative
The No-Action Alternative, or “Future Without Project Condition,” is an alternative that assumes the BVP/IDP is not constructed. An analysis of the No-Action Alternative is included as required by the NEPA process to establish baseline conditions against which potential impacts can be evaluated.
6.1.1 Alternative 2: Proposed Action with the Trinity Parkway
Under Alternative 2, the Trinity Parkway would be constructed within the Dallas Floodway Project using the preferred alternative identified in the Trinity Parkway Draft EIS. The Trinity Parkway proposed action includes excavation of fill material for support and berm building. To maximize construction efficiency, NTTA, the City of Dallas, and the USACE would coordinate to determine if the Trinity Parkway can take their fill material from the proposed Dallas Floodway lake sites. Thus, the excavation needs of the BVP would be decreased, because the Trinity Parkway project would excavate a portion of the lakes for use in the parkway berm, thereby resulting in “double-use” for the lakes. All mitigation associated with impacts from

20
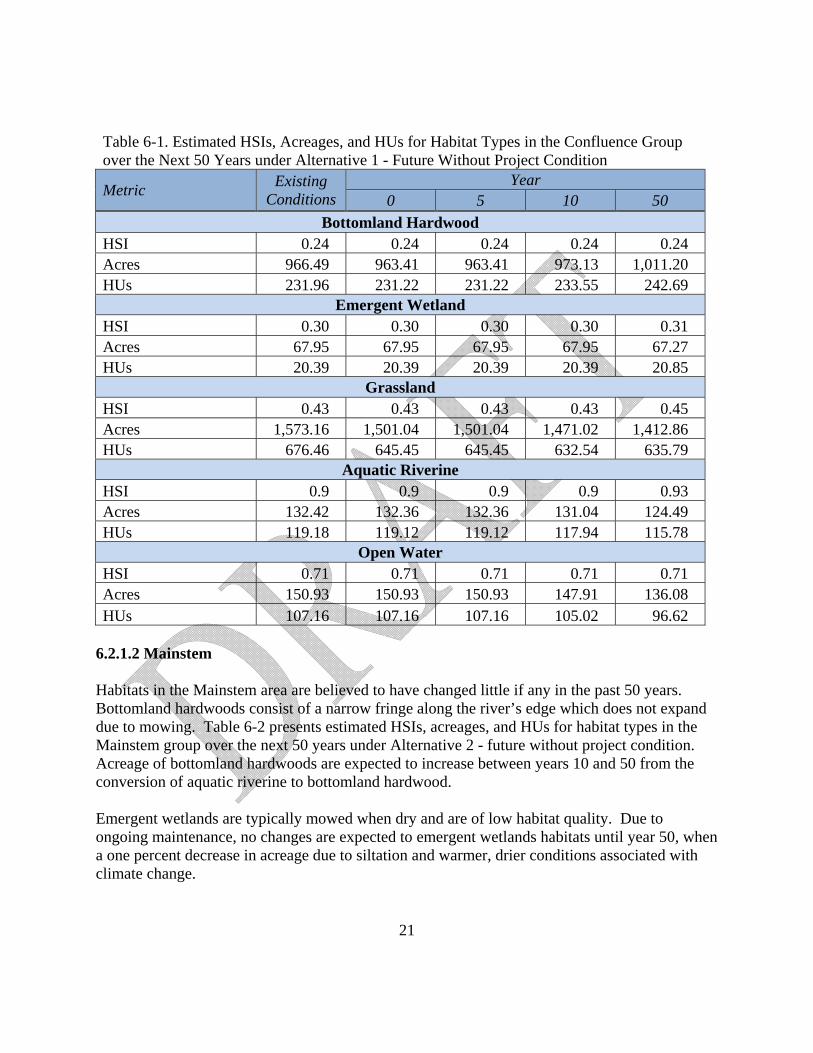
construction of the Trinity Parkway would occur outside of the Floodway (M. Hackett, USACE, personal communication, 2014). 6.1.2 Alternative 3: Proposed Action without the Trinity Parkway The Trinity Parkway is an approved “reasonably foreseeable” project which may be constructed within or outside the Dallas Floodway levee system. Accordingly, the USACE and City of Dallas developed alternatives that would provide NEPA flexibility for either outcome. Under Alternative 3, the BVP/IDP would be implemented with the Trinity Parkway project constructed outside the Dallas Floodway Project. Because Alternative 3 assumes that the Trinity Parkway is not in-place in the Dallas Floodway Project, certain BVP Study Ecosystem and Recreation features identified in Alternative 2 would be different under Alternative 3. Under Alternative 3, there would be no change to the FRM elements or IDP improvements described under Alternative 2 (M. Hackett, USACE, personal communication, 2014). 6.2 Alternative Impacts Analysis and Discussion It is difficult to predict what will happen within the project area in the future. However, using historic land use trends and the calculated HSIs, predictions of habitat conditions with or without the project can be expressed in terms of HUs. The two action alternatives were compared with the impact predictions associated with the Future Without the Project analysis for the 50 year project period 6.2.1 Alternative 1 – Future without project impact analysis 6.2.1.1 Confluence Table 6-1 displays Alternative 1 - Future Without Project HSIs, acres, and HUs for the Confluence for bottomland hardwood, emergent wetland, grassland, aquatic riverine, and open water habitat over the next 50 years. It is an extension of the Mainstem group and expected to change little in 50 years. The quality of bottomland hardwoods and open water is expected to remain the same over the next 50 years while emergent wetlands, grassland, and aquatic riverine would increase only slightly. For aquatic riverine, the HSI is expected to remain the same between years 0 and 10, but it expected to increase by year 50 due to increased regulations and improved technology related to water quality. Quality of open water is not expected to change over the next 50 years.
21
Table 6-1. Estimated HSIs, Acreages, and HUs for Habitat Types in the Confluence Group over the Next 50 Years under Alternative 1 - Future Without Project Condition
Metric Existing
Conditions Year
0 5 10 50 Bottomland Hardwood
HSI 0.24 0.24 0.24 0.24 0.24 Acres 966.49 963.41 963.41 973.13 1,011.20 HUs 231.96 231.22 231.22 233.55 242.69
Emergent Wetland HSI 0.30 0.30 0.30 0.30 0.31 Acres 67.95 67.95 67.95 67.95 67.27 HUs 20.39 20.39 20.39 20.39 20.85
Grassland HSI 0.43 0.43 0.43 0.43 0.45 Acres 1,573.16 1,501.04 1,501.04 1,471.02 1,412.86 HUs 676.46 645.45 645.45 632.54 635.79
Aquatic Riverine HSI 0.9 0.9 0.9 0.9 0.93 Acres 132.42 132.36 132.36 131.04 124.49 HUs 119.18 119.12 119.12 117.94 115.78
Open Water HSI 0.71 0.71 0.71 0.71 0.71 Acres 150.93 150.93 150.93 147.91 136.08 HUs 107.16 107.16 107.16 105.02 96.62
6.2.1.2 Mainstem Habitats in the Mainstem area are believed to have changed little if any in the past 50 years. Bottomland hardwoods consist of a narrow fringe along the river’s edge which does not expand due to mowing. Table 6-2 presents estimated HSIs, acreages, and HUs for habitat types in the Mainstem group over the next 50 years under Alternative 2 - future without project condition. Acreage of bottomland hardwoods are expected to increase between years 10 and 50 from the conversion of aquatic riverine to bottomland hardwood. Emergent wetlands are typically mowed when dry and are of low habitat quality. Due to ongoing maintenance, no changes are expected to emergent wetlands habitats until year 50, when a one percent decrease in acreage due to siltation and warmer, drier conditions associated with climate change.

22
Grassland habitats are regularly mowed and maintained and are not expected to change until approximately year 50, when a one percent increase may occur due to the conversion of emergent wetland to grassland. Aquatic riverine habitat is the main channel of the Trinity River while the only open water present is Crow Park Lake. Aquatic riverine acreage is expected to decrease by one percent and covert to bottomland hardwood due to less water reaching the mainstem. By year 50, five percent is also expected to covert to bottomland hardwood associated with and warmer, drier conditions expected from climate change. Table 6-2. Estimated HSIs, Acreages, and HUs for Habitat Types in the Mainstem Group over the Next 50 Years under Alternative 2 - Future Without Project Condition
Metric Existing
Conditions Year
0 5 10 50 Bottomland Hardwood
HSI 0.21 0.22 0.21 0.21 0.21 Acres 94.64 87.35 87.35 88.50 94.19 HUs 19.87 19.22 18.34 18.59 19.78
Emergent Wetland HSI 0.22 0.22 0.22 0.22 0.22 Acres 262.91 260.41 260.41 260.41 257.81 HUs 57.84 57.29 57.29 57.29 56.72
Grassland HSI 0.62 0.62 0.62 0.62 0.64 Acres 1,752.15 1,669.64 1,669.64 1,669.64 1,672.24 HUs 1,086.33 1,035.18 1,035.18 1,035.18 1,070.23
Aquatic Riverine HSI 0.83 0.83 0.83 0.83 0.86 Acres 123.73 114.95 114.95 113.80 108.11 HUs 102.7 95.41 95.41 94.45 92.97
Open Water HSI 0.71 0.71 0.71 0.71 0.71 Acres 6.41 6.41 6.41 6.41 6.41 HUs 4.55 4.55 4.55 4.55 4.55
6.2.1.3 Interior Drainage System The Interior Drainage System is a largely urban area with small amounts of habitat adjacent to the existing pumps, sumps, and drainage channels. Table 6-3 represents estimated HSIs, acreages, and HUs for habitat types in the Interior Drainage System group over the next 50 years

23
under Alternative 3 - future without project condition. At year 5, one percent of bottomland hardwood habitat is expected to be developed while at year 10, three percent of bottomland hardwood habitat is expected to be developed. At year 50, seven percent of bottomland hardwood habitat is expected to be lost to urban development. The emergent wetlands are part of the sump pump areas and would remain. No change to acreage is expected over the next 50 years. The primary purpose of the emergent wetland areas is flood control, not to provide habitat. At year 5, one percent of grassland habitat is expected to be developed. At year 10, three percent of grassland habitat is expected to be developed. At year 50, seven percent of grassland habitat is expected to be lost to urban development. The aquatic riverine acreage is expected to remain at 165 acres from year 0 to 5. At year 10, one percent of the aquatic habitat is expected to convert to bottomland hardwoods due to less water from the urban area reaching the IDS. This could be due to warmer and drier conditions and/or residents and businesses retaining more water on their properties so less water reaches the storm drains. By year 50, five percent of the aquatic riverine habitat is expected to convert to bottomland hardwoods, primarily due to warmer and drier conditions from climate change. Open water acreage is expected to remain the same from year 0 to 5. At year 10, two percent of open water is expected to convert to bottomland hardwood (1 percent) and urban (1 percent). The habitat conversion is expected to occur from the open water filling in due to siltation and as a result of less rainfall and more evaporation from warmer temperatures. It is anticipated that half the area would grow into bottomland hardwood and the other half would become disturbed (urban). At year 50, conditions are expected to be warmer and drier from changes in global climate conditions, thus more habitat would convert to bottomland hardwoods and disturbed (urban) areas. Table 6-3. Estimated HSIs, Acreages, and HUs for Habitat Types in the Interior Drainage System Group over the Next 50 Years under the Future Without Project Condition
Metric Existing
Conditions Year
0 5 10 50 Bottomland Hardwood
HIS 0.39 0.39 0.39 0.39 0.39 Acres 351.50 351.47 347.96 339.66 325.97 HUs 137.09 137.07 135.7 132.47 127.13
Emergent Wetland HIS 0.22 0.23 0.22 0.22 0.19 Acres 87.72 89.00 89.00 89.00 89.00 HUs 19.3 20.47 19.58 19.58 16.91
Grassland

24
HIS 0.57 0.57 0.57 0.57 0.62 Acres 958.26 941.32 931.91 903.95 840.67 HUs 546.21 536.55 531.19 515.25 521.22
Aquatic Riverine HSI 0.75 0.7 0.7 0.75 0.8 Acres 165.18 164.92 164.92 163.27 155.11 HUs 123.89 115.44 115.44 122.45 124.09
Open Water HSI 0.65 0.65 0.65 0.65 0.65 Acres 49.30 49.02 49.02 48.04 44.20 HUs 32.05 31.86 31.86 31.23 28.73
Within the entire study area (Confluence, Mainstem, and Interior Drainage System), changes to HUs under Alternative 1 at year 50 are depicted in Table 6-4: Table 6-4. Habitat Units per Habitat Type Within the Study Area under the Future Without Project Condition
Habitat Types HUs
Baseline FW/OPC (Year 50)
Change
Bottomland Hardwood
388.92 389.6 0.68
Emergent Wetland 97.53 94.48 -3.05 Grassland 2,309.00 2,227.24 -81.76 Aquatic Riverine 345.77 332.84 -12.93 Open Water 143.76 129.9 -13.86
Total 3,284.98 3,174.06 -110.92 6.2.2 Alternative 2: Proposed Action with the Trinity Parkway impact analysis Ninety-nine acres of existing habitat would become urban from the implementation of Alternative 2. Open water habitat would increase under Alternative 2 from the creation of the Urban, Natural, and West lakes. Bottomland hardwood acreage would also increase with hardwoods planted along the Trinity River; the largest amount of hardwoods would be planted at the southeastern end of the project area. Aquatic riverine acreage would increase from the realignment of the river. The greatest decrease of habitat would be to grassland habitat.

25
6.2.2.1 Confluence The Confluence Group includes the Elm Fork and West Fork of the Trinity River and the associated emergent wetland and upland habitat in the area. The Alternative 2 actions in the Confluence consist of the FRM Elements and the IDP Trinity-Portland Pumping Plant and Eagle Ford and Trinity-Portland sump improvements. Table 6-5 presents estimated HSIs, acreages, and HUs for habitat types in the Confluence Group over the next 50 Years under alternative 2. Progressions of these metrics are predicted to be the same as that presented for Alternative 1. Table 6-5. Estimated HSIs, Acreages, and HUs for Habitat Types in the Confluence Group over the Next 50 Years under Alternative 2
Metric Existing
Conditions Year
0 5 10 50 Bottomland Hardwood
HIS 0.24 0.24 0.24 0.24 0.24 Acres 966.49 966 966 976 1016 HUs 231.96 231.84 231.84 234.24 243.84
Emergent Wetland HIS 0.30 0.30 0.30 0.30 0.31 Acres 67.95 68 68 68 67 HUs 20.39 20.40 20.40 20.40 20.77
Grassland HIS 0.43 0.43 0.43 0.43 0.45 Acres 1,573.16 1574 1574 1543 1482 HUs 676.46 676.82 676.82 663.49 666.90
Aquatic Riverine HIS 0.90 0.90 0.90 0.90 0.93 Acres 132.42 133 133 132 125 HUs 119.18 119.7 119.7 118.8 116.25
Open Water HIS 0.71 0.71 0.71 0.71 0.71 Acres 150.93 151 151 148 136 HUs 107.16 107.21 107.21 105.08 96.56

26
6.2.2.2 Mainstem Table 6-6 presents estimated HSIs, Acreages, and HUs for habitat types in the Mainstem Group over the next 50 years under Alternative 2. Most of the habitats within mainstem area would be temporarily impacted by the construction of the BVP Study features. HSIs within bottomland hardwood, emergent wetland, and grassland-urban forest would be low at years 0, 1, and 5 because they would not have had enough time to establish and function. HSI values for bottomland hardwoods and emergent wetlands would be expected to increase over time as these habitats mature. Mainstem grasslands will consist of 3 types: native meadow, turf, and urban forest. Native meadow would be expected to have the highest eventual HSI value with its planned native species diversity when compared with turf (mowed and managed) and urban forest (composed largely of non-native ornamental trees). Open water and riverine HSIs are not expected to change much over time until approximately year 50, when aquatic riverine may improve due to increase regulations and technology related to water quality. Table 6-6. Estimated HSIs, Acreages, and HUs for Habitat Types in the Mainstem Group over the Next 50 Years under Alternative 2
Metric Existing
ConditionsYear
0 1 5 10 25 50 Bottomland Hardwood
HSI 0.21 0.09 0.09 0.09 0.13 0.21 0.43 Acres 94.64 195 195 195 198 203 215 HUs 19.87 17.55 17.55 17.55 25.74 42.63 92.45
Emergent Wetland Existing
HSI 0.22 0.22 0.22 0.22 0.22 0.22 0.22 Acres 262.91 32 32 32 32 32 32 HUs 57.84 7.04 7.04 7.04 7.04 7.04 7.04
Proposed HSI - 0.13 0.13 0.34 0.42 0.47 0.52 Acres - 152 152 152 152 152 150 HUs 0.00 19.76 19.76 51.68 63.84 71.44 78
Total Wetland HU 57.84 26.8 26.8 58.72 70.88 78.48 85.04 Grassland
Existing Maintenance Levels HSI 0.62 0.4 0.4 0.4 0.4 0.4 0.4

27
Acres 1,752.15 192 192 192 192 192 194 HUs 1,086.33 76.8 76.8 76.8 76.8 76.8 77.6
Meadow HSI - 0.50 0.60 0.70 0.65 0.70 0.85 Acres - 887 887 887 887 887 887 HUs 0.00 443.50 532.20 620.90 576.55 620.90 753.95
Landscaping: Turf HSI - 0 0 0.4 0.4 0.4 0.4 Acres - 158 158 158 158 158 158 HUs 0.00 0.00 0.00 63.20 63.20 63.20 63.20
Landscaping: Urban Forest HSI - 0.50 0.50 0.40 0.40 0.40 0.40 Acres - 5 5 5 5 5 5 HUs 0.00 2.50 2.50 2.00 2.00 2.00 2.00
Total Grassland HU 1,086.33 522.8 611.5 762.9 718.55 762.9 896.75 Aquatic Riverine
HSI 0.83 0.83 0.75 0.83 0.85 0.87 0.90 Acres 123.73 250 250 250 247 242 230 HUs 102.70 207.50 187.50 207.50 209.95 210.54 207.00
Open Water Crow Lake
HUs 4.55 4.55 4.55 4.55 4.55 4.55 4.55 Urban Lake & West Dallas Lake
HSI - 0.00 0.00 0.43 0.77 0.77 0.77 Acres - 207 207 207 207 207 207 HUs - 0.00 0.00 89.01 159.39 159.39 159.39
Natural Lake HSI - 0.00 0.00 0.60 0.77 0.77 0.77 Acres - 50 50 50 50 50 50 HUs - 0.00 0.00 30.00 38.50 38.50 38.50 Total Open Water HU 4.55 4.55 4.55 123.56 202.44 202.44 202.44
6.2.2.3 Interior Drainage System Table 6-7 presents estimated HSIs, Acreages, and HUs for habitat types in the Interior Drainage System over the next 50 years under Alternative 2. Within this area, bottomland hardwoods are typically found along existing drainage channels. Bottomland hardwoods have no protection from development, and would be expected to decrease within this continually developing area.

28
Grassland area would likely be decrease due to development while grassland HSIs would likely increase over time as trees in the urban forest provide increase foraging opportunities for grassland species. Emergent wetlands would be expected to decrease somewhat in acreage, HU and HSI value over the next 50 years due to anticipated effects of climate change. Aquatic riverine habitat conditions would be expected to decrease in HSI value between years 0 and 5 due to the adverse effects associated with construction of Alternative 2. By year 50, HSIs are expected to have increased due to increased regulations and technology related to water quality. Open water acreage would increase somewhat, but HSI values are expected to remain the same over the next 50 years under Alternative 2. Table 6-7. Estimated HSIs, Acreages, and HUs for Habitat Types in the Interior Drainage System Group over the Next 50 Years under Alternative 2
Metric Existing
Conditions Year
0 5 10 50 Bottomland Hardwood
HSI 0.39 0.39 0.39 0.39 0.39 Acres 351.50 350 347 339 326 HUs 137.09 136.50 135.33 132.21 127.14
Emergent Wetland HSI 0.22 0.23 0.22 0.22 0.19 Acres 87.72 67 67 67 67 HUs 19.3 15.41 14.74 14.74 12.73
Grassland Existing Maintenance Levels
HSI 0.57 0.57 0.57 0.57 0.62 Acres 958.26 945 936 908 844 HUs 546.21 538.65 533.52 517.56 523.28
Landscaping: Urban Forest HSI 0.50 0.40 0.40 0.40 Acres 22 22 22 22 HUs 0 11 8.8 8.8 8.8
Total Grassland HU 546.21 549.65 542.32 526.36 532.08 Aquatic Riverine
HSI 0.75 0.70 0.70 0.75 0.80 Acres 165.18 162 162 160 152

29
HUs 123.89 113.40 113.40 120.00 121.60 Open Water
HSI 0.65 0.65 0.65 0.65 0.65 Acres 49.30 72 72 71 65 HUs 32.05 46.80 46.80 46.15 42.25
Within the entire study area (Confluence, Mainstem, and Interior Drainage System), changes to HUs under Alternative 2 at year 50 are depicted in Table 6-8: Table 6-8. HUs per Habitat Type Within the Study Area under Alternative 2
Habitat Types HUs
Baseline Year 50 Change Bottomland Hardwood 388.92 463.43 74.51 Emergent Wetland 97.53 118.54 21.01 Grassland 2,309.00 2,095.73 -213.27 Aquatic Riverine 345.77 444.85 99.08 Open Water 143.76 341.25 197.49
Total 3,284.98 3,463.80 178.82
6.2.3 Alternative 3: Proposed Action without the Trinity Parkway impact analysis
Under Alternative 3, five more acres of existing habitats would be converted to urban developments. The greatest decrease of habitat would be loss of grassland while the greatest increase would be to open water from the construction of the BVP Study lakes. Bottomland hardwood acreage would increase along with aquatic riverine habitat acreage from the realignment of the river. 6.2.3.1 Confluence Within the Confluence area, all activities proposed by Alternative 3 would be the same as those proposed by Alternative 2. Therefore, changes to habitat acreages within the Confluence would not be expected to differ from the results presented prior regarding Alternative 2.

30
6.2.3.2 Mainstem
Table 6-9. Estimated HSIs, Acreages, and HUs for Habitat Types in the Mainstem Group over the Next 50 Years under Alternative 3
Metric Existing
Conditions Year
0 1 5 10 25 50
Bottomland Hardwood
HSI 0.21 0.09 0.09 0.09 0.13 0.21 0.43
Acres 94.64 194 194 194 197 202 214
HUs 19.87 17.46 17.46 17.46 25.61 42.42 92.02
Emergent Wetland
Existing/Continuing
HSI 0.22 0.22 0.22 0.22 0.22 0.22 0.22
Acres 262.91 32 32 32 32 32 32
HUs 57.84 7.04 7.04 7.04 7.04 7.04 7.04
Proposed
HSI - 0.13 0.13 0.34 0.42 0.47 0.52
Acres - 154 154 154 154 154 152
HUs 0 20.02 20.02 52.36 64.68 72.38 79.04
Emergent Wetland HU 57.84 27.06 27.06 59.4 71.72 79.42 86.08
Grassland
Existing Maintenance Levels
HSI 0.62 0.40 0.40 0.40 0.40 0.40 0.40
Acres 1,752.15 191 191 191 191 191 193
HUs 1,086.33 76.40 76.40 76.40 76.40 76.40 77.20
Landscaping: Meadow
HSI - 0.50 0.60 0.70 0.65 0.70 0.85
Acres - 844 844 844 844 844 844
HUs 0.00 422.00 506.40 590.80 548.60 590.80 717.40
Landscaping: Turf
HSI - 0.00 0.00 0.40 0.40 0.40 0.40
Acres - 186 186 186 186 186 186
HUs 0.00 0.00 0.00 74.40 74.40 74.40 74.40
Landscaping: Urban Forest
HSI - 0.50 0.50 0.40 0.40 0.40 0.40
Acres - 15 15 15 15 15 15
HUs 0.00 7.50 7.50 6.00 6.00 6.00 6.00
31
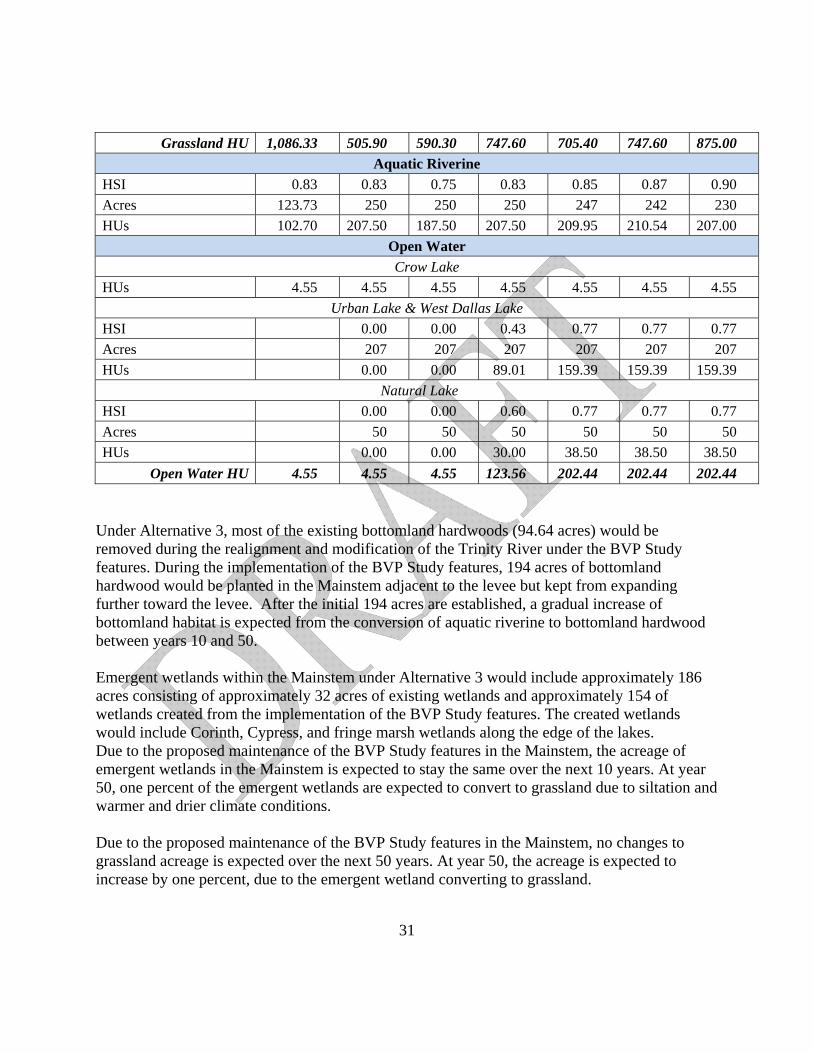
Grassland HU 1,086.33 505.90 590.30 747.60 705.40 747.60 875.00
Aquatic Riverine
HSI 0.83 0.83 0.75 0.83 0.85 0.87 0.90
Acres 123.73 250 250 250 247 242 230
HUs 102.70 207.50 187.50 207.50 209.95 210.54 207.00
Open Water
Crow Lake
HUs 4.55 4.55 4.55 4.55 4.55 4.55 4.55
Urban Lake & West Dallas Lake
HSI 0.00 0.00 0.43 0.77 0.77 0.77
Acres 207 207 207 207 207 207
HUs 0.00 0.00 89.01 159.39 159.39 159.39
Natural Lake
HSI 0.00 0.00 0.60 0.77 0.77 0.77
Acres 50 50 50 50 50 50
HUs 0.00 0.00 30.00 38.50 38.50 38.50
Open Water HU 4.55 4.55 4.55 123.56 202.44 202.44 202.44
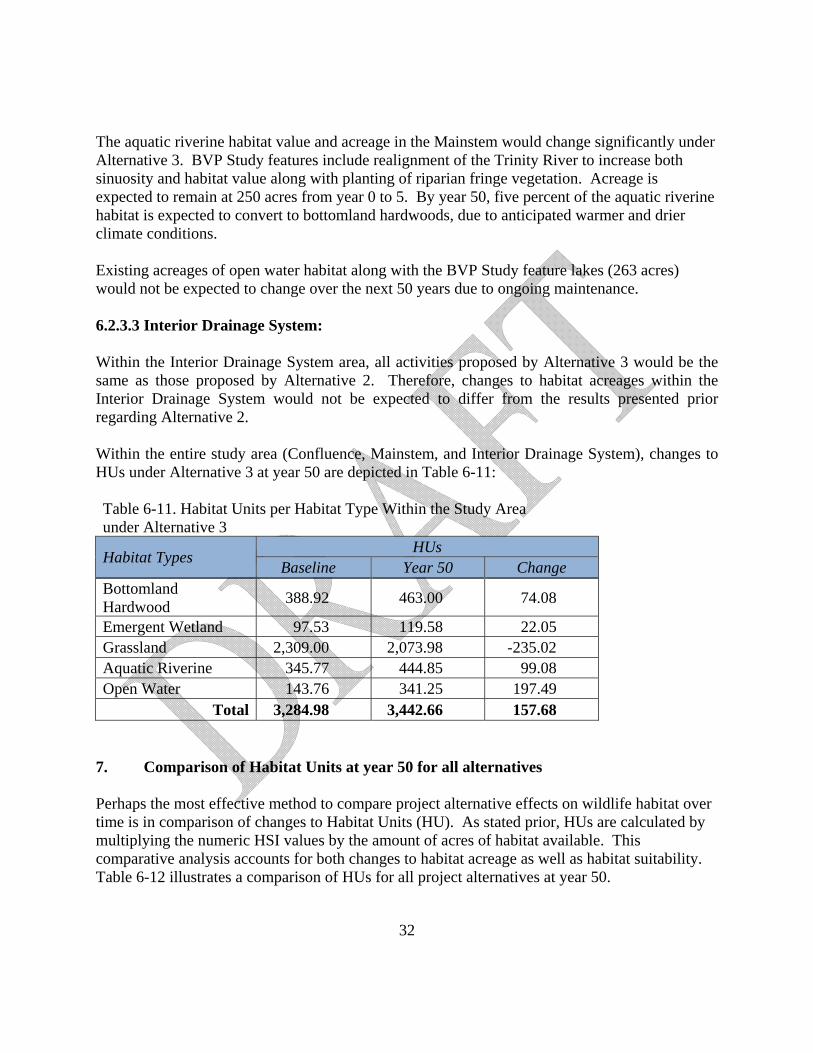
Under Alternative 3, most of the existing bottomland hardwoods (94.64 acres) would be removed during the realignment and modification of the Trinity River under the BVP Study features. During the implementation of the BVP Study features, 194 acres of bottomland hardwood would be planted in the Mainstem adjacent to the levee but kept from expanding further toward the levee. After the initial 194 acres are established, a gradual increase of bottomland habitat is expected from the conversion of aquatic riverine to bottomland hardwood between years 10 and 50. Emergent wetlands within the Mainstem under Alternative 3 would include approximately 186 acres consisting of approximately 32 acres of existing wetlands and approximately 154 of wetlands created from the implementation of the BVP Study features. The created wetlands would include Corinth, Cypress, and fringe marsh wetlands along the edge of the lakes. Due to the proposed maintenance of the BVP Study features in the Mainstem, the acreage of emergent wetlands in the Mainstem is expected to stay the same over the next 10 years. At year 50, one percent of the emergent wetlands are expected to convert to grassland due to siltation and warmer and drier climate conditions. Due to the proposed maintenance of the BVP Study features in the Mainstem, no changes to grassland acreage is expected over the next 50 years. At year 50, the acreage is expected to increase by one percent, due to the emergent wetland converting to grassland.
32
The aquatic riverine habitat value and acreage in the Mainstem would change significantly under Alternative 3. BVP Study features include realignment of the Trinity River to increase both sinuosity and habitat value along with planting of riparian fringe vegetation. Acreage is expected to remain at 250 acres from year 0 to 5. By year 50, five percent of the aquatic riverine habitat is expected to convert to bottomland hardwoods, due to anticipated warmer and drier climate conditions. Existing acreages of open water habitat along with the BVP Study feature lakes (263 acres) would not be expected to change over the next 50 years due to ongoing maintenance. 6.2.3.3 Interior Drainage System: Within the Interior Drainage System area, all activities proposed by Alternative 3 would be the same as those proposed by Alternative 2. Therefore, changes to habitat acreages within the Interior Drainage System would not be expected to differ from the results presented prior regarding Alternative 2. Within the entire study area (Confluence, Mainstem, and Interior Drainage System), changes to HUs under Alternative 3 at year 50 are depicted in Table 6-11: Table 6-11. Habitat Units per Habitat Type Within the Study Area under Alternative 3
Habitat Types HUs
Baseline Year 50 Change Bottomland Hardwood
388.92 463.00 74.08
Emergent Wetland 97.53 119.58 22.05 Grassland 2,309.00 2,073.98 -235.02 Aquatic Riverine 345.77 444.85 99.08 Open Water 143.76 341.25 197.49
Total 3,284.98 3,442.66 157.68 7. Comparison of Habitat Units at year 50 for all alternatives Perhaps the most effective method to compare project alternative effects on wildlife habitat over time is in comparison of changes to Habitat Units (HU). As stated prior, HUs are calculated by multiplying the numeric HSI values by the amount of acres of habitat available. This comparative analysis accounts for both changes to habitat acreage as well as habitat suitability. Table 6-12 illustrates a comparison of HUs for all project alternatives at year 50.

33
Table 6-12. Comparison of Habitat Units (HU) at Year 50 for All Alternatives with Cumulative Projects as Compared to Existing Conditions
Habitat Type
Existing Conditions
Alternative 1 Future W/out Project
Alternative 2 Cumulative
Alternative 3 Cumulative
HU HU Difference HU Difference HU DifferenceBottomland Hardwood
388.92 389.60 0.68 449.67 60.75 458.89 69.97
Emergent Wetland
97.53 94.48 -3.05 145.55 48.02 147.66 50.13
Grassland 2,309.00 2,227.24 -81.76 1,952.33 -356.67 1,982.68 -326.32 Aquatic Riverine
345.77 332.84 -12.93 445.75 99.98 445.75 99.98
Open Water
143.76 129.90 -13.86 341.25 197.49 341.25 197.49
Total 3,285 3,174.06 -110.92 3,334.55 49.57 3,376.23 91.25 Results suggest that under both Alternative 2 and Alternative 3, habitat quality would increase over time as compared with the No Action Alternative 1. The greatest increases would be to open water habitats from the construction of the BVP Study lakes and to aquatic riverine habitats from the realignment of the Trinity River. The BVP Study along with other project components of Alternatives 2 and 3 would also have substantial positive effects to the current habitat quality of bottomland hardwoods, emergent wetlands, and aquatic riverine habitats. The only decrease in habitat quality would be to grasslands primarily due to loss of acreage. Existing grasslands within the study area are possibly the least ecologically valuable habitats present due to their continual mowing disturbances and invasion of non-native species, circumstances expected to continue under all project alternatives. 7.1 Evaluation and Comparison of the Alternatives The following is a comparison of Alternative 1 - No Action, Alternative 2 - Proposed Action with the Trinity Parkway, and Alternative 3 - Proposed Action without the Trinity Parkway in regards to how they will impact fish and wildlife resources over the 50 year project analysis period. 7.1.1 Alternative 1 - No Action: Through the course of normal urban development within the project area over a period of 50 years, the greatest losses to fish and wildlife resources in all habitats except grasslands are expected to occur under this alternative. 7.1.2 Alternative 2 - Proposed Action with the Trinity Parkway: Temporary adverse impacts to all habitats within the project area are expected to occur with this alternative.

34
However, adverse impacts to fish and wildlife resources associated with this alternative would be compensated for through in-kind and out-of-kind mitigation. In-kind mitigation would be in the form of an increase of open water habitat acreage and quality from the construction of the BVP Study lakes as well as an increase in aquatic riverine habitat acreage and quality through the realignment of the Trinity River. Temporary impacts to the bottomland hardwood habitat would be adequately compensated for by in-kind compensation with an increase of approximately 73.83 HUs over future without project conditions (at year 50). Grassland habitat would decrease by 131.51 HUs, but the overage of bottomland hardwood habitat, which is considered more valuable due to greater biodiversity and habitat rarity, would compensate for this loss as out-of-kind mitigation. Emergent wetland habitats would also be substantially increased by an additional 21.01 HUs over future without project conditions. 7.1.3 Alternative 3 - Proposed Action without the Trinity Parkway: Temporary and long term impacts resulting from this Alternative would differ little from Alternative 2. Specifically, the implementation of Alternative 3 would yield 1.4 emergent wetland HUs more than Alternative 2, but would also result in 21.75 Grassland HUs less than Alternative 2. All other in-kind and out-of-kind mitigation expected from Alternative 2 would also result from the implementation of Alternative 3 due to their similarities. 7.2 Alternatives Summary - Both alternatives 2 and 3 would result in the improvement of existing bottomland hardwood, emergent wetland, open water, and aquatic riverine habitats, while offsetting impacts to grasslands through gains in higher value habitats. Because of these actions, it is expected that both alternatives would fully meet the ecosystem preservation and restoration objectives within the project area. Unavoidable impacts to habitat within the project area associated with these alternatives are relatively minimal. The small amount of habitat that would temporarily be lost through construction activities would be fully compensated for through in-kind and out-of-kind mitigation. High quality riparian and wetland habitats would be established in lieu of grasslands which are of limited ecological value. Consequently, the losses to fish and wildlife resources associated with Alternatives 2 and 3 are expected to be self-mitigating and would be acceptable from a fish and wildlife resource perspective. 8. Recommended Fish and Wildlife Conservation Measures The Service has evaluated this project in accordance with the guidelines and directives contained in the Fish and Wildlife Mitigation Policy (Federal Register 46(15):7644-7663; January 23, 1981). The Mitigation Policy is the basis by which the Service makes recommendations, in order of priority, to avoid, minimize, rectify, reduce or eliminate the loss over time, or compensate project-related impacts to fish and wildlife resources. Our recommendations are based on the value and relative abundance of the affected habitats to the evaluation species. The Policy includes four Resource Categories (1-4) to provide a consistent value rating for wildlife habitats.

35
Based on the HSI values and IBI evaluations, the Service has designated a Resource Category for each terrestrial habitat in each area assessed and aquatic habitat in each segment studied. 8.1 Aquatic Habitat The Service has designated the aquatic habitats within the study area as Resource Category 3. Category 3 habitat is of high to medium value for the evaluation species and is relatively abundant on a national basis. The mitigation goal for this category is no net loss of habitat value while minimizing loss of in-kind values. As noted in our Trinity River Basin IBI, the Elm Fork (Reach 3) support exceptional fisheries, and therefore, impacts to this system should be avoided and/or minimized before any enhancement of these resources might occur. As indicated prior, Alternatives 2 and 3 would result in substantial net gains of aquatic habitat quality and acreage. Any temporary construction impacts to aquatic habitats would be self-mitigating and the Service concludes that no additional mitigation efforts would be necessary. Although the degree and extent of contamination in sediments within the portion of the Trinity River that would be impacted by the proposed actions are unknown, the Service is concerned that contaminated sediments could be re-suspended into the water column from the excavation activities, which would allow these contaminants to become more readily available to the aquatic biota inhabiting the river. Therefore, the Service recommends that the degree and extent of sediment disturbance be minimized to the extent practicable and that best management practices be used to further reduce the potential for sediment contamination to migrate downstream. The Service also recommends that best management practices be implemented to control the increased pollutant loading in storm water runoff associated with construction activities and the projected increase in traffic usage within this area. 8.2 Terrestrial Habitat All terrestrial habitats within the project area have medium to low habitat value for the evaluation species and have been designated as Resource Category 4. The mitigation planning goal for Category 4 habitat is to minimize loss of habitat value. Out-of-kind habitat values may be used for mitigation. Habitat improvements and restoration measures proposed for the project may be used for the mitigation of adverse impacts associated with the construction of the preferred plan of development. As stated prior, alternatives 2 and 3 would result in the improvement of existing bottomland hardwood and emergent wetland habitats, while offsetting impacts to grasslands through gains in higher value habitats. The small amount of habitat that would temporarily be lost through construction activities would be fully compensated for through in-kind and out-of-kind mitigation. High quality riparian and wetland habitats would be established in lieu of grasslands which are, in comparison, of lesser ecological value. Consequently, the losses to fish and wildlife

36
resources associated with Alternatives 2 and 3 are expected to be self-mitigating and would be acceptable from a fish and wildlife resource perspective. Alternatives 2 and 3 would result in substantial net gains of terrestrial habitat quality and acreage. Any temporary construction impacts to terrestrial habitats would be self-mitigating and the Service concludes that no additional mitigation efforts would be necessary. Executive Order 11990 requires all Federal agencies to “take action to minimize the destruction, loss or degradation of wetlands, and to preserve and enhance the natural and beneficial values of wetlands in carrying out the agency's responsibilities.” Wetlands are of national importance and have been documented as one of the most productive and important habitats for a variety of fish and wildlife species. At year 50, Alternative 2 would result in a net increase of 21.01 emergent wetland HUs and Alternative 3 would result in an increase of 22.05 HUs. Either of these scenarios would fully mitigate for temporary wetland impacts associated with project construction. 9. Summary of Findings and Fish and Wildlife Service’s Position Due to the lack of suitable habitat and the urbanized character of the project area, it is unlikely that any federally listed threatened or endangered species would become established in any of the study areas. The Trinity River has a high diversity of bird species, and the area is likely to become more popular as an urban park. The interior least tern is the only listed species likely to be found in the area with any regularity. However, given the urban area, breeding populations are not likely to be established. Therefore, adverse effects to federally listed species are not anticipated with implementation of any of the proposed alternatives. No permanent detrimental effects to aquatic or terrestrial communities within the project area would be expected to occur from the implementation of any of the project alternatives. Long term effects of Alternatives 2 and 3 would result in net benefits to fish and wildlife resources. Therefore, no additional mitigation efforts are recommended. The Service commends the Corps and the sponsor for incorporating habitat creation/restoration plans into the action alternatives. These efforts would fully compensate for the impacts caused by initial project construction. The Service recommends that future plans for the project area incorporate more aspects of the conceptual Ecosystem Restoration Plan throughout the project area. These actions would provide additional benefits to fish and wildlife resources, and the public’s enjoyment of these resources, throughout the entire project area. Both Alternatives 2 and 3 would result gains to fish and wildlife resources and both would support the Dallas Floodway Project objectives of flood protection, habitat creation/restoration, and public recreation. However, Alternative 3 would likely be the least environmentally

37
damaging. Locating a portion of the Trinity Parkway within the levee system (Alternative 2) could potentially introduce more runoff contaminants and litter from vehicles passing through this area. While both Alternatives 2 and 3 would support substantial gains to fish and wildlife resources, the Service recommends Alternative 3. If Alternative 2 is selected, the Service recommends that efforts be made to fully manage pollutants and litter that the Trinity Parkway might introduce into the study area. In summary, we believe the implementation of these recommended measures would serve to minimize the adverse impacts associated with the proposed project. We appreciate the opportunity to provide our evaluation and recommendations on this project. Please contact Sean Edwards of my staff at (817) 277-1100 if you have any questions or require additional assistance.
Sincerely, Debra Bills
Field Supervisor

38
References Cited Diggs, G.M., Jr., B.L. Liscomb, and R.J. O’Kennon. 1999. Shinners & Mahler’s illustrated flora of North Central Texas. Botanical Research Institute of Texas and Austin College. pp 1626
USACE. 1955. Trinity River Basin, Texas. Definite Project Report on Dallas Floodway. Volume VI – Floodway and Drainage Improvements. June.
USACE. 1960. Operation and Maintenance Manual. Dallas Floodway. West Fork – Elm Fork – Trinity River Texas. May.
USACE. 1988a. Trinity River and Tributaries Environmental Impact Statement Record of Decision. April.
USACE. 1988b. Upper Trinity River Feasibility Study. Dallas County, Texas. April.
USACE. 2003. Final Supplement Number 1 to the Environmental Impact Statement for the Dallas Floodway Extension, Trinity River, TX. April.
USACE. 2009. Periodic Inspection. Dallas Floodway Project. Trinity River. Dallas, Dallas County, Texas. Report No. 9. Inspection date: December 3-5, 2007.
USACE. 2010. Assessment of Open Water Fisheries Adjacent to the Trinity River. Dallas Floodway Project. Dallas, Dallas County, Texas.
USACE. 2014. Final Environmental Impact Statement, Trinity Parkway from IH-35E/SH-183 to US-175/SH-310, Dallas County, Texas. U.S. Department of Transportation, Federal Highway Administration, Texas Department of Transportation, North Texas Tollway Authority. Cooperating Agencies: U.S. Army Corps of Engineers, U.S. Environmental Protection Agency. February 2014
USFWS. 2004. Assessment of Trinity River Fisheries With the Proposed Dallas Flood Control Project Area, Dallas County, Texas, Arlington, Texas Ecological Services Field Office.

39
USFWS. 2010. Habitat Conditions Planning Aid Report for the Dallas Floodway Project, Dallas County, Texas. Arlington, Texas Ecological Services Field Office.
USFWS. 2014. Preliminary Final Habitat Conditions Planning Aid Report for the Dallas Floodway Project, Dallas County, Texas. Arlington, Texas Ecological Services Field Office.
![DECISION - rtbuvic.com.au · [2016] FWCA 5738 DECISION [2016] FWCA 5738 2 [7] The Agreement is approved and, in accordance with s.54 of the Act, will operate from 23 August 2016](https://img.pdfslide.us/doc/110x75/5f8a85cbb1c7e85c8f719c02/decision-2016-fwca-5738-decision-2016-fwca-5738-2-7-the-agreement-is-approved.jpg)

![DECISION - hr.unsw.edu.au University of New South Wales... · [2019] FWCA 3504 2 [4] The Agreement is approved and, in accordance with s.54 of the Act, will operate from 28 May 2019](https://img.pdfslide.us/doc/110x75/5e11f68bc4712f60c22399ef/decision-hrunsweduau-university-of-new-south-wales-2019-fwca-3504-2.jpg)

![[2013] FWCA 6245 - Finer Floor Finishings Pty Ltd - Home Fair Work Act 2009 s.185—Enterprise agreement Construction, Forestry, Mining and Energy Union (AG2013/2451) FINER FLOOR FINISHINGS](https://img.pdfslide.us/doc/110x75/5b0dc0127f8b9ab7658ce9c3/2013-fwca-6245-finer-floor-finishings-pty-ltd-fair-work-act-2009-s185enterprise.jpg)
![[2013] FWCA 3966 - Amazon S3 · [2013] FWCA 3966 DECISION Fair Work Act 2009 s.185 -Application for approval of a single-enterprise agreement Pacific National (NSW) Pty Ltd and Asciano](https://img.pdfslide.us/doc/110x75/5e12d1e40894471f413c131e/2013-fwca-3966-amazon-s3-2013-fwca-3966-decision-fair-work-act-2009-s185.jpg)

![DECISION - fsunion.org.au · [2020] FWCA 3404 2 [6] The Agreement is approved and, in accordance with s.54 of the Act, will operate from 7July 2020. The nominal expiry date of the](https://img.pdfslide.us/doc/110x75/5fb4d1b745279c03333fe512/decision-2020-fwca-3404-2-6-the-agreement-is-approved-and-in-accordance-with.jpg)


![DECISION - · PDF file1 [2013] FWCA 2989 DECISION Fair Work Act 2009 s.185—Enterprise agreement Penleigh and Essendon Grammar School (AG2013/5915) PENLEIGH AND ESSENDON](https://img.pdfslide.us/doc/110x75/5a787d767f8b9a87198c0e37/decision-1-2013-fwca-2989-decision-fair-work-act-2009-s185enterprise.jpg)


![[2013] FWCA 137](https://img.pdfslide.us/doc/110x75/626a3a8c92f9590fd36dd426/2013-fwca-137.jpg)


![[2014] FWCA 3521](https://img.pdfslide.us/doc/110x75/61f24a111dba7e5aa443064e/2014-fwca-3521.jpg)
![DECISION - Amazon S3 · [2017] FWCA 769 2 [7] The Agreement is approved and, in accordance with s.54 of the Act, will operate from 13 February 2017. The nominal expiry date of the](https://img.pdfslide.us/doc/110x75/5e3c3fc207721301f3279ea4/decision-amazon-s3-2017-fwca-769-2-7-the-agreement-is-approved-and-in-accordance.jpg)