Embed Size (px)
Citation preview

K-1
APPENDIX K RADIUM AND THORIUM ISOTOPES AT THE HEMATITE SITE
(Note: The following report was prepared by Westinghouse, LLC)

K-2
THIS PAGE INTENTIONALLY LEFT BLANK.

EVALUATION OF THE PRESENCE OF RADIUM AND FISSION
PRODUCTS AT THE HEMATITE SITE
K-3
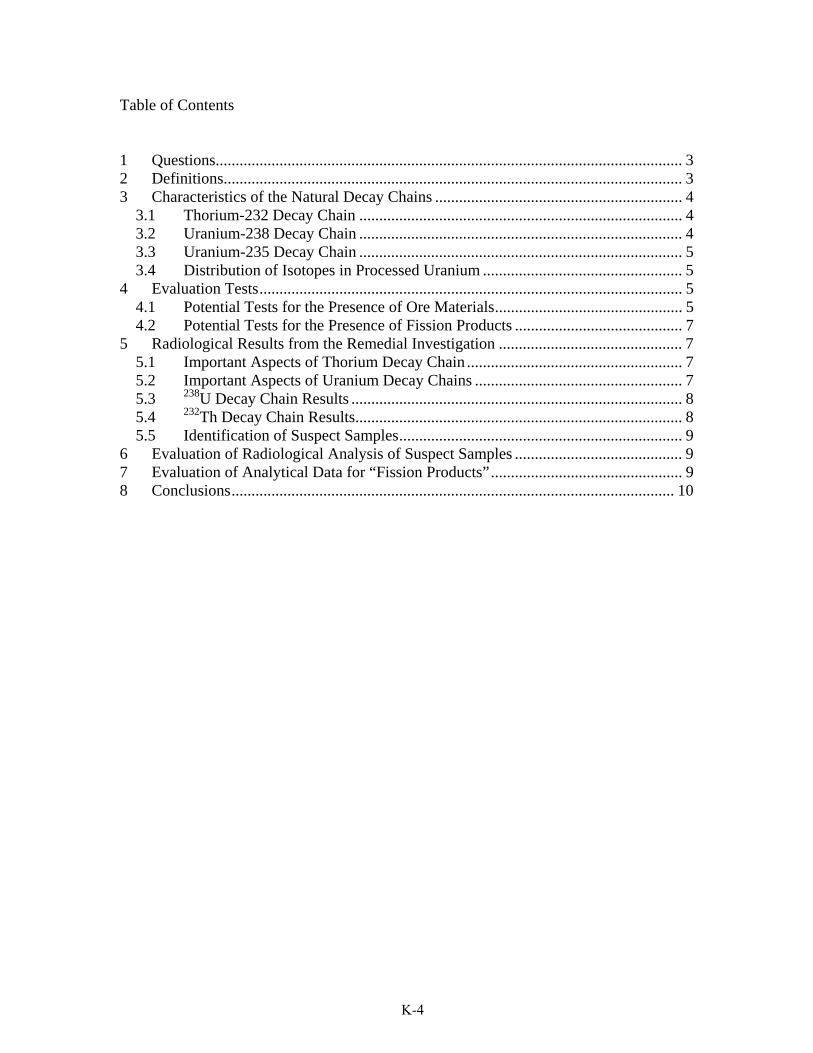
Table of Contents 1 Questions..................................................................................................................... 3 2 Definitions................................................................................................................... 3 3 Characteristics of the Natural Decay Chains .............................................................. 4
3.1 Thorium-232 Decay Chain ................................................................................. 4 3.2 Uranium-238 Decay Chain ................................................................................. 4 3.3 Uranium-235 Decay Chain ................................................................................. 5 3.4 Distribution of Isotopes in Processed Uranium .................................................. 5
4 Evaluation Tests.......................................................................................................... 5 4.1 Potential Tests for the Presence of Ore Materials............................................... 5 4.2 Potential Tests for the Presence of Fission Products .......................................... 7
5 Radiological Results from the Remedial Investigation .............................................. 7 5.1 Important Aspects of Thorium Decay Chain ...................................................... 7 5.2 Important Aspects of Uranium Decay Chains .................................................... 7 5.3 238U Decay Chain Results ................................................................................... 8 5.4 232Th Decay Chain Results.................................................................................. 8 5.5 Identification of Suspect Samples....................................................................... 9
6 Evaluation of Radiological Analysis of Suspect Samples .......................................... 9 7 Evaluation of Analytical Data for “Fission Products”................................................ 9 8 Conclusions............................................................................................................... 10
K-4
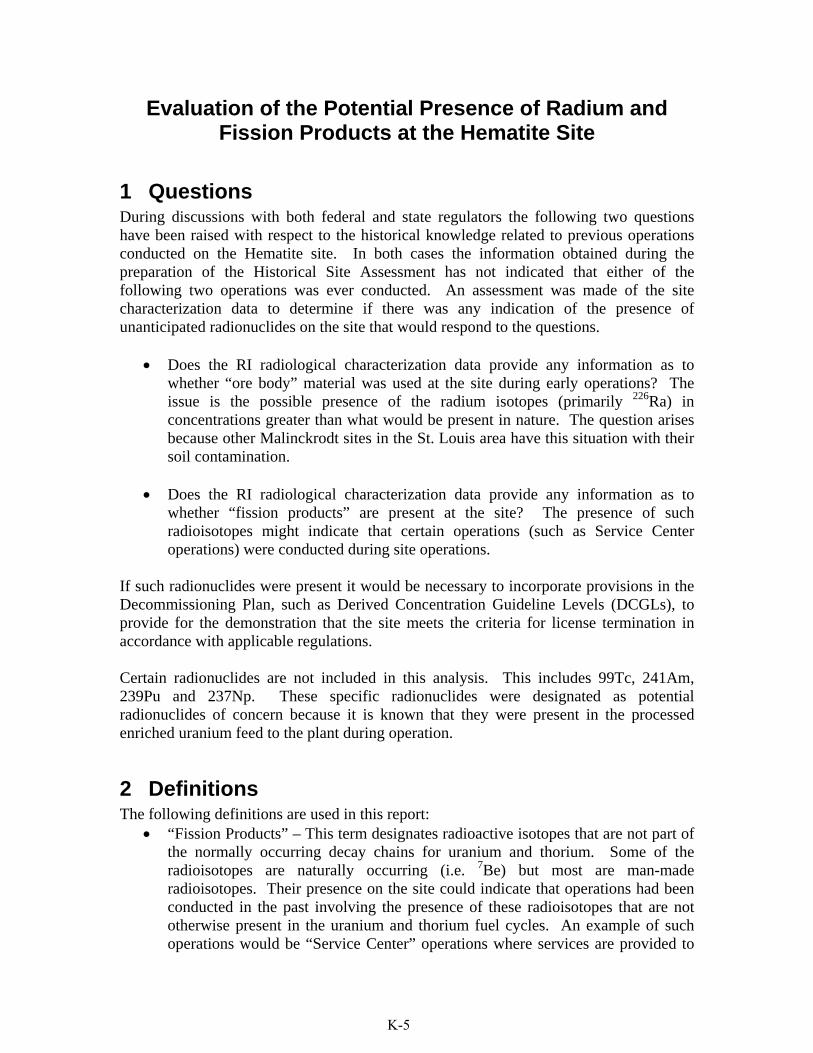
Evaluation of the Potential Presence of Radium and Fission Products at the Hematite Site
1 Questions During discussions with both federal and state regulators the following two questions have been raised with respect to the historical knowledge related to previous operations conducted on the Hematite site. In both cases the information obtained during the preparation of the Historical Site Assessment has not indicated that either of the following two operations was ever conducted. An assessment was made of the site characterization data to determine if there was any indication of the presence of unanticipated radionuclides on the site that would respond to the questions.
• Does the RI radiological characterization data provide any information as to whether “ore body” material was used at the site during early operations? The issue is the possible presence of the radium isotopes (primarily 226Ra) in concentrations greater than what would be present in nature. The question arises because other Malinckrodt sites in the St. Louis area have this situation with their soil contamination.
• Does the RI radiological characterization data provide any information as to
whether “fission products” are present at the site? The presence of such radioisotopes might indicate that certain operations (such as Service Center operations) were conducted during site operations.
If such radionuclides were present it would be necessary to incorporate provisions in the Decommissioning Plan, such as Derived Concentration Guideline Levels (DCGLs), to provide for the demonstration that the site meets the criteria for license termination in accordance with applicable regulations. Certain radionuclides are not included in this analysis. This includes 99Tc, 241Am, 239Pu and 237Np. These specific radionuclides were designated as potential radionuclides of concern because it is known that they were present in the processed enriched uranium feed to the plant during operation.
2 Definitions The following definitions are used in this report:
• “Fission Products” – This term designates radioactive isotopes that are not part of the normally occurring decay chains for uranium and thorium. Some of the radioisotopes are naturally occurring (i.e. 7Be) but most are man-made radioisotopes. Their presence on the site could indicate that operations had been conducted in the past involving the presence of these radioisotopes that are not otherwise present in the uranium and thorium fuel cycles. An example of such operations would be “Service Center” operations where services are provided to
K-5

operating nuclear power plants and could involve receiving contaminated tooling from the nuclear power plants that would introduce “fission products” to the site.
• “Ore Materials” – Ore body materials that contain concentrations of naturally occurring uranium and thorium at levels above normal background concentrations in soil and rock. Such ore materials will contain the progeny (i. e. 226Ra, 228Ra, etc.) associated with the naturally occurring 238U, 235U and 232Th decay chain series. Normally such ore materials are the tailings that exist after the ore body has been processed to extract certain mineral content such as uranium, thorium, tantalum. zirconium, etc. The decay chain progeny may or may not be in equilibrium with their respective parent radionuclides in these ore tailings depending on their processing history.
• “Processed Uranium” – Uranium that has been chemically purified as a step in the fuel fabrication process. This removes all of the decay chain progeny from the uranium and the process of in-growth of the progeny begins anew from the date of chemical separation.
3 Characteristics of the Natural Decay Chains
3.1 Thorium-232 Decay Chain The Th-232 decay chain scheme (4n Series) is given in Attachment K-1. Once Th-232 is chemically purified it will return to secular equilibrium as shown in the curves of Figure 4-1. Within about 30 years the entire chain has returned to secular equilibrium. Since historical site knowledge indicates that the potential uses of thorium on the site occurred prior to 1974 all of the thorium decay chain would be expected to be in secular equilibrium at this time regardless as to whether the thorium was brought to the site as chemically purified thorium or as ore material. Note that the Tl-208 concentration is less than 1 at secular equilibrium. This is because the branching fraction for the decay to Tl-208 is 36%.
3.2 Uranium-238 Decay Chain The U-238 decay chain scheme (4n+2 Series) is given in Attachment K-1. Once U-238 is chemically purified it will return to secular equilibrium as shown in the curves of Figure 4-2. This figure shows that the first two progeny of U-238 (Th-234 and Pa-234m) come back into secular equilibrium within approximately 30 days. The curves however are based on the premise that only U-238 is present at time zero. For natural uranium the U-234 activity will be equal to the U-238 activity. However when uranium is enriched to increase the concentration of U-235 the U-234 concentration is also increased. Figure 4-3 shows the in growth of the progeny after the uranium (natural or enriched) is chemically purified. From these curves it is obvious that it takes over 10 thousand years for the progeny after U-234 to return to secular equilibrium. The primary reason for this long time frame is the long half life of Th-230 (77,000 years). The primary radionuclide of concern in this decay chain is Ra-226 with a half life of 1,600 years. Figure 4-4 shows the in growth of the daughters after Ra-226. From this figure it is clear that all of the
K-6
progeny after Ra-226 return to secular equilibrium with the Ra-226 within about 30 days after separation.
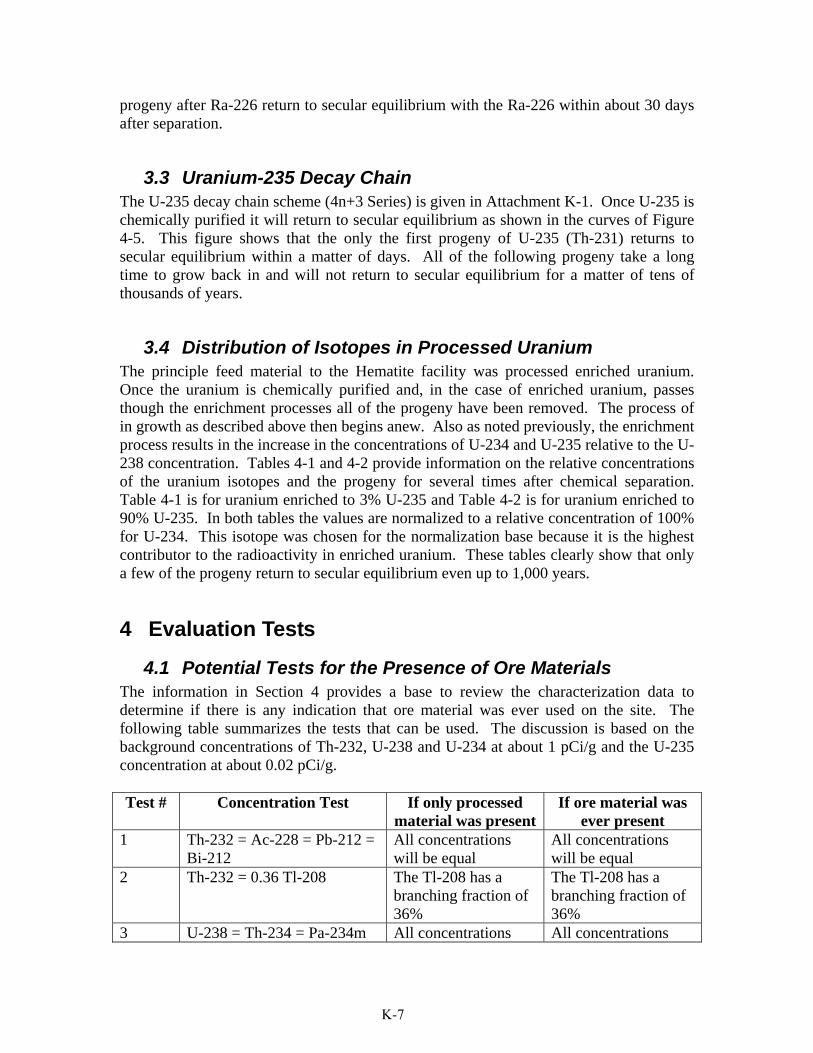
3.3 Uranium-235 Decay Chain The U-235 decay chain scheme (4n+3 Series) is given in Attachment K-1. Once U-235 is chemically purified it will return to secular equilibrium as shown in the curves of Figure 4-5. This figure shows that the only the first progeny of U-235 (Th-231) returns to secular equilibrium within a matter of days. All of the following progeny take a long time to grow back in and will not return to secular equilibrium for a matter of tens of thousands of years.
3.4 Distribution of Isotopes in Processed Uranium The principle feed material to the Hematite facility was processed enriched uranium. Once the uranium is chemically purified and, in the case of enriched uranium, passes though the enrichment processes all of the progeny have been removed. The process of in growth as described above then begins anew. Also as noted previously, the enrichment process results in the increase in the concentrations of U-234 and U-235 relative to the U-238 concentration. Tables 4-1 and 4-2 provide information on the relative concentrations of the uranium isotopes and the progeny for several times after chemical separation. Table 4-1 is for uranium enriched to 3% U-235 and Table 4-2 is for uranium enriched to 90% U-235. In both tables the values are normalized to a relative concentration of 100% for U-234. This isotope was chosen for the normalization base because it is the highest contributor to the radioactivity in enriched uranium. These tables clearly show that only a few of the progeny return to secular equilibrium even up to 1,000 years.
4 Evaluation Tests
4.1 Potential Tests for the Presence of Ore Materials The information in Section 4 provides a base to review the characterization data to determine if there is any indication that ore material was ever used on the site. The following table summarizes the tests that can be used. The discussion is based on the background concentrations of Th-232, U-238 and U-234 at about 1 pCi/g and the U-235 concentration at about 0.02 pCi/g. Test # Concentration Test If only processed
material was presentIf ore material was
ever present 1 Th-232 = Ac-228 = Pb-212 =
Bi-212 All concentrations will be equal
All concentrations will be equal
2 Th-232 = 0.36 Tl-208 The Tl-208 has a branching fraction of 36%
The Tl-208 has a branching fraction of 36%
3 U-238 = Th-234 = Pa-234m All concentrations All concentrations
K-7
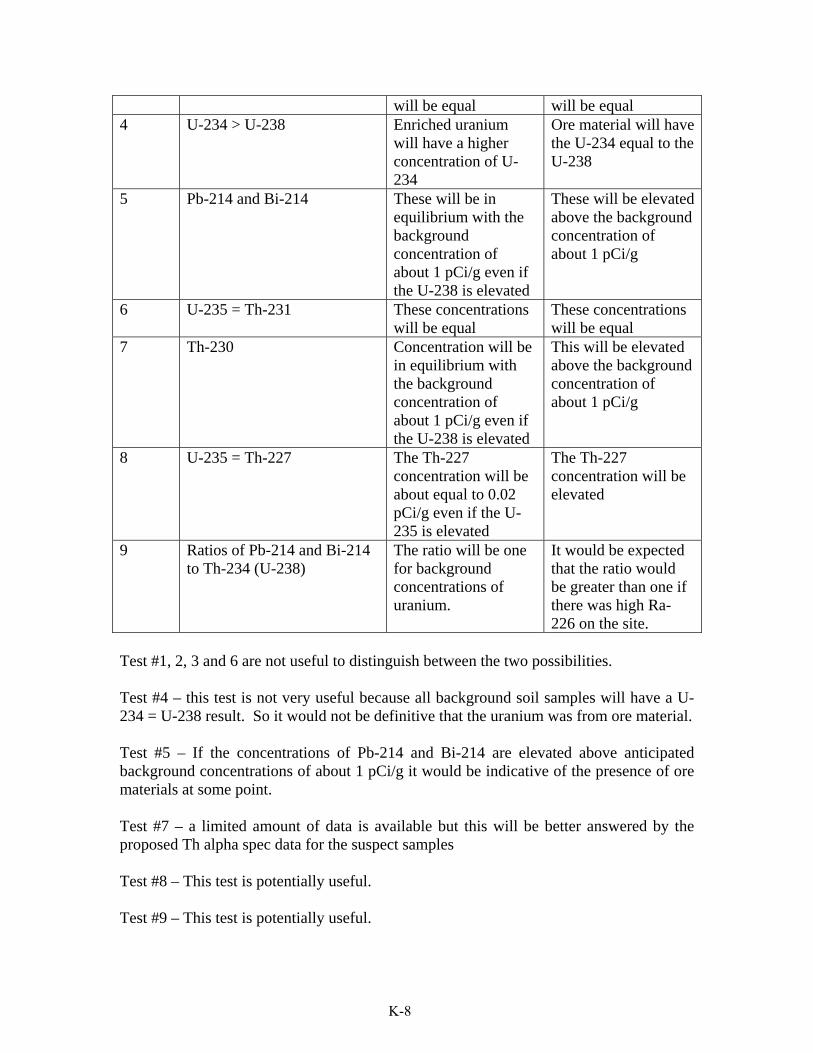
will be equal will be equal 4 U-234 > U-238 Enriched uranium
will have a higher concentration of U-234
Ore material will have the U-234 equal to the U-238
5 Pb-214 and Bi-214 These will be in equilibrium with the background concentration of about 1 pCi/g even if the U-238 is elevated
These will be elevated above the background concentration of about 1 pCi/g
6 U-235 = Th-231 These concentrations will be equal
These concentrations will be equal
7 Th-230 Concentration will be in equilibrium with the background concentration of about 1 pCi/g even if the U-238 is elevated
This will be elevated above the background concentration of about 1 pCi/g
8 U-235 = Th-227 The Th-227 concentration will be about equal to 0.02 pCi/g even if the U-235 is elevated
The Th-227 concentration will be elevated
9 Ratios of Pb-214 and Bi-214 to Th-234 (U-238)
The ratio will be one for background concentrations of uranium.
It would be expected that the ratio would be greater than one if there was high Ra-226 on the site.
Test #1, 2, 3 and 6 are not useful to distinguish between the two possibilities. Test #4 – this test is not very useful because all background soil samples will have a U-234 = U-238 result. So it would not be definitive that the uranium was from ore material. Test #5 – If the concentrations of Pb-214 and Bi-214 are elevated above anticipated background concentrations of about 1 pCi/g it would be indicative of the presence of ore materials at some point. Test #7 – a limited amount of data is available but this will be better answered by the proposed Th alpha spec data for the suspect samples Test #8 – This test is potentially useful. Test #9 – This test is potentially useful.
K-8
4.2 Potential Tests for the Presence of Fission Products Since most fission product radionuclides are not present in nature it is adequate to evaluate their concentration against the detection limit for the measurement protocol. In certain cases where the radioisotopes are present in nature, either due to production in nature (i.e. 7Be), natural occurrence (i.e.40K), or man made activities (i.e. 137Cs from fallout) it is appropriate to consider their concentrations in relation to reported levels in nature.
5 Radiological Results from the Remedial Investigation During the Remedial Investigation conducted at the Hematite site both surface and subsurface soil samples were collected across the site. In order to investigate the questions discussed in Section 2, all soil sample data was evaluated without regard to location or depth. No effort was made to restrict the samples that were included in the evaluation. The data is presented in graphs for which the specific sample results have been ordered from low to high. Thus the graphs do not provide any information with respect to location or depth of the result. However such information is not necessary for the evaluation since the tests described in Section 5 relate only to the magnitude of either the result or a ratio of results for the sample.
5.1 Important Aspects of Thorium Decay Chain • This decay chain achieves secular equilibrium in a short time frame of
approximately 30 years. • Ra-228 is the longest lived isotope (T½ = 5.8 years) of all the progeny. • All of the progeny follow the Ra-228 in-growth pattern (Figure 4.1).
If high concentrations of Ra-228 were present at the site due to the presence of ore materials in the ‘50s and ‘60s, the progeny would now be in secular equilibrium with the Th-232 parent. Thus the use of the isotopes in this decay chain cannot be used as indicators of whether ore material had ever been present at the site.
5.2 Important Aspects of Uranium Decay Chains • Once chemically purified, uranium will not reestablish secular equilibrium for a
long time (>1000 years). o Tables 4-1 and 4-2 present calculations based on the approach of LEU and
HEU to secular equilibrium after chemical purification. o Given the short time since plant startup in the 1950s there would not have
been any significant return to secular equilibrium for either the U-238 or U-235 decay chains.
o These factors can be used to determine if any “ore body” materials have ever been present at the site.
• The first two progeny (Pa-234m and Th-234) after the U-238 parent return to secular equilibrium with U-238 in about 100 days (Figure 4-2).
o It would be expected to find the first two progeny in equilibrium with U-238 concentrations at the site regardless of whether the U-238 represents
K-9

ore material or contamination from site operations using enriched uranium.
o Due to the long half life of Ra-226 secular equilibrium with chemically purified U-238 will not be reestablished for a long time.
o All progeny subsequent to Ra-226 will follow the Ra-226 concentration since secular equilibrium for this portion of the decay chain is reestablished within 30 days.
• The first progeny (Th-231) of U-235 reestablishes secular equilibrium within about two days after chemical purification of the uranium. All of the other progeny in the U-235 decay chain will not reestablish secular equilibrium for thousands of years after chemical separation. Thus if any of these later progeny are at concentrations greater than anticipated in the natural background it would be an indication of the presence of ore materials at the site at some time in the past.
As long as the Ra-226 (from the U-238 decay chain) and Ra-223 (from the U-235 decay chain) and their respective progeny are present in concentrations consistent with natural background levels then it is an indication that only processed uranium was used at the site.
5.3 238U Decay Chain Results Figure 4-6 provides graphical results for the characterization data for isotopes in the U-238 decay chain. From these it is clear that some of the Pa-234m and Th-234 concentrations are elevated above natural background concentrations. In contrast the concentrations of Pb-214 and Bi-214 are consistent with what would be anticipated with the natural background concentrations. These later two graphs have the shape of what would be expected for a normal distribution associated with radiological results. If any samples were consistent with the presence of ore material it would be those samples at the right hand end of the chart with the highest concentrations. The ten highest results for both the Pb-214 and Bi-214 curves were selected as possible indicator samples.
5.4 232Th Decay Chain Results Figure 4-7 provides graphical results for the characterization data for isotopes in the Th-232 decay chain. Only the graphs for the two progeny near the end of the decay chain (Pb-212 and Bi-212) are included. Most of these sample results are consistent with concentrations that would be expected in the natural background, some of the sample results (at the right hand side of the graph, are clearly elevated. Although the Th-232 decay chain would have already returned to secular equilibrium and would not in itself be a conclusive marker for the presence of ore material rather than thorium it was felt that samples high in Th-232 or its progeny might indicate samples that include ore materials if the sample were also high in Ra-226 from the U-238 chain. The ten highest results for both the Pb-212 and Bi-212 curves were selected as possible indicator samples.
K-10

5.5 Identification of Suspect Samples Table 4-3 shows the forty samples identified in Sections 6.3 and 6.4. From this set of forty samples, nine samples were selected for additional radiological analysis. The analytical results for these samples are discussed in the Section 7.
6 Evaluation of Radiological Analysis of Suspect Samples
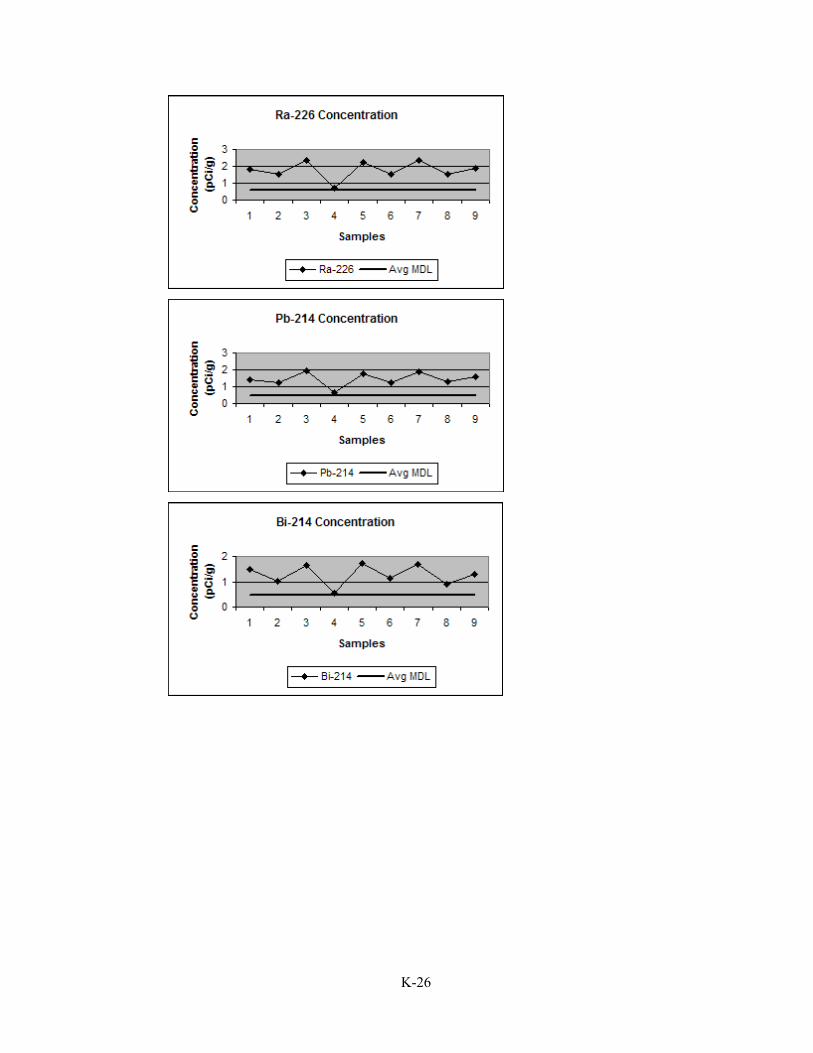
Sufficient material had been retained by the analytical laboratory to permit the additional analysis for Ra-226 for the nine samples that were selected for additional radiological analysis. For each sample the analysis included gamma spectrometry, uranium alpha spectrometry, thorium alpha spectrometry and Ra-226 analysis. The primary indicator for the presence of ore material would be the difference between the top and bottom progeny in the U-238 decay chain. If there was ore material present it would be expected that the bottom progeny (Ra-226, Pb-212 and Bi-214) would be elevated above the expected background levels. It is clear from the graphs presented in Figure 4-8 that even though some of the samples have high concentrations of uranium, the concentrations of the progeny below Th-230 are consistent with concentrations that would be anticipated in the natural background. The sample numbers in these figures are the same as the numbers given in Table 4-3. It can be concluded that the analytical results for these nine suspect samples does not indicate the presence of ore materials at the Hematite site.
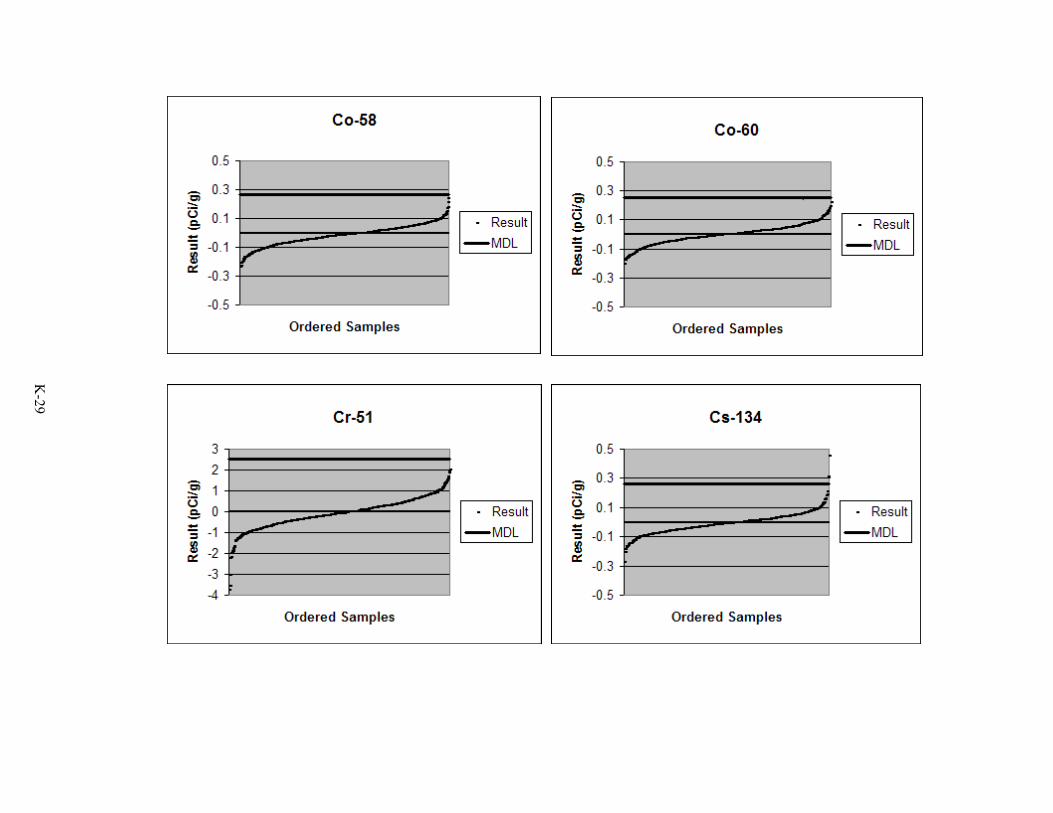
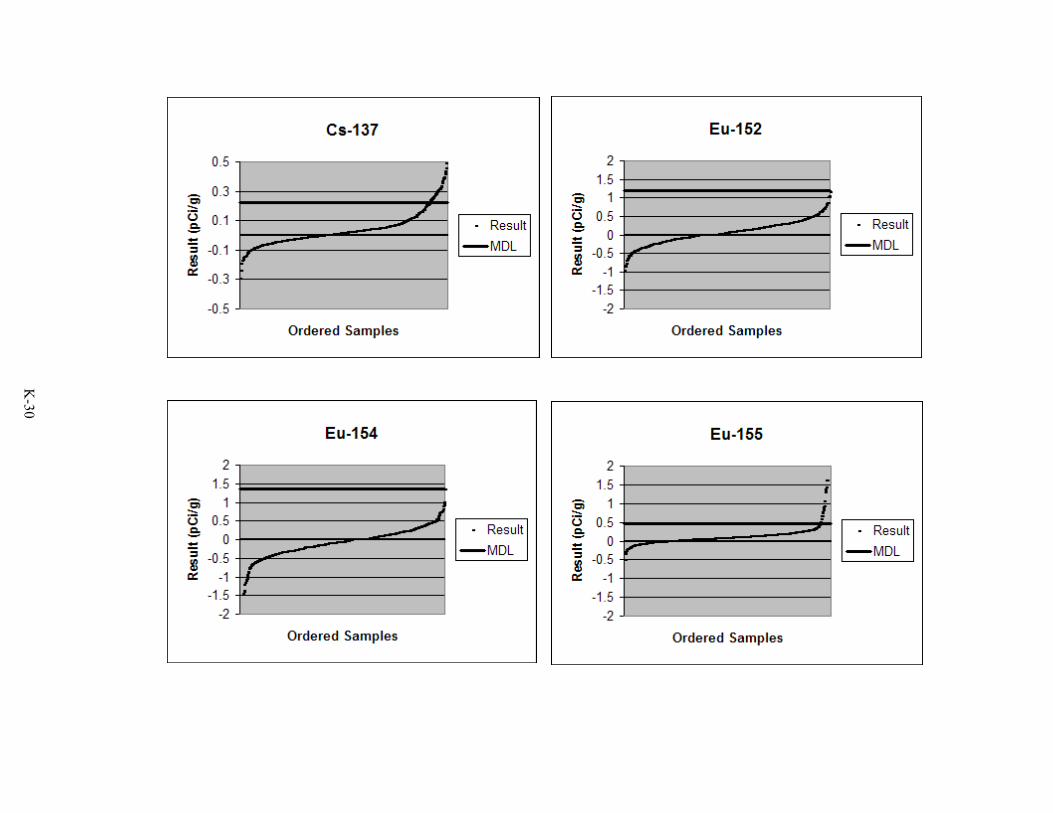
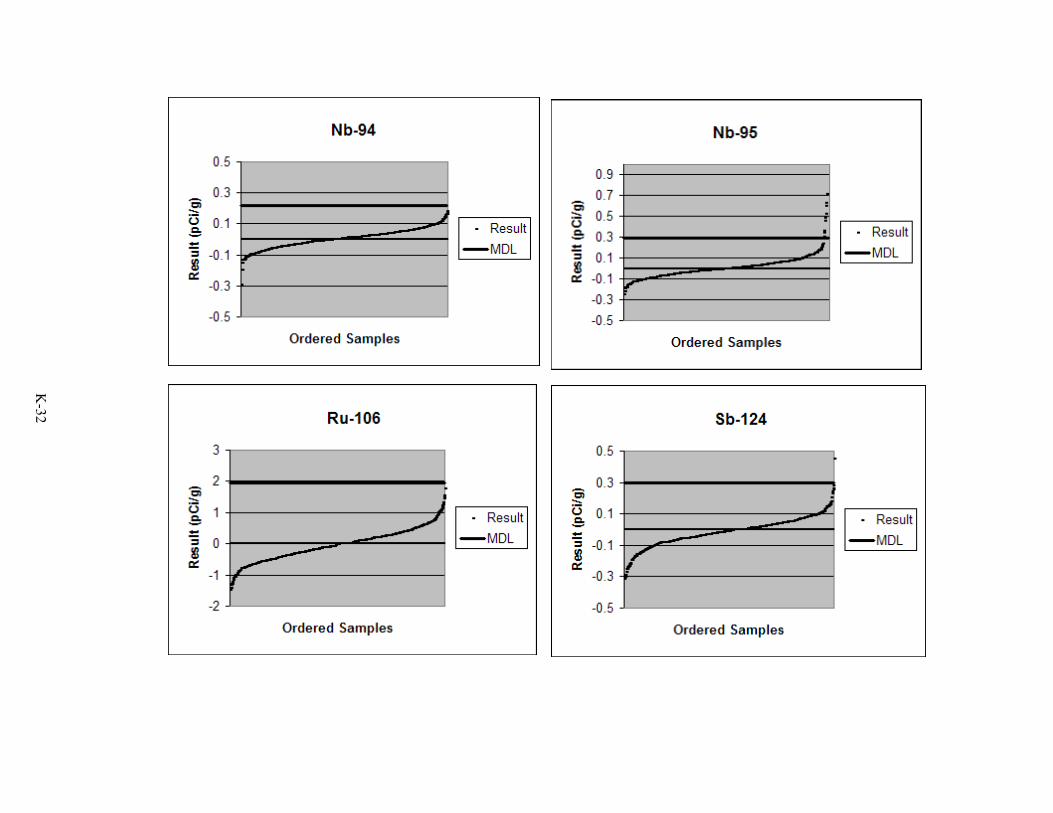
7 Evaluation of Analytical Data for “Fission Products” All of the characterization samples taken were analyzed by gamma spectrometry which will indicate all gamma emission peaks and attempt to identify the radionuclides present based on the energy of the peaks. This process is subject to some uncertainty because of overlapping energies of peaks and the fact that multiple radionuclides may emit gamma rays within the width of measured peaks. Table 4-4 identifies all of the radioisotopes, other than those associated with transuranics and the uranium and thorium decay chains, reported as part of the characterization results. The graphs in Figure 4-9 present the analytical data for each of the “fission product” radionuclides identified by gamma spectrometry measurements. For each chart the average minimum detectable level (MDL) is also shown. It is clear that most of the results are less than the MDL and therefore should be considered “non-detects”. In general the graphs take the form of normal distributions around zero. There are some exceptions that warranted further consideration. As an example, the chart for Cd-109 indicates that some specific sample results are greater than the MDL and could therefore considered as detectable activity. However since Cd-109 has a short half-life of 564 days it is unlikely to a result of site operations based on operational knowledge. A request was made of the analytical laboratory to review those samples that seemed to indicate positive results for certain fission product measurements. Appendix L provides the document that was prepared as a result of that review.
K-11
Based on the review of all of the characterization data for the “fission product” radionuclides it is apparent that the accumulated information indicates that these radionuclides are not present at the site due to licensed activities. Two radionuclides are present due to their natural occurrence (K-40, Be-7), and one is present due to fallout activity (Cs-137). The recommendation was made to remove all radionuclides from the analytical library for reporting purposes except for the following:
• K-40 and Be-7 as markers of natural radioactivity • Cs-137 and Co-60 as markers of fission product radionuclides. Although not
presently detected, they will continue to be reported. If elevated activities are noted their presence would be investigated.
• All radionuclides associated with the U-238, U-235 and Th-232 decay chain. • The transuranic radionuclides (Am-241, Np-237, and Pu-239/240.
8 Conclusions Based on the review conducted the conclusion is reached that based on the characterization data there is no indication that ore materials were ever handled at the Hematite site and therefore the radium isotopes and their progeny are not radioactive constituents of concern. Further there is no evidence that any of the other “fission product” radionuclides were identified to be radioactive constituents of concern. The continued analytical measurements (primarily by gamma spectrometry) of samples that will be taken during decommissioning activities will be sufficient to either validate these conclusions or identify the need to reevaluate the information.
K-12

TABLES
K-13

Tab
le 4
-1: C
alcu
latio
ns o
f rad
ioac
tivity
bas
ed o
n an
initi
al m
ixtu
re o
f pro
cess
ed u
rani
um a
t 3%
enr
ichm
ent.
Tim
e (y
ears
) U
-238
Th
-234
P
a-23
4m
U-2
34
Th-2
30
Ra-
226
Rn-
222
Po-
218
Pb-
214
Bi-2
14
3 28
%
27%
27
%
100%
0.
003%
0.
0000
02%
0.
0000
02%
0.
0000
02%
0.
0000
02%
0.
0000
02%
51
28%
27
%
27%
10
0%
0.04
7%
0.00
051%
0.
0005
1%
0.00
051%
0.
0005
1%
0.00
052%
75
28
%
27%
27
%
100%
0.
069%
0.
0011
%
0.00
11%
0.
0011
%
0.00
11%
0.
0011
%
1,00
0 28
%
27%
27
%
100%
0.
91%
0.
17%
0.
17%
0.
17%
0.
17%
0.
17%
25
,000
28
%
27%
27
%
95%
20
%
18%
18
%
18%
18
%
18%
Tim
e (y
ears
) U
-235
Th
-231
P
a-23
1 A
c-22
7 Th
-227
R
a-22
7 R
n-21
9 P
o-21
5 P
b-21
1 B
i-211
3 5.
5%
5.5%
0.
0003
3%
0.00
002%
0.
0000
1%
0.00
001%
0.
0000
1%
0.00
001%
0.
0000
1%
0.00
001%
51
5.
5%
5.5%
0.
0056
%
0.00
28%
0.
0028
%
0.00
28%
0.
0028
%
0.00
28%
0.
0028
%
0.00
28%
75
5.
5%
5.5%
0.
0083
%
0.00
51%
0.
0051
%
0.00
51%
0.
0051
%
0.00
51%
0.
0051
%
0.00
51%
1,
000
5.5%
5.
5%
0.11
%
0.11
%
0.11
%
0.11
%
0.11
%
0.11
%
0.11
%
0.11
%
25,0
00
5.5%
5.
5%
2.2%
2.
2%
2.2%
2.
2%
2.2%
2.
2%
2.2%
2.
2%
T
able
4-2
: Cal
cula
tions
of r
adio
activ
ity b
ased
on
an in
itial
mix
ture
of p
roce
ssed
ura
nium
at 9
0% e
nric
hmen
t. Ti
me
(yea
rs)
U-2
38
Th-
234
Pa-
234m
U
-234
Th
-230
R
a-22
6 R
n-22
2 P
o-21
8 P
b-21
4 B
i-214
3 0.
056%
0.
055%
0.
055%
10
0%
0.00
28%
0.
0000
02%
0.
0000
02%
0.
0000
02%
0.
0000
02%
0.
0000
02%
51
0.05
6%
0.05
5%
0.05
5%
100%
0.
047%
0.
0005
1%
0.00
051%
0.
0005
1%
0.00
051%
0.
0005
2%
75
0.05
6%
0.05
5%
0.05
5%
100%
0.
069%
0.
0011
%
0.00
11%
0.
0011
%
0.00
11%
0.
0011
%
1,00
0 0.
056%
0.
055%
0.
055%
10
0%
0.91
%
0.17
%
0.17
%
0.17
%
0.17
%
0.17
%
25,0
00
0.05
6%
0.05
5%
0.05
5%
93%
20
%
18%
18
%
18%
18
%
18%
Tim
e (y
ears
) U
-235
Th
-23
1 P
a-23
1 A
c-22
7 Th
-227
R
a-22
7 R
n-21
9 P
o-21
5 P
b-21
1 B
i-211
3 3.
2%
3.2%
0.
0002
0%
0.00
001%
0.
0000
1%
0.00
001%
0.
0000
1%
0.00
001%
0.
0000
1%
0.00
001%
51
3.
2%
3.2%
0.
0033
%
0.00
17%
0.
0017
%
0.00
17%
0.
0017
%
0.00
17%
0.
0017
%
0.00
17%
75
3.
2%
3.2%
0.
0049
%
0.00
30%
0.
0030
%
0.00
30%
0.
0030
%
0.00
30%
0.
0030
%
0.00
30%
1,
000
3.2%
3.
2%
0.06
5%
0.06
3%
0.06
3%
0.06
3%
0.06
3%
0.06
3%
0.06
3%
0.06
3%
25,0
00
3.2%
3.
2%
1.3%
1.
3%
1.3%
1.
3%
1.3%
1.
3%
1.3%
1.
3%
K-14
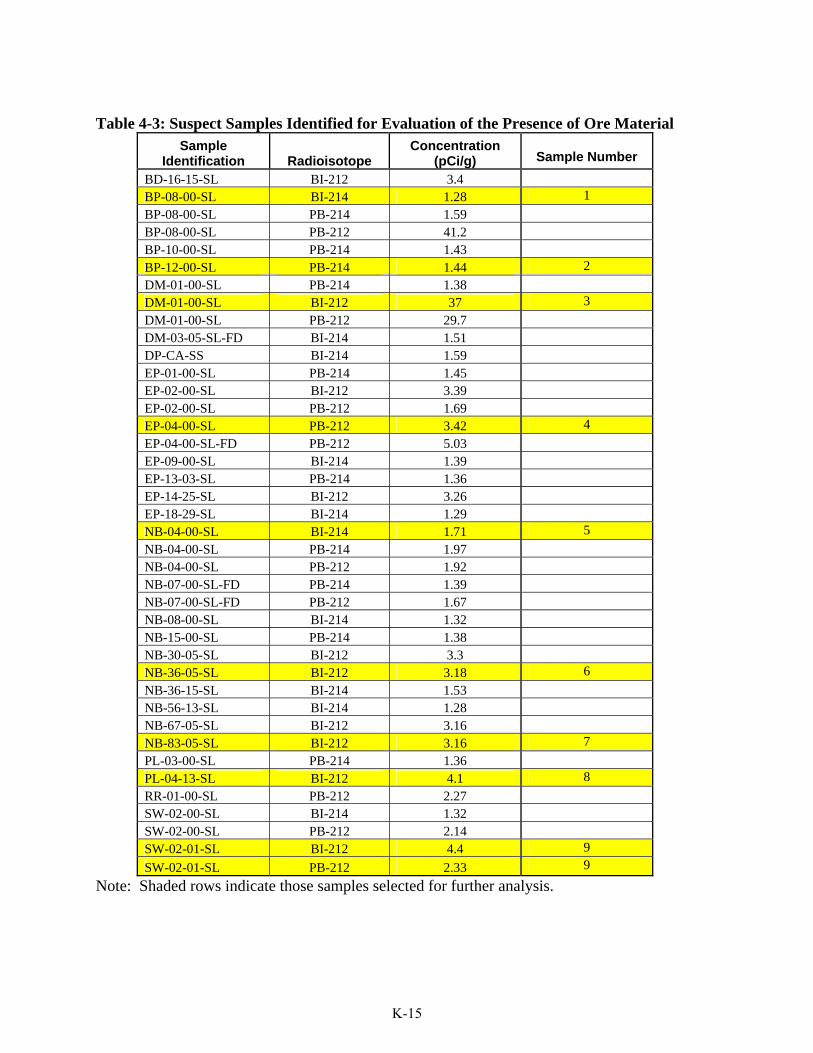
Table 4-3: Suspect Samples Identified for Evaluation of the Presence of Ore Material
Sample Identification Radioisotope
Concentration (pCi/g)
Sample Number
BD-16-15-SL BI-212 3.4 BP-08-00-SL BI-214 1.28 1 BP-08-00-SL PB-214 1.59 BP-08-00-SL PB-212 41.2 BP-10-00-SL PB-214 1.43 BP-12-00-SL PB-214 1.44 2 DM-01-00-SL PB-214 1.38 DM-01-00-SL BI-212 37 3 DM-01-00-SL PB-212 29.7 DM-03-05-SL-FD BI-214 1.51 DP-CA-SS BI-214 1.59 EP-01-00-SL PB-214 1.45 EP-02-00-SL BI-212 3.39 EP-02-00-SL PB-212 1.69 EP-04-00-SL PB-212 3.42 4 EP-04-00-SL-FD PB-212 5.03 EP-09-00-SL BI-214 1.39 EP-13-03-SL PB-214 1.36 EP-14-25-SL BI-212 3.26 EP-18-29-SL BI-214 1.29 NB-04-00-SL BI-214 1.71 5 NB-04-00-SL PB-214 1.97 NB-04-00-SL PB-212 1.92 NB-07-00-SL-FD PB-214 1.39 NB-07-00-SL-FD PB-212 1.67 NB-08-00-SL BI-214 1.32 NB-15-00-SL PB-214 1.38 NB-30-05-SL BI-212 3.3 NB-36-05-SL BI-212 3.18 6 NB-36-15-SL BI-214 1.53 NB-56-13-SL BI-214 1.28 NB-67-05-SL BI-212 3.16 NB-83-05-SL BI-212 3.16 7 PL-03-00-SL PB-214 1.36 PL-04-13-SL BI-212 4.1 8 RR-01-00-SL PB-212 2.27 SW-02-00-SL BI-214 1.32 SW-02-00-SL PB-212 2.14 SW-02-01-SL BI-212 4.4 9 SW-02-01-SL PB-212 2.33 9
Note: Shaded rows indicate those samples selected for further analysis.
K-15

Table 4-4: Radionuclides Identified by Gamma Spectrometry Radioisotope Potential Source Half Life
Ag-110m Unknown, not a FP T1/2 =250 days Al-26 Unknown, not a FP T1/2 =710,000 years Be-7 Cosmogenic radionuclide T1/2 =53 days Cd-109 Unknown, not a FP T1/2 =564 days Ce-139 Unknown, not a FP T1/2 =138 days Ce-144 FP T1/2 =284 days Co-56 Unknown, not a FP T1/2 =78.7 days Co-57 Unknown, not a FP T1/2 =271 days Co-58 Unknown, not a FP T1/2 =70.8 days Co-60 Unknown, not a FP T1/2 =5.27 years Cr-51 Unknown, not a FP T1/2 =27.7 days Cs-134 FP T1/2 =2.06 years Cs-137 FP, also present in
environment from weapons fallout
T1/2 =30.1 years
Eu-152 Unknown, not a FP T1/2 =13.6years Eu-154 FP T1/2 =8.8years Eu-155 FP T1/2 =4.96years Fe-55 Not a FP, is produced in
reactors from neutron activation
T1/2 =2.7years
I-131 FP T1/2 =8days Mn-54 Not a FP, is produced in
reactors from neutron activation
T1/2 =312.7 days
Na-22 Unknown, not a FP T1/2 =2.6 years Nb-94 Unknown, not a FP T1/2 =20,3000 years Nb-95 FP T1/2 =35 days Ru-106 FP T1/2 =368 days Sb-124 FP T1/2 =60.2 days Sb-125 FP T1/2 =2.77 years Sc-46 Unknown, not a FP T1/2 =83.8 days Zn-65 Unknown, not a FP T1/2 =244 days
Note : FP = fission product
K-16

FIGURES
K-17
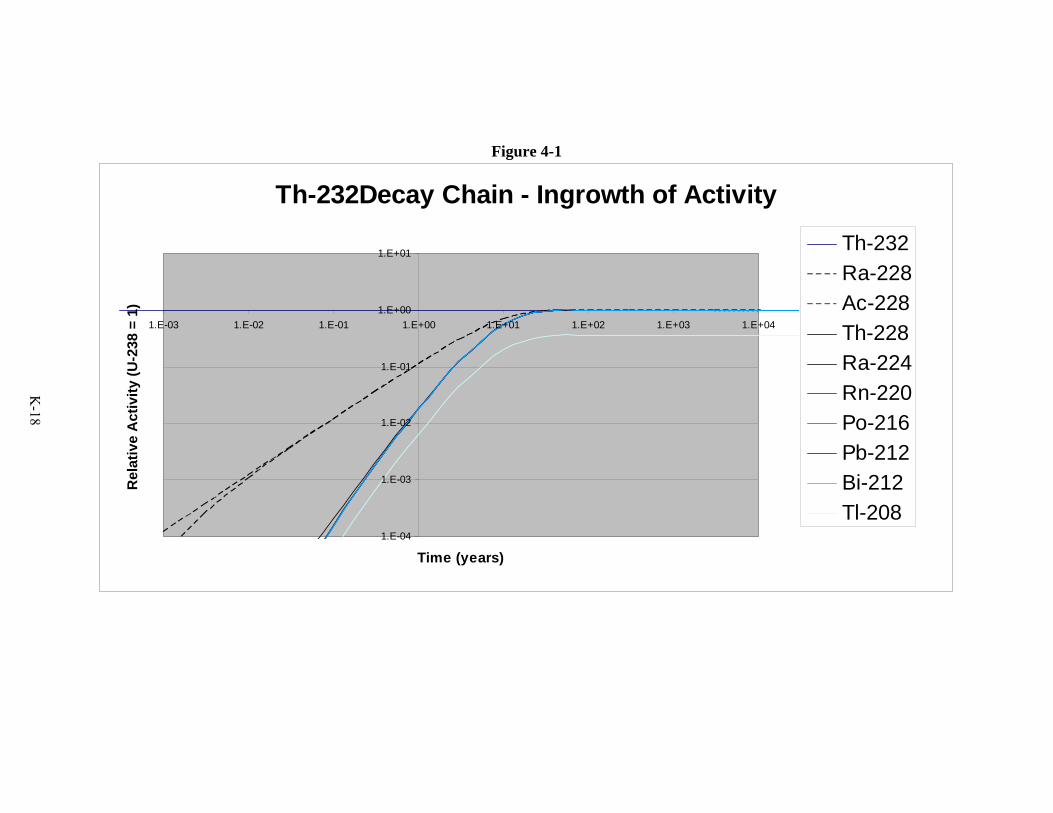
Figure 4-1
Th-232Decay Chain - Ingrowth of Activity
1.E-04
1.E-03
1.E-02
1.E-01
1.E+00
1.E+01
1.E-03 1.E-02 1.E-01 1.E+00 1.E+01 1.E+02 1.E+03 1.E+04
Time (years)
Rel
ativ
e A
ctiv
ity (U
-238
= 1
)
Th-232Ra-228Ac-228Th-228Ra-224Rn-220Po-216Pb-212Bi-212Tl-208
K-18 K
-18

Figure 4-2
U-238 Decay Chain - Ingrowth of Activity
1.E-08
1.E-07
1.E-06
1.E-05
1.E-04
1.E-03
1.E-02
1.E-01
1.E+00
1.E+01
1.E-03 1.E-02 1.E-01 1.E+00 1.E+01 1.E+02 1.E+03 1.E+04 1.E+05 1.E+06 1.E+07 1.E+08
Time (years)
Rel
ativ
e A
ctiv
ity (U
-238
= 1
)
U-238Th-234Pa-234mU-234Th-230Ra-226Rn-222Po-218Pb-214Bi-214
K-19

Figure 4-3
U-234 Decay Chain - Ingrowth of Activity
1.E-04
1.E-03
1.E-02
1.E-01
1.E+00
1.E+01
1.E+01 1.E+02 1.E+03 1.E+04 1.E+05
Time (years)
Rel
ativ
e A
ctiv
ity (U
-234
= 1
)
U-234Th-230Ra-226Rn-222Po-218Pb-214Bi-214
K-20
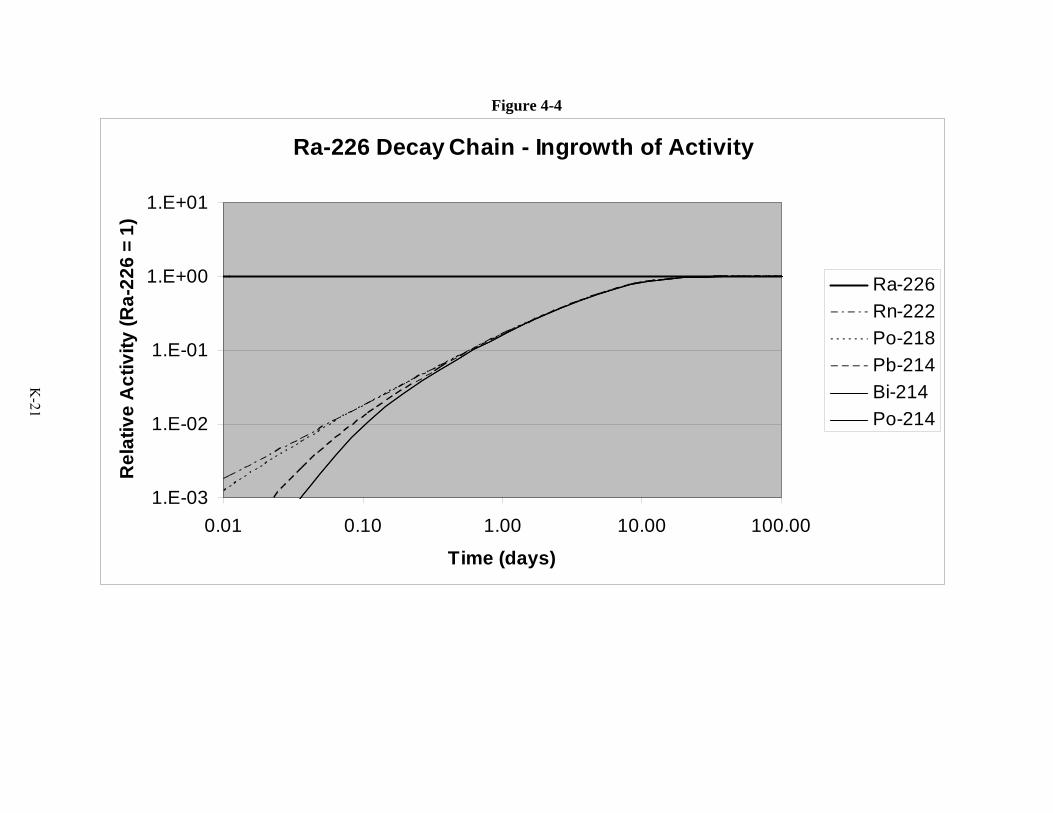
Figure 4-4
Ra-226 Decay Chain - Ingrowth of Activity
1.E-03
1.E-02
1.E-01
1.E+00
1.E+01
0.01 0.10 1.00 10.00 100.00
Time (days)
Rel
ativ
e A
ctiv
ity (R
a-22
6 =
1)
Ra-226Rn-222Po-218Pb-214Bi-214Po-214
K-21

Figure 4-5
U-235 Chain - Ingrowth of Activity
1.E-05
1.E-04
1.E-03
1.E-02
1.E-01
1.E+001.E-05 1.E-04 1.E-03 1.E-02 1.E-01 1.E+00 1.E+01 1.E+02 1.E+03 1.E+04 1.E+05
Time (years)
Act
ivity
U-235Th-231Pa-231Ac-227Th-227Ra-223Rn-219Po -215Pb-211Bi-211
All other progeny
K-22

Figure 4-6 Gamma Spectrometry Results for the U-238 Decay Chain
Pa-234m Results (n=519)
0.1
1
10
100
Ordered Sample Results
Con
cent
ratio
n (p
Ci/g
Pa-234m MDL
Th-234 Results (n=519)
0.0010.01
0.11
10100
1000
Ordered Sample Results
Con
cent
ratio
n (p
Ci/g
Th-234 MDL
Pb-214 Results (n=519)
-0.5
00.5
1
1.52
2.5
Ordered Sample Results
Con
cent
ratio
n (p
Ci/g
Pb-214 MDL
Bi-214 Results (n=519)
-0.5
0
0.5
1
1.5
2
Ordered Sample Results
Con
cent
ratio
n (p
Ci/g
Bi-214 MDL
K-23
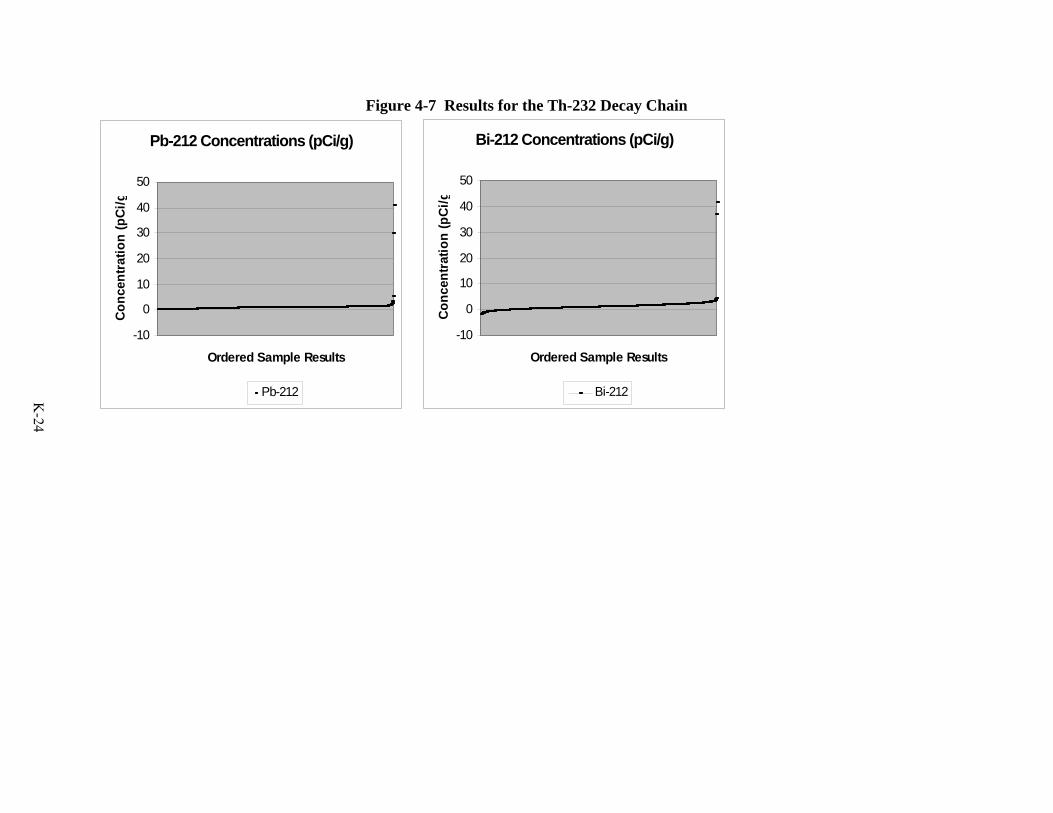
Figure 4-7 Results for the Th-232 Decay Chain
Pb-212 Concentrations (pCi/g)
-10
0
10
20
30
40
50
Ordered Sample Results
Conc
entra
tion
(pCi
/g
Pb-212
Bi-212 Concentrations (pCi/g)
-10
0
10
20
30
40
50
Ordered Sample Results
Conc
entr
atio
n (p
Ci/g
Bi-212
K-24

Figure 4-8 Analytical Results for Nine Suspect Samples (U-238 Decay Chain)
K-25
K-26

Figure 4-9: Fission Product Analytical Results for Characterization Data
K-27

K-28
K-29
K-30

K-31
K-32

K-33
ATTACHMENT K-1
Radioactive Decay Chain Series
K-34

Uranium-238 Decay Chain Series (4n+2 Series)
K-35
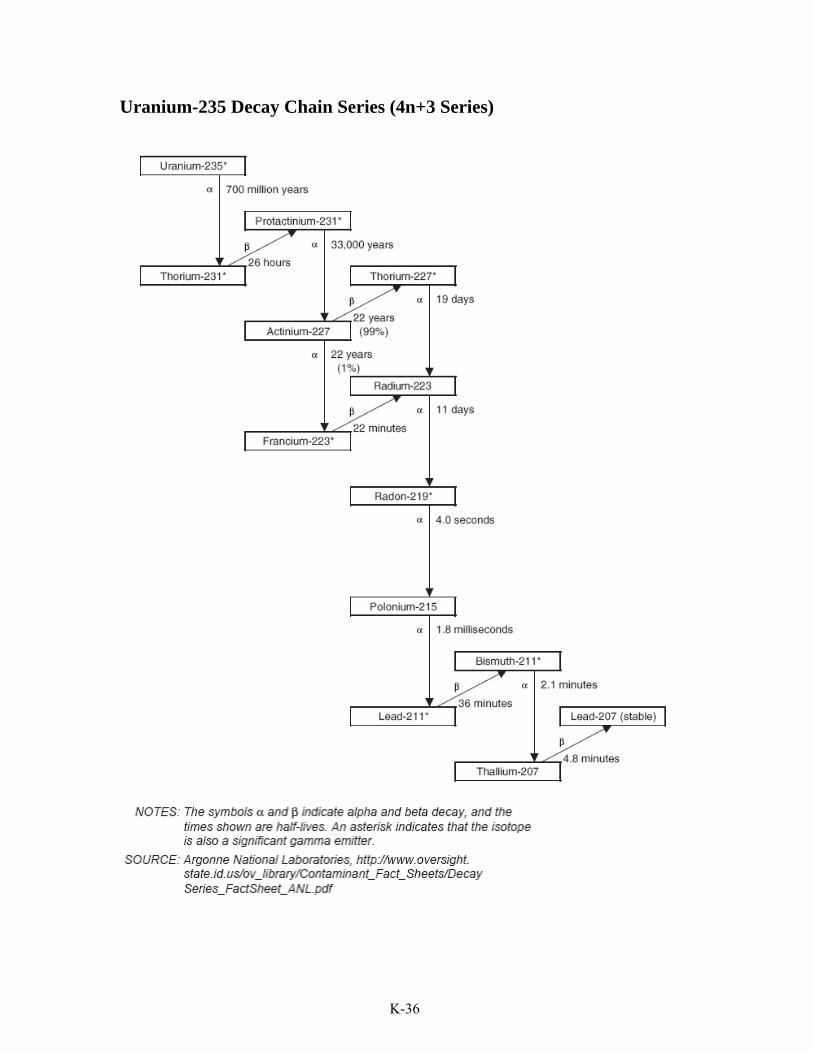
Uranium-235 Decay Chain Series (4n+3 Series)
K-36
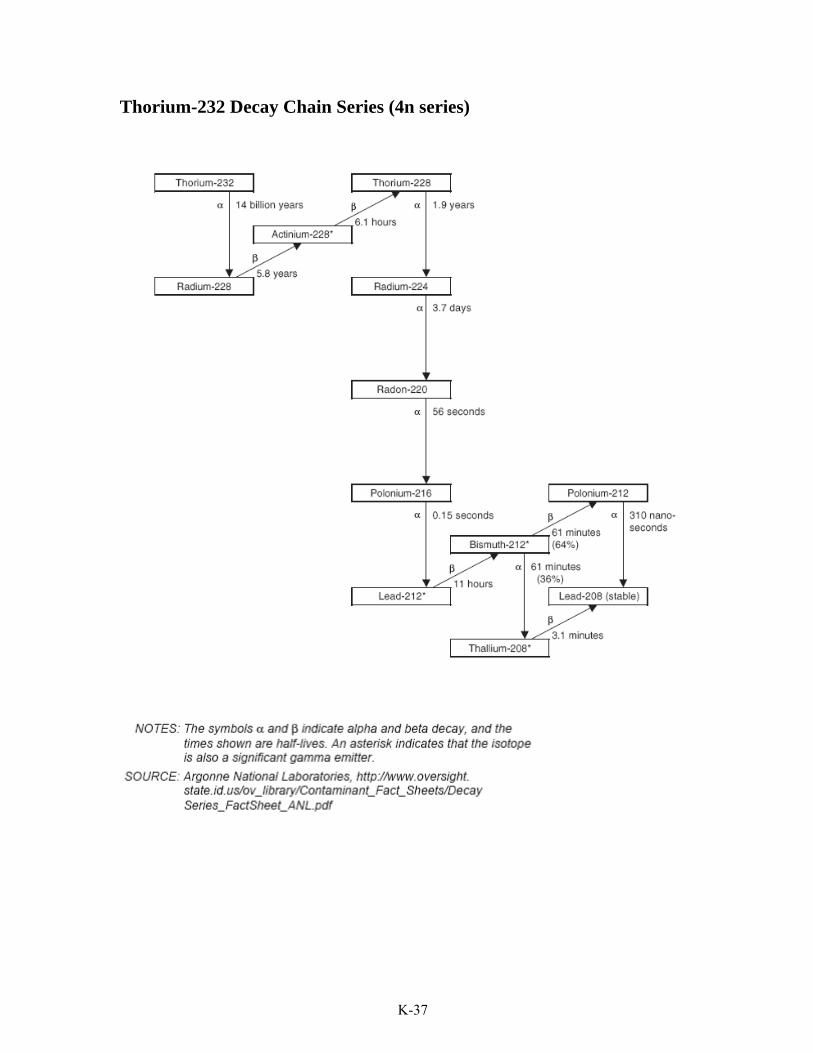
Thorium-232 Decay Chain Series (4n series)
K-37

05-064(E)/101205
THIS PAGE INTENTIONALLY LEFT BLANK.
K-38