Embed Size (px)
Citation preview
Appendix K. Method Development and Discussion of Analysis by Batelle Laboratory
October 16, 2001
Dr Randy Segawa Senior Environmental Research Scientist California Environmental Protection Agency Department of Pesticide Regulation 1001 I St PO Box 4015 Sacramento, CA 95812-4015
Re: Final Report - Development of Methods for the Extraction and Analysis of Air Samples for Selected Pesticides Collected on XAD-4. CDPR Agreement 99-0245.
Dear Randy:
Enclosed are two copies of the Final Report for the Development of Methods for the Extraction and Analysis of Air Samples for Selected Pesticides Collected on XAD-4, CDPR Agreement 99- 0245. I have added the information you requested on the trappingkxtraction efficiency experiment. If you have any further questions, please contact me either by phone at 614-424- 7210 or by email at [email protected].
Sincerely, n
kAd4y Donald V. Kenny
Principal Research SciGtist Atmospheric Science and Applied Technology Department
DVK:llg
Enclosures
Development of Methods for the Extraction and Analysis of Air Samples for Selected Pesticides
Collected on XAD-4
For
California Department of Pesticide Regulation Agreement 99-0245
Battelle Memorial Institute 505 King Avenue
Columbus, OH 43201
October 16,2001
Introduction Battelle proposed to develop an extraction and LCIMSIMS method for the analysis of selected pesticides from air samples. The California Department of Pesticide Regulation (CADPR) selected XAD-4 as the sampling medium. The CAPDR also indicated that 30 mL of XAD-4 would be used in the samplers, and that the air would be sampled at 30 Ymin for 24 hour sampling periods. With this sampling framework as a background, Battelle conducted the study that is summarized in the following report.
List of Target Analytes
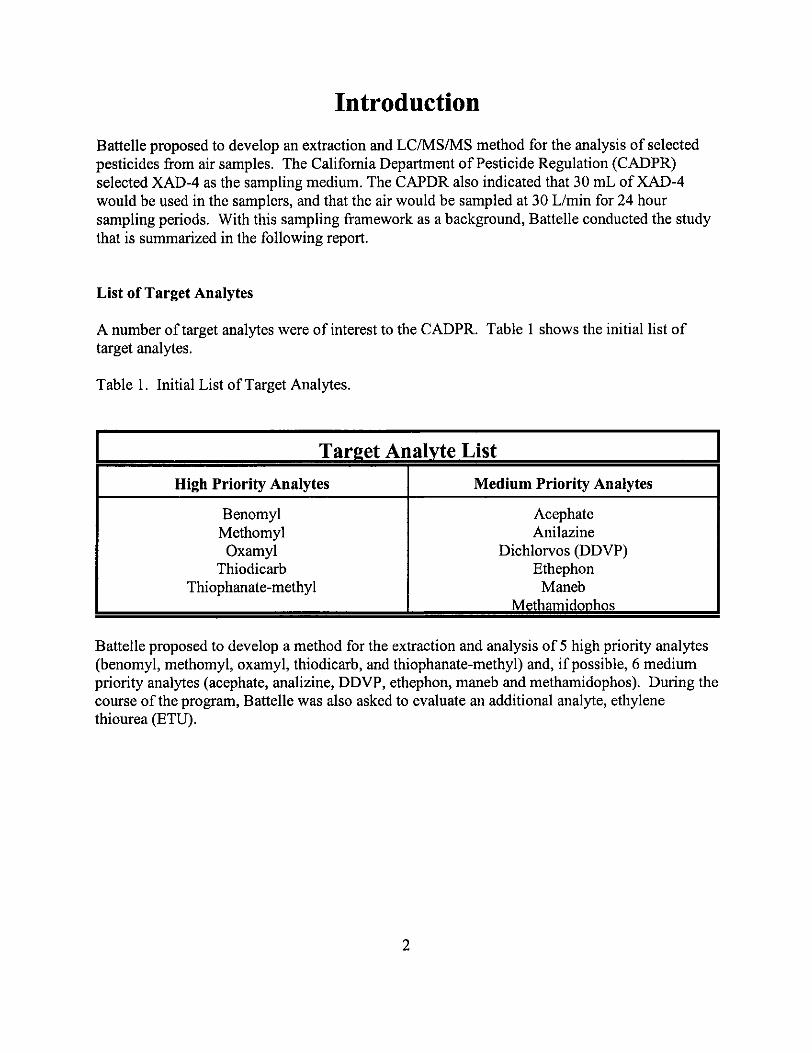
A number of target analytes were of interest to the CADPR. Table 1 shows the initial list of target analytes.
Table 1. Initial List of Target Analytes.
Target Analvte List ~
High Priority Analytes Medium Priority Analytes
Benomyl Acephate Methomyl
Thiodicarb Dichlorvos (DDVP) Oxamyl
Anilazine
Ethephon Thiouhanate-methyl Maneb
Battelle proposed to develop a method for the extraction and analysis of 5 high priority analytes (benomyl, methomyl, oxamyl, thiodicarb, and thiophanate-methyl) and, if possible, 6 medium priority analytes (acephate, analizine, DDVP, ethephon, maneb and methamidophos). During the course of the program, Battelle was also asked to evaluate an additional analyte, ethylene thiourea (ETU).
2
Task 1. Method Development for Analysis of Selected Pesticides
The method development and validation included the following sub-tasks:
- Determine “best” ionization mode and conditions for analytes - Obtain MSMS spectrum for each target analyte - Select 2 - 3 precursor/fragment ion transitions for selected ion monitoring
- Develop chromatographic method using selected ion transitions - Determine laboratory detection limits and quantitation limits using the EPA
experiments
Method (40 CFR, Part 136, Appendix B)
MS/MS Spectra of the Target Analytes
All of the target analytes were first tested using positive and negative ion atmospheric pressure chemical ionization (APCI) modes. The target analytes were then tested using positive and negative ion electrospray ionization (ESI) modes. Each ionization mode takes advantage of the physicaVchemica1 properties of the molecules.
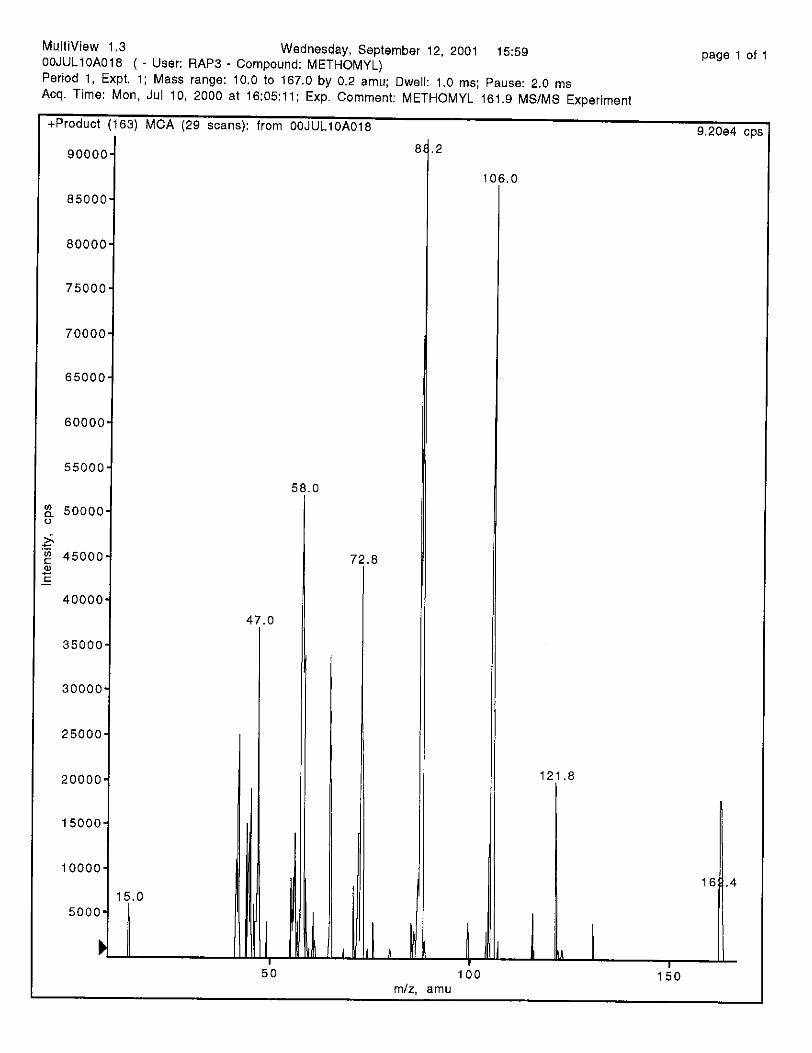
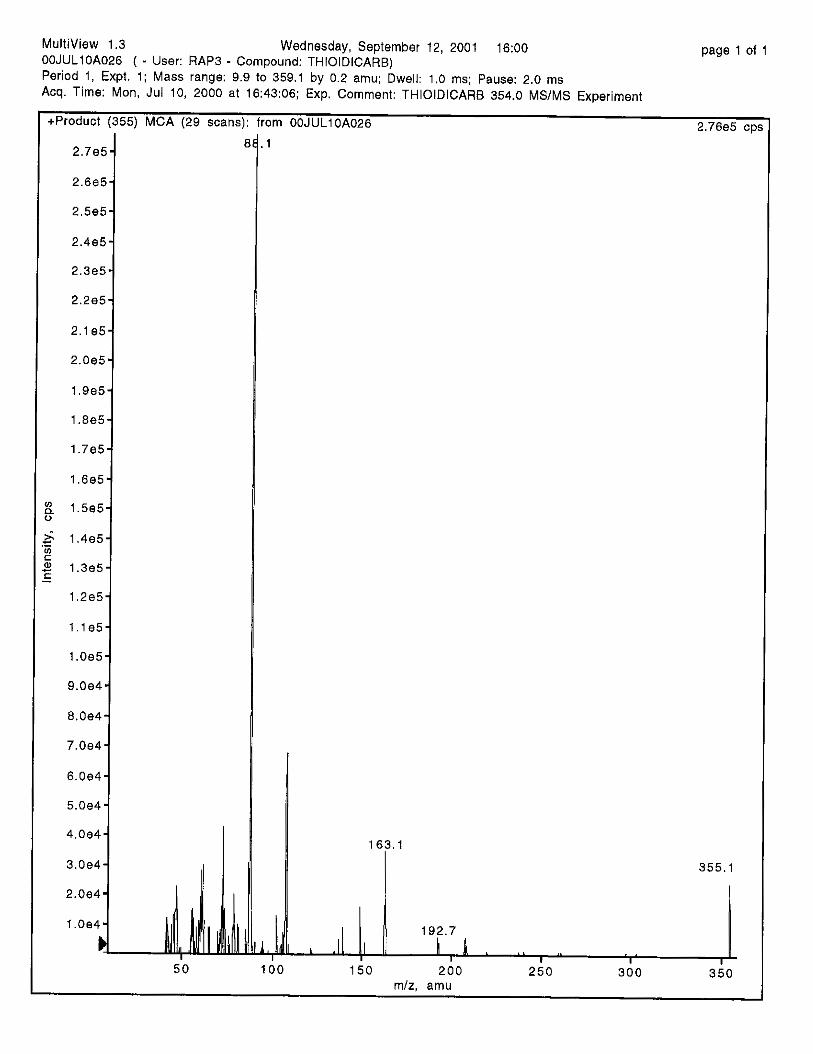
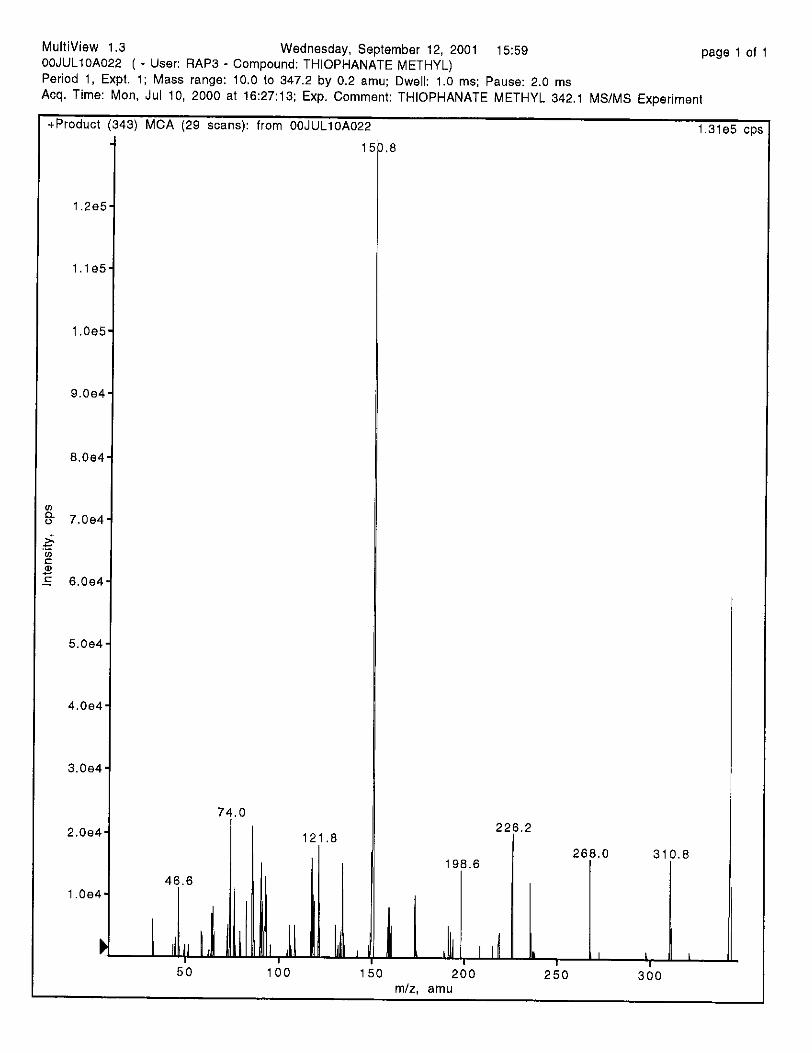
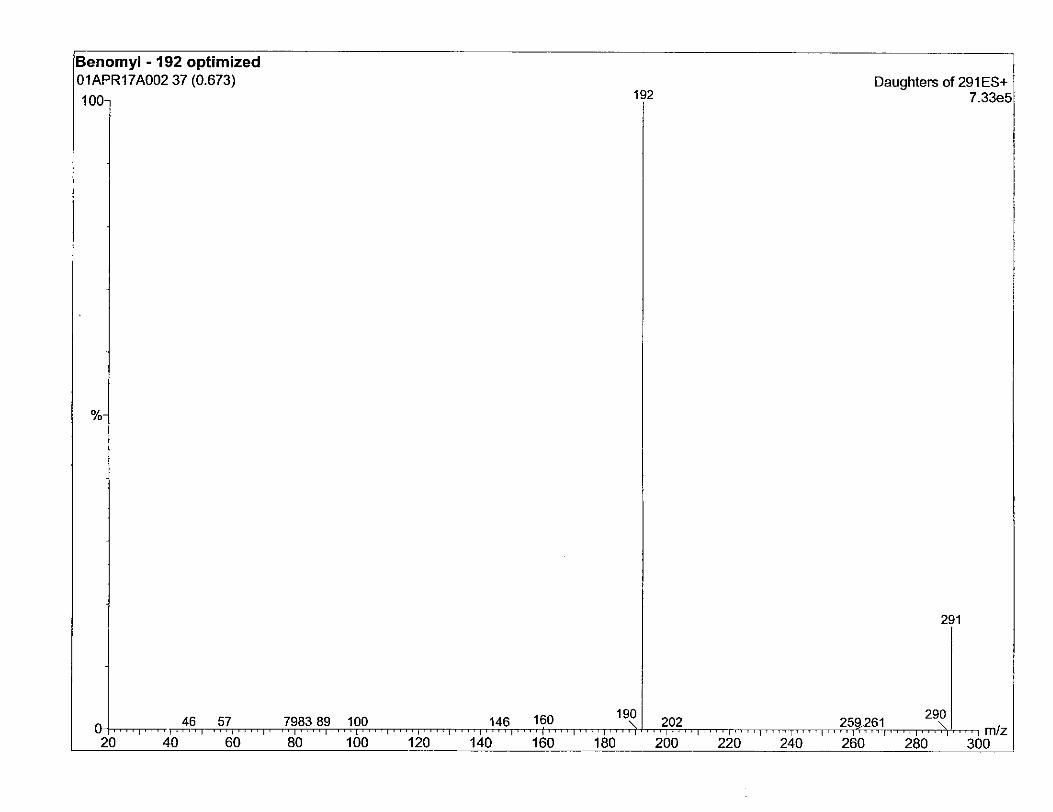
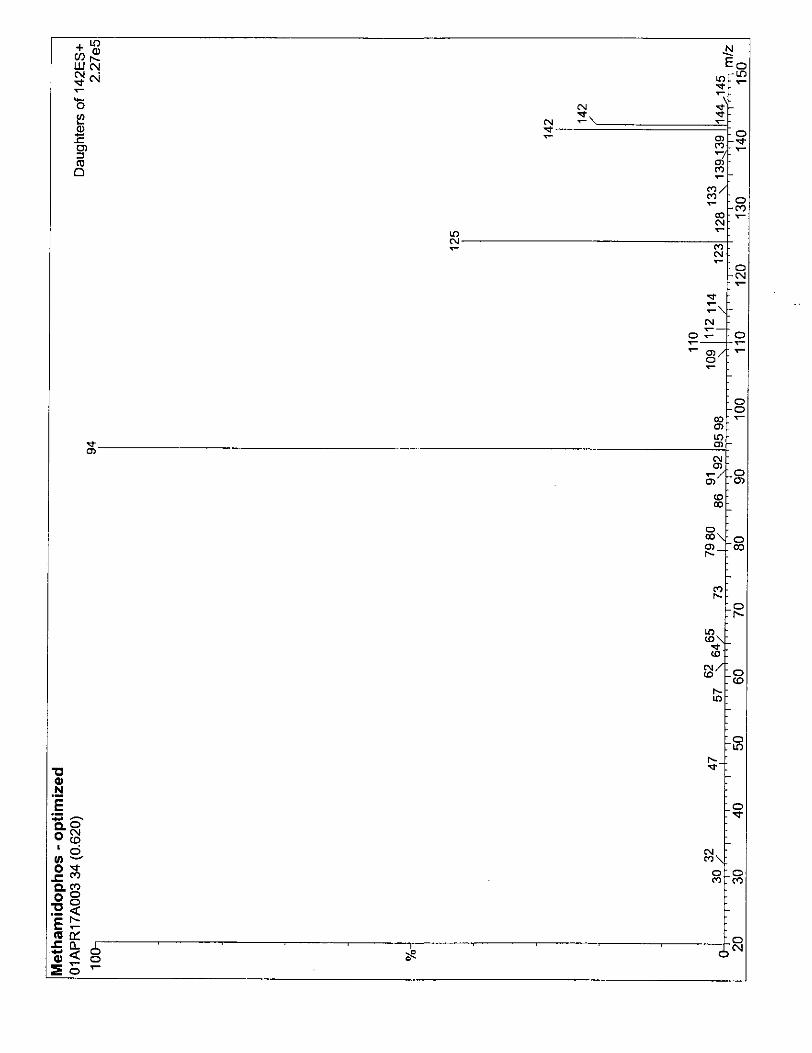
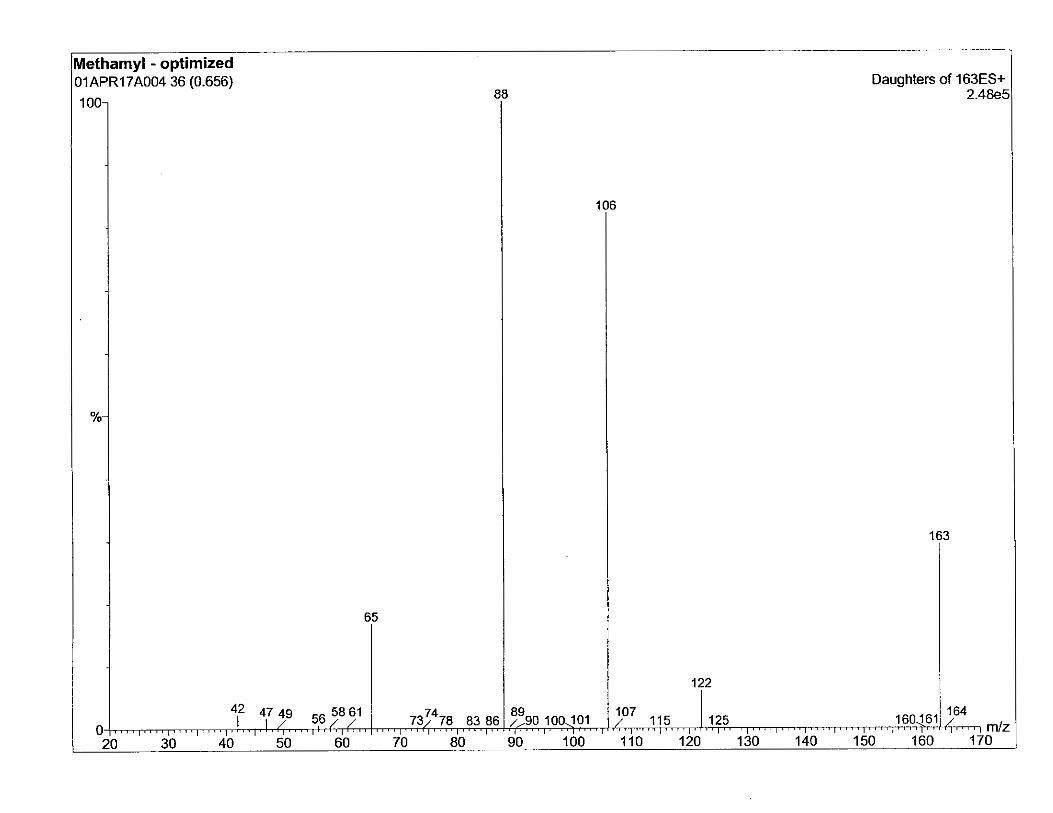
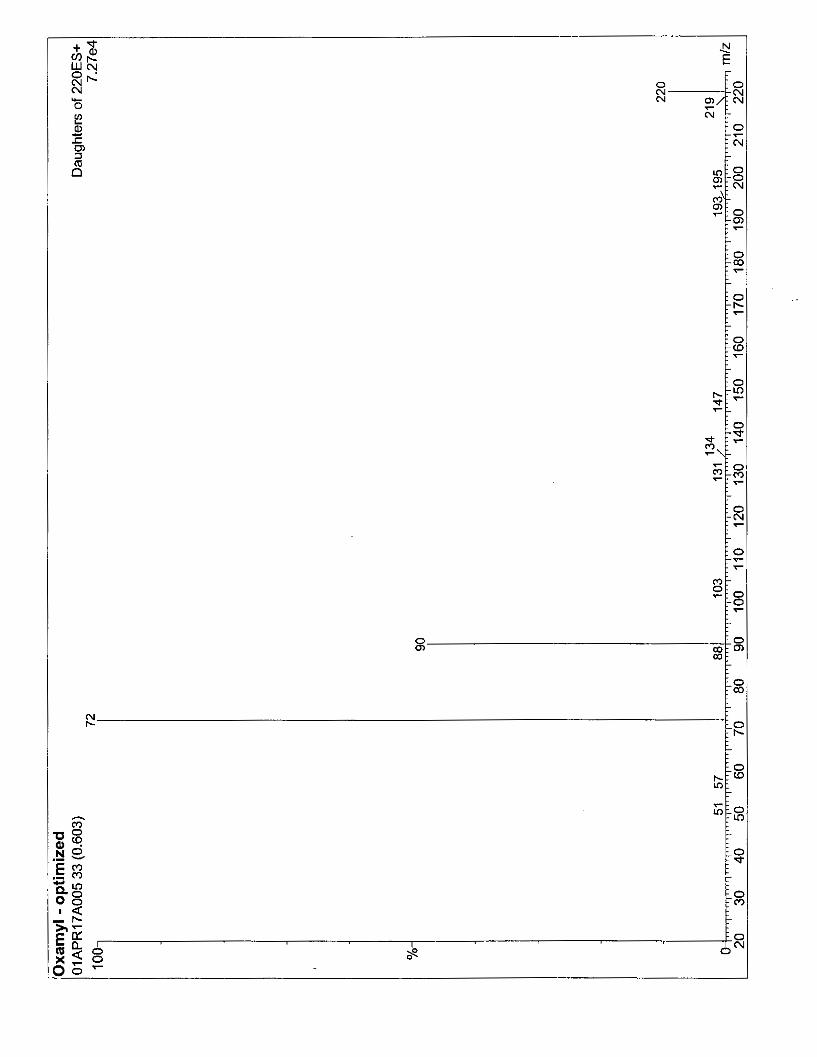
For logistical reasons two different triple quadrupole tandem mass spectrometers (PE/Sciex API- 365 and Micromass Quattro LC) were used to obtain daughter ion spectra for the target analytes. To obtain MSMS spectra for each of the target analytes, a 100 ng/mL solution in a 50/50 mix of water (20 mM formic acid)/methanol(20 mM formic acid) system was prepared. The standard was infused into the ion source of the mass spectrometer using a syringe drive (typically at a rate on the order of 100 pL/min). The parent or precursor ion was determined by scanning the first mass-analyzing quadrupole over a mass range of +/- 20 amu of the molecular weight of the target analyte. A list of the parent ions for the target analytes can be found in Table 2. Once the parent ion was identified (typically M+1) a daughter or fragment ion spectrum was obtained. The daughter ion spectrum was obtained by setting the first mass-analyzing quadrupole transmit only the parent ion of interest. The second quadrupole was set in the rf only, or all-pass mode, and the collision gas ( N 2 or A r , depending on the specific mass spectrometer) in the collision cell. The resulting daughter or fragment ions were then identified by the third quadrupole (second mass- analyzing quadrupole). The entrance and collision energies were then optimized to produce the most intense signal for each of the daughter ions produced. The daughter ions associated with each of the target analytes are shown in Table 2.
Daughter ion spectra obtained using the PE/Sciex API-365 for the target analytes are summarized in Appendix A and the daughter ion spectra obtained using the Micromass Quattro LC for the target analytes are summarized in Appendix B. Similar MSMS spectra were obtained using both instruments, and intensities for individual daughter ions were maximized by optimizing the
Table 2. Summary of Data on Target Analytes
3
Target Analyte
Ionization
ampl ling^.^ (ng/rn3)’ (ng/mL)’
Efficiencies Efficiencies Detection Detection time (min) Ion Mode Extraction Extraction Instrument Instrument Retention Daughter Ions Parent
Limits
(“/.I
Post ( 7 0 ) Limits
Benomyl
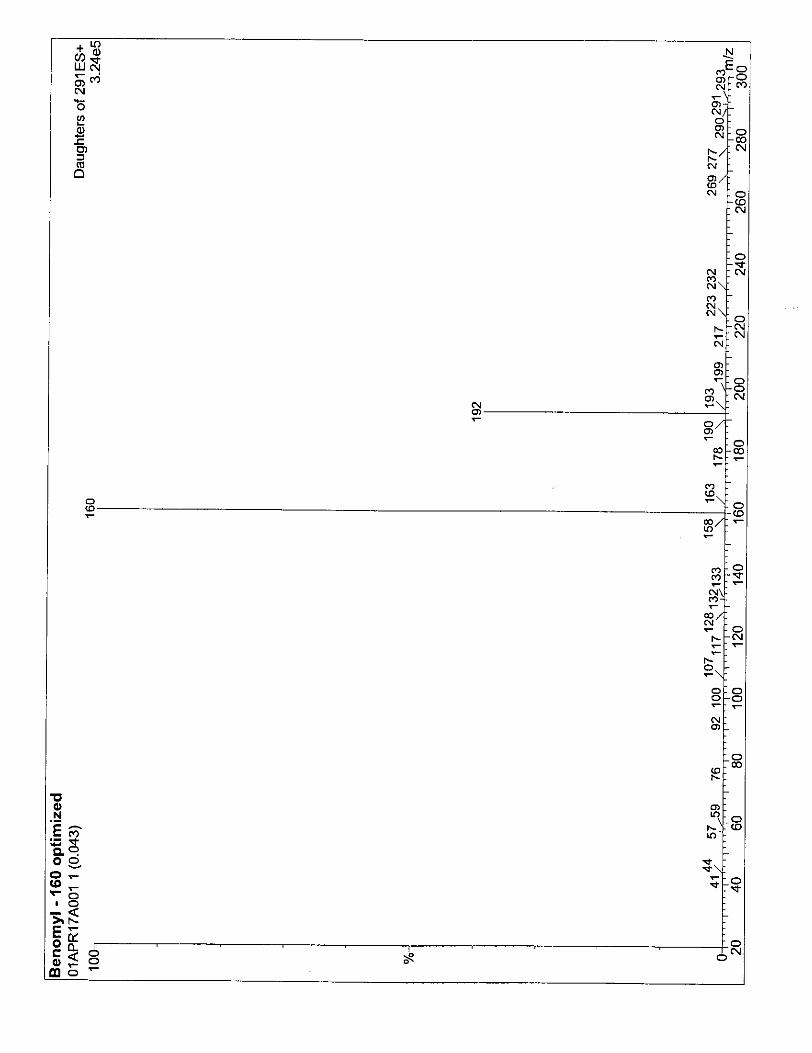
8*9 37*5 0.17 3.7 2.48 160,132 192 + ESI MBC
ND3 N D 3 0.26 5.7 9.16 192,160 291 + ESI
I 2-AB I I 3 * 2 I 30*2 I 0.09 I 1.9 I 2.05 I 92.65 I +ESI I 134
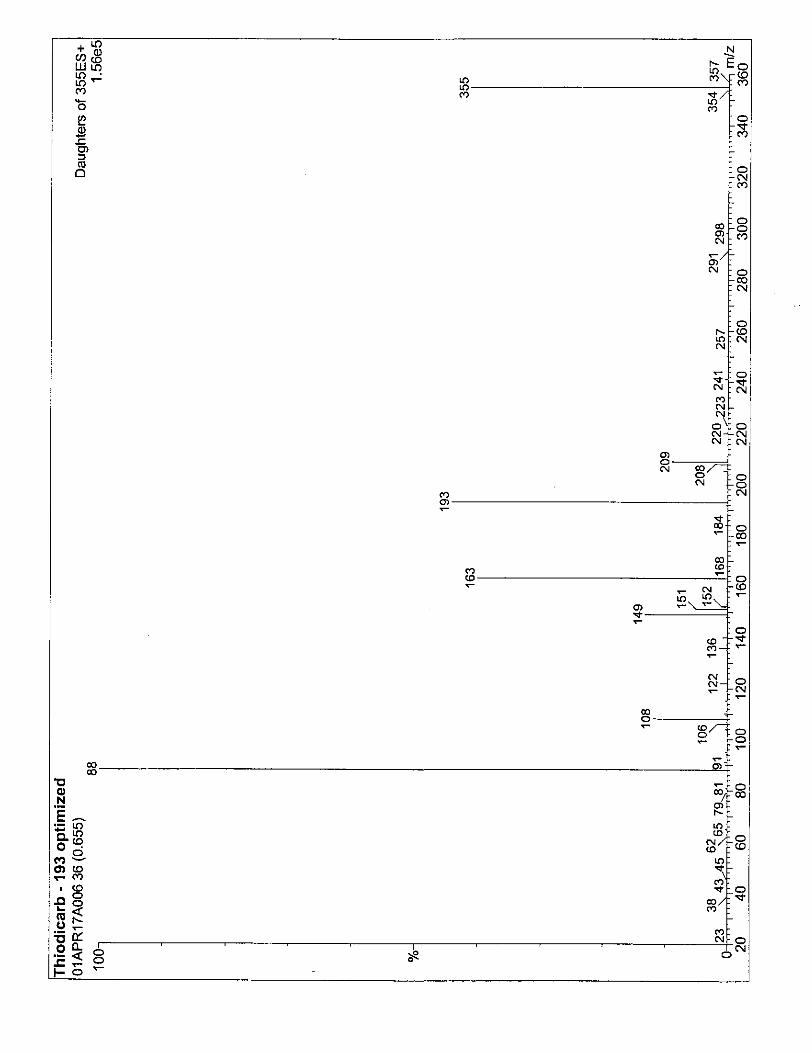
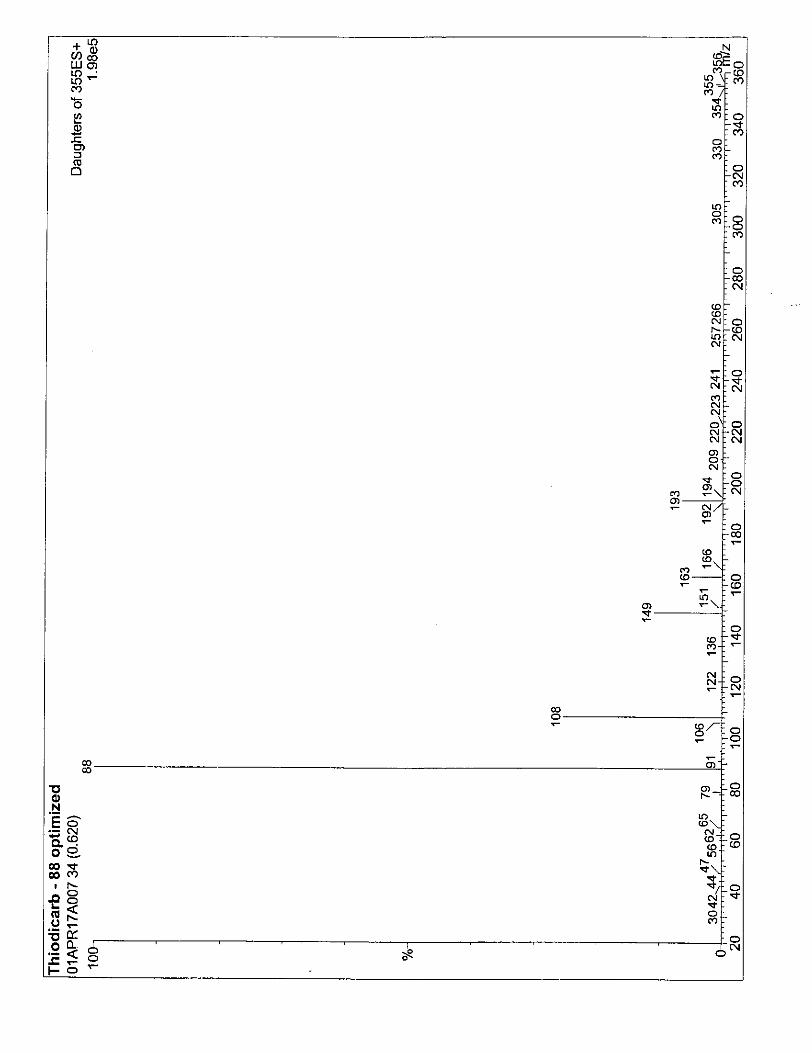
Thiodicarb Interference’ 173 f 17 0.21 4.9 6.52 88, 193 355 + ESI
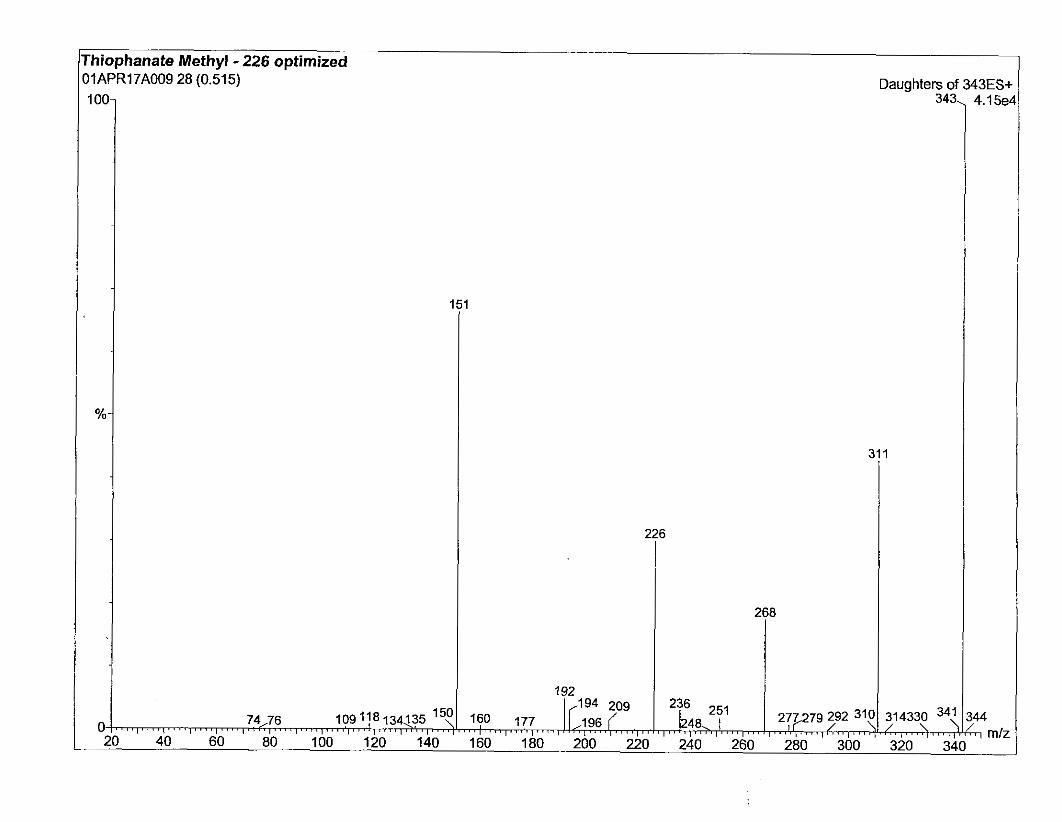
Thiophanate-methyl N D 3 9* 1’ 0.28 6.0 5.52 151,311 343 + ESI
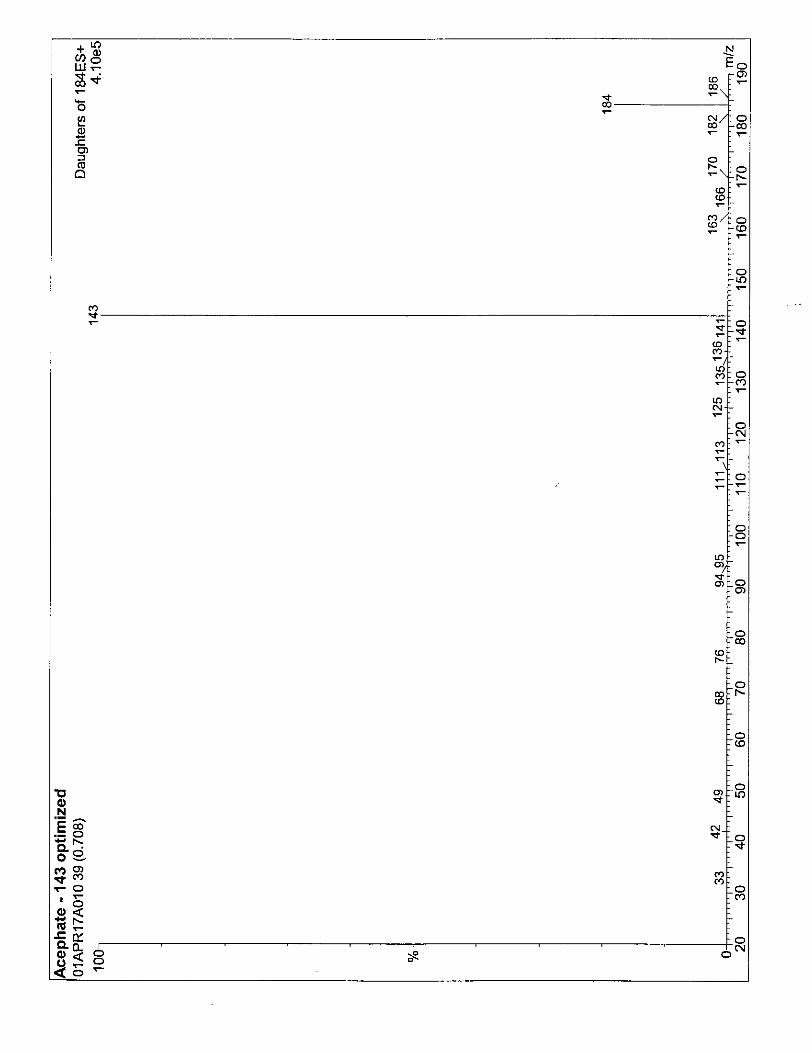
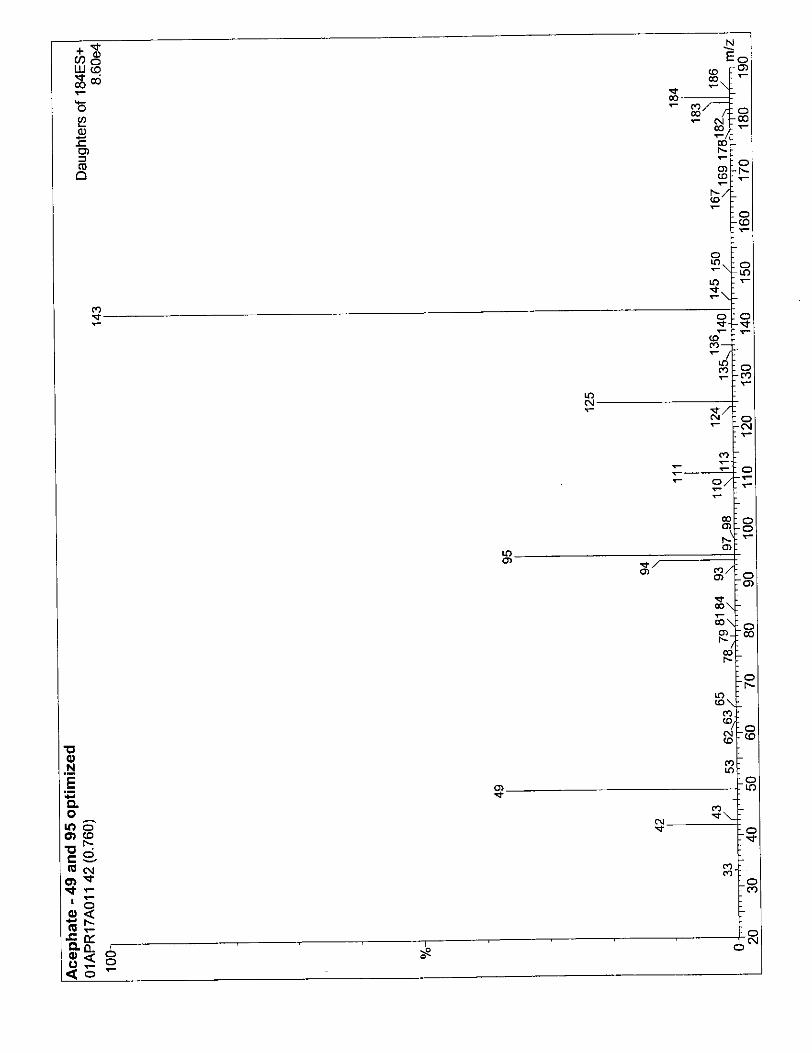
Aceuhate InterferenceS 136 i 49 0.22 4.7 2.72 95.49.143. 184 + ESI
I Methamidouhos 1 + ESI I 142 I ~ 94, 12; I 2.72 r 2.9 I 0.13 I 66% 10 I 17* 11 I ~~
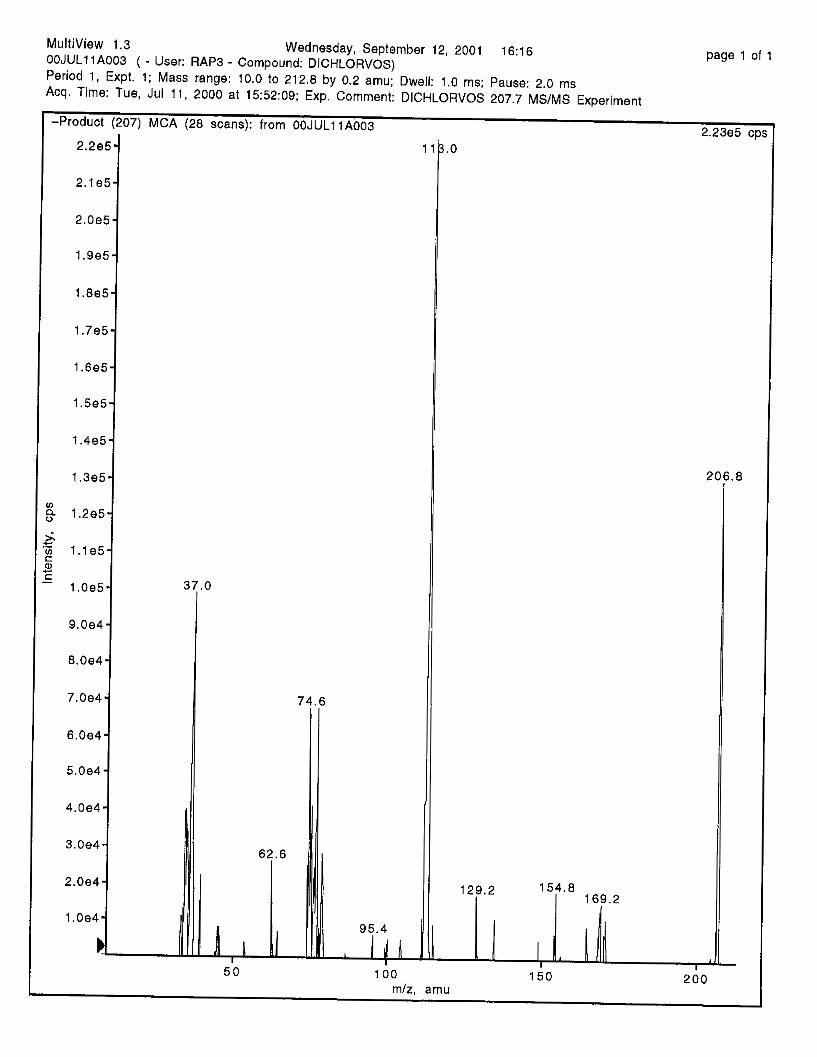
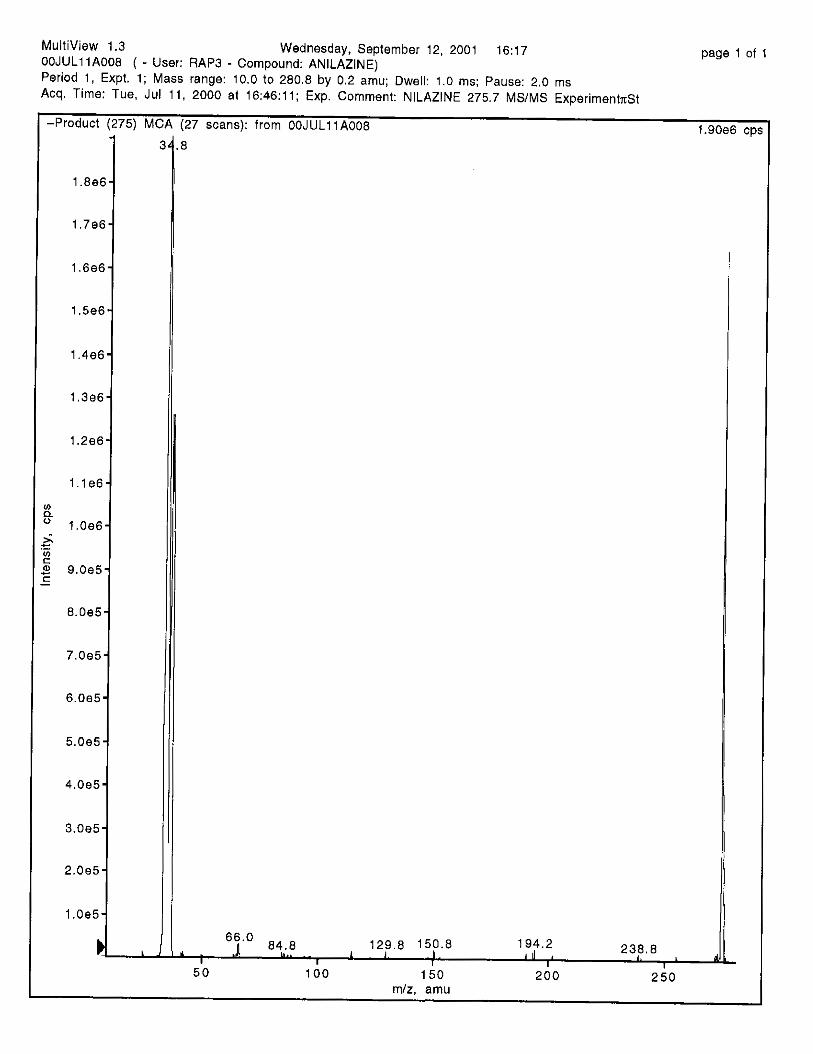
I Anilizine I - ESI I 2731275 I 151,35/153,37 I -- 1 -- I -- I -- I -- I DDVP
_- -- _ _ _ _ _ _ NA NA NA Maneb
__ -_ __ __ __ 79 1431145 - ESI Ethephon
_ _ -_ _. _ _ _ _ 111/113 2051207 - ESI
1 2
Using Method described in 40 CFR Appendix B
3 Using CADPR sampling parameters of 30 L/min for 24 hours
4 Benomyl and thiophanate-methyl degrade into MBC and 2-AB
5 Results based on single set (three replicates) of experiments - Battelle directed to stop work prior to completion of repeat set of experiments. Interference observed for these analytes - Quantitation of multiple parenudaughter ion transitions did not agree.
different ion optics of each mass spectrometer.
4
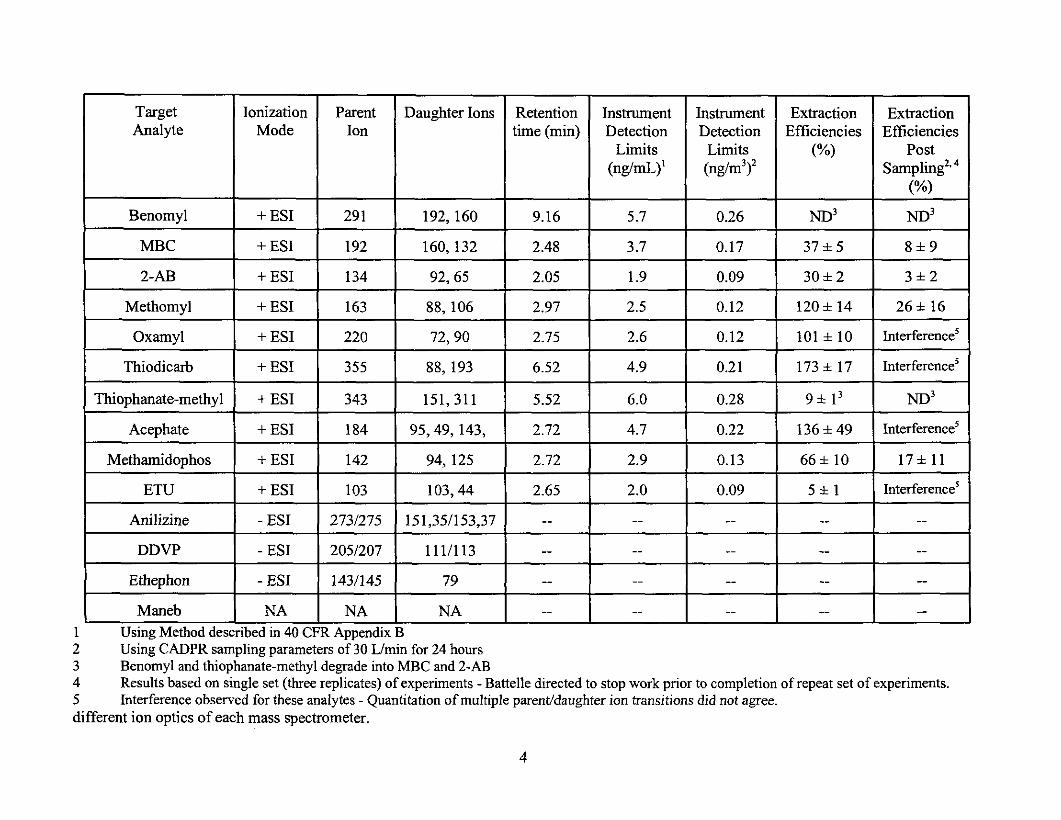
The approach adopted in the method development activities was to concentrate on the high priority analytes, then include as many medium priority compounds as possible. Table 2 summarizes the initial data obtained for the target analytes. Compounds of interest on the initial list but not included in Table 2 are analizine, DDVP, ethephon and maneb.
These initial experiments to obtain MSMS spectra showed that benomyl and thiophanate-methyl degrade easily in solution as well as in the ion source of the mass spectrometer. The breakdown products are well known and have been identified as carbendazim (MBC) and 2-aminobenzimidazol(2- AB).’, 2 s ’ These analytes were treated as high priority analytes, as they will provide information about the overall benomyl and thiophanate-methyl concentration in the samples.
Two parent ions are listed for analizine, DDVP and ethephon. Each of these pesticides contain at least 1 chlorine atom, so the two ions listed each time account for the two naturally occurring isotopes at m/z 35 and 37.
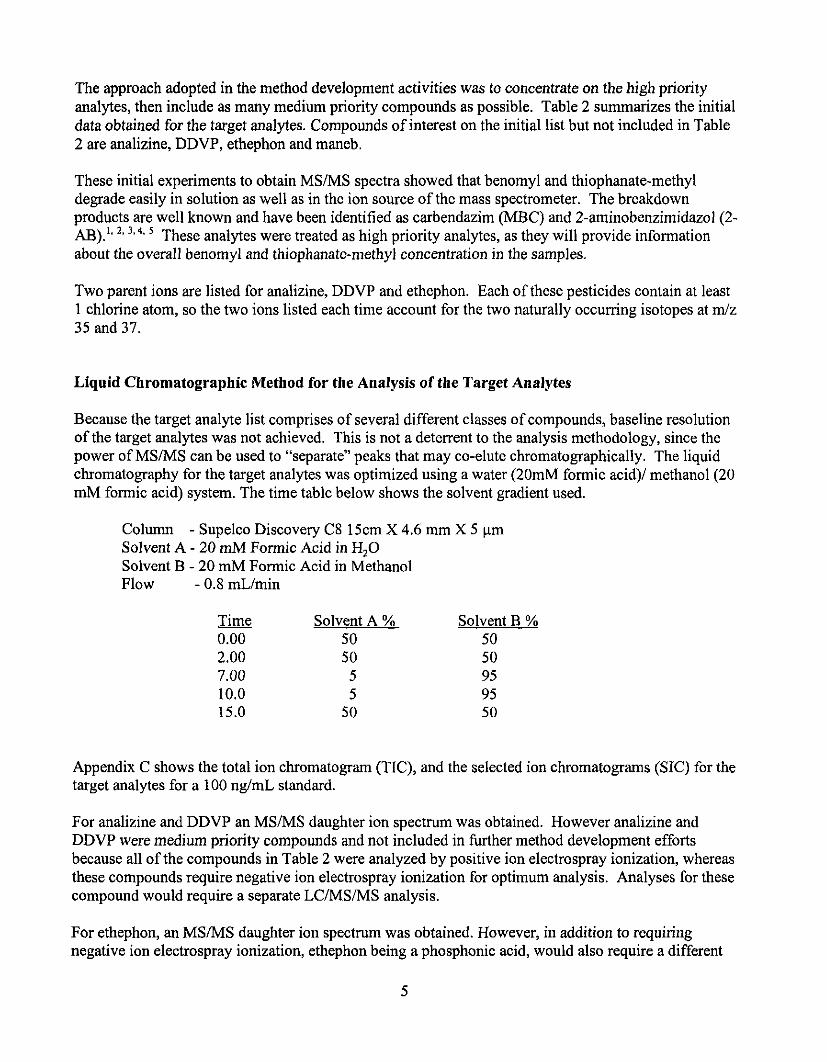
Liquid Chromatographic Method for the Analysis of the Target Analytes
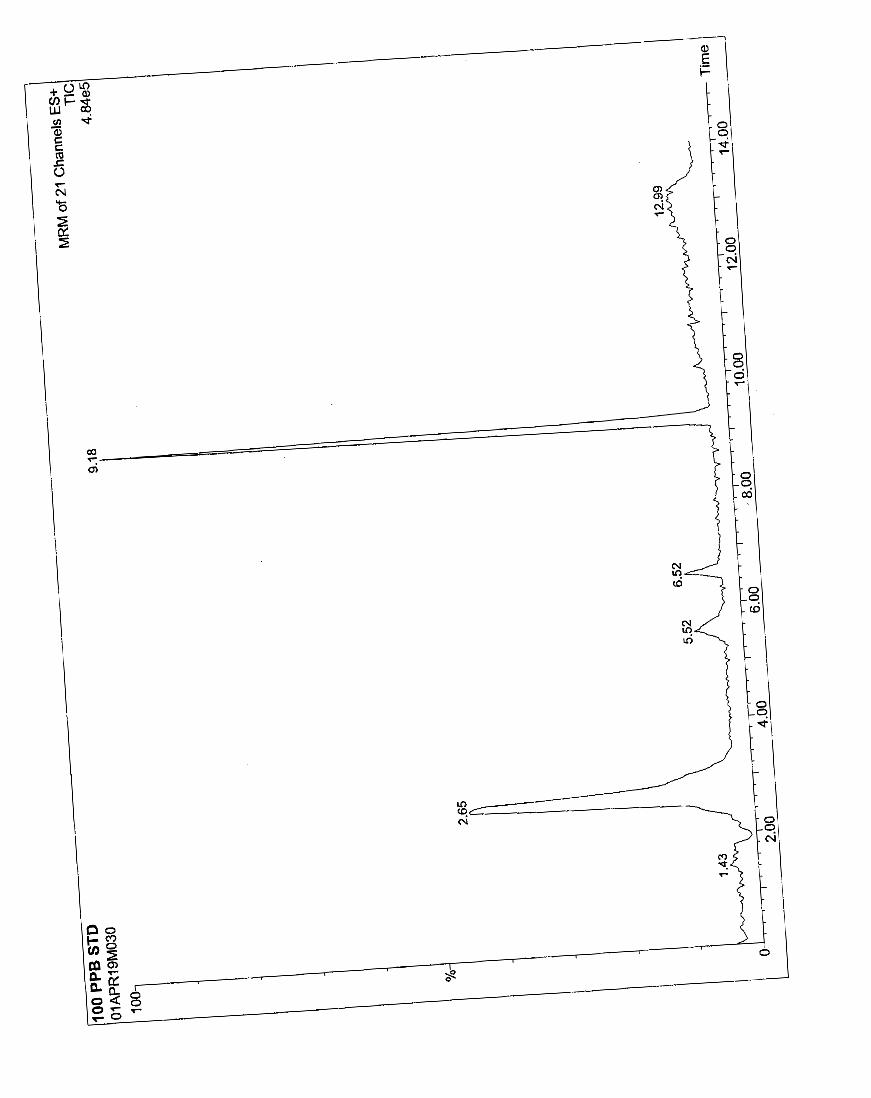
Because the target analyte list comprises of several different classes of compounds, baseline resolution of the target analytes was not achieved. This is not a deterrent to the analysis methodology, since the power of MSMS can be used to “separate” peaks that may co-elute chromatographically. The liquid chromatography for the target analytes was optimized using a water (20mM formic acid)/ methanol (20 mM formic acid) system. The time table below shows the solvent gradient used.
Column - Supelco Discovery C8 15cm X 4.6 mm X 5 pm Solvent A - 20 mM Formic Acid in H,O Solvent B - 20 mM Formic Acid in Methanol Flow - 0.8 mL/min
- Time Solvent A % Solvent B % 0.00 50 50 2.00 50 50 7.00 5 95 10.0 5 95 15.0 50 50
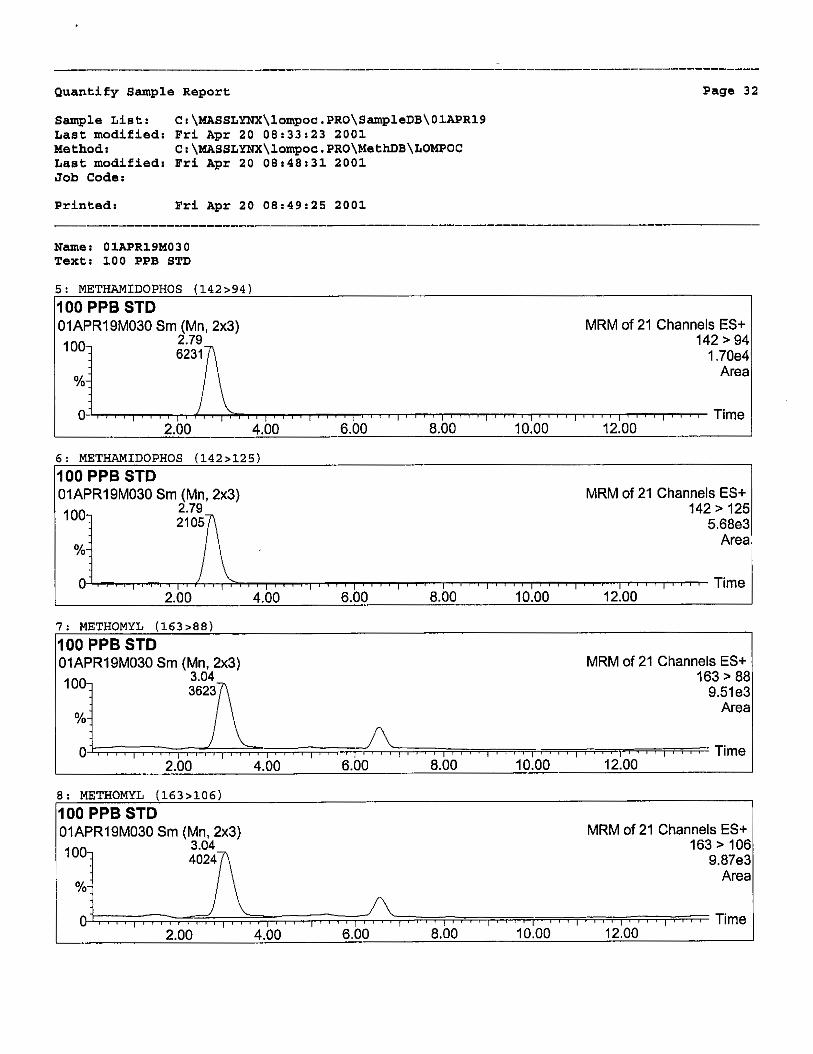
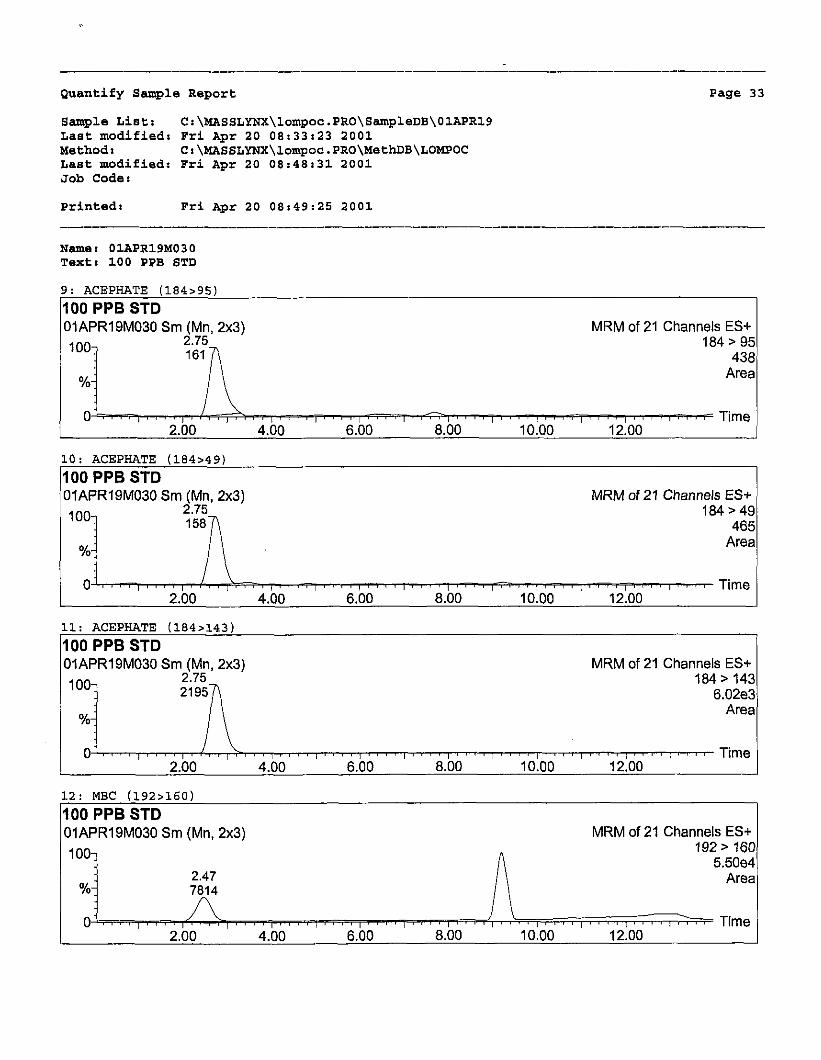
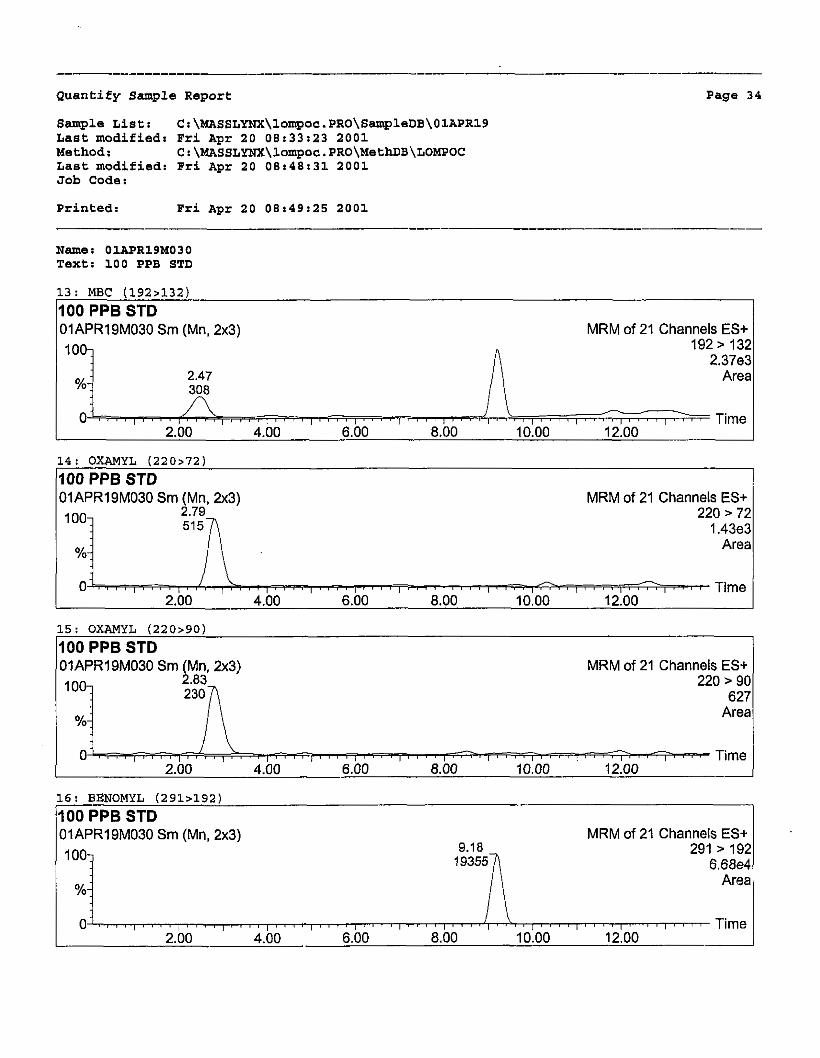
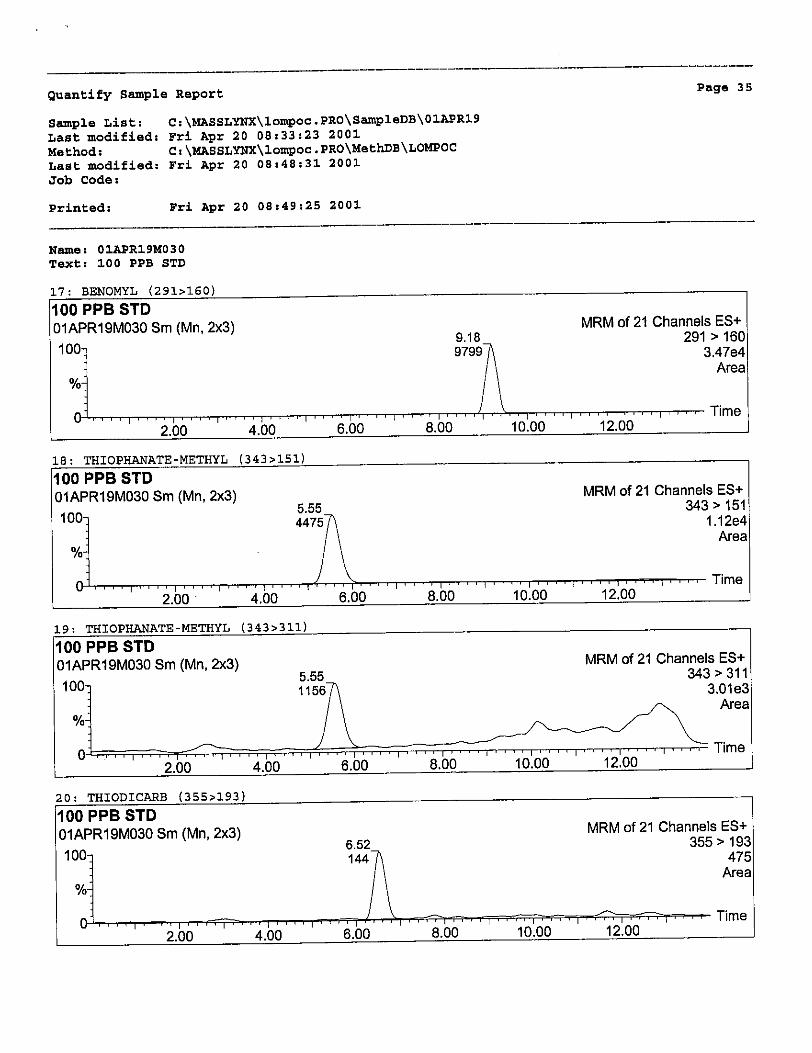
Appendix C shows the total ion chromatogram (TIC), and the selected ion chromatograms (SIC) for the target analytes for a 100 ng/mL standard.
For analizine and DDVP an MSMS daughter ion spectrum was obtained. However analizine and DDVP were medium priority compounds and not included in further method development efforts because all of the compounds in Table 2 were analyzed by positive ion electrospray ionization, whereas these compounds require negative ion electrospray ionization for optimum analysis. Analyses for these compound would require a separate LCMS/MS analysis.
For ethephon, an MSMS daughter ion spectrum was obtained. However, in addition to requiring negative ion electrospray ionization, ethephon being a phosphonic acid, would also require a different
5
extraction procedure than the high priority analytes. Since it was listed as a medium priority analyte, it was not included in subsequent methods development activities.
No MS or MSMS spectra could be obtained for maneb. Research into existing extraction and analysis methodologies for maneb suggest that OSHA Method 107 can be used to analyze air samples for this analyte as well as other manganese containing pesticides. (This method is described on OSHA's web site at www.osha-slc.eov/dts/sltc/methods/oreanic/or~107/or~107.html) This method requires an extraction with 5% cysteine and 5% EDTA, followed by analysis using ion chromatography and W detection. This method is incompatible with the methods used for the high priority analytes. Therefore, no further work was done on maneb.
Task 2. Method Development for the Extraction of Pesticides from XAD-4
Extraction of XAD-4 for the Target Analytes
All extraction procedures were performed using XAD-4 resin provided to Battelle by the CAF'DR. All lots of resin received by Battelle were cleaned by CADPR personnel prior to shipment to Battelle.
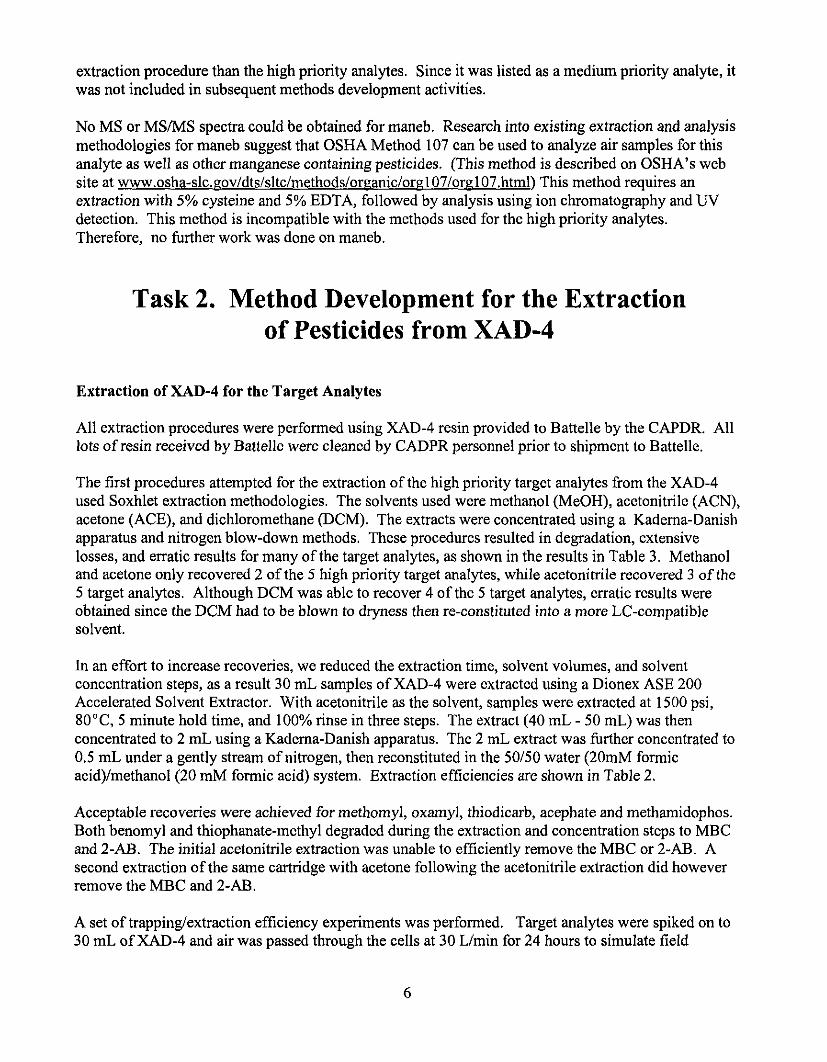
The first procedures attempted for the extraction of the high priority target analytes from the XAD-4 used Soxhlet extraction methodologies. The solvents used were methanol (MeOH), acetonitrile (ACN), acetone (ACE), and dichloromethane (DCM). The extracts were concentrated using a Kadema-Danish apparatus and nitrogen blow-down methods. These procedures resulted in degradation, extensive losses, and erratic results for many of the target analytes, as shown in the results in Table 3. Methanol and acetone only recovered 2 of the 5 high priority target analytes, while acetonitrile recovered 3 of the 5 target analytes. Although DCM was able to recover 4 of the 5 target analytes, erratic results were obtained since the DCM had to be blown to dryness then re-constituted into a more LC-compatible solvent.
In an effort to increase recoveries, we reduced the extraction time, solvent volumes, and solvent concentration steps, as a result 30 mL samples of XAD-4 were extracted using a Dionex ASE 200 Accelerated Solvent Extractor. With acetonitrile as the solvent, samples were extracted at 1500 psi, 80°C, 5 minute hold time, and 100% rinse in three steps. The extract (40 mL - 50 mL) was then concentrated to 2 mL using a Kadema-Danish apparatus. The 2 mL extract was hrther concentrated to 0.5 mL under a gently stream of nitrogen, then reconstituted in the 50150 water (20mM formic acid)/methanol(20 mh4 formic acid) system. Extraction efficiencies are shown in Table 2.
Acceptable recoveries were achieved for methomyl, oxamyl, thiodicarb, acephate and methamidophos. Both benomyl and thiophanate-methyl degraded during the extraction and concentration steps to MBC and 2-AB. The initial acetonitrile extraction was unable to efficiently remove the MBC or 2-AB. A second extraction of the same cartridge with acetone following the acetonitrile extraction did however remove the MBC and 2-AB.
A set of trapping/extraction efficiency experiments was performed. Target analytes were spiked on to 30 mL of XAD-4 and air was passed through the cells at 30 L/min for 24 hours to simulate field
6
sampling conditions. The results are shown in Table 2. In general, the results of these experiments showed poor recoveries. As expected, benomyl and thiophante-methyl were not detected (degradation to MBC and 2-AB). MBC and 2-AI3 were recovered at 8% and 3% respectively. Recoveries for methomyl and methamidophos were 26% and 17% respectively. In addition to the poor recoveries, interferences were observed for oxamyl, thiodicarb, acephate and ETU. Although the mass spectrometer was operated in the MSMS mode, interferences with one or more of the parenddaughter ion transitions was observed. These interferences prevented accurate quantitation.
Battelle was not convinced that the results from the first set of experiments were truly representative of the analytical methodology. Because of the difficulties encountered with this set of experiments, Battelle was in the process of repeating these trapping/extraction efficiency experiments when the client instructed Battelle to stop work before results could be obtained.
Table 3. Results from Soxhlet ExtractionKadema-Danish Concentration Using Different Solvents
Solvent I Compound I MeOH ACN ACE DCM
1 Benomyl I 63 f 3 I 4 1 i 2 0 1 2 7 i 7 1 8 0 5 2 7 I I I
Methomyl 33 * 22 <20 % 2 4 5 8 2 3 i 5
Oxamyl 2 2 i 3 < 2 0 % i 2 0 % <20 %
Thiodicarb
2 2 i 13 < 20 Yo < 2 0 % < 20 % Thiophanate-methvl
< 2 0 % 7 7 f 4 25 f 9 <20 %
- n=3 - Recoveries < 20 % were not acceptable and specific recoveries were not calculated.
Instrument Detection Limits
Instrument detection limits were calculated using the method described in 40 CFR Appendix B. Here, 7 replicates of a 10 ng/mL standard were analyzed and detection limits calculated using the procedure outlined in the CFR. The results are shown in Table 2. The detection limits ranged from 1.9 ng/mL to 6.0 ng/mL.
Method Detection Limits
Method detection limits were calculated using the procedure described in 40 CFR Appendix B. Here, 7 replicates of a standard were spiked onto 30 mL of the XAD-4 and extracted. The final extract concentration was expected to be 100 ng/mL The extracts were analyzed and the method detection limits were calculated using the procedure outlined in the CFR. The method detection limits for the target analytes ranged from "not detected" for benomyl and thiophanate-methyl to 86 ng/mL for oxamyl. The results of these experiments are shown in Table 4.
7
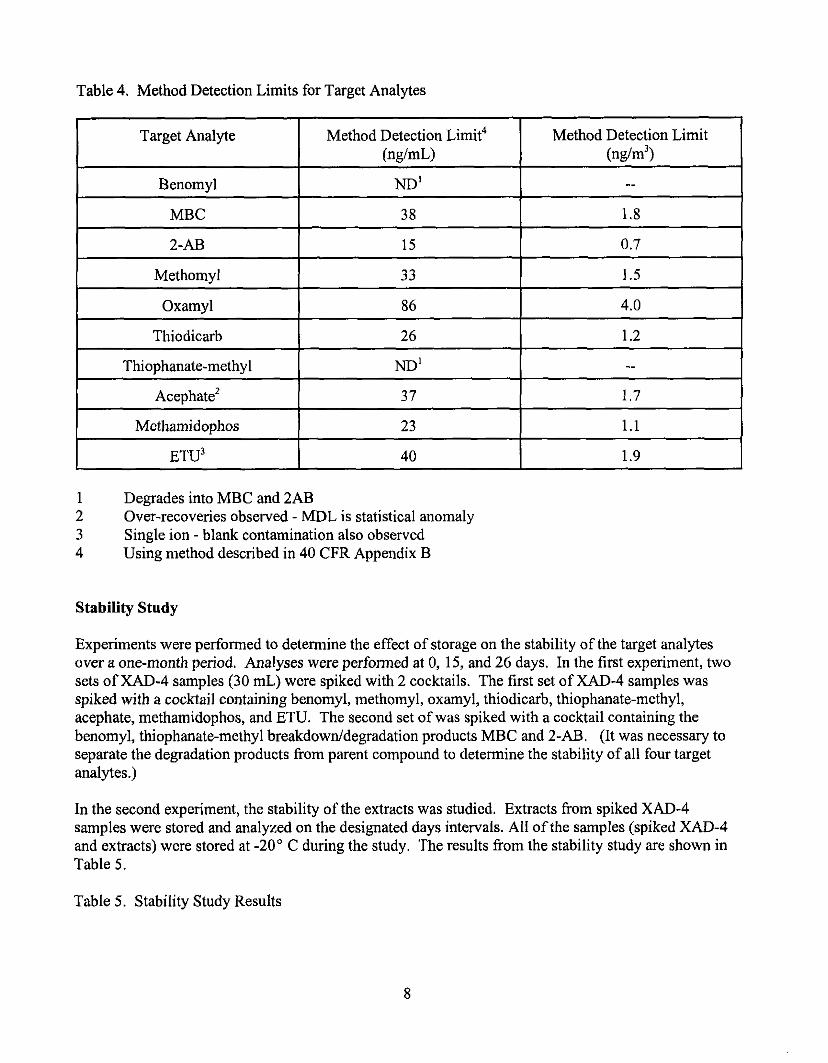
Table 4. Method Detection Limits for Target Analytes
Target Analyte Method Detection Limit Method Detection Limit4 (ng/mL) (ndm')
Benomyl ND' -- MBC
2-AB
1.8 38
0.7 15
Methomyl 33 1.5
Oxamvl 86 4.0 ~~~~~~ ~ ~
Thiodicarb
-_ ND' Thiophanate-methyl
1.2 26
Acephate' 1.7 37 I I
Methamidophos
1.9 40 ETU3
1.1 23
1 Degrades into MBC and 2AB 2 Over-recoveries observed - MDL is statistical anomaly 3 Single ion - blank contamination also observed 4 Using method described in 40 CFR Appendix B
Stability Study
Experiments were performed to determine the effect of storage on the stability of the target analytes over a one-month period. Analyses were performed at 0, 15, and 26 days. In the first experiment, two sets of XAD-4 samples (30 mL) were spiked with 2 cocktails. The first set of XAD-4 samples was spiked with a cocktail containing benomyl, methomyl, oxamyl, thiodicarb, thiophanate-methyl, acephate, methamidophos, and ETU. The second set of was spiked with a cocktail containing the benomyl, thiophanate-methyl breakdowddegradation products MBC and 2-AB. (It was necessary to separate the degradation products from parent compound to determine the stability of all four target analytes.)
In the second experiment, the stability of the extracts was studied. Extracts from spiked XAD-4 samples were stored and analyzed on the designated days intervals. All ofthe samples (spiked XAD-4 and extracts) were stored at -20" C during the study. The results from the stability study are shown in Table 5.
Table 5. Stability Study Results
8
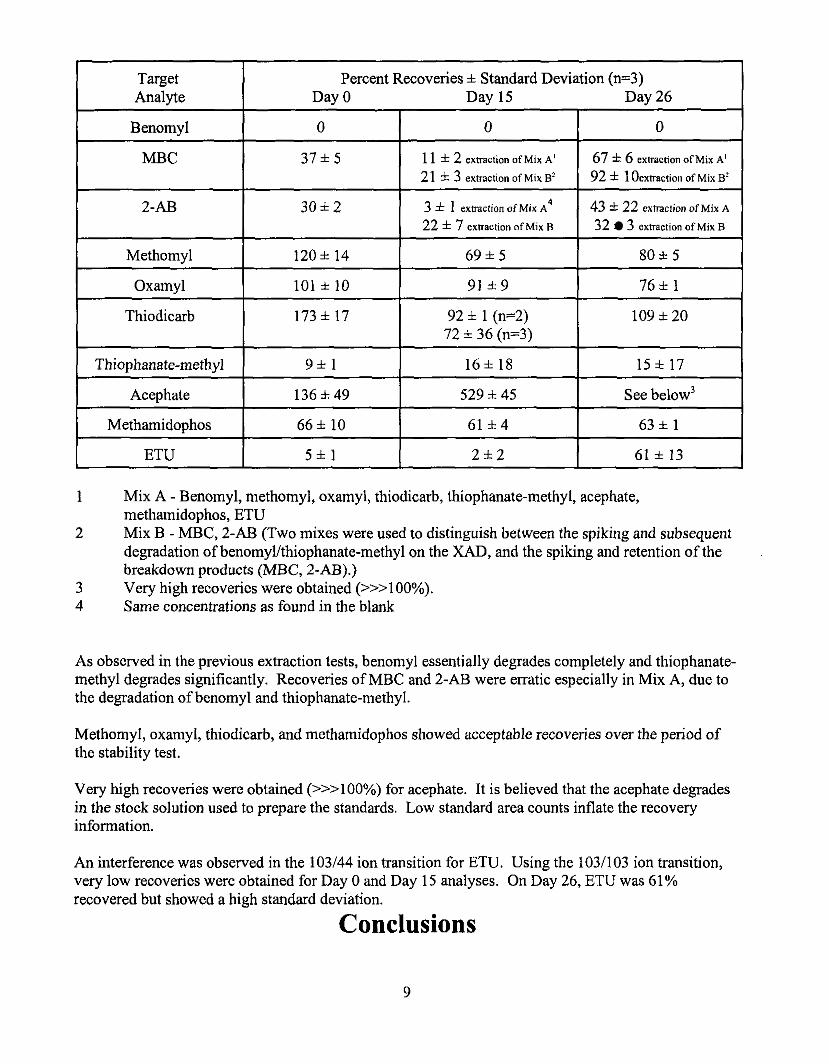
Target
0 0 0 Benomyl
Day 0 Day 15 Day 26 Analyte Percent Recoveries f Standard Deviation (n=3)
MBC 67 f 6 extraction of Mix A’ 1 1 f 2 extraction of Mix A’ 37* 5 21 i 3 extraction of Mix 9’ 92 f 1 Oextraction of Mix B’
I I I I r 2-AB I 3 0 f 2 1 3 * 1 extraction ofMix A I 43 * 22 extraction of Mix A I 4
22 f 7 extraction of Mix B I 32 3 extraction ofMix B I I I
Methomyl 80* 5 69 * 5 120 f 14
Oxamyl 7 6 i 1 91 * 9 101 i 10
Thiodicarb 109 f 20 92 * 1 (n=2) 173 f 17 72 f 36 (n=3)
1 Thiophanate-methvl 1 ~~~ ~~
9 i 1 ~ I ~~ 1 6 f 1 8 I 15 f 17 I - r Acephate - 1 136 f 49 I 529 * 45 I See below’ I
~~
Methamidophos
61 5 13 2 * 2 5 1 1 ETU
63 i 1 61 =k4 6 6 i 10
1 Mix A - Benomyl, methomyl, oxamyl, thiodicarb, thiophanate-methyl, acephate,
2 methamidophos, ETU Mix B - MBC, 2-AB (Two mixes were used to distinguish between the spiking and subsequent degradation of benomyvthiophanate-methyl on the XAD, and the spiking and retention of the
3 breakdown products (MBC, 2-AB).)
4 Very high recoveries were obtained (>>>loo%). Same concentrations as found in the blank
As observed in the previous extraction tests, benomyl essentially degrades completely and thiophanate- methyl degrades significantly. Recoveries of MBC and 2-AB were erratic especially in Mix A, due to the degradation of benomyl and thiophanate-methyl.
Methomyl, oxamyl, thiodicarb, and methamidophos showed acceptable recoveries over the period of the stability test.
Very high recoveries were obtained (>>>loo%) for acephate. It is believed that the acephate degrades in the stock solution used to prepare the standards. Low standard area counts inflate the recovery information.
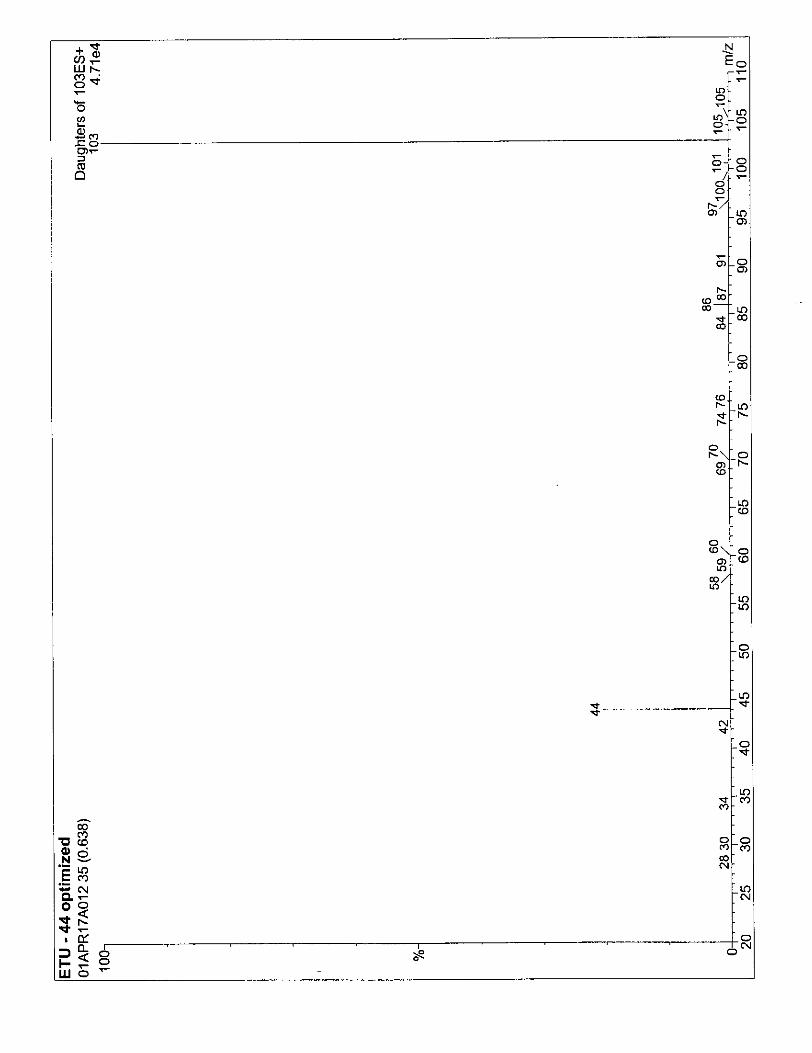
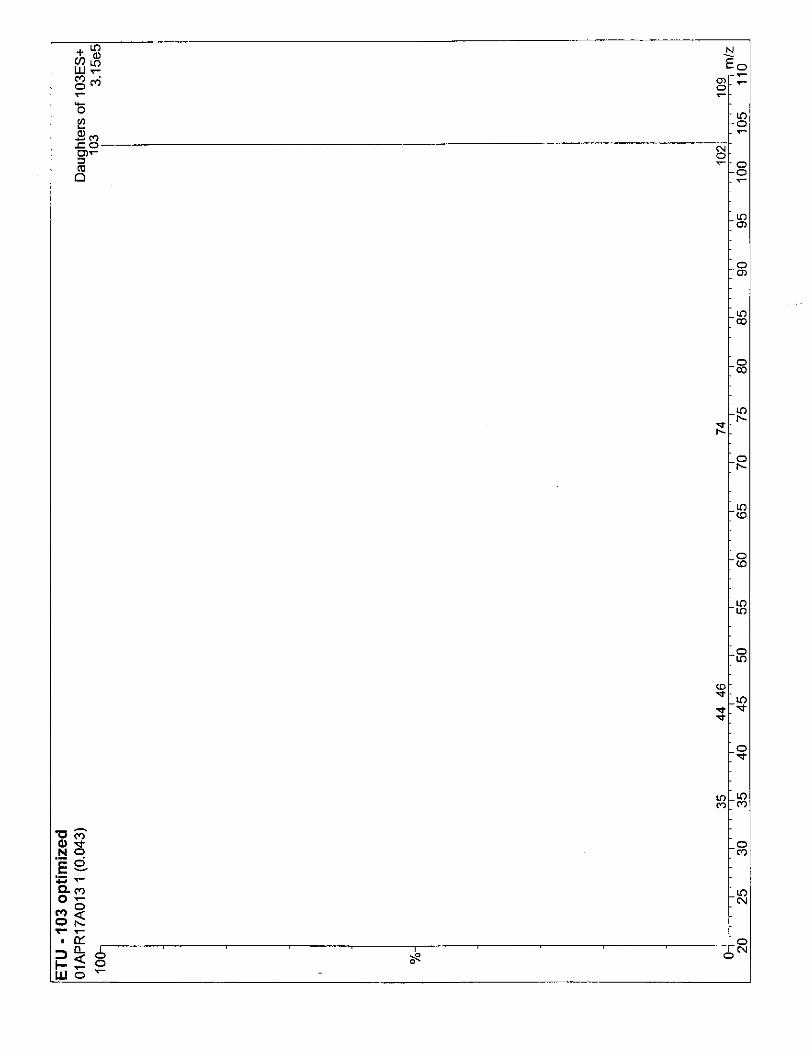
An interference was observed in the 103/44 ion transition for ETU. Using the 103/103 ion transition, very low recoveries were obtained for Day 0 and Day 15 analyses. On Day 26, ETU was 61% recovered but showed a high standard deviation.
Conclusions
9

MSMS daughter ion spectra were obtained for benomyl, MBC, 2-AB, methomyl, oxamyl, thiodicarb, thiophanate-methyl, acephate, methamidophos, ETU, anilizine, DDVP and ethephon. No MS or MS/MS daughter ion spectrum was obtained for maneb.
A LC/MS/MS method was developed for the analysis of ETU, 2-AB, methamidophos, methomyl, acephate, MBC, oxamyl, benomyl, thiophanate-methyl, and thiodicarb, with instrument detection limits ranging from 1.9 ng/mL to 6.0 ng/mL.
Method detection limits for the target analytes ranged from “not detected” for benomyl and thiophanate-methyl (degradation to 2-AB and MBC) to 86 ng/mL (4.0 ng/m’) for oxamyl.
Initial extraction of the XAD-4 using Soxhlet extraction methods and Kadema-Danish solvent concentration steps did not show acceptable recoveries. Extraction of the XAD-4 using the ASE extraction and Kaderna-Danish solvent concentration methods yielded recoveries ranging from 5% to 173%.
Degradation of benomyl and thiophanate-methyl into MBC and 2-AB occurred with both the Soxhlet extraction and ASE methodologies.
A set of trappinglextraction efficiency experiments showed poor recoveries. Recoveries ranged from not detected (benomyl and thiophanate-methyl) to 26% (methomyl). In addition, interferences were observed for oxamyl, thiodicarb, acephate, and ETU. Although the mass spectrometer was operated in the MS/MS mode, interferences with one or more of the parenudaughter ion transitions was observed.
Battelle was not convinced that the results from the first set of trappinglextraction efficiency experiments were truly representative of the analytical methodology. Because of the difficulties encountered with this set of experiments, Battelle was in the process of repeating these trappingkxtraction efficiency experiments when the client instructed Battelle to stop work. Results from this second set of experiments were therefore not obtained.
Previous work by the California Air Resources Board has shown that benomyl and cabendazim (MBC) could be extracted off milligram quantities of XAD-2. This method is capable of analyzing extracts containing benomyl in the part per million (ppm) concentration range, but will not chromatographically separate benomyl from MBC..
The CARB work is fundamentally different from the experiments performed in this study, in the concentration of the final extracts, the sampling media, and the volume of sampling media used. The CARB work used XAD-2, which has a much smaller surface area than the XAD-4 provided to Battelle. The higher surface area of XAD-4 may aid in the capturing of ultra-trace levels of target species, but also it appears to adversely affect the extraction of these same species.
Because the CARB method uses only milligram quantities of sampling media, no solvent concentration steps were necessary. Battelle was contracted to analyze extract concentrations in the parts per billion (ppb) range (1000 times less than the CARB method) and extract much larger amounts of sampling media. By using 30 mL volumes of XAD-4, (- 9.2 g) larger solvent volumes were necessary for extraction, thus requiring solvent concentration steps. In these concentration steps, losses of the target analytes can occur via evaporation andor degradation. In addition the method developed in this study was able to chromatographically separate benomyl and thiophante-methyl from their degradation products, 2-AB and MBC.
10
Although CADPR felt that the method detection limits achieved in this study were greater than those desired for the overall Lompoc program, a method was successfully developed for the analysis of ng/mL (ndm’) levels of the target analytes. If ultra-trace levels of these target analytes are to be analyzed in air samples, it is recommended that the sample collection media be changed from XAD-4 to XAD-2 and/or poly-urethane foam (PUF) to improve extraction efficiency. It is also recommended that the volume of sampling media be minimized in order to minimize the volume of solvent solvent needed for extraction thereby minimizing the possible sample losses during the concentration steps.
11
References 1. Sandahl, M., Mathiasson, L., Jonsson, J. A., “Determination of thiophanate-methyl and
its metabolites at trace level in spiked natural water using the supported liquid membrane extraction and the microporus membrane liquid-liquid extraction techniques combined on-line with high-performance liquid chromatography”, J. Chromutogr. A , , 893, 123- 131,2000.
2. Atten, C. F., Bourke, J. B., Marafioti, R. A., “Determination of thiophanate-methyl as carbendazin by high-pressure liquid chromatography: application to onions and cabbage”, J. Agric. Food Chem., May-June, 30(3), 610-61 1, 1982.
3. Okita, Satoshi, Ishii, Y., Yun, S., “Determination of carbendazim and thiabendzole in environmental water samples using solid-phase extraction and LC/electrospray MSMS”, Bunseki Kuguku, 50(2) 127-132,2001,
4. Marvin CH, Brindle ID, Hall CD, Chiba M, “Rapid on-line precolumn high-performance liquid chromatographic method for the determination of benomyl, carbendazim and aldicarb species indrinkingwater”,JChromutogr. Aug 30;555(1-2):147-154, 1991.
5. Jin, L., Bramble, F. Q., Pentz, A,, Johnson, T., Dtermination of MBCR-AB residues in various crops using liquid chromatography/electrospray ion trap MSMS”, Proceedings from the 48’h ASMS Conference on Mass Spectrometry and Allied Topics, June 11-15, 2000, Long Beach, California.
6 . State of California Air Resources Board Monitoring & Laboratory Division, SOP No, NLB021, “Standard Operating Procedure for the Determination of Benomyl and Its Breakdown Product, Carbendazim, in Ambient Air”. March 18, 1988.
12

Appendix A
MS/MS Daughter Ion Spectra of Target Analytes API-365

6.0e
5.5e
5.0e
4.58,
4.0e!
3.5e:
3.0e:
2.5eE
2.0e5
1.5e5
1 .Oe5
5.0e4
131.9
104.9
1
230.9 >
50 100 150 200 mlz, amu
250 L
tProduct
90000
85000
80000
75000
70000
65000
60000
55000'
0
I 50
7 8
2
1
I: 100
. o
121.8 I
page 1 of 1
150 mlz, amu
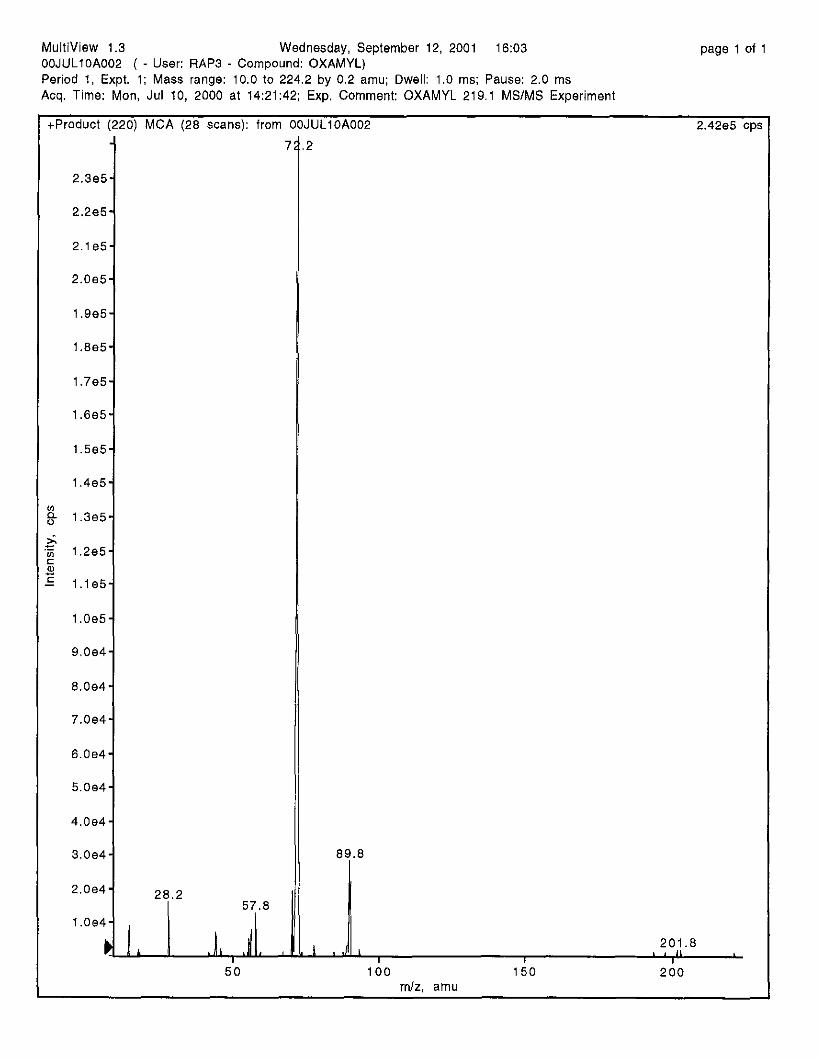
00JULlOA002 ( - User: RAP3 - Compound: OXAMYL) MultiView 1.3 Wednesday, September 12, 2001 16:03 page 1 of 1
Period 1, Expt. 1 ; Mass range: 10.0 to 224.2 by 0.2 amu; Dwell: 1.0 ms; Pause: 2.0 ms Acq. Time: Mon, Jul 10, 2000 at 14:21:42; Exp. Comment: OXAMYL 219.1 MSlMS Experiment
+Product - (2:
2.3e5
2.2e5
2.1 e5
2.0e5
1.9e5
1 .8e5
1.7e5
1.6e5
1.5e5
1.4e5
1.3e5
l a 5
l . l e 5
1 .Oe5
9.0e4
8.0e4
7.0e4
6.0a4
5.0e4
4.0e4
3.0e4
2.0e4
1.0e4
I
!O) MCA (28 scans): from 00JULlOA002 2.42e5 cps
89.8 I
5 0 mlz. amu
tProduct (355) MCA (29 scans): from 00JULlOA026 2.76e5 cy:
2.7e5-
2.6e5-
2.5e5-
2.4e5-
2.385-
2.2e5-
2 . le5 -
2.0e5-
1.9e5-
1.8e5-
1.7e5-
1.6e5-
1.5e5-
1.4e5-
1.3e5-
1.2e5-
l . l e 5 -
1.0e5-
9.0e4-
8.0e4-
7.0614-
6.0e4-
5.0.54-
4.0e4-
3.0e4-
2.0e4-
1.0e4-
50
163.1
355.1
100 150 200 250 300 m/z, amu
350
.Product
l .2ef
l . l e f
1 .OeE
9.0~14
8.0e4
7.0e4
6.0e4
5.0e4
4.0e4
3.0e4
13) MCA (29 scans): from 00JULlOA022 1.31e5 cu:
74.0
121.8

+Product (184) MCA (29 scans): from 00JULlOA006 1.68e5 cp
1.6e5
1.535
1.4e5
1.3e5
1.2e5
l.le5
1 .Oe5
9 + 9.0e4
7 ! i 8.0e4 '
7.0e4,
6.0e4,
63.7 81.3
7
50 100 mlz, amu
150
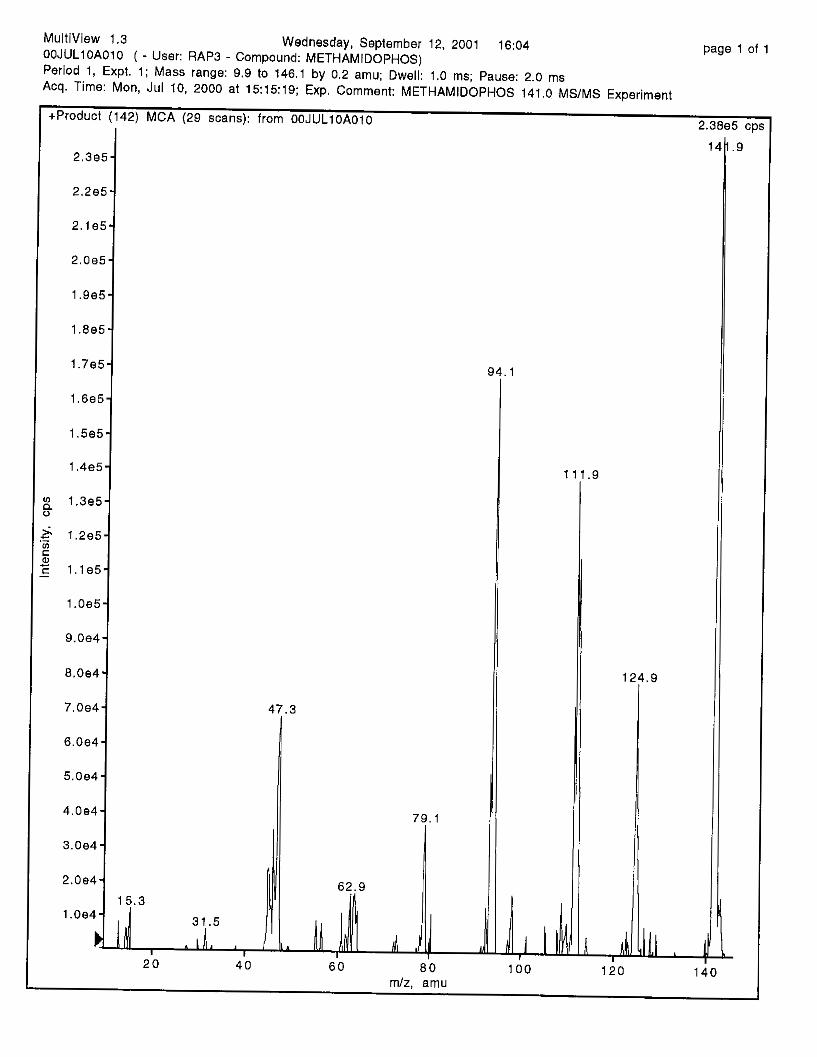
+Product (142) MCA (29 scans): from 00JULlOA010 2.38e5 cp
2.3e5-
Z . Z e 5 -
2 . le5 -
2.0e5-
1.9e5-
1.8e5-
1.7e.5-
1.6e5-
1.565-
1.4e5-
5 1.3e5-
1.2~15- !
i l . le.5-
1.0e5-
9.0~14-
8.0e4-
>
U
7.0e4
6.0e4
5.0e4 i 47.3
1 4.0e41 II 79.1
3.0e4-
2.0e4-
1.0e4-
62.9 15.3
31.5
I I , 1 ld I . d I , ,
2 0 40 60 8 0
1
1
124.9
100 120
9
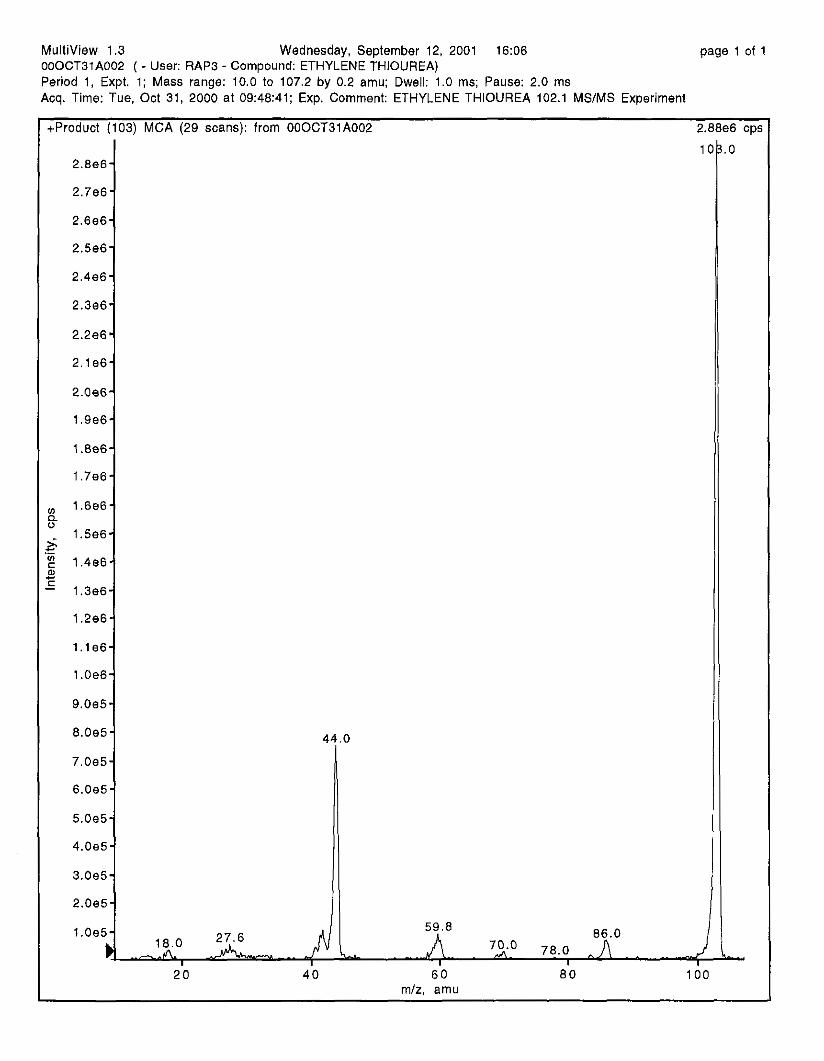
000CT31A002 ( - User: RAP3 - Compound: ETHYLENE THIOUREA) MultiView 1.3 Wednesday, September 12, 2001 16:06 page 1 of 1
Period 1, Expt. 1; Mass range: 10.0 to 107.2 by 0.2 amu; Dwell: 1.0 ms; Pause: 2.0 ms Acq. Time: Tue. Oct 31, 2000 at 09:48:41; Exp. Comment: ETHYLENE THIOUREA 102.1 MWMS Experiment
.5e6-
.4e6-
.3e6-
.2e6-
m/z. amu
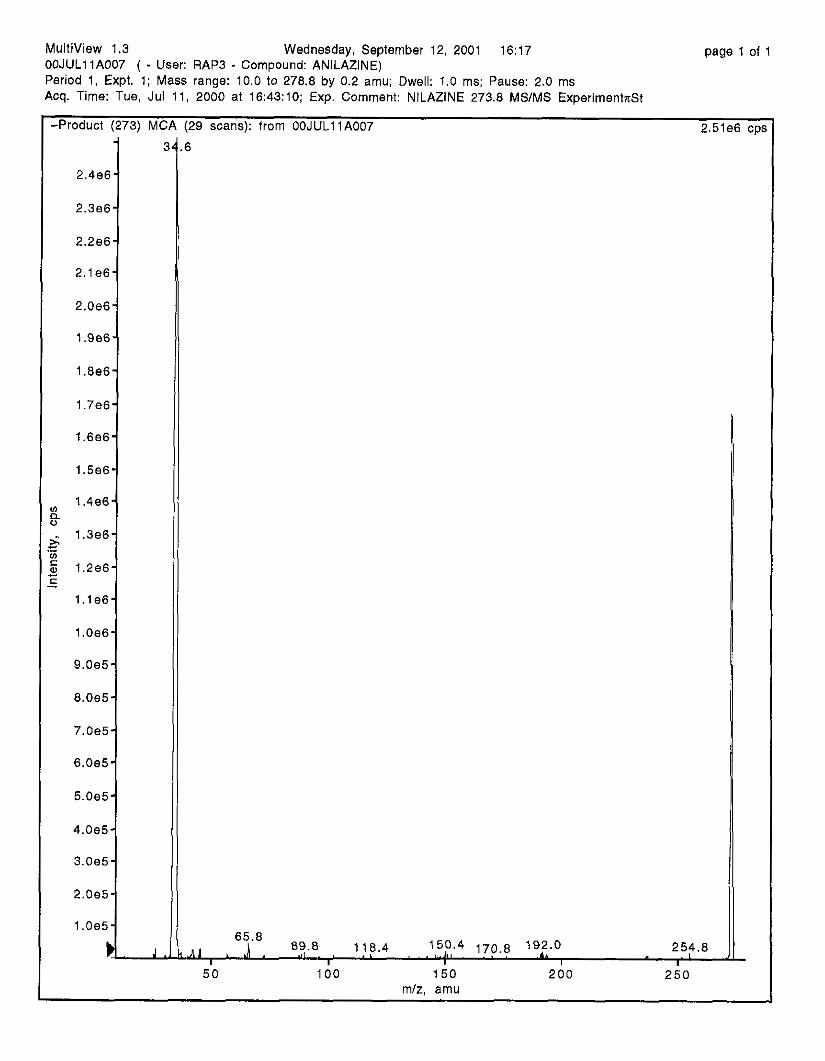
00JULllA007 ( - User: RAP3 - Compound: ANILAZINE) MultiView 1.3 Wednesday, September 12, 2001 16:17 page 1 of 1
Period 1, Expt. 1; Mass range: 10.0 to 278.8 by 0.2 amu; Dwell: 1.0 ms; Pause: 2.0 ms Acq. Time: Tue, Jul 11, 2000 at 16:43:10; Exp. Comment: NlLAZlNE 273.8 MSlMS ExDerimentzSt
2.4e6-
2.3e6-
2.2e6-
2 . le6-
2.0e6-
1.9e6-
1.8e6-
1.7~16-
1.6~16-
1.5e6-
1.4e6-
1.3e6-
l .Ze6-
l . l e 6 -
1.0e6-
9.0e5-
8 . 0 e 5 -
7.0e5-
6.0e5-
5.0e5-
4.0~15-
3.0e5-
2.0e5-
1 .Oe5-
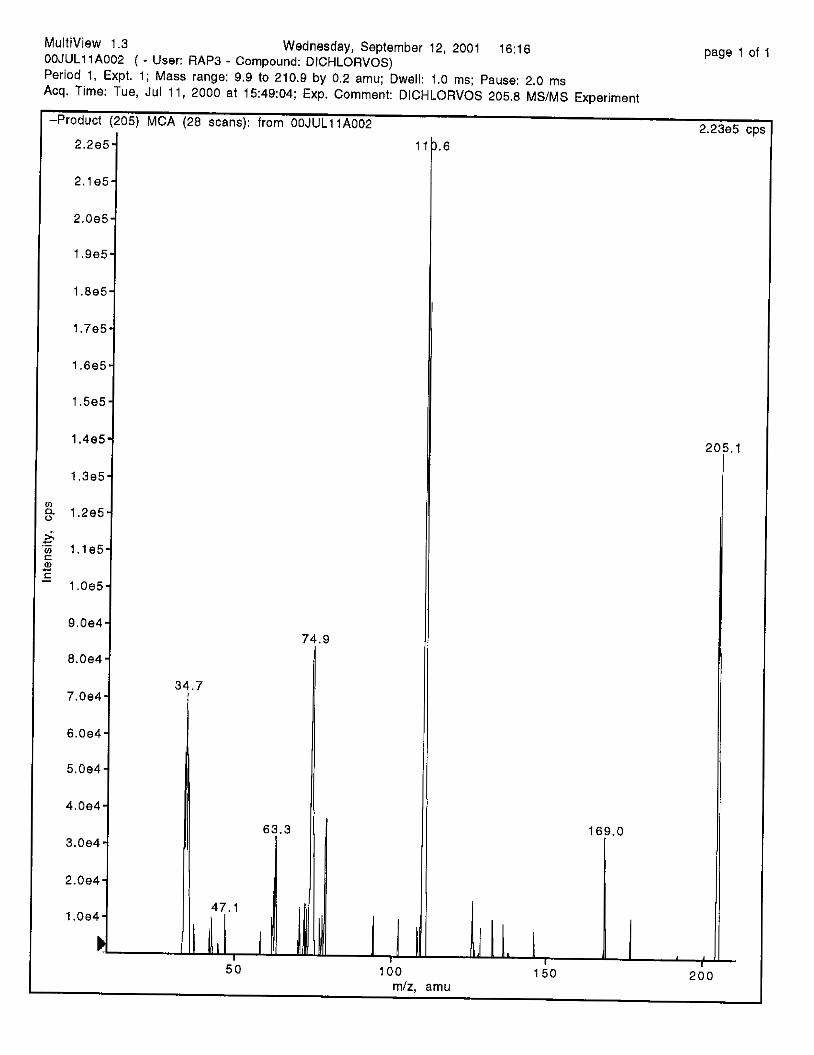
MultiView I .3 Wednesday, September 12, 2001 16:16 00JUL11A002 ( - User: RAP3 - Compound: DICHLORVOS) Period 1, Expt. 1; Mass range: 9.9 to 210.9 by 0.2 amu; Dwell: 1.0 ms; pause: 2.0 ms Acq. Time: Tue, JUl 11, 2000 at 15:49:04; Exp. Comment DICHLORVOS 205.8 MSlMs Experiment
page 1 of 1
-Product (205) MCA (28 scans): from 00JULllA002 2.23e5 c l
2.2e5-
2 . le5-
2.0615-
1.9e5-
1.8~15-
1.7e5-
1.6e5-
1.5e5-
1.4~35-
1.3e5-
1.2e5-
? i l . l e 5 - !
' 1.0e5-
9.0e4-
8.0e4-
7.0e4-
6.0e4-
5.0e4-
4.0e4-
3.0e4-
2.0e4-
1.0e4-
L
1
74.9 I
7
50 100
6
2
169.0
150 200
page 1 of 1
107) MCA (28 scans): from 00JULllA003 2.23e5 ce 1
0
74.6
I /
50 100
.o
2
54.8 I 169.2
150 200
00JULllA008 ( - User: RAP3 - Compound: ANILAZINE) MuitiView 1.3 Wednesday, September 12, 2001 16:17
Period 1, Expt. 1; Mass range: 10.0 to 280.8 by 0.2 amu; Dwell: 1.0 ms: Pause: 2.0 ms Acq. Time: Tue. JUl 11, 2000 at 16:46:11; Exp. Comment: NlLAZlNE 275.7 MS/MS ExperimentnSt
page 1 of 1
-Product
1.8e
1.7e
1.68,
1.5ei
1 . 4 ~
1.3el
1.2et
l . l e t
1 .Oef
9.0eE
8.0eE
7.0e5
6.0e5
5.0e5
4.0e5
3.0e5
2.0~15
1 .Oe5
I
- !75) MC
,i
- :A (
4
'27 scans): from 00JULllA008 1.90e6 CF
3
66.0 84.8 129.8 150.8 194.2 238.8
I r 1 1 I I I i
5 0 100 150 200 I
250
Appendix B
MS/MS Daughter Ion Spectra of Target Analytes Quattro LC
Benomyl - 192 optimized 01APR17A002 37 (0.673) 1 O(
%
C -
i Daughters of 291ES+
7.33e!
IMethamyl - optimized l lAPR17A004 36 (0.656)
1 oc
%
( -
65
1
1
122 I
Daughters of 163ES+ 2.48eE
lO0,lOl 1 )07 115 125 I60<6l / 164
IO 100 110 120 130 140 150 160 170 ml2
r
W
N m
Z' N
W ' m- r
N N- r
0
2
0 0 m
0
N m
0 N N
0 0 N
0 m 7
0 z 0 =r 0 c 0 z 0 m
N
m
0 m m
0 N
0
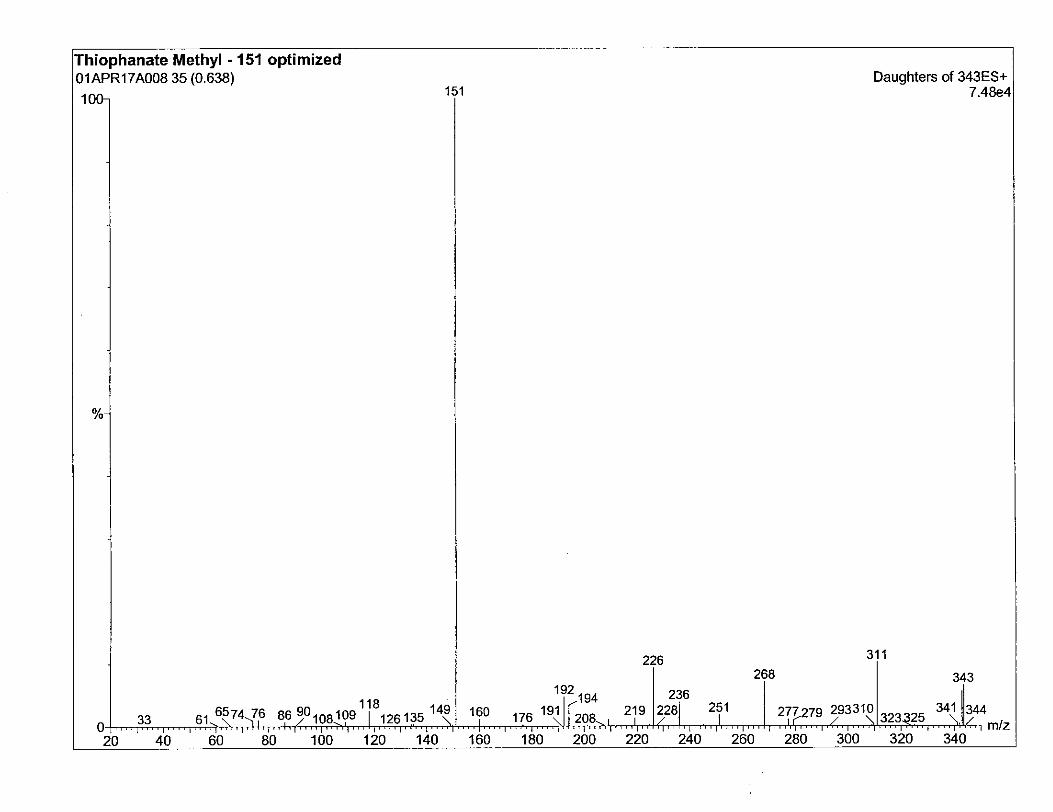
hiophanate Methyl - 151 optimized
ij
I 1 20
1APR17A008 35 (0.638) I Daughters of 343ES+
7.48er
- .- 118 194 236
33 61, ':-135 149 \ 2281 251 rZo8 219 160 176 191 2 7 p m 293310 344 323325 341
, " " , " " , " " , " " , " " , ~ ~ " F ' I " ' l " ' ~ l " ~ ' " " ' " " ' " '
40 60 80 100 120 140 160 180 200 220 240 260 280 300 3-20 340 ~ " - 1 " " I " " I " " I " ' ~ I " " l " 4 , , m/z
226 I 268
31 1
1143
1G
9
0-
'O1
Methyl - 226 optimized 01APR17A009 28 (0.515) Daughters of 343ES+
22
2
6
268
I1
I
314330 34: I \
44 I m/z ___
c 0
Q IC
t
t
L
1 oc
%
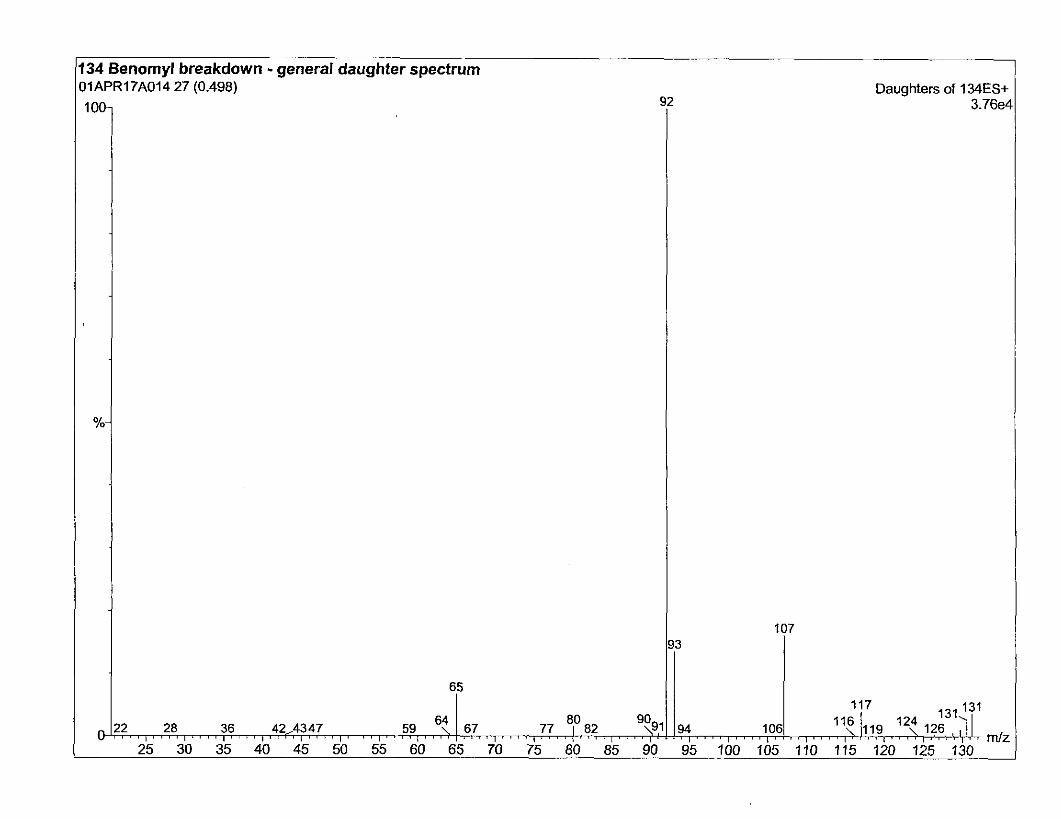
134 Benomyl breakdown - general daughter spectrum 01APR17A014 27 (0.498)
93
Daughters of 134ES+ 3.76e4
107
117 I , , , , I , , , , , , , , , , , , , , , , , , , , , , , , , , , , ,6? I 67 , , , , , , 77, ,",8? , , , , \ , I I , . , , 90 131 13' 22 28 36 42,4347 59 9; 94 106 ICJI 19 12< 126, , Jk
I ' " ' I . ' " I ' " I ' " ' l " ' ' l 25 30 35 40 45 50 55 60 65 70 75 80 85 90 95 100 105 110 115 120 125 130
r n h
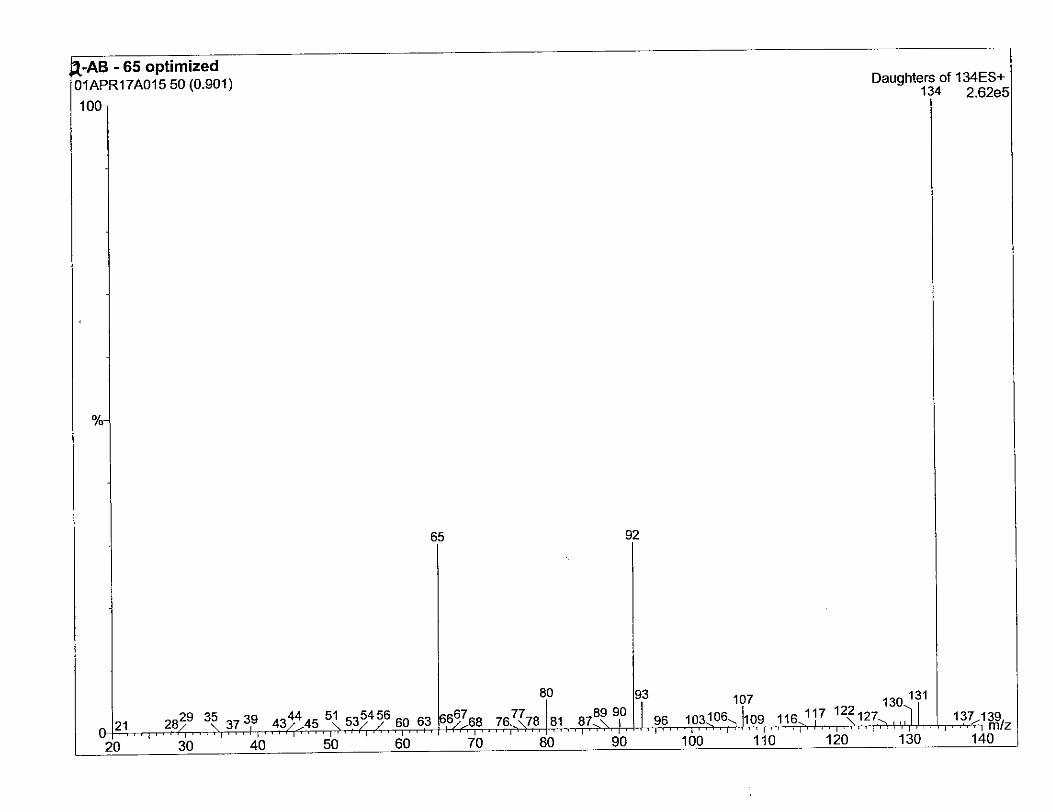
.AB - 65 optimized lAPR17A015 50 (0.901) oc
Daughter 1 s 3
f 134ES+ 2.62eE
80 93 107
20 30 40
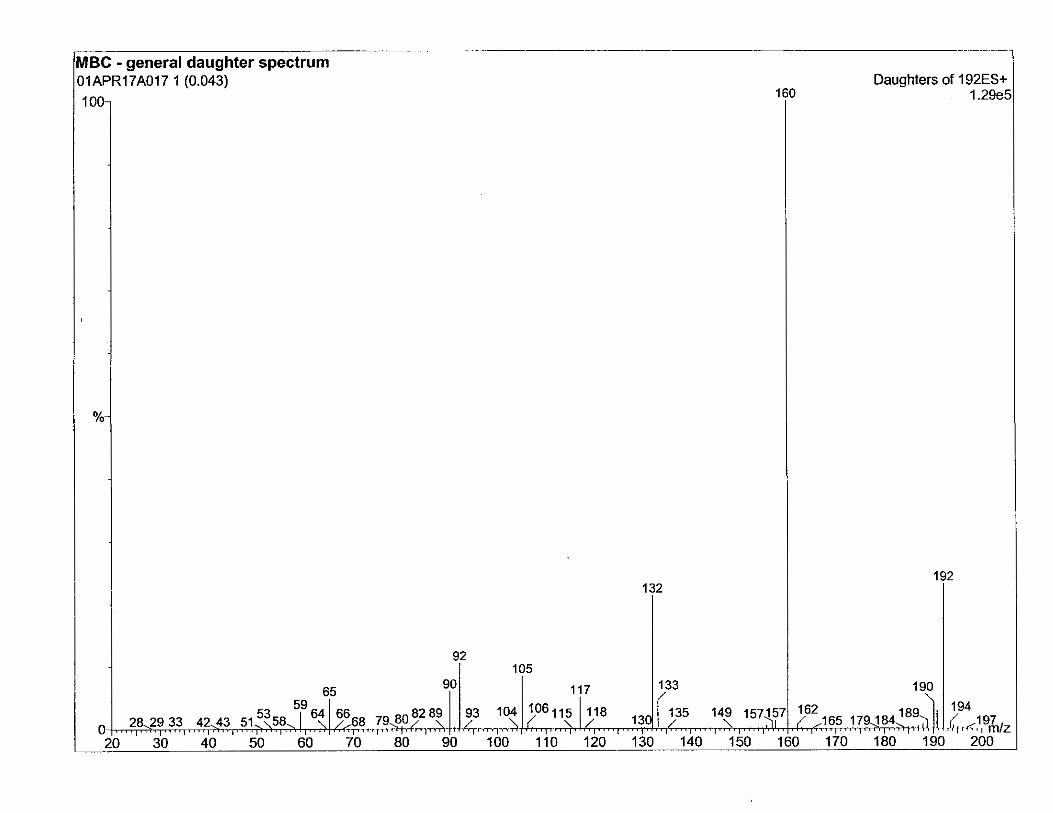
IBC - general daughter spectrum 1APR17A017 1 (0.043)
1 1 oo
%
132
92 I 105
Daughters of 192ES+ 1.29e!
192

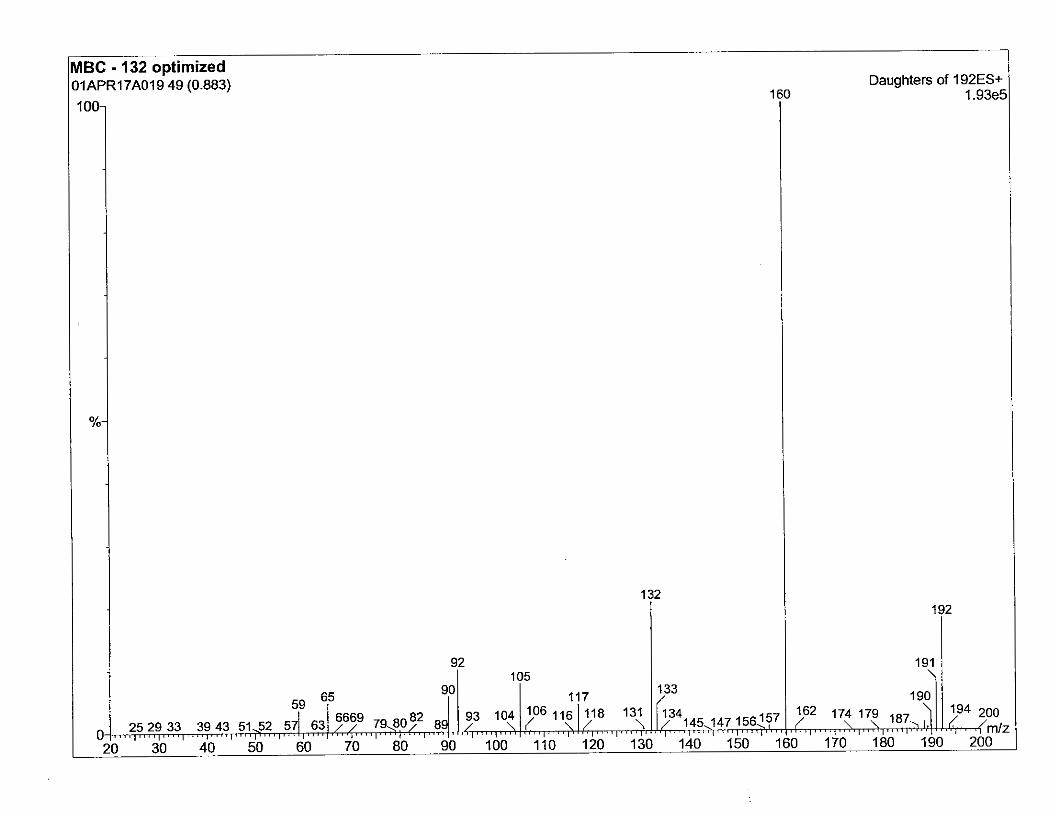
IBC - 132 optimized IAPR17A019 49 (0.883) IO0
o/c
92 I 105
132
Daughters of 192ES+ 1.93e'
192
191
I cn 65 901 I I 117 I 533 I 190 I io go 160 ' 110 ' I20 ' I30 ' 140 ' I50 ' 160 ' I70 ' 180 190 200 I ,~ I I 1
Appendix C
Total Ion Chromatogram and Selected Ion Chromatograms for Target Analytes
,c c
.C C
c-.
Quantify Sample Report Page 3 1
Sample List: C:\MAssLYNx\lornpo~.PRO\SampleDB\OlAPRl9 Last modified: Fri Apr 2 0 08:33:23 2001 Method I C:\MASSLYNX\lompoc.PRO\MethDB\LOMPOC Last modified: Fri Apr 2 0 08:48:31 2001 Job Code:
Printed: F r i Apr 2 0 08:49:25 2001
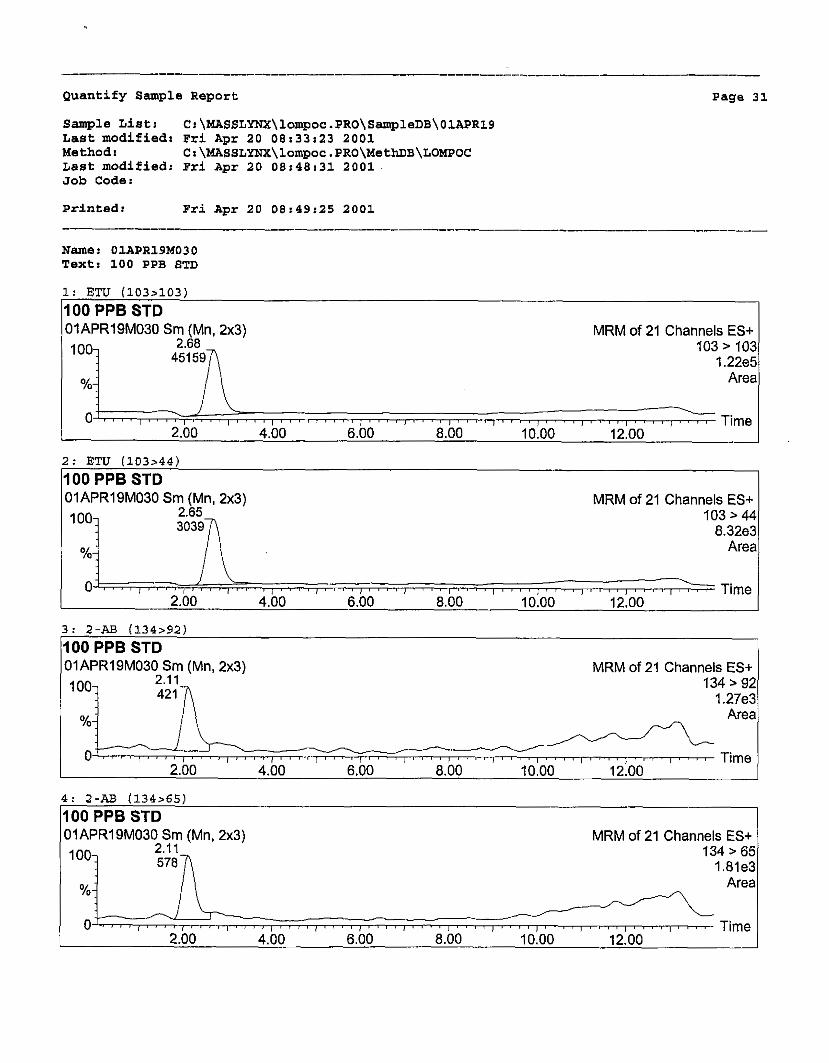
Name: 01APR19M030 Text: 100 PPB STD
1: ETU (103>103) 11 00 PPB STD I 101APR19M030 Sm (Mn. 2x3)
I loo] 2.68
451 59n
MRM of 21 Channels ES+ q03 > 103
1.22e5 Area
. . . . . . . . . . . . . . . . . . . . . . . . . . . . . . . . . . . . . . . . . . . . . . . . . . . . . . . . . . . . . . . . . 2.00 4.00 6.00 8.00 10.00 12.00
Time
2: ETU (103>44) 1100 PPB STD I 01APR19M030 Sm (Mn, 2x3) MRM of 21 Channels ES+
103 > 44 8.32e3
Area
. . . . . . . . . . . . . . . . . . . . . . . . . . . . . . . . . . . . . . . . . . . . . . . . . 2.00 4.00 6.00 8.00 10.00 12.00
Time
3: 2-AB (134>92) 100 PPB STD 01APR19M030 Sm (Mn, 2x3) MRM of 21 Channels ES+
1.27e3 1007 2.11 134 > 92
%:
01- . . . . . . . . . . . . . . . . . . . . . . . . . . . . . . . . . . . . . . . . . . . . . . . . . . . . . . . . . . . . . . .
Area
2.00 4.00 6.00 8.00 10.00 12.00
4: 2 - A B (134>65) 11 00 PPB STD I
Time
01APR19M030 Sm (Mn. 2x3) MRM of 21 Channels ES+ 134 > 65
1.81e3 Area
2.00 4.00 6.00 8.00 10.00 12.00 Time
Quantify Sample Report P a g e 32
Sample List: C;\MASSLYNX\lompoc.PRO\SampleDB\OlAPR19 Last modified: Fri Apr 2 0 08:33:23 2001 Method: C:\MASSLYNX\lompoC.PRO\MetMB\LOMPOC Last modified: Fri Apr 20 08:48:31 2001 Job Code:
Printed: Fri Apr 20 08:49:25 2001
Name: 01APR19M030 Text: 100 PPB STD
5: METHAMIDOPHOS (142>941 11 00 PPB STD 01APR19M030 Sm (Mn, 2x3)
%
MRM of 21 Channels ES+ 142 > 94 ~~ ~
1.70e4 Area
2.00 4.00 6.00 8.00 10.00 12.00 Time
6: METHAMIDOPHOS (142>125) 1100 PPB STD
MRM of 21 Channels ES+ 142 > 125
5.68e3
Area/
2.00 4.00 6.00 8.00 10.00 12.00 Time
7: METHOMYL (163>88) 100 PPB STD 01APR19M030 Sm (Mn, 2x3) MRM of 21 Channels ES+ 100: 9.51e3
Area %:
0 ~ ~ ~ ~ , ~ ~ ~ ~ ~ ~ ~ ~ , ~ ~ ~ " ~ ~ ~ ~ I ~ ~ " I ~ ~ ~ ~ I ~ " ~ I ~ ~ ~ ' I " ~ ' I ~ ~ ~ ' I " ~ ~ I ~ ~ ~ ' I ~ ~ ~ ' Time
3.04 163 > .sa
2.00 4.00 6.00 8.00 10.00 12.00
8 : METHOMYL (163>106) 100 PPB STD 01APR19M030 Sm (Mn, 2x3) MRM of 21 Channels ES+ 100: 9.87e3
%: Area
0 , , , , l , < = - l
3.04 163 > 106
1
2.00 4.00 6.00 8.00 10.00 12.00 Time
Quantify Sample Report
Sample List: C:\MASSLYNX\lompoc.PRO\SampleDB\OlAPRlS Last modified: Fri Apr 2 0 08:33:23 2001 Method: Last modified: Fri Apr 20 08:48:31 2001
C:\MASSLYNX\lompoc.PRO\MetMB\LOMPOC
Job Code:
Printed: Fri Apr 20 08~49:25 2001
Page 33
Name: 01APR19M030 Text: 100 PPB STD
9: ACEPHATE (184>95) 100 PPB STD OlAPRl9M030 Sm (Mn, 2x3) MRM of 21 Channels ES+
184 > 95 438
Area
I , , - I , , , I , I , , , , ,T, n w Time 2.00 4.00 6.00 8.00 10.00 12.00
10: ACEPHATE (184>49) 100 PPB STD 01APR19M030 Sm (Mn, 2x3) MRM of 21 Channels ES+
2.75 1 8 4 > 49 465
Area %
0 - ' l " " l ~ " l ' " ' " ' " i ~ Time
2.00 4.00 6.00 8.00 10.00 12.00
11: ACEPHATE (184>143) /IO0 PPB STD 01APR19M030 Sm (Mn, 2x3)
%
MRM of 21 Channels ES+ 184 > 143
6.02e3 Area
2.00 4.00 6.00 8.00 10.00 12.00 Time
12: MBC (192>160) 100 PPB STD 01APR19M030 Sm (Mn. 2x3) MRM of 21 Channels ES+ 100: 192 > 160
5.50e4 Area
%: 7814
0 " 1 ~ ~ ~ ~ / ~ " ~ / ' " ' 1 ~ k Time - 2.00 4.00 6.00 8.00 10.00 12.00
Quanti€y Sample Report Page 34
Sample List: C:\MASSLYNX\lompoc.PRO\SampleDB\OlAPRl9 Last modified: Fri Apr 20 08:33:23 2001 Method: C:\MASSLYNX\lompoc.PRO\MetMB\LOMPOC Last modified: Fri Apr 20 08:48:31 2001 Job Code:
Printed: Fri Apr 20 08:49:25 2001
Name: 01APR19M030 Text: 100 PPB STD
13: MBC (192>132) 100 PPB STD 01APR19M030 Sm (Mn, 2x3) MRM of 21 Channels ES+
192 > 132 2.37e3
Area
2.00 4.00 6.00 8.00 10.00 12.00
14: OXAMYL ( 2 2 0 > 7 2 )
h00 PPB STD 01APR19M030 Sm (Mn, 2x3)
2.79
YO
MRM of 21 Channels ES+ 220 > 72
1.43e3 Area
0 l " " l " " i ' ~ Time 2.00 4.00 6.00 8.00 10.00 12.00
15: OXAMYL ( 2 2 0 > 9 0 )
100 PPB STD 01APR19M030 Sm (Mn. 2x3) MRM of 21 Channels ES+
220 > 90 627
Area
, , 1 0 , -, - , m , I T , ' ' ' Time 2.00 4.00 6.00 8.00 10.00 12.00
16: BENOMYL (291>192) 100 PPB STD 01APR19M030 Sm (Mn, 2x3) MRM of 21 Channels ES+ 100: 6.68e4
%: Area
9.18 291 > 192
2.00 4.00 6.00 8.00 10.00 12.00 Time

Quantify Sample Report Page 36
ample List: C : \ ~ ~ A S S L Y N X \ ~ ~ ~ ~ ~ ~ . P R O \ S ~ ~ ~ ~ ~ D B \ O ~ A P R ~ ~
Method: Last modified: F r i Apr 20 08:33:23 2001
C:\MASSLYNX\lompoc.PRO\MetMB\LOMPOC Last modified: F r i Ape 20 08:48:31 2001 Job Code:
Printed: Fri Apr 20 08:49:25 2001 __-
Name: OlAPR19M030 Text: 100 PPB STD
21: THIODICARB (355>88) 1100 PPB STD 01APR19M030 Sm (Mn, 2x3)
%
MRM of 21 Channels ES+ 355 aa
5.61e3 Area
# Name
2 ETU (103.. 1 ETU (103..
3 2-AB (13.. 4 2-AB (13.. 5 METHAMID. . 6 METHAMID. . 7 METHOMYL.. 8 METHOMYL.. 9 ACEPHATE..
10 ACEPHATE.. 11 ACEPHATE.. 12 MBC (192..
14 OXAMYL (. . 13 MBC (192..
15 OXAMYL ( . . 16 BENOMYL . . 17 BENOMYL . . 18 THIOPHAN.. 19 THIOPHAN.. 20 THIODICA.. 21 THIODICA..
Scan 74 73 58 58
77 77
84 84 76
76 76
68
77 68
78 255 255 154
181 154
181
RT 2.681 45159
Area
2.646 3039 2.108 421 2.108 578 2.791 6231 2 .is1 2105 3.044 3623 3.044 2.755
4024 161
2.755 2.755 158
2195 2.466 7814 2.466 308 2.791 515 2.826 230 9.184 9.184
19355
5.554 9799
5.554 4475 1156
6.523 144 6.523 1740
45158.813 bb Response Flags ng/&
3038.771 bb 421.099 bd
6230.886 bb 578.456 bd
2104.744 bd 3623.050 dk 4023.817 bb 160.997 bb 158.232 bb
2194.657 bb 7813.620 bb 308.333 bb 514.925 bb 230.352 bb
19354.600 bb
4474.954 bb 9798.940 bb
1156.259 bb
1739.928 bb 144.338 bb
![Kuhlman, J Bioterr Biodef 2012, S3 Bioterrorism & Biodefense...Batelle [sic] man, ‘Goddamn it, you stuck your anthrax in an autoclave, and you turned it into hockey pucks’”[2]](https://img.pdfslide.us/doc/110x75/612749c9231f5c7a9f59c229/kuhlman-j-bioterr-biodef-2012-s3-bioterrorism-biodefense-batelle-sic.jpg)


![IMPRO4: UNA APLICACIÓN DE TIPO SAAS … · generales de impacto ambiental basadas en matrices (matriz de Leopold, Matriz de Grandes Presas y Sistema Batelle) [2-7]. Pero debido a](https://img.pdfslide.us/doc/110x75/5ba4e7a609d3f2ee718bec60/impro4-una-aplicacion-de-tipo-saas-generales-de-impacto-ambiental-basadas.jpg)