Embed Size (px)
Citation preview
APPENDIXJ–RESULTSOFSCREENINGOFGEOMETRICANDOPERATIONALIMPROVEMENTSSynchroHCMReports
AMPeakHour–ExistingConditionsPMPeakHour–ExistingConditionsAMPeakHour–MitigationAlternativesPMPeakHour–MitigationAlternatives

HCM Signalized Intersection Capacity Analysis Fairfax County Parkway Study3121: Fairfax County Parkway & Huntsman Blvd Existing Conditions
Timing Plan: AM Peak Synchro 9 ReportKimley-Horn and Associates, Inc. Page 1
Movement EBL EBT EBR WBL WBT WBR NBL NBT NBR SBL SBT SBRLane ConfigurationsTraffic Volume (vph) 80 40 40 180 20 170 20 1710 150 110 2795 20Future Volume (vph) 80 40 40 180 20 170 20 1710 150 110 2795 20Ideal Flow (vphpl) 1900 1900 1900 1900 1900 1900 1900 1900 1900 1900 1900 1900Grade (%) 4% 0% 1% -1%Total Lost time (s) 7.0 7.0 6.5 6.5 6.5 7.0 7.0 7.0 7.0 7.0 7.0Lane Util. Factor 1.00 1.00 0.95 0.95 1.00 1.00 0.95 1.00 1.00 0.95 1.00Frt 1.00 0.93 1.00 1.00 0.85 1.00 1.00 0.85 1.00 1.00 0.85Flt Protected 0.95 1.00 0.95 0.96 1.00 0.95 1.00 1.00 0.95 1.00 1.00Satd. Flow (prot) 1734 1689 1681 1701 1583 1761 3522 1575 1778 3557 1591Flt Permitted 0.95 1.00 0.95 0.96 1.00 0.03 1.00 1.00 0.08 1.00 1.00Satd. Flow (perm) 1734 1689 1681 1701 1583 51 3522 1575 153 3557 1591Peak-hour factor, PHF 1.00 1.00 1.00 1.00 1.00 1.00 1.00 1.00 1.00 1.00 1.00 1.00Adj. Flow (vph) 80 40 40 180 20 170 20 1710 150 110 2795 20RTOR Reduction (vph) 0 17 0 0 0 48 0 0 46 0 0 6Lane Group Flow (vph) 80 63 0 99 101 122 20 1710 104 110 2795 14Turn Type Split NA Split NA pt+ov pm+pt NA Perm pm+pt NA PermProtected Phases 3 3 4 4 4 1 5 2 1 6Permitted Phases 2 2 6 6Actuated Green, G (s) 12.4 12.4 16.1 16.1 31.5 149.3 145.1 145.1 158.7 149.8 149.8Effective Green, g (s) 12.4 12.4 16.1 16.1 31.5 149.3 145.1 145.1 158.7 149.8 149.8Actuated g/C Ratio 0.06 0.06 0.08 0.08 0.15 0.71 0.69 0.69 0.76 0.71 0.71Clearance Time (s) 7.0 7.0 6.5 6.5 7.0 7.0 7.0 7.0 7.0 7.0Vehicle Extension (s) 3.0 3.0 3.0 3.0 3.0 3.0 3.0 3.0 3.0 3.0Lane Grp Cap (vph) 102 99 128 130 237 70 2433 1088 184 2537 1134v/s Ratio Prot c0.05 0.04 0.06 c0.06 c0.08 0.01 0.49 0.03 c0.79v/s Ratio Perm 0.20 0.07 0.43 0.01v/c Ratio 0.78 0.64 0.77 0.78 0.51 0.29 0.70 0.10 0.60 1.10 0.01Uniform Delay, d1 97.5 96.6 95.2 95.2 82.2 56.8 19.5 10.7 22.8 30.1 8.7Progression Factor 1.00 1.00 1.00 1.00 1.00 1.00 1.00 1.00 1.78 0.78 1.00Incremental Delay, d2 31.6 12.7 24.7 24.7 1.9 2.2 1.7 0.2 1.4 47.7 0.0Delay (s) 129.1 109.3 119.8 119.9 84.1 59.0 21.2 10.9 41.9 71.2 8.7Level of Service F F F F F E C B D E AApproach Delay (s) 119.2 103.4 20.8 69.6Approach LOS F F C E
Intersection SummaryHCM 2000 Control Delay 56.3 HCM 2000 Level of Service EHCM 2000 Volume to Capacity ratio 1.06Actuated Cycle Length (s) 210.0 Sum of lost time (s) 27.5Intersection Capacity Utilization 112.4% ICU Level of Service HAnalysis Period (min) 15c Critical Lane Group
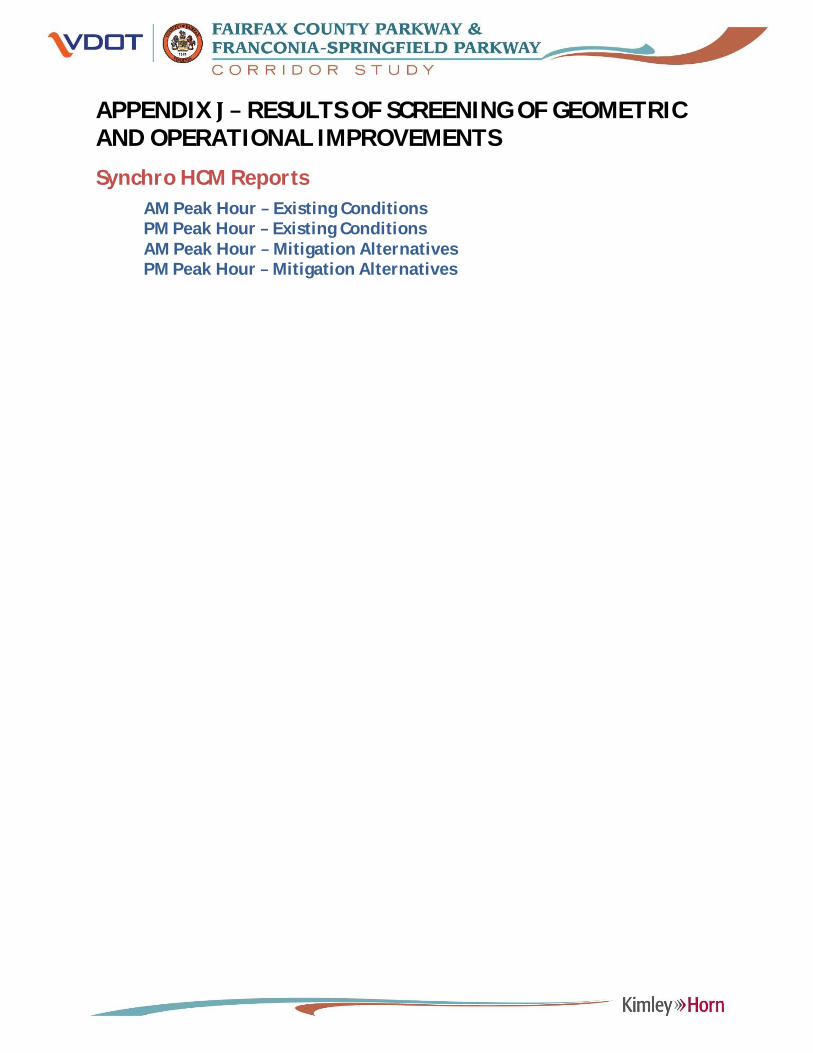
HCM Signalized Intersection Capacity Analysis Fairfax County Parkway Study3721: Fairfax County Parkway & Burke Lake Rd Existing Conditions
Timing Plan: AM Peak Synchro 9 ReportKimley-Horn and Associates, Inc. Page 2
Movement EBL EBT EBR WBL WBT WBR NBL NBT NBR SBL SBT SBRLane ConfigurationsTraffic Volume (vph) 110 320 100 40 90 140 50 2095 0 140 2425 70Future Volume (vph) 110 320 100 40 90 140 50 2095 0 140 2425 70Ideal Flow (vphpl) 1900 1900 1900 1900 1900 1900 1900 1900 1900 1900 1900 1900Grade (%) 4% 0% 2% 0%Total Lost time (s) 7.0 7.0 7.0 7.0 7.0 7.0 7.0 7.5 7.0 7.5 7.5Lane Util. Factor 1.00 0.95 1.00 1.00 0.95 1.00 1.00 0.95 1.00 0.95 1.00Frt 1.00 1.00 0.85 1.00 1.00 0.85 1.00 1.00 1.00 1.00 0.85Flt Protected 0.95 1.00 1.00 0.95 1.00 1.00 0.95 1.00 0.95 1.00 1.00Satd. Flow (prot) 1734 3468 1552 1770 3539 1583 1752 3504 1770 3539 1583Flt Permitted 0.50 1.00 1.00 0.35 1.00 1.00 0.95 1.00 0.95 1.00 1.00Satd. Flow (perm) 913 3468 1552 648 3539 1583 1752 3504 1770 3539 1583Peak-hour factor, PHF 1.00 1.00 1.00 1.00 1.00 1.00 1.00 1.00 1.00 1.00 1.00 1.00Adj. Flow (vph) 110 320 100 40 90 140 50 2095 0 140 2425 70RTOR Reduction (vph) 0 0 78 0 0 50 0 0 0 0 0 23Lane Group Flow (vph) 110 320 22 40 90 90 50 2095 0 140 2425 47Turn Type pm+pt NA pt+ov pm+pt NA pm+ov Prot NA Perm Prot NA PermProtected Phases 3 8 8 5 7 4 1 5 2 1 6Permitted Phases 8 4 4 2 6Actuated Green, G (s) 37.0 22.4 38.4 24.4 16.1 36.3 9.0 130.6 20.2 141.8 141.8Effective Green, g (s) 37.0 22.4 38.4 24.4 16.1 36.3 9.0 130.6 20.2 141.8 141.8Actuated g/C Ratio 0.18 0.11 0.18 0.12 0.08 0.17 0.04 0.62 0.10 0.68 0.68Clearance Time (s) 7.0 7.0 7.0 7.0 7.0 7.0 7.5 7.0 7.5 7.5Vehicle Extension (s) 3.0 3.0 3.0 3.0 3.0 3.0 3.0 3.0 3.0 3.0Lane Grp Cap (vph) 217 369 283 119 271 326 75 2179 170 2389 1068v/s Ratio Prot c0.04 c0.09 0.01 0.01 0.03 0.03 0.03 0.60 c0.08 c0.69v/s Ratio Perm 0.05 0.03 0.03 0.03v/c Ratio 0.51 0.87 0.08 0.34 0.33 0.28 0.67 0.96 0.82 1.02 0.04Uniform Delay, d1 76.2 92.3 71.1 84.0 91.9 75.5 99.0 37.3 93.2 34.1 11.4Progression Factor 1.00 1.00 1.00 1.00 1.00 1.00 1.24 0.52 0.96 0.90 2.40Incremental Delay, d2 1.9 18.8 0.1 1.7 0.7 0.5 14.4 9.3 17.0 18.0 0.0Delay (s) 78.0 111.1 71.2 85.7 92.6 75.9 137.6 28.7 106.1 48.6 27.5Level of Service E F E F F E F C F D CApproach Delay (s) 96.7 82.9 31.3 51.1Approach LOS F F C D
Intersection SummaryHCM 2000 Control Delay 49.3 HCM 2000 Level of Service DHCM 2000 Volume to Capacity ratio 1.00Actuated Cycle Length (s) 210.0 Sum of lost time (s) 28.5Intersection Capacity Utilization 108.0% ICU Level of Service GAnalysis Period (min) 15c Critical Lane Group
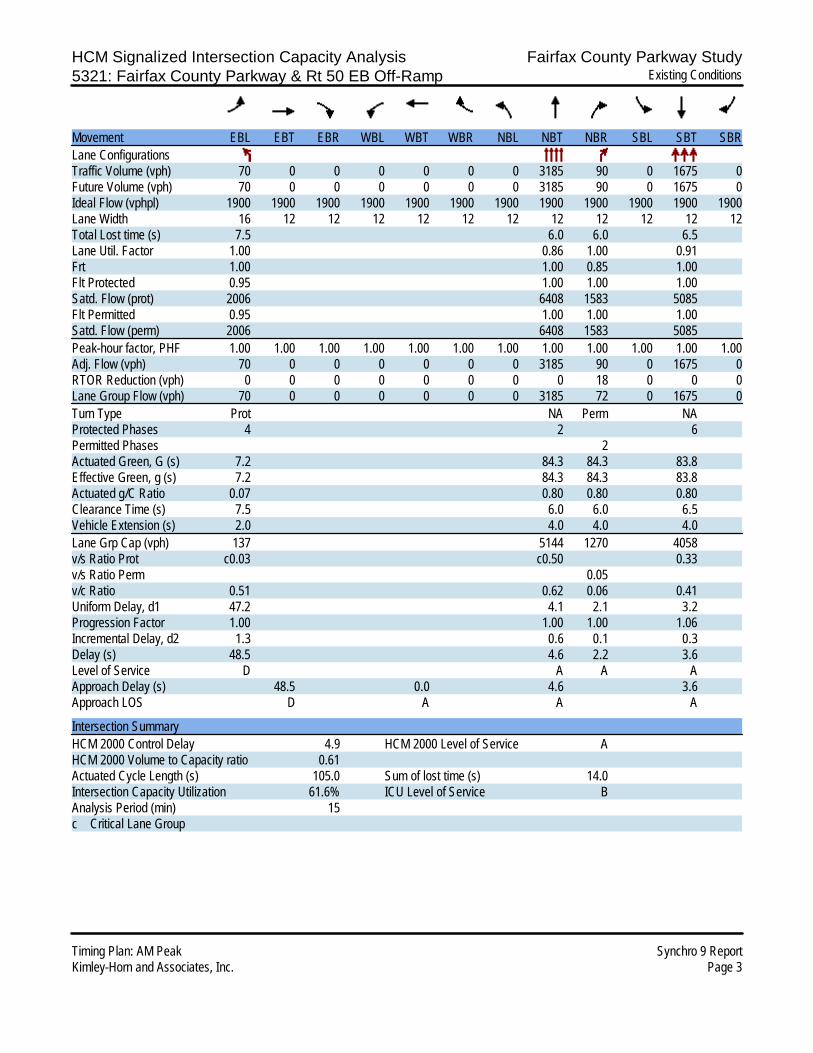
HCM Signalized Intersection Capacity Analysis Fairfax County Parkway Study5321: Fairfax County Parkway & Rt 50 EB Off-Ramp Existing Conditions
Timing Plan: AM Peak Synchro 9 ReportKimley-Horn and Associates, Inc. Page 3
Movement EBL EBT EBR WBL WBT WBR NBL NBT NBR SBL SBT SBRLane ConfigurationsTraffic Volume (vph) 70 0 0 0 0 0 0 3185 90 0 1675 0Future Volume (vph) 70 0 0 0 0 0 0 3185 90 0 1675 0Ideal Flow (vphpl) 1900 1900 1900 1900 1900 1900 1900 1900 1900 1900 1900 1900Lane Width 16 12 12 12 12 12 12 12 12 12 12 12Total Lost time (s) 7.5 6.0 6.0 6.5Lane Util. Factor 1.00 0.86 1.00 0.91Frt 1.00 1.00 0.85 1.00Flt Protected 0.95 1.00 1.00 1.00Satd. Flow (prot) 2006 6408 1583 5085Flt Permitted 0.95 1.00 1.00 1.00Satd. Flow (perm) 2006 6408 1583 5085Peak-hour factor, PHF 1.00 1.00 1.00 1.00 1.00 1.00 1.00 1.00 1.00 1.00 1.00 1.00Adj. Flow (vph) 70 0 0 0 0 0 0 3185 90 0 1675 0RTOR Reduction (vph) 0 0 0 0 0 0 0 0 18 0 0 0Lane Group Flow (vph) 70 0 0 0 0 0 0 3185 72 0 1675 0Turn Type Prot NA Perm NAProtected Phases 4 2 6Permitted Phases 2Actuated Green, G (s) 7.2 84.3 84.3 83.8Effective Green, g (s) 7.2 84.3 84.3 83.8Actuated g/C Ratio 0.07 0.80 0.80 0.80Clearance Time (s) 7.5 6.0 6.0 6.5Vehicle Extension (s) 2.0 4.0 4.0 4.0Lane Grp Cap (vph) 137 5144 1270 4058v/s Ratio Prot c0.03 c0.50 0.33v/s Ratio Perm 0.05v/c Ratio 0.51 0.62 0.06 0.41Uniform Delay, d1 47.2 4.1 2.1 3.2Progression Factor 1.00 1.00 1.00 1.06Incremental Delay, d2 1.3 0.6 0.1 0.3Delay (s) 48.5 4.6 2.2 3.6Level of Service D A A AApproach Delay (s) 48.5 0.0 4.6 3.6Approach LOS D A A A
Intersection SummaryHCM 2000 Control Delay 4.9 HCM 2000 Level of Service AHCM 2000 Volume to Capacity ratio 0.61Actuated Cycle Length (s) 105.0 Sum of lost time (s) 14.0Intersection Capacity Utilization 61.6% ICU Level of Service BAnalysis Period (min) 15c Critical Lane Group
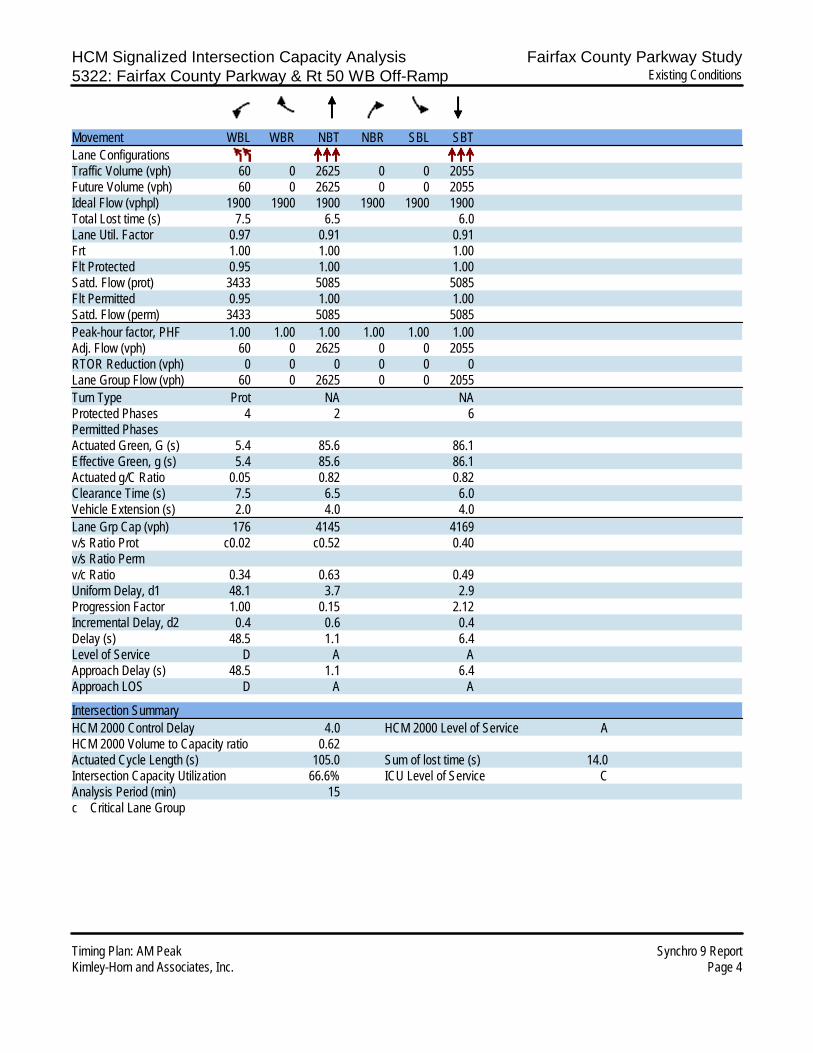
HCM Signalized Intersection Capacity Analysis Fairfax County Parkway Study5322: Fairfax County Parkway & Rt 50 WB Off-Ramp Existing Conditions
Timing Plan: AM Peak Synchro 9 ReportKimley-Horn and Associates, Inc. Page 4
Movement WBL WBR NBT NBR SBL SBTLane ConfigurationsTraffic Volume (vph) 60 0 2625 0 0 2055Future Volume (vph) 60 0 2625 0 0 2055Ideal Flow (vphpl) 1900 1900 1900 1900 1900 1900Total Lost time (s) 7.5 6.5 6.0Lane Util. Factor 0.97 0.91 0.91Frt 1.00 1.00 1.00Flt Protected 0.95 1.00 1.00Satd. Flow (prot) 3433 5085 5085Flt Permitted 0.95 1.00 1.00Satd. Flow (perm) 3433 5085 5085Peak-hour factor, PHF 1.00 1.00 1.00 1.00 1.00 1.00Adj. Flow (vph) 60 0 2625 0 0 2055RTOR Reduction (vph) 0 0 0 0 0 0Lane Group Flow (vph) 60 0 2625 0 0 2055Turn Type Prot NA NAProtected Phases 4 2 6Permitted PhasesActuated Green, G (s) 5.4 85.6 86.1Effective Green, g (s) 5.4 85.6 86.1Actuated g/C Ratio 0.05 0.82 0.82Clearance Time (s) 7.5 6.5 6.0Vehicle Extension (s) 2.0 4.0 4.0Lane Grp Cap (vph) 176 4145 4169v/s Ratio Prot c0.02 c0.52 0.40v/s Ratio Permv/c Ratio 0.34 0.63 0.49Uniform Delay, d1 48.1 3.7 2.9Progression Factor 1.00 0.15 2.12Incremental Delay, d2 0.4 0.6 0.4Delay (s) 48.5 1.1 6.4Level of Service D A AApproach Delay (s) 48.5 1.1 6.4Approach LOS D A A
Intersection SummaryHCM 2000 Control Delay 4.0 HCM 2000 Level of Service AHCM 2000 Volume to Capacity ratio 0.62Actuated Cycle Length (s) 105.0 Sum of lost time (s) 14.0Intersection Capacity Utilization 66.6% ICU Level of Service CAnalysis Period (min) 15c Critical Lane Group

HCM Signalized Intersection Capacity Analysis Fairfax County Parkway Study5421: Fairfax County Parkway & Rugby Rd Existing Conditions
Timing Plan: AM Peak Synchro 9 ReportKimley-Horn and Associates, Inc. Page 5
Movement EBL EBT EBR WBL WBT WBR NBL NBT NBR SBL SBT SBRLane ConfigurationsTraffic Volume (vph) 230 140 90 250 140 90 10 2220 790 150 1725 60Future Volume (vph) 230 140 90 250 140 90 10 2220 790 150 1725 60Ideal Flow (vphpl) 1900 1900 1900 1900 1900 1900 1900 1900 1900 1900 1900 1900Total Lost time (s) 7.5 5.5 5.5 7.5 6.5 8.0 9.0 6.5 7.5 8.0 6.0 7.5Lane Util. Factor 1.00 1.00 1.00 0.97 1.00 1.00 1.00 0.91 1.00 1.00 0.91 1.00Frt 1.00 1.00 0.85 1.00 1.00 0.85 1.00 1.00 0.85 1.00 1.00 0.85Flt Protected 0.95 1.00 1.00 0.95 1.00 1.00 0.95 1.00 1.00 0.95 1.00 1.00Satd. Flow (prot) 1770 1863 1583 3433 1863 1583 1770 5085 1583 1770 5085 1583Flt Permitted 0.95 1.00 1.00 0.95 1.00 1.00 0.95 1.00 1.00 0.95 1.00 1.00Satd. Flow (perm) 1770 1863 1583 3433 1863 1583 1770 5085 1583 1770 5085 1583Peak-hour factor, PHF 1.00 1.00 1.00 1.00 1.00 1.00 1.00 1.00 1.00 1.00 1.00 1.00Adj. Flow (vph) 230 140 90 250 140 90 10 2220 790 150 1725 60RTOR Reduction (vph) 0 0 81 0 0 44 0 0 93 0 0 16Lane Group Flow (vph) 230 140 9 250 140 46 10 2220 697 150 1725 44Turn Type Prot NA Perm Prot NA pm+ov Prot NA pm+ov Prot NA pm+ovProtected Phases 3 8 7 4 5 1 6 7 5 2 3Permitted Phases 8 4 6 2Actuated Green, G (s) 14.5 20.9 20.9 18.2 23.6 47.8 4.0 119.2 137.4 24.2 138.9 153.4Effective Green, g (s) 14.5 20.9 20.9 18.2 23.6 47.8 4.0 119.2 137.4 24.2 138.9 153.4Actuated g/C Ratio 0.07 0.10 0.10 0.09 0.11 0.23 0.02 0.57 0.65 0.12 0.66 0.73Clearance Time (s) 7.5 5.5 5.5 7.5 6.5 8.0 9.0 6.5 7.5 8.0 6.0 7.5Vehicle Extension (s) 3.0 3.0 3.0 3.0 3.0 5.0 5.0 3.0 3.0 5.0 3.0 3.0Lane Grp Cap (vph) 122 185 157 297 209 360 33 2886 1035 203 3363 1156v/s Ratio Prot c0.13 c0.08 0.07 c0.08 0.01 0.01 c0.44 0.06 c0.08 0.34 0.00v/s Ratio Perm 0.01 0.01 0.38 0.03v/c Ratio 1.89 0.76 0.06 0.84 0.67 0.13 0.30 0.77 0.67 0.74 0.51 0.04Uniform Delay, d1 97.8 92.1 85.6 94.5 89.5 64.5 101.6 34.8 22.4 89.8 18.2 7.8Progression Factor 1.00 1.00 1.00 1.00 1.00 1.00 1.12 0.91 0.83 1.18 0.77 0.11Incremental Delay, d2 427.6 16.1 0.2 18.9 7.9 0.3 9.1 1.8 1.5 12.2 0.4 0.0Delay (s) 525.4 108.2 85.8 113.4 97.4 64.9 122.9 33.5 20.1 118.1 14.5 0.9Level of Service F F F F F E F C C F B AApproach Delay (s) 312.4 99.6 30.3 22.1Approach LOS F F C C
Intersection SummaryHCM 2000 Control Delay 55.3 HCM 2000 Level of Service EHCM 2000 Volume to Capacity ratio 0.85Actuated Cycle Length (s) 210.0 Sum of lost time (s) 29.0Intersection Capacity Utilization 93.4% ICU Level of Service FAnalysis Period (min) 15c Critical Lane Group

HCM Unsignalized Intersection Capacity Analysis Fairfax County Parkway Study5531: Fairfax County Parkway & Old Plains Rd Existing Conditions
Timing Plan: AM Peak Synchro 9 ReportKimley-Horn and Associates, Inc. Page 6
Movement EBL EBR NBL NBT SBT SBRLane ConfigurationsTraffic Volume (veh/h) 0 50 0 2545 1880 20Future Volume (Veh/h) 0 50 0 2545 1880 20Sign Control Stop Free FreeGrade 0% 0% 0%Peak Hour Factor 1.00 1.00 1.00 1.00 1.00 1.00Hourly flow rate (vph) 0 50 0 2545 1880 20PedestriansLane Width (ft)Walking Speed (ft/s)Percent BlockageRight turn flare (veh)Median type None NoneMedian storage veh)Upstream signal (ft)pX, platoon unblockedvC, conflicting volume 3152 940 1900vC1, stage 1 conf volvC2, stage 2 conf volvCu, unblocked vol 3152 940 1900tC, single (s) 6.8 6.9 4.1tC, 2 stage (s)tF (s) 3.5 3.3 2.2p0 queue free % 100 81 100cM capacity (veh/h) 8 265 310
Direction, Lane # EB 1 NB 1 NB 2 SB 1 SB 2 SB 3Volume Total 50 1272 1272 940 940 20Volume Left 0 0 0 0 0 0Volume Right 50 0 0 0 0 20cSH 265 1700 1700 1700 1700 1700Volume to Capacity 0.19 0.75 0.75 0.55 0.55 0.01Queue Length 95th (ft) 17 0 0 0 0 0Control Delay (s) 21.7 0.0 0.0 0.0 0.0 0.0Lane LOS CApproach Delay (s) 21.7 0.0 0.0Approach LOS C
Intersection SummaryAverage Delay 0.2Intersection Capacity Utilization 73.7% ICU Level of Service DAnalysis Period (min) 15
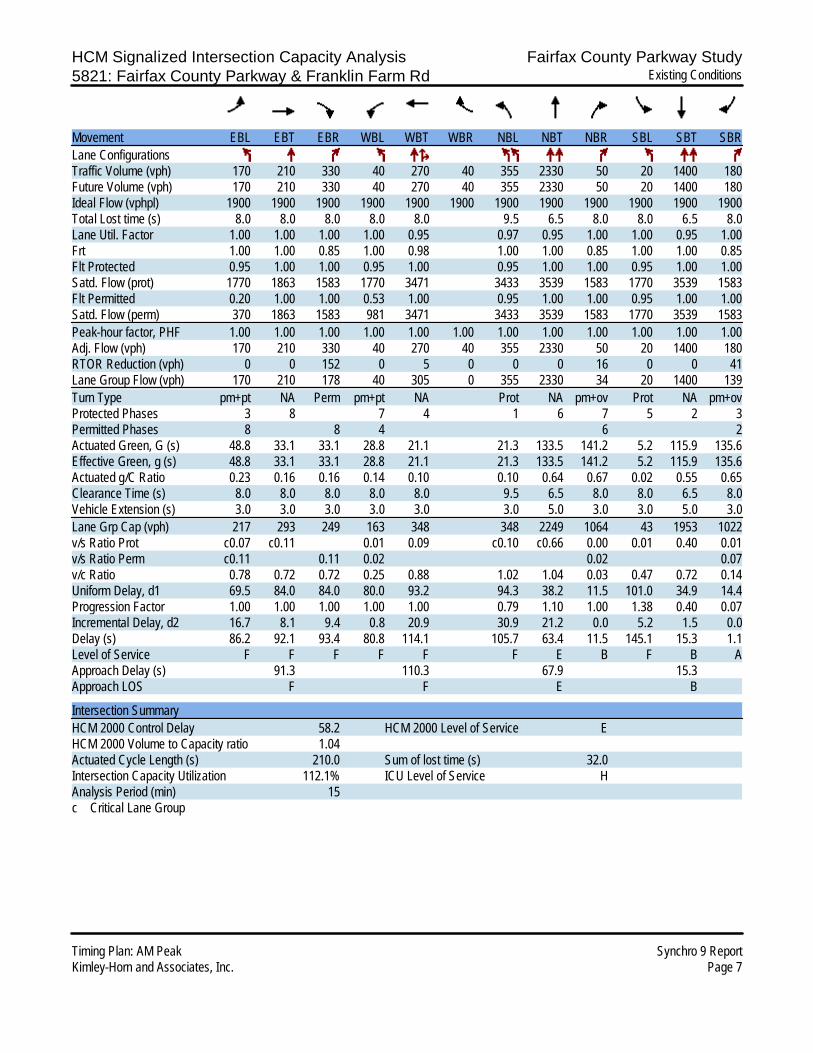
HCM Signalized Intersection Capacity Analysis Fairfax County Parkway Study5821: Fairfax County Parkway & Franklin Farm Rd Existing Conditions
Timing Plan: AM Peak Synchro 9 ReportKimley-Horn and Associates, Inc. Page 7
Movement EBL EBT EBR WBL WBT WBR NBL NBT NBR SBL SBT SBRLane ConfigurationsTraffic Volume (vph) 170 210 330 40 270 40 355 2330 50 20 1400 180Future Volume (vph) 170 210 330 40 270 40 355 2330 50 20 1400 180Ideal Flow (vphpl) 1900 1900 1900 1900 1900 1900 1900 1900 1900 1900 1900 1900Total Lost time (s) 8.0 8.0 8.0 8.0 8.0 9.5 6.5 8.0 8.0 6.5 8.0Lane Util. Factor 1.00 1.00 1.00 1.00 0.95 0.97 0.95 1.00 1.00 0.95 1.00Frt 1.00 1.00 0.85 1.00 0.98 1.00 1.00 0.85 1.00 1.00 0.85Flt Protected 0.95 1.00 1.00 0.95 1.00 0.95 1.00 1.00 0.95 1.00 1.00Satd. Flow (prot) 1770 1863 1583 1770 3471 3433 3539 1583 1770 3539 1583Flt Permitted 0.20 1.00 1.00 0.53 1.00 0.95 1.00 1.00 0.95 1.00 1.00Satd. Flow (perm) 370 1863 1583 981 3471 3433 3539 1583 1770 3539 1583Peak-hour factor, PHF 1.00 1.00 1.00 1.00 1.00 1.00 1.00 1.00 1.00 1.00 1.00 1.00Adj. Flow (vph) 170 210 330 40 270 40 355 2330 50 20 1400 180RTOR Reduction (vph) 0 0 152 0 5 0 0 0 16 0 0 41Lane Group Flow (vph) 170 210 178 40 305 0 355 2330 34 20 1400 139Turn Type pm+pt NA Perm pm+pt NA Prot NA pm+ov Prot NA pm+ovProtected Phases 3 8 7 4 1 6 7 5 2 3Permitted Phases 8 8 4 6 2Actuated Green, G (s) 48.8 33.1 33.1 28.8 21.1 21.3 133.5 141.2 5.2 115.9 135.6Effective Green, g (s) 48.8 33.1 33.1 28.8 21.1 21.3 133.5 141.2 5.2 115.9 135.6Actuated g/C Ratio 0.23 0.16 0.16 0.14 0.10 0.10 0.64 0.67 0.02 0.55 0.65Clearance Time (s) 8.0 8.0 8.0 8.0 8.0 9.5 6.5 8.0 8.0 6.5 8.0Vehicle Extension (s) 3.0 3.0 3.0 3.0 3.0 3.0 5.0 3.0 3.0 5.0 3.0Lane Grp Cap (vph) 217 293 249 163 348 348 2249 1064 43 1953 1022v/s Ratio Prot c0.07 c0.11 0.01 0.09 c0.10 c0.66 0.00 0.01 0.40 0.01v/s Ratio Perm c0.11 0.11 0.02 0.02 0.07v/c Ratio 0.78 0.72 0.72 0.25 0.88 1.02 1.04 0.03 0.47 0.72 0.14Uniform Delay, d1 69.5 84.0 84.0 80.0 93.2 94.3 38.2 11.5 101.0 34.9 14.4Progression Factor 1.00 1.00 1.00 1.00 1.00 0.79 1.10 1.00 1.38 0.40 0.07Incremental Delay, d2 16.7 8.1 9.4 0.8 20.9 30.9 21.2 0.0 5.2 1.5 0.0Delay (s) 86.2 92.1 93.4 80.8 114.1 105.7 63.4 11.5 145.1 15.3 1.1Level of Service F F F F F F E B F B AApproach Delay (s) 91.3 110.3 67.9 15.3Approach LOS F F E B
Intersection SummaryHCM 2000 Control Delay 58.2 HCM 2000 Level of Service EHCM 2000 Volume to Capacity ratio 1.04Actuated Cycle Length (s) 210.0 Sum of lost time (s) 32.0Intersection Capacity Utilization 112.1% ICU Level of Service HAnalysis Period (min) 15c Critical Lane Group

HCM Signalized Intersection Capacity Analysis Fairfax County Parkway Study5921: Fairfax County Parkway & West Ox Rd Existing Conditions
Timing Plan: AM PeakKimley-Horn and Associates, Inc.
Synchro 9 Report Page 8
Movement EBL EBT EBR WBL WBT WBR NBL NBT NBR SBL SBT SBRLane ConfigurationsTraffic Volume (vph) 170 230 310 40 290 90 560 1930 50 50 1245 260Future Volume (vph) 170 230 310 40 290 90 560 1930 50 50 1245 260Ideal Flow (vphpl) 1900 1900 1900 1900 1900 1900 1900 1900 1900 1900 1900 1900Total Lost time (s) 8.0 8.0 8.0 8.0 8.0 8.0 9.5 6.5 6.5 8.0 6.0 4.0Lane Util. Factor 1.00 1.00 1.00 1.00 1.00 1.00 0.97 0.95 1.00 1.00 0.95 1.00Frt 1.00 1.00 0.85 1.00 1.00 0.85 1.00 1.00 0.85 1.00 1.00 0.85Flt Protected 0.95 1.00 1.00 0.95 1.00 1.00 0.95 1.00 1.00 0.95 1.00 1.00Satd. Flow (prot) 1770 1863 1583 1770 1863 1583 3433 3539 1583 1770 3539 1583Flt Permitted 0.12 1.00 1.00 0.52 1.00 1.00 0.95 1.00 1.00 0.95 1.00 1.00Satd. Flow (perm) 219 1863 1583 975 1863 1583 3433 3539 1583 1770 3539 1583Peak-hour factor, PHF 1.00 1.00 1.00 1.00 1.00 1.00 1.00 1.00 1.00 1.00 1.00 1.00Adj. Flow (vph) 170 230 310 40 290 90 560 1930 50 50 1245 260RTOR Reduction (vph) 0 0 243 0 0 75 0 0 22 0 0 0Lane Group Flow (vph) 170 230 67 40 290 15 560 1930 28 50 1245 260Turn Type pm+pt NA Perm pm+pt NA Perm Prot NA Perm Prot NA FreeProtected Phases 3 8 7 4 1 6 5 2Permitted Phases 8 8 4 4 6 FreeActuated Green, G (s) 61.1 45.3 45.3 42.1 34.3 34.3 35.0 117.9 117.9 8.5 90.4 210.0Effective Green, g (s) 61.1 45.3 45.3 42.1 34.3 34.3 35.0 117.9 117.9 8.5 90.4 210.0Actuated g/C Ratio 0.29 0.22 0.22 0.20 0.16 0.16 0.17 0.56 0.56 0.04 0.43 1.00Clearance Time (s) 8.0 8.0 8.0 8.0 8.0 8.0 9.5 6.5 6.5 8.0 6.0Vehicle Extension (s) 3.0 3.0 3.0 3.0 3.0 3.0 3.0 3.0 3.0 3.0 3.0Lane Grp Cap (vph) 202 401 341 224 304 258 572 1986 888 71 1523 1583v/s Ratio Prot c0.08 0.12 0.01 c0.16 c0.16 c0.55 0.03 0.35v/s Ratio Perm 0.17 0.04 0.03 0.01 0.02 0.16v/c Ratio 0.84 0.57 0.20 0.18 0.95 0.06 0.98 0.97 0.03 0.70 0.82 0.16Uniform Delay, d1 61.6 73.7 67.4 68.7 87.1 74.2 87.1 44.4 20.6 99.5 52.5 0.0Progression Factor 1.00 1.00 1.00 1.00 1.00 1.00 1.07 0.65 1.00 1.09 0.78 1.00Incremental Delay, d2 25.8 2.0 0.3 0.4 39.1 0.1 14.3 5.6 0.0 21.8 3.9 0.2Delay (s) 87.5 75.7 67.7 69.1 126.2 74.3 107.7 34.4 20.6 130.0 45.1 0.2Level of Service F E E E F E F C C F D AApproach Delay (s) 75.0 109.6 50.3 40.3Approach LOS E F D D
Intersection SummaryHCM 2000 Control Delay 55.5 HCM 2000 Level of Service EHCM 2000 Volume to Capacity ratio 0.99Actuated Cycle Length (s) 210.0 Sum of lost time (s) 31.5Intersection Capacity Utilization 107.6% ICU Level of Service GAnalysis Period (min) 15c Critical Lane Group

HCM Signalized Intersection Capacity Analysis Fairfax County Parkway Study6021: Fairfax County Parkway & Fox Mill Rd Existing Conditions
Timing Plan: AM Peak Synchro 9 ReportKimley-Horn and Associates, Inc. Page 9
Movement EBL EBT EBR WBL WBT WBR NBL NBT NBR SBL SBT SBRLane ConfigurationsTraffic Volume (vph) 100 350 230 110 390 190 220 1840 130 170 1220 40Future Volume (vph) 100 350 230 110 390 190 220 1840 130 170 1220 40Ideal Flow (vphpl) 1900 1900 1900 1900 1900 1900 1900 1900 1900 1900 1900 1900Total Lost time (s) 8.5 8.5 10.0 8.5 8.5 9.0 10.0 6.5 8.5 9.0 6.5 8.5Lane Util. Factor 1.00 0.95 1.00 1.00 0.95 1.00 1.00 0.95 1.00 1.00 0.95 1.00Frt 1.00 1.00 0.85 1.00 1.00 0.85 1.00 1.00 0.85 1.00 1.00 0.85Flt Protected 0.95 1.00 1.00 0.95 1.00 1.00 0.95 1.00 1.00 0.95 1.00 1.00Satd. Flow (prot) 1770 3539 1583 1770 3539 1583 1770 3539 1583 1770 3539 1583Flt Permitted 0.20 1.00 1.00 0.26 1.00 1.00 0.95 1.00 1.00 0.95 1.00 1.00Satd. Flow (perm) 372 3539 1583 480 3539 1583 1770 3539 1583 1770 3539 1583Peak-hour factor, PHF 1.00 1.00 1.00 1.00 1.00 1.00 1.00 1.00 1.00 1.00 1.00 1.00Adj. Flow (vph) 100 350 230 110 390 190 220 1840 130 170 1220 40RTOR Reduction (vph) 0 0 55 0 0 90 0 0 27 0 0 16Lane Group Flow (vph) 100 350 175 110 390 100 220 1840 103 170 1220 24Turn Type pm+pt NA pm+ov pm+pt NA pm+ov Prot NA pm+ov Prot NA pm+ovProtected Phases 3 8 1 7 4 5 1 6 7 5 2 3Permitted Phases 8 8 4 4 6 2Actuated Green, G (s) 38.3 24.4 52.8 38.9 24.7 43.6 28.4 120.0 134.2 18.9 109.5 123.4Effective Green, g (s) 38.3 24.4 52.8 38.9 24.7 43.6 28.4 120.0 134.2 18.9 109.5 123.4Actuated g/C Ratio 0.18 0.12 0.25 0.19 0.12 0.21 0.14 0.57 0.64 0.09 0.52 0.59Clearance Time (s) 8.5 8.5 10.0 8.5 8.5 9.0 10.0 6.5 8.5 9.0 6.5 8.5Vehicle Extension (s) 3.0 3.0 3.0 3.0 3.0 3.0 3.0 3.0 3.0 3.0 3.0 3.0Lane Grp Cap (vph) 160 411 398 176 416 328 239 2022 1011 159 1845 930v/s Ratio Prot 0.04 0.10 0.06 c0.04 c0.11 0.03 c0.12 c0.52 0.01 0.10 0.34 0.00v/s Ratio Perm 0.07 0.05 0.07 0.04 0.06 0.01v/c Ratio 0.62 0.85 0.44 0.62 0.94 0.30 0.92 0.91 0.10 1.07 0.66 0.03Uniform Delay, d1 75.0 91.0 66.1 74.8 91.9 70.4 89.7 40.2 14.6 95.5 36.7 18.1Progression Factor 1.00 1.00 1.00 1.00 1.00 1.00 1.35 0.41 0.07 0.78 1.09 1.00Incremental Delay, d2 7.4 15.5 0.8 6.8 28.6 0.5 19.7 3.3 0.0 79.6 1.3 0.0Delay (s) 82.4 106.5 66.9 81.5 120.5 70.9 141.1 19.9 1.0 154.5 41.4 18.1Level of Service F F E F F E F B A F D BApproach Delay (s) 89.6 100.6 31.0 54.2Approach LOS F F C D
Intersection SummaryHCM 2000 Control Delay 55.2 HCM 2000 Level of Service EHCM 2000 Volume to Capacity ratio 0.93Actuated Cycle Length (s) 210.0 Sum of lost time (s) 33.5Intersection Capacity Utilization 106.0% ICU Level of Service GAnalysis Period (min) 15c Critical Lane Group
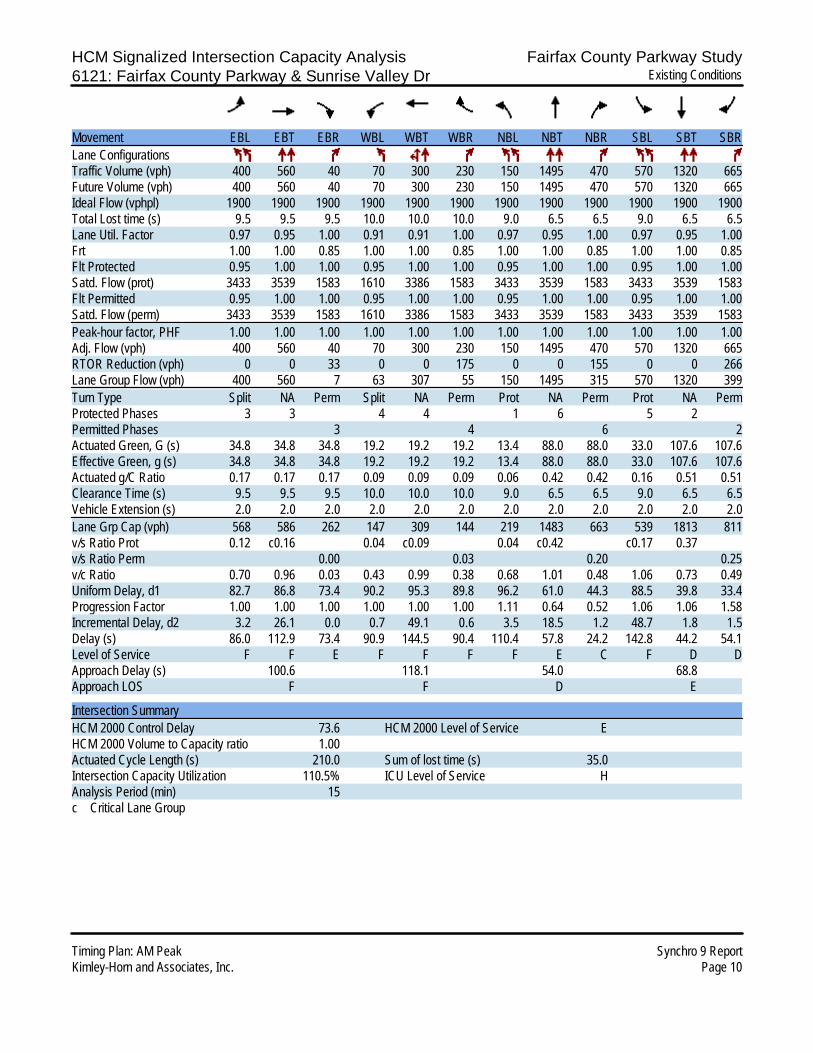
HCM Signalized Intersection Capacity Analysis Fairfax County Parkway Study6121: Fairfax County Parkway & Sunrise Valley Dr Existing Conditions
Timing Plan: AM Peak Synchro 9 ReportKimley-Horn and Associates, Inc. Page 10
Movement EBL EBT EBR WBL WBT WBR NBL NBT NBR SBL SBT SBRLane ConfigurationsTraffic Volume (vph) 400 560 40 70 300 230 150 1495 470 570 1320 665Future Volume (vph) 400 560 40 70 300 230 150 1495 470 570 1320 665Ideal Flow (vphpl) 1900 1900 1900 1900 1900 1900 1900 1900 1900 1900 1900 1900Total Lost time (s) 9.5 9.5 9.5 10.0 10.0 10.0 9.0 6.5 6.5 9.0 6.5 6.5Lane Util. Factor 0.97 0.95 1.00 0.91 0.91 1.00 0.97 0.95 1.00 0.97 0.95 1.00Frt 1.00 1.00 0.85 1.00 1.00 0.85 1.00 1.00 0.85 1.00 1.00 0.85Flt Protected 0.95 1.00 1.00 0.95 1.00 1.00 0.95 1.00 1.00 0.95 1.00 1.00Satd. Flow (prot) 3433 3539 1583 1610 3386 1583 3433 3539 1583 3433 3539 1583Flt Permitted 0.95 1.00 1.00 0.95 1.00 1.00 0.95 1.00 1.00 0.95 1.00 1.00Satd. Flow (perm) 3433 3539 1583 1610 3386 1583 3433 3539 1583 3433 3539 1583Peak-hour factor, PHF 1.00 1.00 1.00 1.00 1.00 1.00 1.00 1.00 1.00 1.00 1.00 1.00Adj. Flow (vph) 400 560 40 70 300 230 150 1495 470 570 1320 665RTOR Reduction (vph) 0 0 33 0 0 175 0 0 155 0 0 266Lane Group Flow (vph) 400 560 7 63 307 55 150 1495 315 570 1320 399Turn Type Split NA Perm Split NA Perm Prot NA Perm Prot NA PermProtected Phases 3 3 4 4 1 6 5 2Permitted Phases 3 4 6 2Actuated Green, G (s) 34.8 34.8 34.8 19.2 19.2 19.2 13.4 88.0 88.0 33.0 107.6 107.6Effective Green, g (s) 34.8 34.8 34.8 19.2 19.2 19.2 13.4 88.0 88.0 33.0 107.6 107.6Actuated g/C Ratio 0.17 0.17 0.17 0.09 0.09 0.09 0.06 0.42 0.42 0.16 0.51 0.51Clearance Time (s) 9.5 9.5 9.5 10.0 10.0 10.0 9.0 6.5 6.5 9.0 6.5 6.5Vehicle Extension (s) 2.0 2.0 2.0 2.0 2.0 2.0 2.0 2.0 2.0 2.0 2.0 2.0Lane Grp Cap (vph) 568 586 262 147 309 144 219 1483 663 539 1813 811v/s Ratio Prot 0.12 c0.16 0.04 c0.09 0.04 c0.42 c0.17 0.37v/s Ratio Perm 0.00 0.03 0.20 0.25v/c Ratio 0.70 0.96 0.03 0.43 0.99 0.38 0.68 1.01 0.48 1.06 0.73 0.49Uniform Delay, d1 82.7 86.8 73.4 90.2 95.3 89.8 96.2 61.0 44.3 88.5 39.8 33.4Progression Factor 1.00 1.00 1.00 1.00 1.00 1.00 1.11 0.64 0.52 1.06 1.06 1.58Incremental Delay, d2 3.2 26.1 0.0 0.7 49.1 0.6 3.5 18.5 1.2 48.7 1.8 1.5Delay (s) 86.0 112.9 73.4 90.9 144.5 90.4 110.4 57.8 24.2 142.8 44.2 54.1Level of Service F F E F F F F E C F D DApproach Delay (s) 100.6 118.1 54.0 68.8Approach LOS F F D E
Intersection SummaryHCM 2000 Control Delay 73.6 HCM 2000 Level of Service EHCM 2000 Volume to Capacity ratio 1.00Actuated Cycle Length (s) 210.0 Sum of lost time (s) 35.0Intersection Capacity Utilization 110.5% ICU Level of Service HAnalysis Period (min) 15c Critical Lane Group
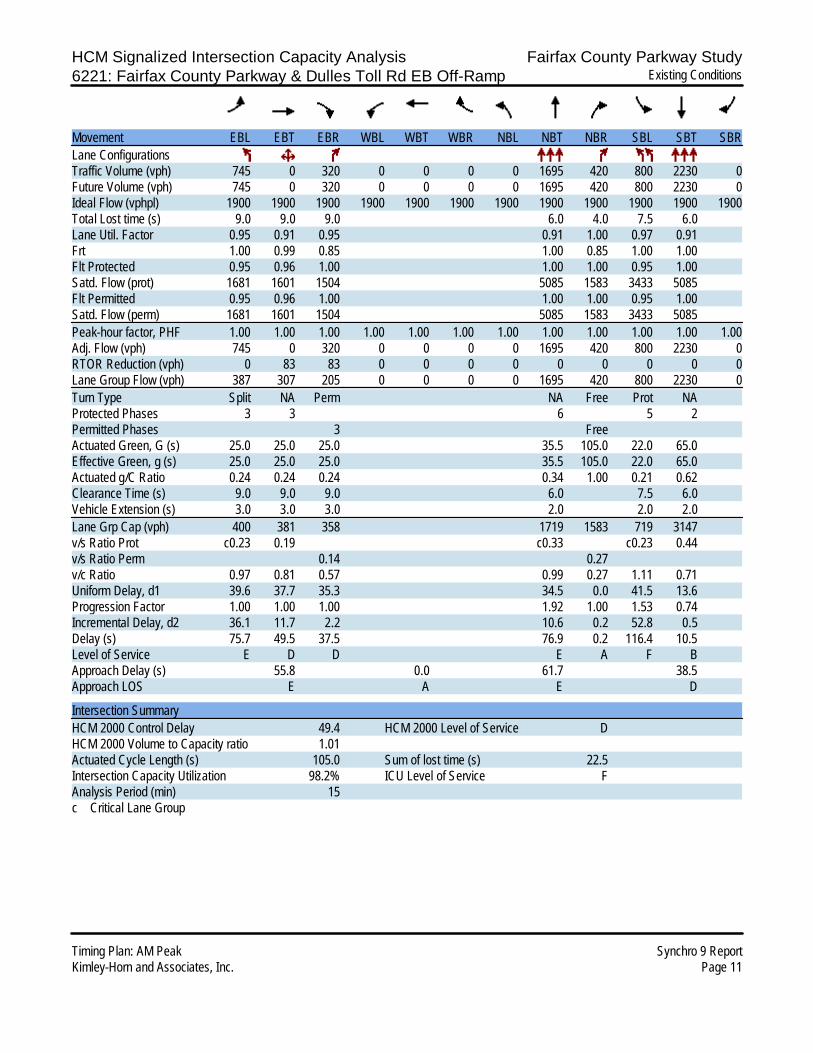
HCM Signalized Intersection Capacity Analysis Fairfax County Parkway Study6221: Fairfax County Parkway & Dulles Toll Rd EB Off-Ramp Existing Conditions
Timing Plan: AM Peak Synchro 9 ReportKimley-Horn and Associates, Inc. Page 11
Movement EBL EBT EBR WBL WBT WBR NBL NBT NBR SBL SBT SBRLane ConfigurationsTraffic Volume (vph) 745 0 320 0 0 0 0 1695 420 800 2230 0Future Volume (vph) 745 0 320 0 0 0 0 1695 420 800 2230 0Ideal Flow (vphpl) 1900 1900 1900 1900 1900 1900 1900 1900 1900 1900 1900 1900Total Lost time (s) 9.0 9.0 9.0 6.0 4.0 7.5 6.0Lane Util. Factor 0.95 0.91 0.95 0.91 1.00 0.97 0.91Frt 1.00 0.99 0.85 1.00 0.85 1.00 1.00Flt Protected 0.95 0.96 1.00 1.00 1.00 0.95 1.00Satd. Flow (prot) 1681 1601 1504 5085 1583 3433 5085Flt Permitted 0.95 0.96 1.00 1.00 1.00 0.95 1.00Satd. Flow (perm) 1681 1601 1504 5085 1583 3433 5085Peak-hour factor, PHF 1.00 1.00 1.00 1.00 1.00 1.00 1.00 1.00 1.00 1.00 1.00 1.00Adj. Flow (vph) 745 0 320 0 0 0 0 1695 420 800 2230 0RTOR Reduction (vph) 0 83 83 0 0 0 0 0 0 0 0 0Lane Group Flow (vph) 387 307 205 0 0 0 0 1695 420 800 2230 0Turn Type Split NA Perm NA Free Prot NAProtected Phases 3 3 6 5 2Permitted Phases 3 FreeActuated Green, G (s) 25.0 25.0 25.0 35.5 105.0 22.0 65.0Effective Green, g (s) 25.0 25.0 25.0 35.5 105.0 22.0 65.0Actuated g/C Ratio 0.24 0.24 0.24 0.34 1.00 0.21 0.62Clearance Time (s) 9.0 9.0 9.0 6.0 7.5 6.0Vehicle Extension (s) 3.0 3.0 3.0 2.0 2.0 2.0Lane Grp Cap (vph) 400 381 358 1719 1583 719 3147v/s Ratio Prot c0.23 0.19 c0.33 c0.23 0.44v/s Ratio Perm 0.14 0.27v/c Ratio 0.97 0.81 0.57 0.99 0.27 1.11 0.71Uniform Delay, d1 39.6 37.7 35.3 34.5 0.0 41.5 13.6Progression Factor 1.00 1.00 1.00 1.92 1.00 1.53 0.74Incremental Delay, d2 36.1 11.7 2.2 10.6 0.2 52.8 0.5Delay (s) 75.7 49.5 37.5 76.9 0.2 116.4 10.5Level of Service E D D E A F BApproach Delay (s) 55.8 0.0 61.7 38.5Approach LOS E A E D
Intersection SummaryHCM 2000 Control Delay 49.4 HCM 2000 Level of Service DHCM 2000 Volume to Capacity ratio 1.01Actuated Cycle Length (s) 105.0 Sum of lost time (s) 22.5Intersection Capacity Utilization 98.2% ICU Level of Service FAnalysis Period (min) 15c Critical Lane Group
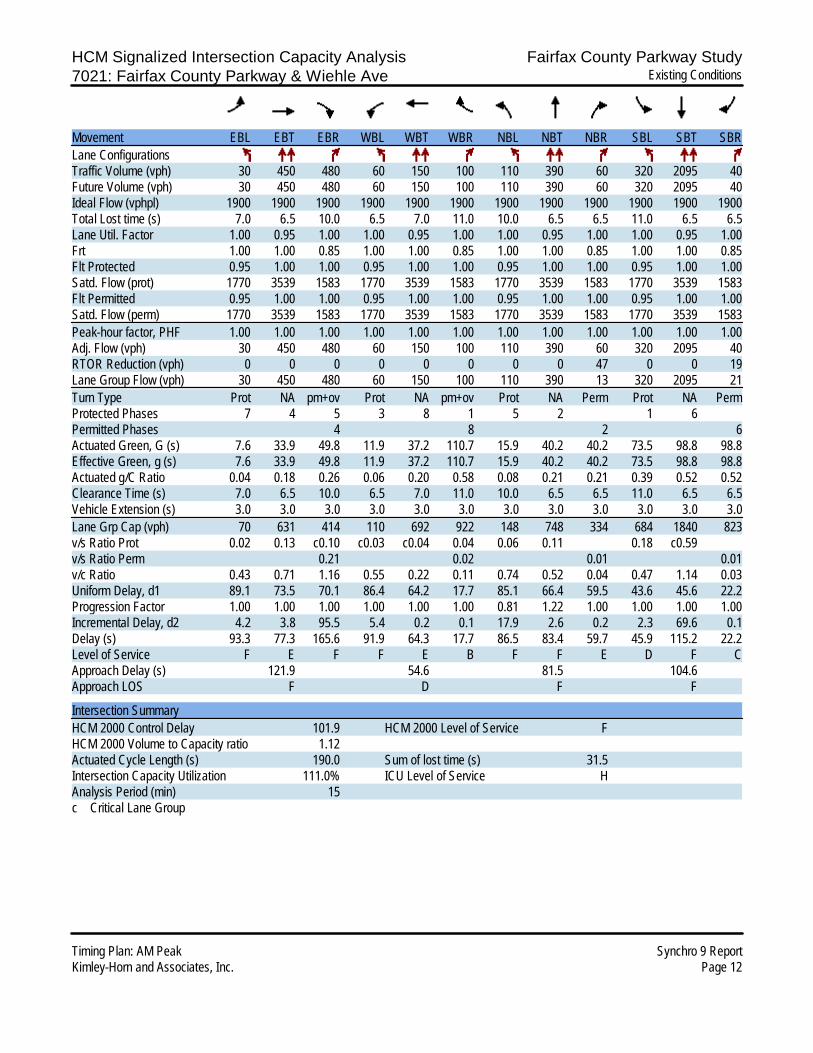
HCM Signalized Intersection Capacity Analysis Fairfax County Parkway Study7021: Fairfax County Parkway & Wiehle Ave Existing Conditions
Timing Plan: AM Peak Synchro 9 ReportKimley-Horn and Associates, Inc. Page 12
Movement EBL EBT EBR WBL WBT WBR NBL NBT NBR SBL SBT SBRLane ConfigurationsTraffic Volume (vph) 30 450 480 60 150 100 110 390 60 320 2095 40Future Volume (vph) 30 450 480 60 150 100 110 390 60 320 2095 40Ideal Flow (vphpl) 1900 1900 1900 1900 1900 1900 1900 1900 1900 1900 1900 1900Total Lost time (s) 7.0 6.5 10.0 6.5 7.0 11.0 10.0 6.5 6.5 11.0 6.5 6.5Lane Util. Factor 1.00 0.95 1.00 1.00 0.95 1.00 1.00 0.95 1.00 1.00 0.95 1.00Frt 1.00 1.00 0.85 1.00 1.00 0.85 1.00 1.00 0.85 1.00 1.00 0.85Flt Protected 0.95 1.00 1.00 0.95 1.00 1.00 0.95 1.00 1.00 0.95 1.00 1.00Satd. Flow (prot) 1770 3539 1583 1770 3539 1583 1770 3539 1583 1770 3539 1583Flt Permitted 0.95 1.00 1.00 0.95 1.00 1.00 0.95 1.00 1.00 0.95 1.00 1.00Satd. Flow (perm) 1770 3539 1583 1770 3539 1583 1770 3539 1583 1770 3539 1583Peak-hour factor, PHF 1.00 1.00 1.00 1.00 1.00 1.00 1.00 1.00 1.00 1.00 1.00 1.00Adj. Flow (vph) 30 450 480 60 150 100 110 390 60 320 2095 40RTOR Reduction (vph) 0 0 0 0 0 0 0 0 47 0 0 19Lane Group Flow (vph) 30 450 480 60 150 100 110 390 13 320 2095 21Turn Type Prot NA pm+ov Prot NA pm+ov Prot NA Perm Prot NA PermProtected Phases 7 4 5 3 8 1 5 2 1 6Permitted Phases 4 8 2 6Actuated Green, G (s) 7.6 33.9 49.8 11.9 37.2 110.7 15.9 40.2 40.2 73.5 98.8 98.8Effective Green, g (s) 7.6 33.9 49.8 11.9 37.2 110.7 15.9 40.2 40.2 73.5 98.8 98.8Actuated g/C Ratio 0.04 0.18 0.26 0.06 0.20 0.58 0.08 0.21 0.21 0.39 0.52 0.52Clearance Time (s) 7.0 6.5 10.0 6.5 7.0 11.0 10.0 6.5 6.5 11.0 6.5 6.5Vehicle Extension (s) 3.0 3.0 3.0 3.0 3.0 3.0 3.0 3.0 3.0 3.0 3.0 3.0Lane Grp Cap (vph) 70 631 414 110 692 922 148 748 334 684 1840 823v/s Ratio Prot 0.02 0.13 c0.10 c0.03 c0.04 0.04 0.06 0.11 0.18 c0.59v/s Ratio Perm 0.21 0.02 0.01 0.01v/c Ratio 0.43 0.71 1.16 0.55 0.22 0.11 0.74 0.52 0.04 0.47 1.14 0.03Uniform Delay, d1 89.1 73.5 70.1 86.4 64.2 17.7 85.1 66.4 59.5 43.6 45.6 22.2Progression Factor 1.00 1.00 1.00 1.00 1.00 1.00 0.81 1.22 1.00 1.00 1.00 1.00Incremental Delay, d2 4.2 3.8 95.5 5.4 0.2 0.1 17.9 2.6 0.2 2.3 69.6 0.1Delay (s) 93.3 77.3 165.6 91.9 64.3 17.7 86.5 83.4 59.7 45.9 115.2 22.2Level of Service F E F F E B F F E D F CApproach Delay (s) 121.9 54.6 81.5 104.6Approach LOS F D F F
Intersection SummaryHCM 2000 Control Delay 101.9 HCM 2000 Level of Service FHCM 2000 Volume to Capacity ratio 1.12Actuated Cycle Length (s) 190.0 Sum of lost time (s) 31.5Intersection Capacity Utilization 111.0% ICU Level of Service HAnalysis Period (min) 15c Critical Lane Group
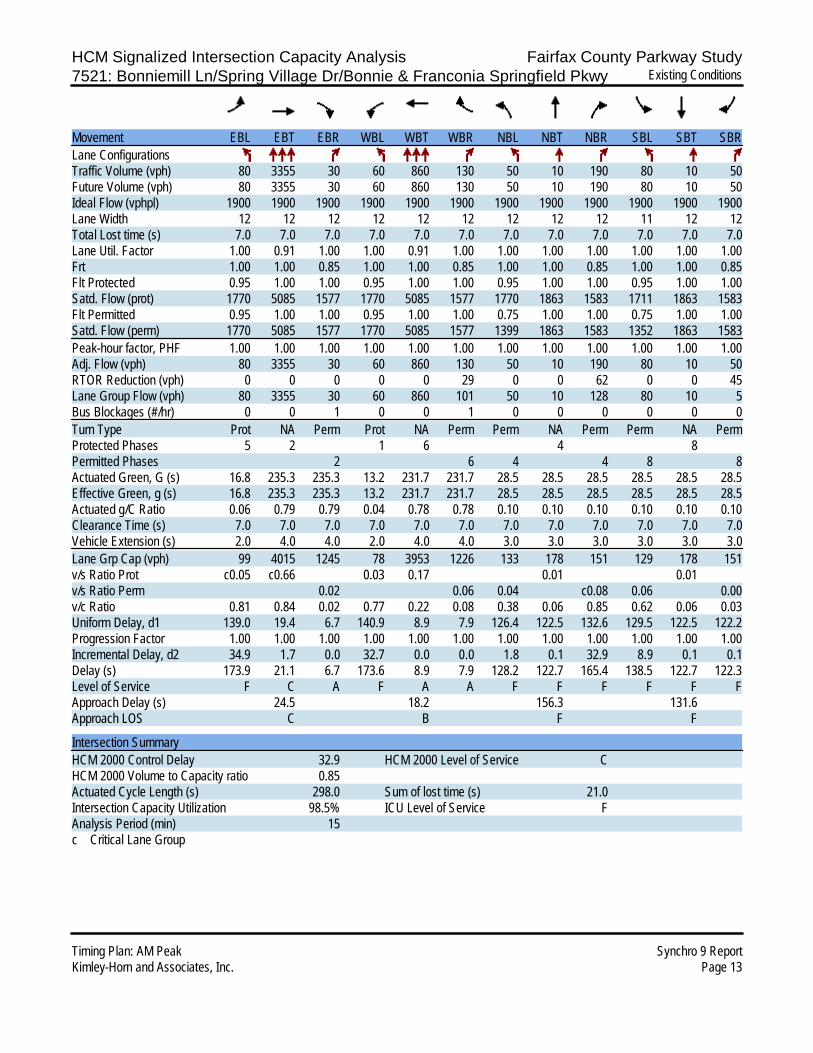
HCM Signalized Intersection Capacity Analysis Fairfax County Parkway Study7521: Bonniemill Ln/Spring Village Dr/Bonnie & Franconia Springfield Pkwy Existing Conditions
Timing Plan: AM Peak Synchro 9 ReportKimley-Horn and Associates, Inc. Page 13
Movement EBL EBT EBR WBL WBT WBR NBL NBT NBR SBL SBT SBRLane ConfigurationsTraffic Volume (vph) 80 3355 30 60 860 130 50 10 190 80 10 50Future Volume (vph) 80 3355 30 60 860 130 50 10 190 80 10 50Ideal Flow (vphpl) 1900 1900 1900 1900 1900 1900 1900 1900 1900 1900 1900 1900Lane Width 12 12 12 12 12 12 12 12 12 11 12 12Total Lost time (s) 7.0 7.0 7.0 7.0 7.0 7.0 7.0 7.0 7.0 7.0 7.0 7.0Lane Util. Factor 1.00 0.91 1.00 1.00 0.91 1.00 1.00 1.00 1.00 1.00 1.00 1.00Frt 1.00 1.00 0.85 1.00 1.00 0.85 1.00 1.00 0.85 1.00 1.00 0.85Flt Protected 0.95 1.00 1.00 0.95 1.00 1.00 0.95 1.00 1.00 0.95 1.00 1.00Satd. Flow (prot) 1770 5085 1577 1770 5085 1577 1770 1863 1583 1711 1863 1583Flt Permitted 0.95 1.00 1.00 0.95 1.00 1.00 0.75 1.00 1.00 0.75 1.00 1.00Satd. Flow (perm) 1770 5085 1577 1770 5085 1577 1399 1863 1583 1352 1863 1583Peak-hour factor, PHF 1.00 1.00 1.00 1.00 1.00 1.00 1.00 1.00 1.00 1.00 1.00 1.00Adj. Flow (vph) 80 3355 30 60 860 130 50 10 190 80 10 50RTOR Reduction (vph) 0 0 0 0 0 29 0 0 62 0 0 45Lane Group Flow (vph) 80 3355 30 60 860 101 50 10 128 80 10 5Bus Blockages (#/hr) 0 0 1 0 0 1 0 0 0 0 0 0Turn Type Prot NA Perm Prot NA Perm Perm NA Perm Perm NA PermProtected Phases 5 2 1 6 4 8Permitted Phases 2 6 4 4 8 8Actuated Green, G (s) 16.8 235.3 235.3 13.2 231.7 231.7 28.5 28.5 28.5 28.5 28.5 28.5Effective Green, g (s) 16.8 235.3 235.3 13.2 231.7 231.7 28.5 28.5 28.5 28.5 28.5 28.5Actuated g/C Ratio 0.06 0.79 0.79 0.04 0.78 0.78 0.10 0.10 0.10 0.10 0.10 0.10Clearance Time (s) 7.0 7.0 7.0 7.0 7.0 7.0 7.0 7.0 7.0 7.0 7.0 7.0Vehicle Extension (s) 2.0 4.0 4.0 2.0 4.0 4.0 3.0 3.0 3.0 3.0 3.0 3.0Lane Grp Cap (vph) 99 4015 1245 78 3953 1226 133 178 151 129 178 151v/s Ratio Prot c0.05 c0.66 0.03 0.17 0.01 0.01v/s Ratio Perm 0.02 0.06 0.04 c0.08 0.06 0.00v/c Ratio 0.81 0.84 0.02 0.77 0.22 0.08 0.38 0.06 0.85 0.62 0.06 0.03Uniform Delay, d1 139.0 19.4 6.7 140.9 8.9 7.9 126.4 122.5 132.6 129.5 122.5 122.2Progression Factor 1.00 1.00 1.00 1.00 1.00 1.00 1.00 1.00 1.00 1.00 1.00 1.00Incremental Delay, d2 34.9 1.7 0.0 32.7 0.0 0.0 1.8 0.1 32.9 8.9 0.1 0.1Delay (s) 173.9 21.1 6.7 173.6 8.9 7.9 128.2 122.7 165.4 138.5 122.7 122.3Level of Service F C A F A A F F F F F FApproach Delay (s) 24.5 18.2 156.3 131.6Approach LOS C B F F
Intersection SummaryHCM 2000 Control Delay 32.9 HCM 2000 Level of Service CHCM 2000 Volume to Capacity ratio 0.85Actuated Cycle Length (s) 298.0 Sum of lost time (s) 21.0Intersection Capacity Utilization 98.5% ICU Level of Service FAnalysis Period (min) 15c Critical Lane Group
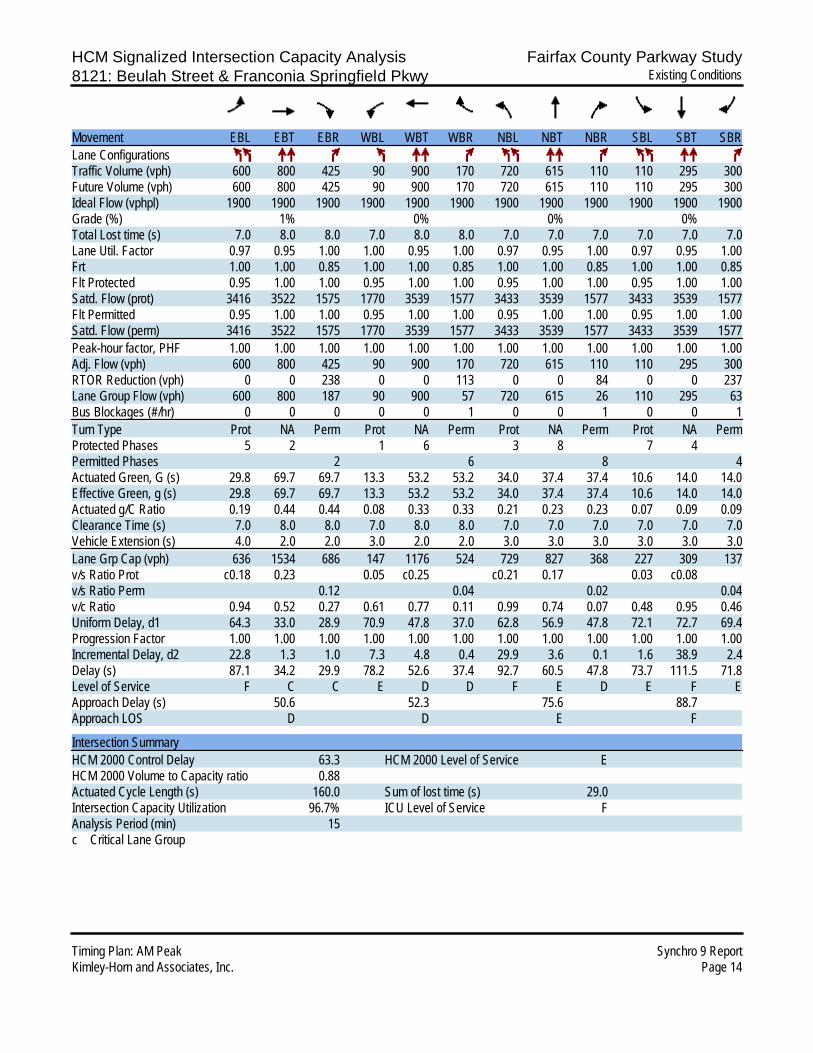
HCM Signalized Intersection Capacity Analysis Fairfax County Parkway Study8121: Beulah Street & Franconia Springfield Pkwy Existing Conditions
Timing Plan: AM Peak Synchro 9 ReportKimley-Horn and Associates, Inc. Page 14
Movement EBL EBT EBR WBL WBT WBR NBL NBT NBR SBL SBT SBRLane ConfigurationsTraffic Volume (vph) 600 800 425 90 900 170 720 615 110 110 295 300Future Volume (vph) 600 800 425 90 900 170 720 615 110 110 295 300Ideal Flow (vphpl) 1900 1900 1900 1900 1900 1900 1900 1900 1900 1900 1900 1900Grade (%) 1% 0% 0% 0%Total Lost time (s) 7.0 8.0 8.0 7.0 8.0 8.0 7.0 7.0 7.0 7.0 7.0 7.0Lane Util. Factor 0.97 0.95 1.00 1.00 0.95 1.00 0.97 0.95 1.00 0.97 0.95 1.00Frt 1.00 1.00 0.85 1.00 1.00 0.85 1.00 1.00 0.85 1.00 1.00 0.85Flt Protected 0.95 1.00 1.00 0.95 1.00 1.00 0.95 1.00 1.00 0.95 1.00 1.00Satd. Flow (prot) 3416 3522 1575 1770 3539 1577 3433 3539 1577 3433 3539 1577Flt Permitted 0.95 1.00 1.00 0.95 1.00 1.00 0.95 1.00 1.00 0.95 1.00 1.00Satd. Flow (perm) 3416 3522 1575 1770 3539 1577 3433 3539 1577 3433 3539 1577Peak-hour factor, PHF 1.00 1.00 1.00 1.00 1.00 1.00 1.00 1.00 1.00 1.00 1.00 1.00Adj. Flow (vph) 600 800 425 90 900 170 720 615 110 110 295 300RTOR Reduction (vph) 0 0 238 0 0 113 0 0 84 0 0 237Lane Group Flow (vph) 600 800 187 90 900 57 720 615 26 110 295 63Bus Blockages (#/hr) 0 0 0 0 0 1 0 0 1 0 0 1Turn Type Prot NA Perm Prot NA Perm Prot NA Perm Prot NA PermProtected Phases 5 2 1 6 3 8 7 4Permitted Phases 2 6 8 4Actuated Green, G (s) 29.8 69.7 69.7 13.3 53.2 53.2 34.0 37.4 37.4 10.6 14.0 14.0Effective Green, g (s) 29.8 69.7 69.7 13.3 53.2 53.2 34.0 37.4 37.4 10.6 14.0 14.0Actuated g/C Ratio 0.19 0.44 0.44 0.08 0.33 0.33 0.21 0.23 0.23 0.07 0.09 0.09Clearance Time (s) 7.0 8.0 8.0 7.0 8.0 8.0 7.0 7.0 7.0 7.0 7.0 7.0Vehicle Extension (s) 4.0 2.0 2.0 3.0 2.0 2.0 3.0 3.0 3.0 3.0 3.0 3.0Lane Grp Cap (vph) 636 1534 686 147 1176 524 729 827 368 227 309 137v/s Ratio Prot c0.18 0.23 0.05 c0.25 c0.21 0.17 0.03 c0.08v/s Ratio Perm 0.12 0.04 0.02 0.04v/c Ratio 0.94 0.52 0.27 0.61 0.77 0.11 0.99 0.74 0.07 0.48 0.95 0.46Uniform Delay, d1 64.3 33.0 28.9 70.9 47.8 37.0 62.8 56.9 47.8 72.1 72.7 69.4Progression Factor 1.00 1.00 1.00 1.00 1.00 1.00 1.00 1.00 1.00 1.00 1.00 1.00Incremental Delay, d2 22.8 1.3 1.0 7.3 4.8 0.4 29.9 3.6 0.1 1.6 38.9 2.4Delay (s) 87.1 34.2 29.9 78.2 52.6 37.4 92.7 60.5 47.8 73.7 111.5 71.8Level of Service F C C E D D F E D E F EApproach Delay (s) 50.6 52.3 75.6 88.7Approach LOS D D E F
Intersection SummaryHCM 2000 Control Delay 63.3 HCM 2000 Level of Service EHCM 2000 Volume to Capacity ratio 0.88Actuated Cycle Length (s) 160.0 Sum of lost time (s) 29.0Intersection Capacity Utilization 96.7% ICU Level of Service FAnalysis Period (min) 15c Critical Lane Group
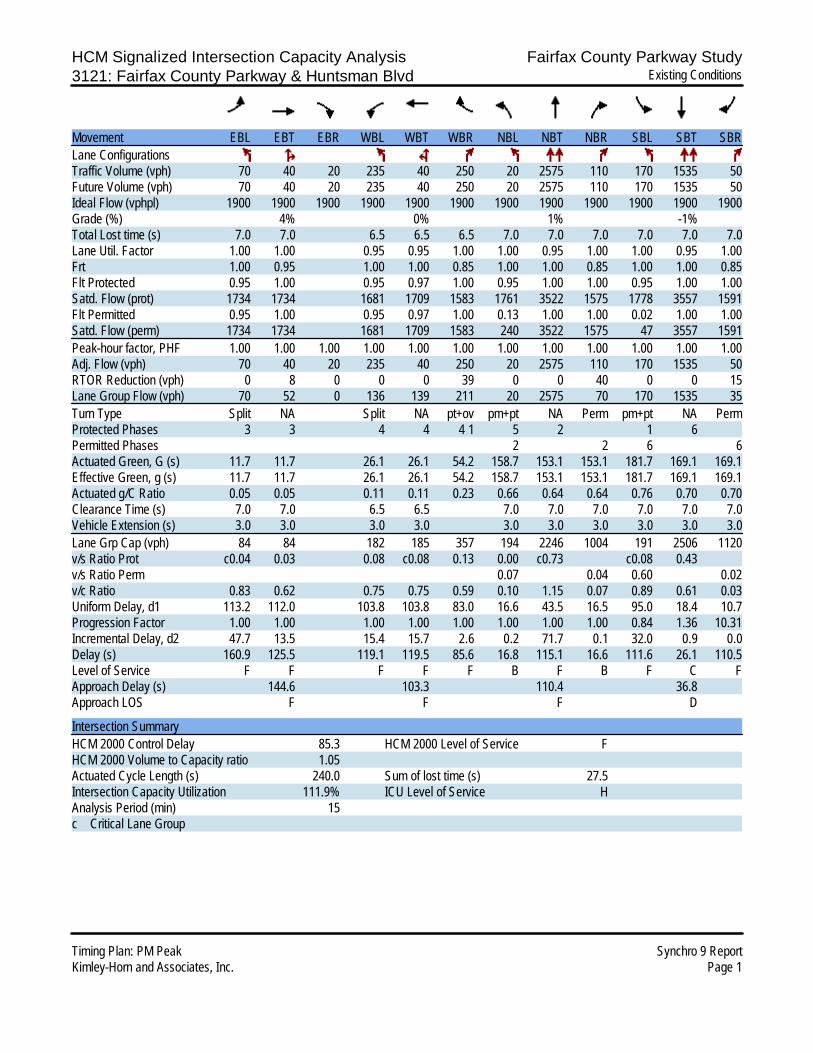
HCM Signalized Intersection Capacity Analysis Fairfax County Parkway Study3121: Fairfax County Parkway & Huntsman Blvd Existing Conditions
Timing Plan: PM Peak Synchro 9 ReportKimley-Horn and Associates, Inc. Page 1
Movement EBL EBT EBR WBL WBT WBR NBL NBT NBR SBL SBT SBRLane ConfigurationsTraffic Volume (vph) 70 40 20 235 40 250 20 2575 110 170 1535 50Future Volume (vph) 70 40 20 235 40 250 20 2575 110 170 1535 50Ideal Flow (vphpl) 1900 1900 1900 1900 1900 1900 1900 1900 1900 1900 1900 1900Grade (%) 4% 0% 1% -1%Total Lost time (s) 7.0 7.0 6.5 6.5 6.5 7.0 7.0 7.0 7.0 7.0 7.0Lane Util. Factor 1.00 1.00 0.95 0.95 1.00 1.00 0.95 1.00 1.00 0.95 1.00Frt 1.00 0.95 1.00 1.00 0.85 1.00 1.00 0.85 1.00 1.00 0.85Flt Protected 0.95 1.00 0.95 0.97 1.00 0.95 1.00 1.00 0.95 1.00 1.00Satd. Flow (prot) 1734 1734 1681 1709 1583 1761 3522 1575 1778 3557 1591Flt Permitted 0.95 1.00 0.95 0.97 1.00 0.13 1.00 1.00 0.02 1.00 1.00Satd. Flow (perm) 1734 1734 1681 1709 1583 240 3522 1575 47 3557 1591Peak-hour factor, PHF 1.00 1.00 1.00 1.00 1.00 1.00 1.00 1.00 1.00 1.00 1.00 1.00Adj. Flow (vph) 70 40 20 235 40 250 20 2575 110 170 1535 50RTOR Reduction (vph) 0 8 0 0 0 39 0 0 40 0 0 15Lane Group Flow (vph) 70 52 0 136 139 211 20 2575 70 170 1535 35Turn Type Split NA Split NA pt+ov pm+pt NA Perm pm+pt NA PermProtected Phases 3 3 4 4 4 1 5 2 1 6Permitted Phases 2 2 6 6Actuated Green, G (s) 11.7 11.7 26.1 26.1 54.2 158.7 153.1 153.1 181.7 169.1 169.1Effective Green, g (s) 11.7 11.7 26.1 26.1 54.2 158.7 153.1 153.1 181.7 169.1 169.1Actuated g/C Ratio 0.05 0.05 0.11 0.11 0.23 0.66 0.64 0.64 0.76 0.70 0.70Clearance Time (s) 7.0 7.0 6.5 6.5 7.0 7.0 7.0 7.0 7.0 7.0Vehicle Extension (s) 3.0 3.0 3.0 3.0 3.0 3.0 3.0 3.0 3.0 3.0Lane Grp Cap (vph) 84 84 182 185 357 194 2246 1004 191 2506 1120v/s Ratio Prot c0.04 0.03 0.08 c0.08 0.13 0.00 c0.73 c0.08 0.43v/s Ratio Perm 0.07 0.04 0.60 0.02v/c Ratio 0.83 0.62 0.75 0.75 0.59 0.10 1.15 0.07 0.89 0.61 0.03Uniform Delay, d1 113.2 112.0 103.8 103.8 83.0 16.6 43.5 16.5 95.0 18.4 10.7Progression Factor 1.00 1.00 1.00 1.00 1.00 1.00 1.00 1.00 0.84 1.36 10.31Incremental Delay, d2 47.7 13.5 15.4 15.7 2.6 0.2 71.7 0.1 32.0 0.9 0.0Delay (s) 160.9 125.5 119.1 119.5 85.6 16.8 115.1 16.6 111.6 26.1 110.5Level of Service F F F F F B F B F C FApproach Delay (s) 144.6 103.3 110.4 36.8Approach LOS F F F D
Intersection SummaryHCM 2000 Control Delay 85.3 HCM 2000 Level of Service FHCM 2000 Volume to Capacity ratio 1.05Actuated Cycle Length (s) 240.0 Sum of lost time (s) 27.5Intersection Capacity Utilization 111.9% ICU Level of Service HAnalysis Period (min) 15c Critical Lane Group
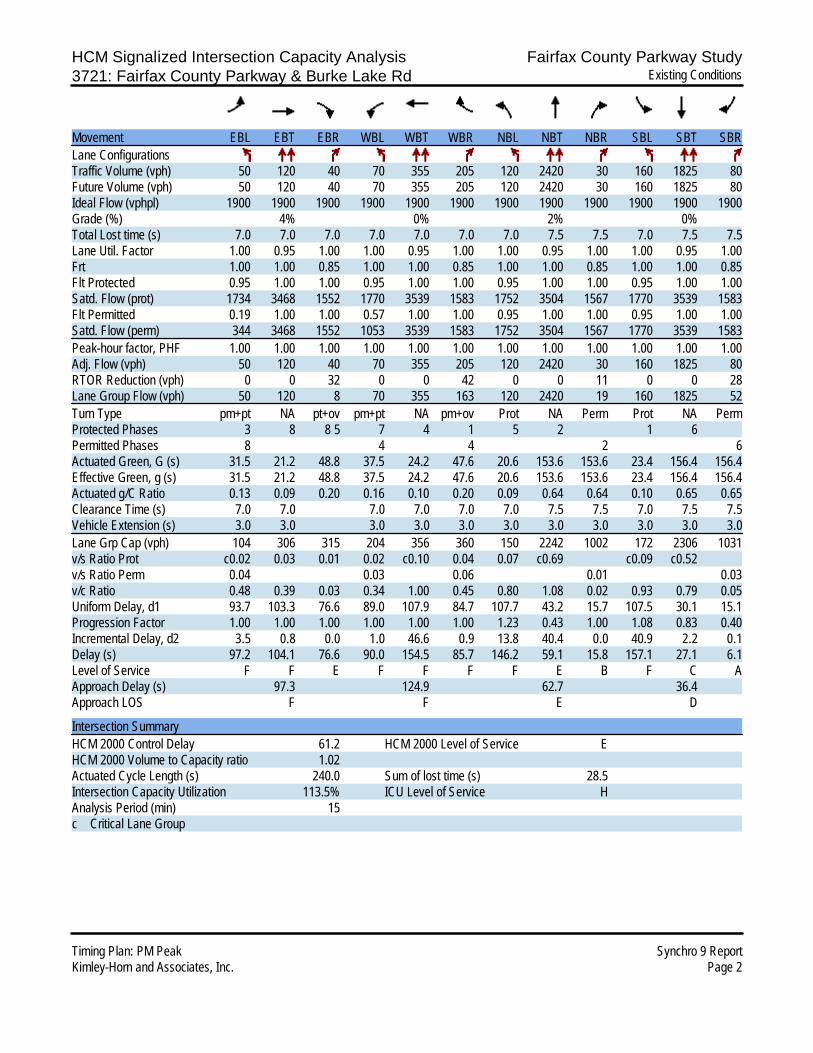
HCM Signalized Intersection Capacity Analysis Fairfax County Parkway Study3721: Fairfax County Parkway & Burke Lake Rd Existing Conditions
Timing Plan: PM Peak Synchro 9 ReportKimley-Horn and Associates, Inc. Page 2
Movement EBL EBT EBR WBL WBT WBR NBL NBT NBR SBL SBT SBRLane ConfigurationsTraffic Volume (vph) 50 120 40 70 355 205 120 2420 30 160 1825 80Future Volume (vph) 50 120 40 70 355 205 120 2420 30 160 1825 80Ideal Flow (vphpl) 1900 1900 1900 1900 1900 1900 1900 1900 1900 1900 1900 1900Grade (%) 4% 0% 2% 0%Total Lost time (s) 7.0 7.0 7.0 7.0 7.0 7.0 7.0 7.5 7.5 7.0 7.5 7.5Lane Util. Factor 1.00 0.95 1.00 1.00 0.95 1.00 1.00 0.95 1.00 1.00 0.95 1.00Frt 1.00 1.00 0.85 1.00 1.00 0.85 1.00 1.00 0.85 1.00 1.00 0.85Flt Protected 0.95 1.00 1.00 0.95 1.00 1.00 0.95 1.00 1.00 0.95 1.00 1.00Satd. Flow (prot) 1734 3468 1552 1770 3539 1583 1752 3504 1567 1770 3539 1583Flt Permitted 0.19 1.00 1.00 0.57 1.00 1.00 0.95 1.00 1.00 0.95 1.00 1.00Satd. Flow (perm) 344 3468 1552 1053 3539 1583 1752 3504 1567 1770 3539 1583Peak-hour factor, PHF 1.00 1.00 1.00 1.00 1.00 1.00 1.00 1.00 1.00 1.00 1.00 1.00Adj. Flow (vph) 50 120 40 70 355 205 120 2420 30 160 1825 80RTOR Reduction (vph) 0 0 32 0 0 42 0 0 11 0 0 28Lane Group Flow (vph) 50 120 8 70 355 163 120 2420 19 160 1825 52Turn Type pm+pt NA pt+ov pm+pt NA pm+ov Prot NA Perm Prot NA PermProtected Phases 3 8 8 5 7 4 1 5 2 1 6Permitted Phases 8 4 4 2 6Actuated Green, G (s) 31.5 21.2 48.8 37.5 24.2 47.6 20.6 153.6 153.6 23.4 156.4 156.4Effective Green, g (s) 31.5 21.2 48.8 37.5 24.2 47.6 20.6 153.6 153.6 23.4 156.4 156.4Actuated g/C Ratio 0.13 0.09 0.20 0.16 0.10 0.20 0.09 0.64 0.64 0.10 0.65 0.65Clearance Time (s) 7.0 7.0 7.0 7.0 7.0 7.0 7.5 7.5 7.0 7.5 7.5Vehicle Extension (s) 3.0 3.0 3.0 3.0 3.0 3.0 3.0 3.0 3.0 3.0 3.0Lane Grp Cap (vph) 104 306 315 204 356 360 150 2242 1002 172 2306 1031v/s Ratio Prot c0.02 0.03 0.01 0.02 c0.10 0.04 0.07 c0.69 c0.09 c0.52v/s Ratio Perm 0.04 0.03 0.06 0.01 0.03v/c Ratio 0.48 0.39 0.03 0.34 1.00 0.45 0.80 1.08 0.02 0.93 0.79 0.05Uniform Delay, d1 93.7 103.3 76.6 89.0 107.9 84.7 107.7 43.2 15.7 107.5 30.1 15.1Progression Factor 1.00 1.00 1.00 1.00 1.00 1.00 1.23 0.43 1.00 1.08 0.83 0.40Incremental Delay, d2 3.5 0.8 0.0 1.0 46.6 0.9 13.8 40.4 0.0 40.9 2.2 0.1Delay (s) 97.2 104.1 76.6 90.0 154.5 85.7 146.2 59.1 15.8 157.1 27.1 6.1Level of Service F F E F F F F E B F C AApproach Delay (s) 97.3 124.9 62.7 36.4Approach LOS F F E D
Intersection SummaryHCM 2000 Control Delay 61.2 HCM 2000 Level of Service EHCM 2000 Volume to Capacity ratio 1.02Actuated Cycle Length (s) 240.0 Sum of lost time (s) 28.5Intersection Capacity Utilization 113.5% ICU Level of Service HAnalysis Period (min) 15c Critical Lane Group

HCM Signalized Intersection Capacity Analysis Fairfax County Parkway Study5321: Fairfax County Parkway & Rt 50 EB Off-Ramp Existing Conditions
Timing Plan: PM PeakKimley-Horn and Associates, Inc.
Synchro 9 Report Page 3
Movement EBL EBT EBR WBL WBT WBR NBL NBT NBR SBL SBT SBRLane ConfigurationsTraffic Volume (vph) 40 0 0 0 0 0 0 2410 90 0 2990 0Future Volume (vph) 40 0 0 0 0 0 0 2410 90 0 2990 0Ideal Flow (vphpl) 1900 1900 1900 1900 1900 1900 1900 1900 1900 1900 1900 1900Lane Width 16 12 12 12 12 12 12 12 12 12 12 12Total Lost time (s) 7.5 6.0 6.0 6.5Lane Util. Factor 1.00 0.86 1.00 0.91Frt 1.00 1.00 0.85 1.00Flt Protected 0.95 1.00 1.00 1.00Satd. Flow (prot) 2006 6408 1583 5085Flt Permitted 0.95 1.00 1.00 1.00Satd. Flow (perm) 2006 6408 1583 5085Peak-hour factor, PHF 1.00 1.00 1.00 1.00 1.00 1.00 1.00 1.00 1.00 1.00 1.00 1.00Adj. Flow (vph) 40 0 0 0 0 0 0 2410 90 0 2990 0RTOR Reduction (vph) 0 0 0 0 0 0 0 0 15 0 0 0Lane Group Flow (vph) 40 0 0 0 0 0 0 2410 75 0 2990 0Turn Type Prot NA Perm NAProtected Phases 4 2 6Permitted Phases 2Actuated Green, G (s) 4.7 91.8 91.8 91.3Effective Green, g (s) 4.7 91.8 91.8 91.3Actuated g/C Ratio 0.04 0.83 0.83 0.83Clearance Time (s) 7.5 6.0 6.0 6.5Vehicle Extension (s) 2.0 4.0 4.0 4.0Lane Grp Cap (vph) 85 5347 1321 4220v/s Ratio Prot c0.02 0.38 c0.59v/s Ratio Perm 0.05v/c Ratio 0.47 0.45 0.06 0.71Uniform Delay, d1 51.4 2.4 1.6 3.9Progression Factor 1.00 1.00 1.00 0.26Incremental Delay, d2 1.5 0.3 0.1 0.6Delay (s) 52.9 2.7 1.7 1.6Level of Service D A A AApproach Delay (s) 52.9 0.0 2.7 1.6Approach LOS D A A A
Intersection SummaryHCM 2000 Control Delay 2.5 HCM 2000 Level of Service AHCM 2000 Volume to Capacity ratio 0.70Actuated Cycle Length (s) 110.0 Sum of lost time (s) 14.0Intersection Capacity Utilization 73.6% ICU Level of Service DAnalysis Period (min) 15c Critical Lane Group

HCM Signalized Intersection Capacity Analysis Fairfax County Parkway Study5322: Fairfax County Parkway & Rt 50 WB Off-Ramp Existing Conditions
Timing Plan: PM PeakKimley-Horn and Associates, Inc.
Synchro 9 Report Page 4
Movement WBL WBR NBT NBR SBL SBTLane ConfigurationsTraffic Volume (vph) 175 0 1710 0 0 3220Future Volume (vph) 175 0 1710 0 0 3220Ideal Flow (vphpl) 1900 1900 1900 1900 1900 1900Total Lost time (s) 7.5 6.5 6.0Lane Util. Factor 0.97 0.91 0.91Frt 1.00 1.00 1.00Flt Protected 0.95 1.00 1.00Satd. Flow (prot) 3433 5085 5085Flt Permitted 0.95 1.00 1.00Satd. Flow (perm) 3433 5085 5085Peak-hour factor, PHF 1.00 1.00 1.00 1.00 1.00 1.00Adj. Flow (vph) 175 0 1710 0 0 3220RTOR Reduction (vph) 0 0 0 0 0 0Lane Group Flow (vph) 175 0 1710 0 0 3220Turn Type Prot NA NAProtected Phases 4 2 6Permitted PhasesActuated Green, G (s) 10.1 85.9 86.4Effective Green, g (s) 10.1 85.9 86.4Actuated g/C Ratio 0.09 0.78 0.79Clearance Time (s) 7.5 6.5 6.0Vehicle Extension (s) 2.0 4.0 4.0Lane Grp Cap (vph) 315 3970 3994v/s Ratio Prot c0.05 0.34 c0.63v/s Ratio Permv/c Ratio 0.56 0.43 0.81Uniform Delay, d1 47.8 4.0 6.9Progression Factor 1.00 0.92 0.94Incremental Delay, d2 1.2 0.3 0.7Delay (s) 49.0 4.0 7.2Level of Service D A AApproach Delay (s) 49.0 4.0 7.2Approach LOS D A A
Intersection SummaryHCM 2000 Control Delay 7.6 HCM 2000 Level of Service AHCM 2000 Volume to Capacity ratio 0.78Actuated Cycle Length (s) 110.0 Sum of lost time (s) 14.0Intersection Capacity Utilization 78.5% ICU Level of Service DAnalysis Period (min) 15c Critical Lane Group

HCM Signalized Intersection Capacity Analysis Fairfax County Parkway Study5421: Fairfax County Parkway & Rugby Rd Existing Conditions
Timing Plan: PM Peak Synchro 9 ReportKimley-Horn and Associates, Inc. Page 5
Movement EBL EBT EBR WBL WBT WBR NBL NBT NBR SBL SBT SBRLane ConfigurationsTraffic Volume (vph) 40 120 50 465 320 140 40 1765 340 90 2725 110Future Volume (vph) 40 120 50 465 320 140 40 1765 340 90 2725 110Ideal Flow (vphpl) 1900 1900 1900 1900 1900 1900 1900 1900 1900 1900 1900 1900Total Lost time (s) 7.5 5.5 5.5 7.5 6.5 8.0 9.0 6.5 7.5 8.0 6.0 7.5Lane Util. Factor 1.00 1.00 1.00 0.97 1.00 1.00 1.00 0.91 1.00 1.00 0.91 1.00Frt 1.00 1.00 0.85 1.00 1.00 0.85 1.00 1.00 0.85 1.00 1.00 0.85Flt Protected 0.95 1.00 1.00 0.95 1.00 1.00 0.95 1.00 1.00 0.95 1.00 1.00Satd. Flow (prot) 1770 1863 1583 3433 1863 1583 1770 5085 1583 1770 5085 1583Flt Permitted 0.95 1.00 1.00 0.95 1.00 1.00 0.95 1.00 1.00 0.95 1.00 1.00Satd. Flow (perm) 1770 1863 1583 3433 1863 1583 1770 5085 1583 1770 5085 1583Peak-hour factor, PHF 1.00 1.00 1.00 1.00 1.00 1.00 1.00 1.00 1.00 1.00 1.00 1.00Adj. Flow (vph) 40 120 50 465 320 140 40 1765 340 90 2725 110RTOR Reduction (vph) 0 0 44 0 0 41 0 0 96 0 0 34Lane Group Flow (vph) 40 120 6 465 320 99 40 1765 244 90 2725 76Turn Type Prot NA Perm Prot NA pm+ov Prot NA pm+ov Prot NA pm+ovProtected Phases 3 8 7 4 5 1 6 7 5 2 3Permitted Phases 8 4 6 2Actuated Green, G (s) 8.9 24.5 24.5 23.5 38.1 56.2 8.7 126.4 149.9 18.1 135.3 144.2Effective Green, g (s) 8.9 24.5 24.5 23.5 38.1 56.2 8.7 126.4 149.9 18.1 135.3 144.2Actuated g/C Ratio 0.04 0.11 0.11 0.11 0.17 0.26 0.04 0.57 0.68 0.08 0.62 0.66Clearance Time (s) 7.5 5.5 5.5 7.5 6.5 8.0 9.0 6.5 7.5 8.0 6.0 7.5Vehicle Extension (s) 3.0 3.0 3.0 3.0 3.0 5.0 5.0 3.0 3.0 5.0 3.0 3.0Lane Grp Cap (vph) 71 207 176 366 322 404 69 2921 1078 145 3127 1037v/s Ratio Prot 0.02 0.06 c0.14 c0.17 0.02 0.02 0.35 0.02 c0.05 c0.54 0.00v/s Ratio Perm 0.00 0.04 0.13 0.04v/c Ratio 0.56 0.58 0.03 1.27 0.99 0.25 0.58 0.60 0.23 0.62 0.87 0.07Uniform Delay, d1 103.6 92.9 87.2 98.2 90.8 65.1 103.9 30.5 13.2 97.6 35.1 13.7Progression Factor 1.00 1.00 1.00 1.00 1.00 1.00 0.96 0.89 3.44 1.25 0.27 0.15Incremental Delay, d2 9.8 3.9 0.1 141.6 48.2 0.7 16.7 0.9 0.1 1.1 0.3 0.0Delay (s) 113.5 96.8 87.2 239.8 139.1 65.7 115.9 27.9 45.5 122.9 9.9 2.1Level of Service F F F F F E F C D F A AApproach Delay (s) 97.7 178.6 32.3 13.1Approach LOS F F C B
Intersection SummaryHCM 2000 Control Delay 47.3 HCM 2000 Level of Service DHCM 2000 Volume to Capacity ratio 0.96Actuated Cycle Length (s) 220.0 Sum of lost time (s) 29.0Intersection Capacity Utilization 106.2% ICU Level of Service GAnalysis Period (min) 15c Critical Lane Group

HCM Unsignalized Intersection Capacity Analysis Fairfax County Parkway Study5531: Fairfax County Parkway & Old Plains Rd Existing Conditions
Timing Plan: PM Peak Synchro 9 ReportKimley-Horn and Associates, Inc. Page 6
Movement EBL EBR NBL NBT SBT SBRLane ConfigurationsTraffic Volume (veh/h) 0 30 0 1935 2885 50Future Volume (Veh/h) 0 30 0 1935 2885 50Sign Control Stop Free FreeGrade 0% 0% 0%Peak Hour Factor 1.00 1.00 1.00 1.00 1.00 1.00Hourly flow rate (vph) 0 30 0 1935 2885 50PedestriansLane Width (ft)Walking Speed (ft/s)Percent BlockageRight turn flare (veh)Median type None NoneMedian storage veh)Upstream signal (ft)pX, platoon unblockedvC, conflicting volume 3852 1442 2935vC1, stage 1 conf volvC2, stage 2 conf volvCu, unblocked vol 3852 1442 2935tC, single (s) 6.8 6.9 4.1tC, 2 stage (s)tF (s) 3.5 3.3 2.2p0 queue free % 100 75 100cM capacity (veh/h) 3 122 120
Direction, Lane # EB 1 NB 1 NB 2 SB 1 SB 2 SB 3Volume Total 30 968 968 1442 1442 50Volume Left 0 0 0 0 0 0Volume Right 30 0 0 0 0 50cSH 122 1700 1700 1700 1700 1700Volume to Capacity 0.25 0.57 0.57 0.85 0.85 0.03Queue Length 95th (ft) 23 0 0 0 0 0Control Delay (s) 44.1 0.0 0.0 0.0 0.0 0.0Lane LOS EApproach Delay (s) 44.1 0.0 0.0Approach LOS E
Intersection SummaryAverage Delay 0.3Intersection Capacity Utilization 89.7% ICU Level of Service EAnalysis Period (min) 15

HCM Signalized Intersection Capacity Analysis Fairfax County Parkway Study5821: Fairfax County Parkway & Franklin Farm Rd Existing Conditions
Timing Plan: PM Peak Synchro 9 ReportKimley-Horn and Associates, Inc. Page 7
Movement EBL EBT EBR WBL WBT WBR NBL NBT NBR SBL SBT SBRLane ConfigurationsTraffic Volume (vph) 150 270 590 90 315 30 335 1605 80 30 2310 240Future Volume (vph) 150 270 590 90 315 30 335 1605 80 30 2310 240Ideal Flow (vphpl) 1900 1900 1900 1900 1900 1900 1900 1900 1900 1900 1900 1900Total Lost time (s) 8.0 8.0 8.0 8.0 8.0 9.5 6.5 8.0 8.0 6.5 8.0Lane Util. Factor 1.00 1.00 1.00 1.00 0.95 0.97 0.95 1.00 1.00 0.95 1.00Frt 1.00 1.00 0.85 1.00 0.99 1.00 1.00 0.85 1.00 1.00 0.85Flt Protected 0.95 1.00 1.00 0.95 1.00 0.95 1.00 1.00 0.95 1.00 1.00Satd. Flow (prot) 1770 1863 1583 1770 3493 3433 3539 1583 1770 3539 1583Flt Permitted 0.17 1.00 1.00 0.18 1.00 0.95 1.00 1.00 0.95 1.00 1.00Satd. Flow (perm) 310 1863 1583 339 3493 3433 3539 1583 1770 3539 1583Peak-hour factor, PHF 1.00 1.00 1.00 1.00 1.00 1.00 1.00 1.00 1.00 1.00 1.00 1.00Adj. Flow (vph) 150 270 590 90 315 30 335 1605 80 30 2310 240RTOR Reduction (vph) 0 0 94 0 4 0 0 0 23 0 0 21Lane Group Flow (vph) 150 270 496 90 341 0 335 1605 57 30 2310 219Turn Type pm+pt NA Perm pm+pt NA Prot NA pm+ov Prot NA pm+ovProtected Phases 3 8 7 4 1 6 7 5 2 3Permitted Phases 8 8 4 6 2Actuated Green, G (s) 41.0 25.5 25.5 34.0 22.0 17.0 144.1 156.1 7.9 133.5 149.0Effective Green, g (s) 41.0 25.5 25.5 34.0 22.0 17.0 144.1 156.1 7.9 133.5 149.0Actuated g/C Ratio 0.19 0.12 0.12 0.15 0.10 0.08 0.65 0.71 0.04 0.61 0.68Clearance Time (s) 8.0 8.0 8.0 8.0 8.0 9.5 6.5 8.0 8.0 6.5 8.0Vehicle Extension (s) 3.0 3.0 3.0 3.0 3.0 3.0 5.0 3.0 3.0 5.0 3.0Lane Grp Cap (vph) 160 215 183 130 349 265 2318 1123 63 2147 1072v/s Ratio Prot c0.07 0.14 0.04 0.10 c0.10 c0.45 0.00 0.02 c0.65 0.01v/s Ratio Perm 0.11 c0.31 0.07 0.03 0.12v/c Ratio 0.94 1.26 2.71 0.69 0.98 1.26 0.69 0.05 0.48 1.08 0.20Uniform Delay, d1 81.5 97.2 97.2 83.6 98.8 101.5 24.0 9.6 104.0 43.2 13.3Progression Factor 1.00 1.00 1.00 1.00 1.00 0.72 1.46 3.90 1.23 0.49 0.23Incremental Delay, d2 52.4 147.2 785.7 14.8 41.8 136.6 1.1 0.0 0.5 35.2 0.0Delay (s) 133.9 244.5 882.9 98.4 140.6 209.6 36.1 37.5 128.5 56.6 3.1Level of Service F F F F F F D D F E AApproach Delay (s) 601.0 131.9 65.0 52.4Approach LOS F F E D
Intersection SummaryHCM 2000 Control Delay 154.0 HCM 2000 Level of Service FHCM 2000 Volume to Capacity ratio 1.33Actuated Cycle Length (s) 220.0 Sum of lost time (s) 32.0Intersection Capacity Utilization 124.1% ICU Level of Service HAnalysis Period (min) 15c Critical Lane Group

HCM Signalized Intersection Capacity Analysis Fairfax County Parkway Study5921: Fairfax County Parkway & West Ox Rd Existing Conditions
Timing Plan: PM Peak Synchro 9 ReportKimley-Horn and Associates, Inc. Page 8
Movement EBL EBT EBR WBL WBT WBR NBL NBT NBR SBL SBT SBRLane ConfigurationsTraffic Volume (vph) 230 350 450 50 200 90 345 1375 70 150 2085 245Future Volume (vph) 230 350 450 50 200 90 345 1375 70 150 2085 245Ideal Flow (vphpl) 1900 1900 1900 1900 1900 1900 1900 1900 1900 1900 1900 1900Total Lost time (s) 8.0 8.0 8.0 8.0 8.0 8.0 9.5 6.5 6.5 8.0 6.0 4.0Lane Util. Factor 1.00 1.00 1.00 1.00 1.00 1.00 0.97 0.95 1.00 1.00 0.95 1.00Frt 1.00 1.00 0.85 1.00 1.00 0.85 1.00 1.00 0.85 1.00 1.00 0.85Flt Protected 0.95 1.00 1.00 0.95 1.00 1.00 0.95 1.00 1.00 0.95 1.00 1.00Satd. Flow (prot) 1770 1863 1583 1770 1863 1583 3433 3539 1583 1770 3539 1583Flt Permitted 0.13 1.00 1.00 0.17 1.00 1.00 0.95 1.00 1.00 0.95 1.00 1.00Satd. Flow (perm) 242 1863 1583 324 1863 1583 3433 3539 1583 1770 3539 1583Peak-hour factor, PHF 1.00 1.00 1.00 1.00 1.00 1.00 1.00 1.00 1.00 1.00 1.00 1.00Adj. Flow (vph) 230 350 450 50 200 90 345 1375 70 150 2085 245RTOR Reduction (vph) 0 0 159 0 0 81 0 0 31 0 0 0Lane Group Flow (vph) 230 350 291 50 200 9 345 1375 39 150 2085 245Turn Type pm+pt NA Perm pm+pt NA Perm Prot NA Perm Prot NA FreeProtected Phases 3 8 7 4 1 6 5 2Permitted Phases 8 8 4 4 6 FreeActuated Green, G (s) 54.5 36.4 36.4 33.1 23.0 23.0 20.0 122.6 122.6 20.4 122.0 220.0Effective Green, g (s) 54.5 36.4 36.4 33.1 23.0 23.0 20.0 122.6 122.6 20.4 122.0 220.0Actuated g/C Ratio 0.25 0.17 0.17 0.15 0.10 0.10 0.09 0.56 0.56 0.09 0.55 1.00Clearance Time (s) 8.0 8.0 8.0 8.0 8.0 8.0 9.5 6.5 6.5 8.0 6.0Vehicle Extension (s) 3.0 3.0 3.0 3.0 3.0 3.0 3.0 3.0 3.0 3.0 3.0Lane Grp Cap (vph) 223 308 261 115 194 165 312 1972 882 164 1962 1583v/s Ratio Prot c0.11 c0.19 0.02 0.11 c0.10 0.39 0.08 c0.59v/s Ratio Perm 0.15 0.18 0.05 0.01 0.02 c0.15v/c Ratio 1.03 1.14 1.12 0.43 1.03 0.06 1.11 0.70 0.04 0.91 1.06 0.15Uniform Delay, d1 73.3 91.8 91.8 82.5 98.5 88.7 100.0 35.3 22.1 98.9 49.0 0.0Progression Factor 1.00 1.00 1.00 1.00 1.00 1.00 0.90 1.21 1.00 1.26 0.46 1.00Incremental Delay, d2 68.7 93.4 90.7 2.6 72.9 0.1 74.3 1.4 0.1 20.7 32.5 0.1Delay (s) 142.0 185.2 182.5 85.2 171.4 88.9 163.9 44.3 22.2 145.1 54.9 0.1Level of Service F F F F F F F D C F D AApproach Delay (s) 174.3 136.9 66.5 54.9Approach LOS F F E D
Intersection SummaryHCM 2000 Control Delay 85.3 HCM 2000 Level of Service FHCM 2000 Volume to Capacity ratio 1.11Actuated Cycle Length (s) 220.0 Sum of lost time (s) 31.5Intersection Capacity Utilization 117.0% ICU Level of Service HAnalysis Period (min) 15c Critical Lane Group

HCM Signalized Intersection Capacity Analysis Fairfax County Parkway Study6021: Fairfax County Parkway & Fox Mill Rd Existing Conditions
Timing Plan: PM Peak Synchro 9 ReportKimley-Horn and Associates, Inc. Page 9
Movement EBL EBT EBR WBL WBT WBR NBL NBT NBR SBL SBT SBRLane ConfigurationsTraffic Volume (vph) 90 455 380 80 340 180 165 1420 120 245 2020 180Future Volume (vph) 90 455 380 80 340 180 165 1420 120 245 2020 180Ideal Flow (vphpl) 1900 1900 1900 1900 1900 1900 1900 1900 1900 1900 1900 1900Total Lost time (s) 8.5 8.5 10.0 8.5 8.5 9.0 10.0 6.5 8.5 9.0 6.5 8.5Lane Util. Factor 1.00 0.95 1.00 1.00 0.95 1.00 1.00 0.95 1.00 1.00 0.95 1.00Frt 1.00 1.00 0.85 1.00 1.00 0.85 1.00 1.00 0.85 1.00 1.00 0.85Flt Protected 0.95 1.00 1.00 0.95 1.00 1.00 0.95 1.00 1.00 0.95 1.00 1.00Satd. Flow (prot) 1770 3539 1583 1770 3539 1583 1770 3539 1583 1770 3539 1583Flt Permitted 0.25 1.00 1.00 0.16 1.00 1.00 0.95 1.00 1.00 0.95 1.00 1.00Satd. Flow (perm) 473 3539 1583 300 3539 1583 1770 3539 1583 1770 3539 1583Peak-hour factor, PHF 1.00 1.00 1.00 1.00 1.00 1.00 1.00 1.00 1.00 1.00 1.00 1.00Adj. Flow (vph) 90 455 380 80 340 180 165 1420 120 245 2020 180RTOR Reduction (vph) 0 0 47 0 0 49 0 0 30 0 0 28Lane Group Flow (vph) 90 455 333 80 340 131 165 1420 90 245 2020 152Turn Type pm+pt NA pm+ov pm+pt NA pm+ov Prot NA pm+ov Prot NA pm+ovProtected Phases 3 8 1 7 4 5 1 6 7 5 2 3Permitted Phases 8 8 4 4 6 2Actuated Green, G (s) 38.5 25.3 46.8 37.5 24.8 52.3 21.5 122.0 134.7 27.5 127.0 140.2Effective Green, g (s) 38.5 25.3 46.8 37.5 24.8 52.3 21.5 122.0 134.7 27.5 127.0 140.2Actuated g/C Ratio 0.18 0.12 0.21 0.17 0.11 0.24 0.10 0.55 0.61 0.12 0.58 0.64Clearance Time (s) 8.5 8.5 10.0 8.5 8.5 9.0 10.0 6.5 8.5 9.0 6.5 8.5Vehicle Extension (s) 3.0 3.0 3.0 3.0 3.0 3.0 3.0 3.0 3.0 3.0 3.0 3.0Lane Grp Cap (vph) 160 406 336 135 398 376 172 1962 969 221 2042 1008v/s Ratio Prot 0.03 c0.13 0.10 c0.03 0.10 0.04 0.09 0.40 0.01 c0.14 c0.57 0.01v/s Ratio Perm 0.06 0.11 0.07 0.04 0.05 0.09v/c Ratio 0.56 1.12 0.99 0.59 0.85 0.35 0.96 0.72 0.09 1.11 0.99 0.15Uniform Delay, d1 79.3 97.3 86.4 80.3 95.8 69.7 98.8 36.5 17.5 96.2 45.8 16.0Progression Factor 1.00 1.00 1.00 1.00 1.00 1.00 1.43 0.69 0.05 1.06 0.67 0.34Incremental Delay, d2 4.5 81.7 46.4 6.8 16.2 0.6 44.8 1.6 0.0 55.5 4.0 0.0Delay (s) 83.8 179.0 132.7 87.1 112.0 70.3 185.9 26.9 0.8 157.1 34.8 5.5Level of Service F F F F F E F C A F C AApproach Delay (s) 150.7 96.2 40.4 44.9Approach LOS F F D D
Intersection SummaryHCM 2000 Control Delay 66.2 HCM 2000 Level of Service EHCM 2000 Volume to Capacity ratio 1.03Actuated Cycle Length (s) 220.0 Sum of lost time (s) 33.5Intersection Capacity Utilization 109.9% ICU Level of Service HAnalysis Period (min) 15c Critical Lane Group
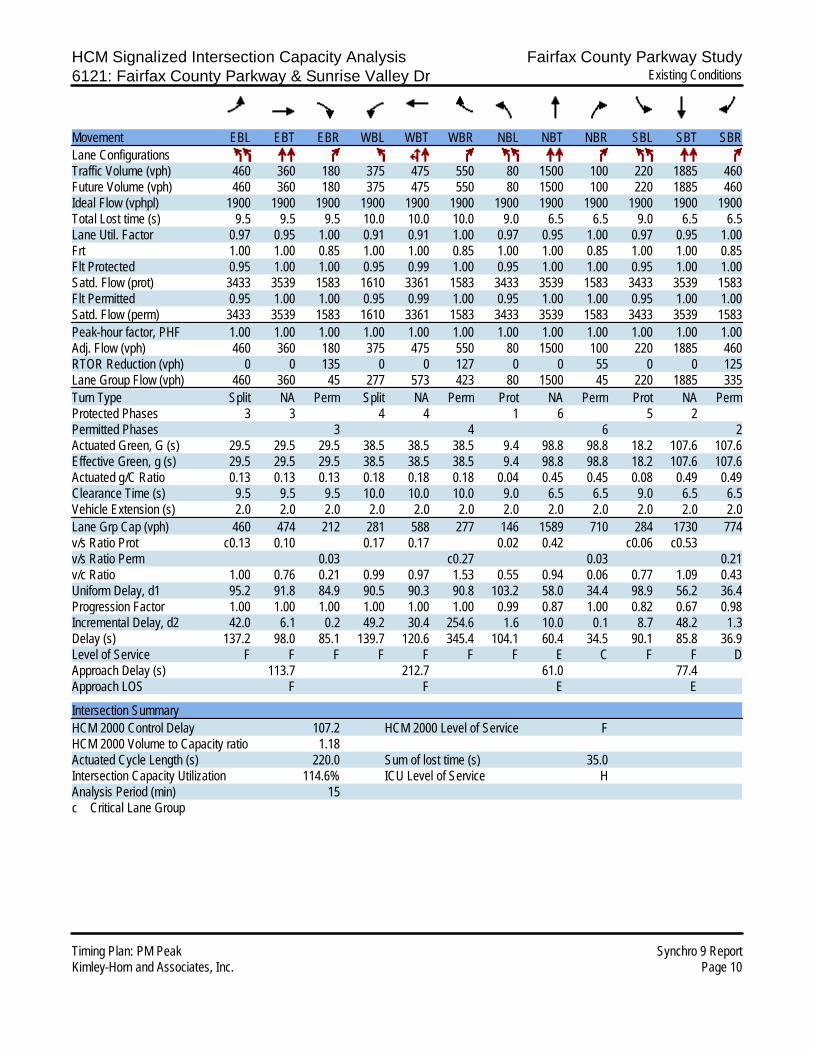
HCM Signalized Intersection Capacity Analysis Fairfax County Parkway Study6121: Fairfax County Parkway & Sunrise Valley Dr Existing Conditions
Timing Plan: PM Peak Synchro 9 ReportKimley-Horn and Associates, Inc. Page 10
Movement EBL EBT EBR WBL WBT WBR NBL NBT NBR SBL SBT SBRLane ConfigurationsTraffic Volume (vph) 460 360 180 375 475 550 80 1500 100 220 1885 460Future Volume (vph) 460 360 180 375 475 550 80 1500 100 220 1885 460Ideal Flow (vphpl) 1900 1900 1900 1900 1900 1900 1900 1900 1900 1900 1900 1900Total Lost time (s) 9.5 9.5 9.5 10.0 10.0 10.0 9.0 6.5 6.5 9.0 6.5 6.5Lane Util. Factor 0.97 0.95 1.00 0.91 0.91 1.00 0.97 0.95 1.00 0.97 0.95 1.00Frt 1.00 1.00 0.85 1.00 1.00 0.85 1.00 1.00 0.85 1.00 1.00 0.85Flt Protected 0.95 1.00 1.00 0.95 0.99 1.00 0.95 1.00 1.00 0.95 1.00 1.00Satd. Flow (prot) 3433 3539 1583 1610 3361 1583 3433 3539 1583 3433 3539 1583Flt Permitted 0.95 1.00 1.00 0.95 0.99 1.00 0.95 1.00 1.00 0.95 1.00 1.00Satd. Flow (perm) 3433 3539 1583 1610 3361 1583 3433 3539 1583 3433 3539 1583Peak-hour factor, PHF 1.00 1.00 1.00 1.00 1.00 1.00 1.00 1.00 1.00 1.00 1.00 1.00Adj. Flow (vph) 460 360 180 375 475 550 80 1500 100 220 1885 460RTOR Reduction (vph) 0 0 135 0 0 127 0 0 55 0 0 125Lane Group Flow (vph) 460 360 45 277 573 423 80 1500 45 220 1885 335Turn Type Split NA Perm Split NA Perm Prot NA Perm Prot NA PermProtected Phases 3 3 4 4 1 6 5 2Permitted Phases 3 4 6 2Actuated Green, G (s) 29.5 29.5 29.5 38.5 38.5 38.5 9.4 98.8 98.8 18.2 107.6 107.6Effective Green, g (s) 29.5 29.5 29.5 38.5 38.5 38.5 9.4 98.8 98.8 18.2 107.6 107.6Actuated g/C Ratio 0.13 0.13 0.13 0.18 0.18 0.18 0.04 0.45 0.45 0.08 0.49 0.49Clearance Time (s) 9.5 9.5 9.5 10.0 10.0 10.0 9.0 6.5 6.5 9.0 6.5 6.5Vehicle Extension (s) 2.0 2.0 2.0 2.0 2.0 2.0 2.0 2.0 2.0 2.0 2.0 2.0Lane Grp Cap (vph) 460 474 212 281 588 277 146 1589 710 284 1730 774v/s Ratio Prot c0.13 0.10 0.17 0.17 0.02 0.42 c0.06 c0.53v/s Ratio Perm 0.03 c0.27 0.03 0.21v/c Ratio 1.00 0.76 0.21 0.99 0.97 1.53 0.55 0.94 0.06 0.77 1.09 0.43Uniform Delay, d1 95.2 91.8 84.9 90.5 90.3 90.8 103.2 58.0 34.4 98.9 56.2 36.4Progression Factor 1.00 1.00 1.00 1.00 1.00 1.00 0.99 0.87 1.00 0.82 0.67 0.98Incremental Delay, d2 42.0 6.1 0.2 49.2 30.4 254.6 1.6 10.0 0.1 8.7 48.2 1.3Delay (s) 137.2 98.0 85.1 139.7 120.6 345.4 104.1 60.4 34.5 90.1 85.8 36.9Level of Service F F F F F F F E C F F DApproach Delay (s) 113.7 212.7 61.0 77.4Approach LOS F F E E
Intersection SummaryHCM 2000 Control Delay 107.2 HCM 2000 Level of Service FHCM 2000 Volume to Capacity ratio 1.18Actuated Cycle Length (s) 220.0 Sum of lost time (s) 35.0Intersection Capacity Utilization 114.6% ICU Level of Service HAnalysis Period (min) 15c Critical Lane Group

HCM Signalized Intersection Capacity Analysis Fairfax County Parkway Study6221: Fairfax County Parkway & Dulles Toll Rd EB Off-Ramp Existing Conditions
Timing Plan: PM Peak Synchro 9 ReportKimley-Horn and Associates, Inc. Page 11
Movement EBL EBT EBR WBL WBT WBR NBL NBT NBR SBL SBT SBRLane ConfigurationsTraffic Volume (vph) 390 0 150 0 0 0 0 2255 250 325 2420 0Future Volume (vph) 390 0 150 0 0 0 0 2255 250 325 2420 0Ideal Flow (vphpl) 1900 1900 1900 1900 1900 1900 1900 1900 1900 1900 1900 1900Total Lost time (s) 9.0 9.0 9.0 6.0 4.0 7.5 6.0Lane Util. Factor 0.95 0.91 0.95 0.91 1.00 0.97 0.91Frt 1.00 0.99 0.85 1.00 0.85 1.00 1.00Flt Protected 0.95 0.96 1.00 1.00 1.00 0.95 1.00Satd. Flow (prot) 1681 1602 1504 5085 1583 3433 5085Flt Permitted 0.95 0.96 1.00 1.00 1.00 0.95 1.00Satd. Flow (perm) 1681 1602 1504 5085 1583 3433 5085Peak-hour factor, PHF 1.00 1.00 1.00 1.00 1.00 1.00 1.00 1.00 1.00 1.00 1.00 1.00Adj. Flow (vph) 390 0 150 0 0 0 0 2255 250 325 2420 0RTOR Reduction (vph) 0 87 87 0 0 0 0 0 0 0 0 0Lane Group Flow (vph) 203 115 48 0 0 0 0 2255 250 325 2420 0Turn Type Split NA Perm NA Free Prot NAProtected Phases 3 3 6 5 2Permitted Phases 3 FreeActuated Green, G (s) 17.7 17.7 17.7 55.1 110.0 14.7 77.3Effective Green, g (s) 17.7 17.7 17.7 55.1 110.0 14.7 77.3Actuated g/C Ratio 0.16 0.16 0.16 0.50 1.00 0.13 0.70Clearance Time (s) 9.0 9.0 9.0 6.0 7.5 6.0Vehicle Extension (s) 3.0 3.0 3.0 2.0 2.0 2.0Lane Grp Cap (vph) 270 257 242 2547 1583 458 3573v/s Ratio Prot c0.12 0.07 c0.44 0.09 c0.48v/s Ratio Perm 0.03 0.16v/c Ratio 0.75 0.45 0.20 0.89 0.16 0.71 0.68Uniform Delay, d1 44.1 41.7 40.0 24.6 0.0 45.6 9.3Progression Factor 1.00 1.00 1.00 0.90 1.00 0.62 1.36Incremental Delay, d2 11.2 1.2 0.4 0.5 0.0 1.0 0.4Delay (s) 55.3 43.0 40.4 22.6 0.0 29.3 13.0Level of Service E D D C A C BApproach Delay (s) 46.9 0.0 20.3 15.0Approach LOS D A C B
Intersection SummaryHCM 2000 Control Delay 20.3 HCM 2000 Level of Service CHCM 2000 Volume to Capacity ratio 0.86Actuated Cycle Length (s) 110.0 Sum of lost time (s) 22.5Intersection Capacity Utilization 85.5% ICU Level of Service EAnalysis Period (min) 15c Critical Lane Group

HCM Signalized Intersection Capacity Analysis Fairfax County Parkway Study7021: Fairfax County Parkway & Wiehle Ave Existing Conditions
Timing Plan: PM Peak Synchro 9 ReportKimley-Horn and Associates, Inc. Page 12
Movement EBL EBT EBR WBL WBT WBR NBL NBT NBR SBL SBT SBRLane ConfigurationsTraffic Volume (vph) 50 165 190 50 505 370 400 1825 80 100 695 50Future Volume (vph) 50 165 190 50 505 370 400 1825 80 100 695 50Ideal Flow (vphpl) 1900 1900 1900 1900 1900 1900 1900 1900 1900 1900 1900 1900Total Lost time (s) 7.0 6.5 10.0 6.5 7.0 11.0 10.0 6.5 6.5 11.0 6.5 6.5Lane Util. Factor 1.00 0.95 1.00 1.00 0.95 1.00 1.00 0.95 1.00 1.00 0.95 1.00Frt 1.00 1.00 0.85 1.00 1.00 0.85 1.00 1.00 0.85 1.00 1.00 0.85Flt Protected 0.95 1.00 1.00 0.95 1.00 1.00 0.95 1.00 1.00 0.95 1.00 1.00Satd. Flow (prot) 1770 3539 1583 1770 3539 1583 1770 3539 1583 1770 3539 1583Flt Permitted 0.95 1.00 1.00 0.95 1.00 1.00 0.95 1.00 1.00 0.95 1.00 1.00Satd. Flow (perm) 1770 3539 1583 1770 3539 1583 1770 3539 1583 1770 3539 1583Peak-hour factor, PHF 1.00 1.00 1.00 1.00 1.00 1.00 1.00 1.00 1.00 1.00 1.00 1.00Adj. Flow (vph) 50 165 190 50 505 370 400 1825 80 100 695 50RTOR Reduction (vph) 0 0 0 0 0 0 0 0 37 0 0 31Lane Group Flow (vph) 50 165 190 50 505 370 400 1825 43 100 695 19Turn Type Prot NA pm+ov Prot NA pm+ov Prot NA Perm Prot NA PermProtected Phases 7 4 5 3 8 1 5 2 1 6Permitted Phases 4 8 2 6Actuated Green, G (s) 8.7 26.8 68.6 8.4 25.5 38.7 41.8 91.1 91.1 13.2 63.5 63.5Effective Green, g (s) 8.7 26.8 68.6 8.4 25.5 38.7 41.8 91.1 91.1 13.2 63.5 63.5Actuated g/C Ratio 0.05 0.16 0.40 0.05 0.15 0.23 0.25 0.54 0.54 0.08 0.37 0.37Clearance Time (s) 7.0 6.5 10.0 6.5 7.0 11.0 10.0 6.5 6.5 11.0 6.5 6.5Vehicle Extension (s) 3.0 3.0 3.0 3.0 3.0 3.0 3.0 3.0 3.0 3.0 3.0 3.0Lane Grp Cap (vph) 90 557 638 87 530 360 435 1896 848 137 1321 591v/s Ratio Prot c0.03 0.05 0.07 0.03 0.14 c0.08 c0.23 c0.52 0.06 0.20v/s Ratio Perm 0.05 0.15 0.03 0.01v/c Ratio 0.56 0.30 0.30 0.57 0.95 1.03 0.92 0.96 0.05 0.73 0.53 0.03Uniform Delay, d1 78.8 63.3 34.4 79.1 71.7 65.7 62.5 37.8 18.8 76.7 41.5 33.8Progression Factor 1.00 1.00 1.00 1.00 1.00 1.00 1.15 0.28 1.00 1.00 1.00 1.00Incremental Delay, d2 7.2 0.3 0.3 8.9 27.5 54.7 10.0 5.7 0.0 17.6 1.5 0.1Delay (s) 86.0 63.6 34.6 87.9 99.2 120.4 81.7 16.4 18.9 94.3 43.0 33.9Level of Service F E C F F F F B B F D CApproach Delay (s) 52.8 107.0 27.8 48.5Approach LOS D F C D
Intersection SummaryHCM 2000 Control Delay 50.3 HCM 2000 Level of Service DHCM 2000 Volume to Capacity ratio 1.00Actuated Cycle Length (s) 170.0 Sum of lost time (s) 31.5Intersection Capacity Utilization 100.3% ICU Level of Service GAnalysis Period (min) 15c Critical Lane Group
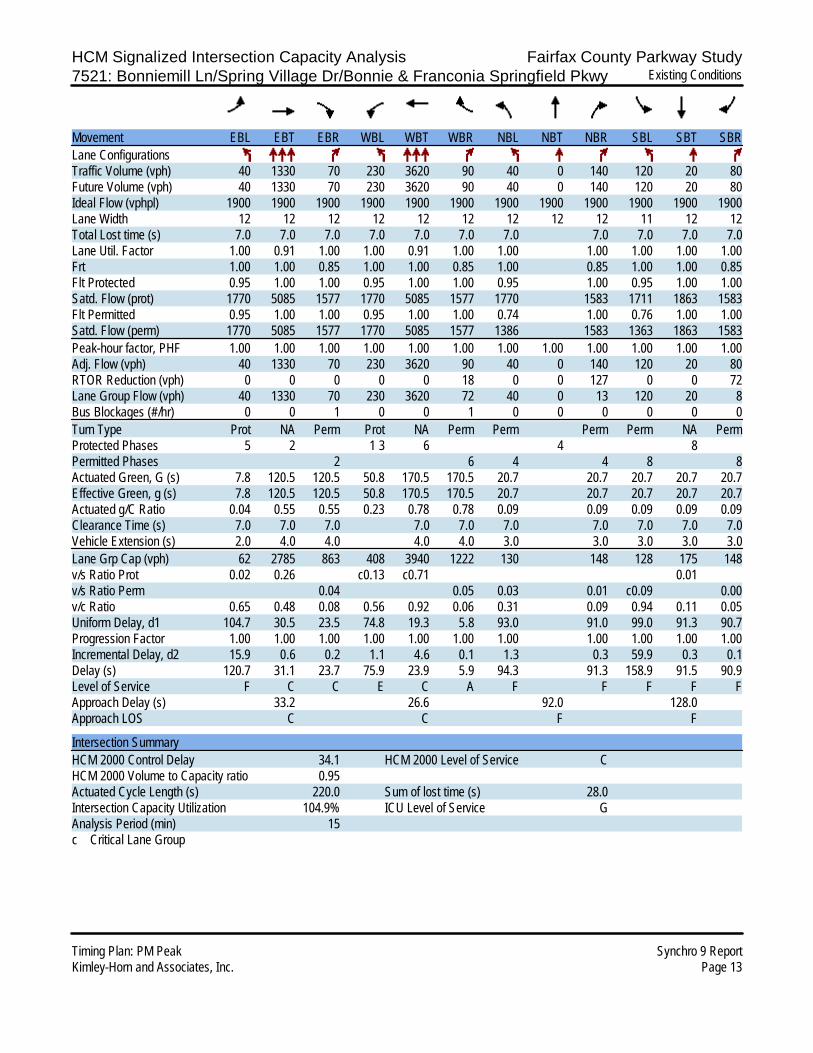
HCM Signalized Intersection Capacity Analysis Fairfax County Parkway Study7521: Bonniemill Ln/Spring Village Dr/Bonnie & Franconia Springfield Pkwy Existing Conditions
Timing Plan: PM Peak Synchro 9 ReportKimley-Horn and Associates, Inc. Page 13
Movement EBL EBT EBR WBL WBT WBR NBL NBT NBR SBL SBT SBRLane ConfigurationsTraffic Volume (vph) 40 1330 70 230 3620 90 40 0 140 120 20 80Future Volume (vph) 40 1330 70 230 3620 90 40 0 140 120 20 80Ideal Flow (vphpl) 1900 1900 1900 1900 1900 1900 1900 1900 1900 1900 1900 1900Lane Width 12 12 12 12 12 12 12 12 12 11 12 12Total Lost time (s) 7.0 7.0 7.0 7.0 7.0 7.0 7.0 7.0 7.0 7.0 7.0Lane Util. Factor 1.00 0.91 1.00 1.00 0.91 1.00 1.00 1.00 1.00 1.00 1.00Frt 1.00 1.00 0.85 1.00 1.00 0.85 1.00 0.85 1.00 1.00 0.85Flt Protected 0.95 1.00 1.00 0.95 1.00 1.00 0.95 1.00 0.95 1.00 1.00Satd. Flow (prot) 1770 5085 1577 1770 5085 1577 1770 1583 1711 1863 1583Flt Permitted 0.95 1.00 1.00 0.95 1.00 1.00 0.74 1.00 0.76 1.00 1.00Satd. Flow (perm) 1770 5085 1577 1770 5085 1577 1386 1583 1363 1863 1583Peak-hour factor, PHF 1.00 1.00 1.00 1.00 1.00 1.00 1.00 1.00 1.00 1.00 1.00 1.00Adj. Flow (vph) 40 1330 70 230 3620 90 40 0 140 120 20 80RTOR Reduction (vph) 0 0 0 0 0 18 0 0 127 0 0 72Lane Group Flow (vph) 40 1330 70 230 3620 72 40 0 13 120 20 8Bus Blockages (#/hr) 0 0 1 0 0 1 0 0 0 0 0 0Turn Type Prot NA Perm Prot NA Perm Perm Perm Perm NA PermProtected Phases 5 2 1 3 6 4 8Permitted Phases 2 6 4 4 8 8Actuated Green, G (s) 7.8 120.5 120.5 50.8 170.5 170.5 20.7 20.7 20.7 20.7 20.7Effective Green, g (s) 7.8 120.5 120.5 50.8 170.5 170.5 20.7 20.7 20.7 20.7 20.7Actuated g/C Ratio 0.04 0.55 0.55 0.23 0.78 0.78 0.09 0.09 0.09 0.09 0.09Clearance Time (s) 7.0 7.0 7.0 7.0 7.0 7.0 7.0 7.0 7.0 7.0Vehicle Extension (s) 2.0 4.0 4.0 4.0 4.0 3.0 3.0 3.0 3.0 3.0Lane Grp Cap (vph) 62 2785 863 408 3940 1222 130 148 128 175 148v/s Ratio Prot 0.02 0.26 c0.13 c0.71 0.01v/s Ratio Perm 0.04 0.05 0.03 0.01 c0.09 0.00v/c Ratio 0.65 0.48 0.08 0.56 0.92 0.06 0.31 0.09 0.94 0.11 0.05Uniform Delay, d1 104.7 30.5 23.5 74.8 19.3 5.8 93.0 91.0 99.0 91.3 90.7Progression Factor 1.00 1.00 1.00 1.00 1.00 1.00 1.00 1.00 1.00 1.00 1.00Incremental Delay, d2 15.9 0.6 0.2 1.1 4.6 0.1 1.3 0.3 59.9 0.3 0.1Delay (s) 120.7 31.1 23.7 75.9 23.9 5.9 94.3 91.3 158.9 91.5 90.9Level of Service F C C E C A F F F F FApproach Delay (s) 33.2 26.6 92.0 128.0Approach LOS C C F F
Intersection SummaryHCM 2000 Control Delay 34.1 HCM 2000 Level of Service CHCM 2000 Volume to Capacity ratio 0.95Actuated Cycle Length (s) 220.0 Sum of lost time (s) 28.0Intersection Capacity Utilization 104.9% ICU Level of Service GAnalysis Period (min) 15c Critical Lane Group
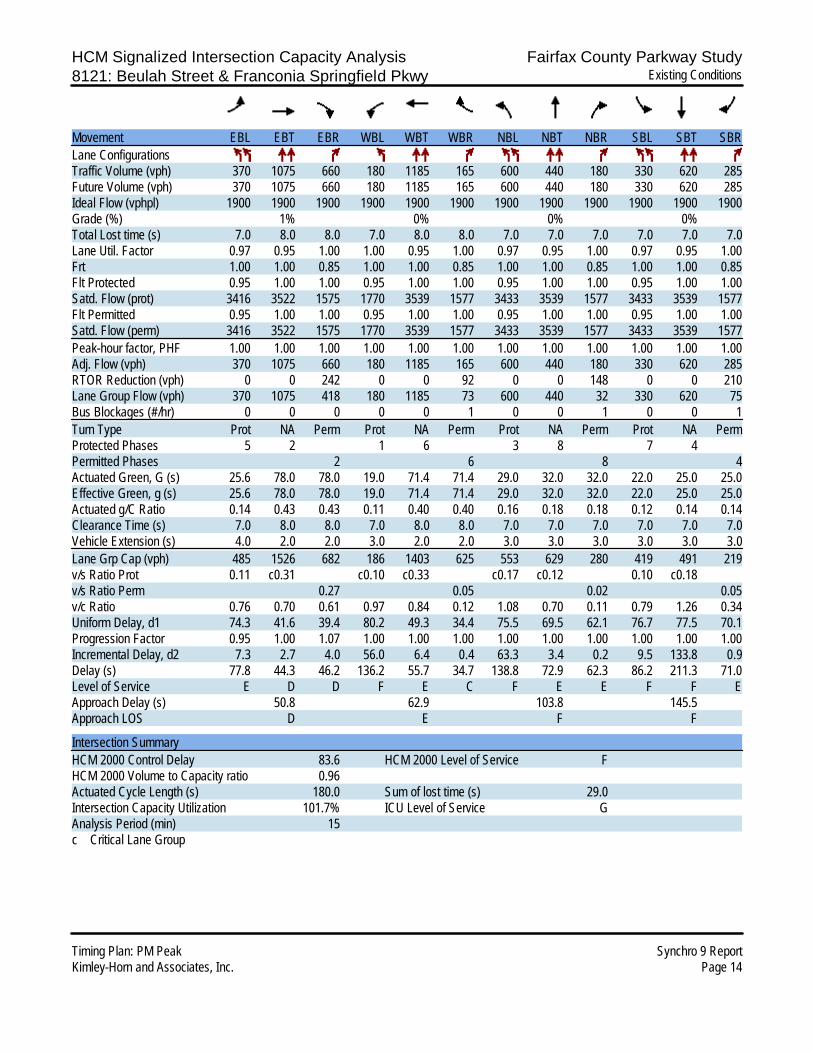
HCM Signalized Intersection Capacity Analysis Fairfax County Parkway Study8121: Beulah Street & Franconia Springfield Pkwy Existing Conditions
Timing Plan: PM Peak Synchro 9 ReportKimley-Horn and Associates, Inc. Page 14
Movement EBL EBT EBR WBL WBT WBR NBL NBT NBR SBL SBT SBRLane ConfigurationsTraffic Volume (vph) 370 1075 660 180 1185 165 600 440 180 330 620 285Future Volume (vph) 370 1075 660 180 1185 165 600 440 180 330 620 285Ideal Flow (vphpl) 1900 1900 1900 1900 1900 1900 1900 1900 1900 1900 1900 1900Grade (%) 1% 0% 0% 0%Total Lost time (s) 7.0 8.0 8.0 7.0 8.0 8.0 7.0 7.0 7.0 7.0 7.0 7.0Lane Util. Factor 0.97 0.95 1.00 1.00 0.95 1.00 0.97 0.95 1.00 0.97 0.95 1.00Frt 1.00 1.00 0.85 1.00 1.00 0.85 1.00 1.00 0.85 1.00 1.00 0.85Flt Protected 0.95 1.00 1.00 0.95 1.00 1.00 0.95 1.00 1.00 0.95 1.00 1.00Satd. Flow (prot) 3416 3522 1575 1770 3539 1577 3433 3539 1577 3433 3539 1577Flt Permitted 0.95 1.00 1.00 0.95 1.00 1.00 0.95 1.00 1.00 0.95 1.00 1.00Satd. Flow (perm) 3416 3522 1575 1770 3539 1577 3433 3539 1577 3433 3539 1577Peak-hour factor, PHF 1.00 1.00 1.00 1.00 1.00 1.00 1.00 1.00 1.00 1.00 1.00 1.00Adj. Flow (vph) 370 1075 660 180 1185 165 600 440 180 330 620 285RTOR Reduction (vph) 0 0 242 0 0 92 0 0 148 0 0 210Lane Group Flow (vph) 370 1075 418 180 1185 73 600 440 32 330 620 75Bus Blockages (#/hr) 0 0 0 0 0 1 0 0 1 0 0 1Turn Type Prot NA Perm Prot NA Perm Prot NA Perm Prot NA PermProtected Phases 5 2 1 6 3 8 7 4Permitted Phases 2 6 8 4Actuated Green, G (s) 25.6 78.0 78.0 19.0 71.4 71.4 29.0 32.0 32.0 22.0 25.0 25.0Effective Green, g (s) 25.6 78.0 78.0 19.0 71.4 71.4 29.0 32.0 32.0 22.0 25.0 25.0Actuated g/C Ratio 0.14 0.43 0.43 0.11 0.40 0.40 0.16 0.18 0.18 0.12 0.14 0.14Clearance Time (s) 7.0 8.0 8.0 7.0 8.0 8.0 7.0 7.0 7.0 7.0 7.0 7.0Vehicle Extension (s) 4.0 2.0 2.0 3.0 2.0 2.0 3.0 3.0 3.0 3.0 3.0 3.0Lane Grp Cap (vph) 485 1526 682 186 1403 625 553 629 280 419 491 219v/s Ratio Prot 0.11 c0.31 c0.10 c0.33 c0.17 c0.12 0.10 c0.18v/s Ratio Perm 0.27 0.05 0.02 0.05v/c Ratio 0.76 0.70 0.61 0.97 0.84 0.12 1.08 0.70 0.11 0.79 1.26 0.34Uniform Delay, d1 74.3 41.6 39.4 80.2 49.3 34.4 75.5 69.5 62.1 76.7 77.5 70.1Progression Factor 0.95 1.00 1.07 1.00 1.00 1.00 1.00 1.00 1.00 1.00 1.00 1.00Incremental Delay, d2 7.3 2.7 4.0 56.0 6.4 0.4 63.3 3.4 0.2 9.5 133.8 0.9Delay (s) 77.8 44.3 46.2 136.2 55.7 34.7 138.8 72.9 62.3 86.2 211.3 71.0Level of Service E D D F E C F E E F F EApproach Delay (s) 50.8 62.9 103.8 145.5Approach LOS D E F F
Intersection SummaryHCM 2000 Control Delay 83.6 HCM 2000 Level of Service FHCM 2000 Volume to Capacity ratio 0.96Actuated Cycle Length (s) 180.0 Sum of lost time (s) 29.0Intersection Capacity Utilization 101.7% ICU Level of Service GAnalysis Period (min) 15c Critical Lane Group
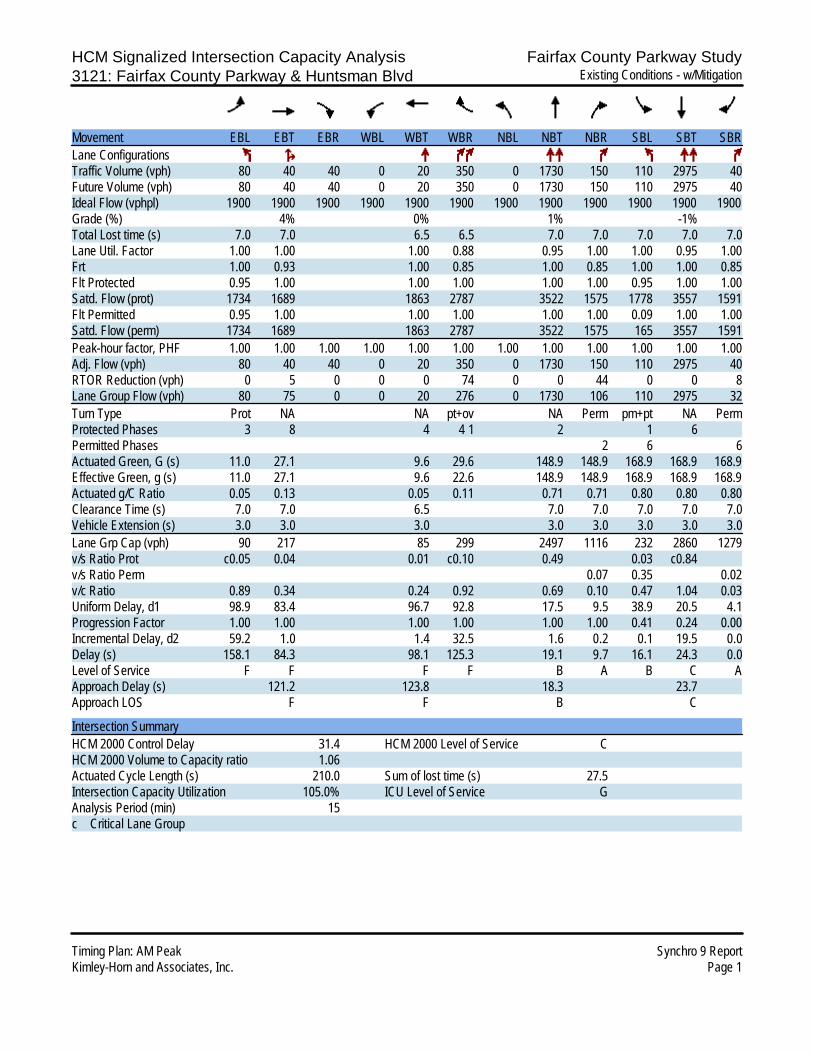
HCM Signalized Intersection Capacity Analysis Fairfax County Parkway Study3121: Fairfax County Parkway & Huntsman Blvd Existing Conditions - w/Mitigation
Timing Plan: AM Peak Synchro 9 ReportKimley-Horn and Associates, Inc. Page 1
Movement EBL EBT EBR WBL WBT WBR NBL NBT NBR SBL SBT SBRLane ConfigurationsTraffic Volume (vph) 80 40 40 0 20 350 0 1730 150 110 2975 40Future Volume (vph) 80 40 40 0 20 350 0 1730 150 110 2975 40Ideal Flow (vphpl) 1900 1900 1900 1900 1900 1900 1900 1900 1900 1900 1900 1900Grade (%) 4% 0% 1% -1%Total Lost time (s) 7.0 7.0 6.5 6.5 7.0 7.0 7.0 7.0 7.0Lane Util. Factor 1.00 1.00 1.00 0.88 0.95 1.00 1.00 0.95 1.00Frt 1.00 0.93 1.00 0.85 1.00 0.85 1.00 1.00 0.85Flt Protected 0.95 1.00 1.00 1.00 1.00 1.00 0.95 1.00 1.00Satd. Flow (prot) 1734 1689 1863 2787 3522 1575 1778 3557 1591Flt Permitted 0.95 1.00 1.00 1.00 1.00 1.00 0.09 1.00 1.00Satd. Flow (perm) 1734 1689 1863 2787 3522 1575 165 3557 1591Peak-hour factor, PHF 1.00 1.00 1.00 1.00 1.00 1.00 1.00 1.00 1.00 1.00 1.00 1.00Adj. Flow (vph) 80 40 40 0 20 350 0 1730 150 110 2975 40RTOR Reduction (vph) 0 5 0 0 0 74 0 0 44 0 0 8Lane Group Flow (vph) 80 75 0 0 20 276 0 1730 106 110 2975 32Turn Type Prot NA NA pt+ov NA Perm pm+pt NA PermProtected Phases 3 8 4 4 1 2 1 6Permitted Phases 2 6 6Actuated Green, G (s) 11.0 27.1 9.6 29.6 148.9 148.9 168.9 168.9 168.9Effective Green, g (s) 11.0 27.1 9.6 22.6 148.9 148.9 168.9 168.9 168.9Actuated g/C Ratio 0.05 0.13 0.05 0.11 0.71 0.71 0.80 0.80 0.80Clearance Time (s) 7.0 7.0 6.5 7.0 7.0 7.0 7.0 7.0Vehicle Extension (s) 3.0 3.0 3.0 3.0 3.0 3.0 3.0 3.0Lane Grp Cap (vph) 90 217 85 299 2497 1116 232 2860 1279v/s Ratio Prot c0.05 0.04 0.01 c0.10 0.49 0.03 c0.84v/s Ratio Perm 0.07 0.35 0.02v/c Ratio 0.89 0.34 0.24 0.92 0.69 0.10 0.47 1.04 0.03Uniform Delay, d1 98.9 83.4 96.7 92.8 17.5 9.5 38.9 20.5 4.1Progression Factor 1.00 1.00 1.00 1.00 1.00 1.00 0.41 0.24 0.00Incremental Delay, d2 59.2 1.0 1.4 32.5 1.6 0.2 0.1 19.5 0.0Delay (s) 158.1 84.3 98.1 125.3 19.1 9.7 16.1 24.3 0.0Level of Service F F F F B A B C AApproach Delay (s) 121.2 123.8 18.3 23.7Approach LOS F F B C
Intersection SummaryHCM 2000 Control Delay 31.4 HCM 2000 Level of Service CHCM 2000 Volume to Capacity ratio 1.06Actuated Cycle Length (s) 210.0 Sum of lost time (s) 27.5Intersection Capacity Utilization 105.0% ICU Level of Service GAnalysis Period (min) 15c Critical Lane Group
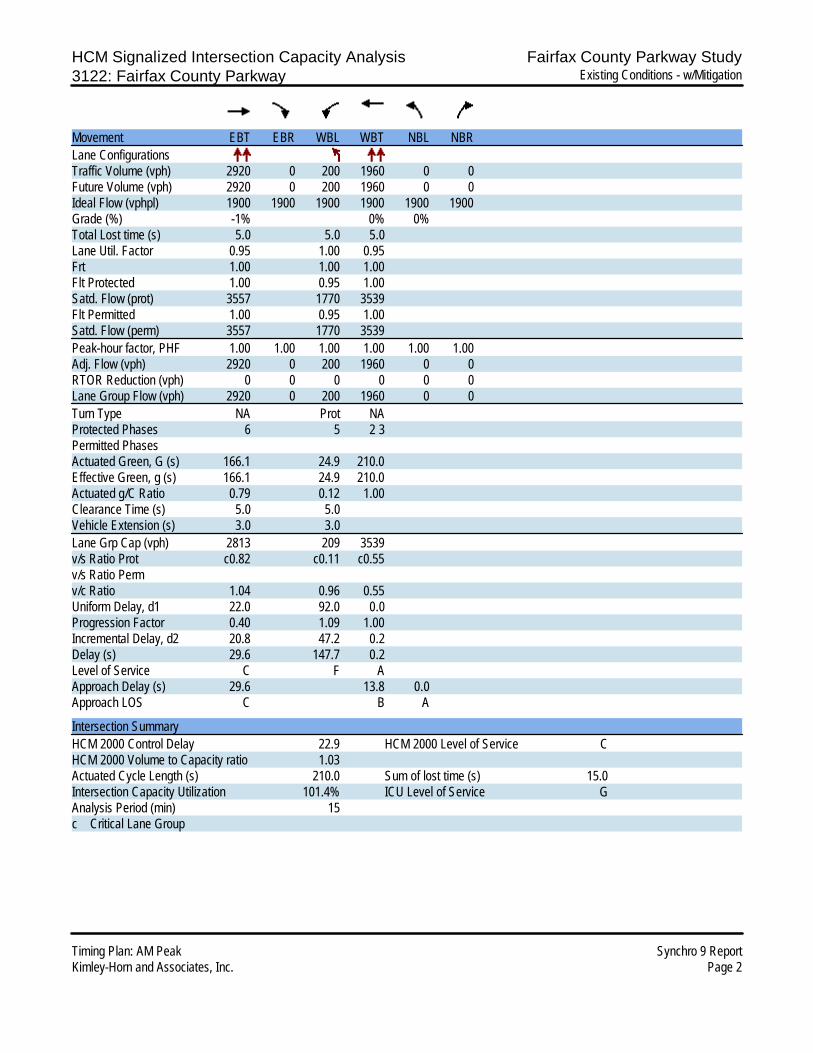
HCM Signalized Intersection Capacity Analysis Fairfax County Parkway Study3122: Fairfax County Parkway Existing Conditions - w/Mitigation
Timing Plan: AM Peak Synchro 9 ReportKimley-Horn and Associates, Inc. Page 2
Movement EBT EBR WBL WBT NBL NBRLane ConfigurationsTraffic Volume (vph) 2920 0 200 1960 0 0Future Volume (vph) 2920 0 200 1960 0 0Ideal Flow (vphpl) 1900 1900 1900 1900 1900 1900Grade (%) -1% 0% 0%Total Lost time (s) 5.0 5.0 5.0Lane Util. Factor 0.95 1.00 0.95Frt 1.00 1.00 1.00Flt Protected 1.00 0.95 1.00Satd. Flow (prot) 3557 1770 3539Flt Permitted 1.00 0.95 1.00Satd. Flow (perm) 3557 1770 3539Peak-hour factor, PHF 1.00 1.00 1.00 1.00 1.00 1.00Adj. Flow (vph) 2920 0 200 1960 0 0RTOR Reduction (vph) 0 0 0 0 0 0Lane Group Flow (vph) 2920 0 200 1960 0 0Turn Type NA Prot NAProtected Phases 6 5 2 3Permitted PhasesActuated Green, G (s) 166.1 24.9 210.0Effective Green, g (s) 166.1 24.9 210.0Actuated g/C Ratio 0.79 0.12 1.00Clearance Time (s) 5.0 5.0Vehicle Extension (s) 3.0 3.0Lane Grp Cap (vph) 2813 209 3539v/s Ratio Prot c0.82 c0.11 c0.55v/s Ratio Permv/c Ratio 1.04 0.96 0.55Uniform Delay, d1 22.0 92.0 0.0Progression Factor 0.40 1.09 1.00Incremental Delay, d2 20.8 47.2 0.2Delay (s) 29.6 147.7 0.2Level of Service C F AApproach Delay (s) 29.6 13.8 0.0Approach LOS C B A
Intersection SummaryHCM 2000 Control Delay 22.9 HCM 2000 Level of Service CHCM 2000 Volume to Capacity ratio 1.03Actuated Cycle Length (s) 210.0 Sum of lost time (s) 15.0Intersection Capacity Utilization 101.4% ICU Level of Service GAnalysis Period (min) 15c Critical Lane Group
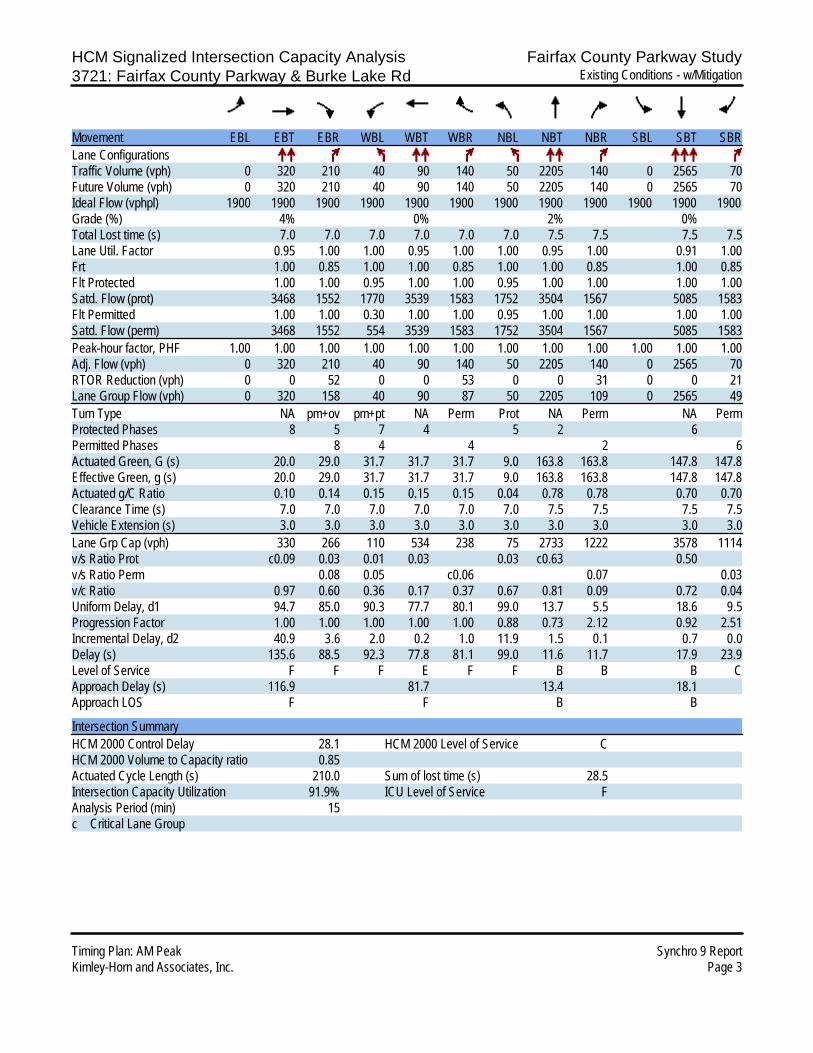
HCM Signalized Intersection Capacity Analysis Fairfax County Parkway Study3721: Fairfax County Parkway & Burke Lake Rd Existing Conditions - w/Mitigation
Timing Plan: AM Peak Synchro 9 ReportKimley-Horn and Associates, Inc. Page 3
Movement EBL EBT EBR WBL WBT WBR NBL NBT NBR SBL SBT SBRLane ConfigurationsTraffic Volume (vph) 0 320 210 40 90 140 50 2205 140 0 2565 70Future Volume (vph) 0 320 210 40 90 140 50 2205 140 0 2565 70Ideal Flow (vphpl) 1900 1900 1900 1900 1900 1900 1900 1900 1900 1900 1900 1900Grade (%) 4% 0% 2% 0%Total Lost time (s) 7.0 7.0 7.0 7.0 7.0 7.0 7.5 7.5 7.5 7.5Lane Util. Factor 0.95 1.00 1.00 0.95 1.00 1.00 0.95 1.00 0.91 1.00Frt 1.00 0.85 1.00 1.00 0.85 1.00 1.00 0.85 1.00 0.85Flt Protected 1.00 1.00 0.95 1.00 1.00 0.95 1.00 1.00 1.00 1.00Satd. Flow (prot) 3468 1552 1770 3539 1583 1752 3504 1567 5085 1583Flt Permitted 1.00 1.00 0.30 1.00 1.00 0.95 1.00 1.00 1.00 1.00Satd. Flow (perm) 3468 1552 554 3539 1583 1752 3504 1567 5085 1583Peak-hour factor, PHF 1.00 1.00 1.00 1.00 1.00 1.00 1.00 1.00 1.00 1.00 1.00 1.00Adj. Flow (vph) 0 320 210 40 90 140 50 2205 140 0 2565 70RTOR Reduction (vph) 0 0 52 0 0 53 0 0 31 0 0 21Lane Group Flow (vph) 0 320 158 40 90 87 50 2205 109 0 2565 49Turn Type NA pm+ov pm+pt NA Perm Prot NA Perm NA PermProtected Phases 8 5 7 4 5 2 6Permitted Phases 8 4 4 2 6Actuated Green, G (s) 20.0 29.0 31.7 31.7 31.7 9.0 163.8 163.8 147.8 147.8Effective Green, g (s) 20.0 29.0 31.7 31.7 31.7 9.0 163.8 163.8 147.8 147.8Actuated g/C Ratio 0.10 0.14 0.15 0.15 0.15 0.04 0.78 0.78 0.70 0.70Clearance Time (s) 7.0 7.0 7.0 7.0 7.0 7.0 7.5 7.5 7.5 7.5Vehicle Extension (s) 3.0 3.0 3.0 3.0 3.0 3.0 3.0 3.0 3.0 3.0Lane Grp Cap (vph) 330 266 110 534 238 75 2733 1222 3578 1114v/s Ratio Prot c0.09 0.03 0.01 0.03 0.03 c0.63 0.50v/s Ratio Perm 0.08 0.05 c0.06 0.07 0.03v/c Ratio 0.97 0.60 0.36 0.17 0.37 0.67 0.81 0.09 0.72 0.04Uniform Delay, d1 94.7 85.0 90.3 77.7 80.1 99.0 13.7 5.5 18.6 9.5Progression Factor 1.00 1.00 1.00 1.00 1.00 0.88 0.73 2.12 0.92 2.51Incremental Delay, d2 40.9 3.6 2.0 0.2 1.0 11.9 1.5 0.1 0.7 0.0Delay (s) 135.6 88.5 92.3 77.8 81.1 99.0 11.6 11.7 17.9 23.9Level of Service F F F E F F B B B CApproach Delay (s) 116.9 81.7 13.4 18.1Approach LOS F F B B
Intersection SummaryHCM 2000 Control Delay 28.1 HCM 2000 Level of Service CHCM 2000 Volume to Capacity ratio 0.85Actuated Cycle Length (s) 210.0 Sum of lost time (s) 28.5Intersection Capacity Utilization 91.9% ICU Level of Service FAnalysis Period (min) 15c Critical Lane Group
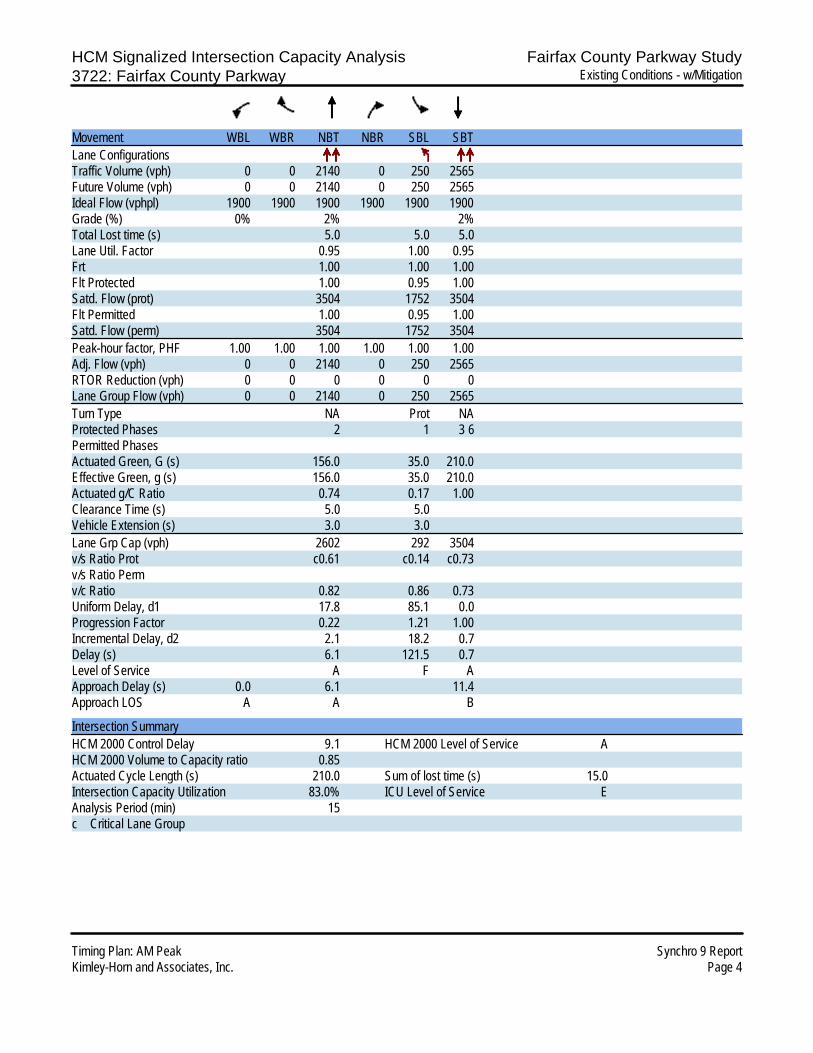
HCM Signalized Intersection Capacity Analysis Fairfax County Parkway Study3722: Fairfax County Parkway Existing Conditions - w/Mitigation
Timing Plan: AM Peak Synchro 9 ReportKimley-Horn and Associates, Inc. Page 4
Movement WBL WBR NBT NBR SBL SBTLane ConfigurationsTraffic Volume (vph) 0 0 2140 0 250 2565Future Volume (vph) 0 0 2140 0 250 2565Ideal Flow (vphpl) 1900 1900 1900 1900 1900 1900Grade (%) 0% 2% 2%Total Lost time (s) 5.0 5.0 5.0Lane Util. Factor 0.95 1.00 0.95Frt 1.00 1.00 1.00Flt Protected 1.00 0.95 1.00Satd. Flow (prot) 3504 1752 3504Flt Permitted 1.00 0.95 1.00Satd. Flow (perm) 3504 1752 3504Peak-hour factor, PHF 1.00 1.00 1.00 1.00 1.00 1.00Adj. Flow (vph) 0 0 2140 0 250 2565RTOR Reduction (vph) 0 0 0 0 0 0Lane Group Flow (vph) 0 0 2140 0 250 2565Turn Type NA Prot NAProtected Phases 2 1 3 6Permitted PhasesActuated Green, G (s) 156.0 35.0 210.0Effective Green, g (s) 156.0 35.0 210.0Actuated g/C Ratio 0.74 0.17 1.00Clearance Time (s) 5.0 5.0Vehicle Extension (s) 3.0 3.0Lane Grp Cap (vph) 2602 292 3504v/s Ratio Prot c0.61 c0.14 c0.73v/s Ratio Permv/c Ratio 0.82 0.86 0.73Uniform Delay, d1 17.8 85.1 0.0Progression Factor 0.22 1.21 1.00Incremental Delay, d2 2.1 18.2 0.7Delay (s) 6.1 121.5 0.7Level of Service A F AApproach Delay (s) 0.0 6.1 11.4Approach LOS A A B
Intersection SummaryHCM 2000 Control Delay 9.1 HCM 2000 Level of Service AHCM 2000 Volume to Capacity ratio 0.85Actuated Cycle Length (s) 210.0 Sum of lost time (s) 15.0Intersection Capacity Utilization 83.0% ICU Level of Service EAnalysis Period (min) 15c Critical Lane Group

HCM Signalized Intersection Capacity Analysis Fairfax County Parkway Study5321: Fairfax County Parkway & Rt 50 EB Off-Ramp Existing Conditions - w/Mitigation
Timing Plan: AM Peak Synchro 9 ReportKimley-Horn and Associates, Inc. Page 5
Movement EBL EBT EBR WBL WBT WBR NBL NBT NBR SBL SBT SBRLane ConfigurationsTraffic Volume (vph) 70 0 0 0 0 0 0 3185 90 0 1675 0Future Volume (vph) 70 0 0 0 0 0 0 3185 90 0 1675 0Ideal Flow (vphpl) 1900 1900 1900 1900 1900 1900 1900 1900 1900 1900 1900 1900Lane Width 16 12 12 12 12 12 12 12 12 12 12 12Total Lost time (s) 7.5 6.0 6.0 6.5Lane Util. Factor 1.00 0.86 1.00 0.91Frt 1.00 1.00 0.85 1.00Flt Protected 0.95 1.00 1.00 1.00Satd. Flow (prot) 2006 6408 1583 5085Flt Permitted 0.95 1.00 1.00 1.00Satd. Flow (perm) 2006 6408 1583 5085Peak-hour factor, PHF 1.00 1.00 1.00 1.00 1.00 1.00 1.00 1.00 1.00 1.00 1.00 1.00Adj. Flow (vph) 70 0 0 0 0 0 0 3185 90 0 1675 0RTOR Reduction (vph) 0 0 0 0 0 0 0 0 18 0 0 0Lane Group Flow (vph) 70 0 0 0 0 0 0 3185 72 0 1675 0Turn Type Prot NA Perm NAProtected Phases 4 2 6Permitted Phases 2Actuated Green, G (s) 7.2 84.3 84.3 83.8Effective Green, g (s) 7.2 84.3 84.3 83.8Actuated g/C Ratio 0.07 0.80 0.80 0.80Clearance Time (s) 7.5 6.0 6.0 6.5Vehicle Extension (s) 2.0 4.0 4.0 4.0Lane Grp Cap (vph) 137 5144 1270 4058v/s Ratio Prot c0.03 c0.50 0.33v/s Ratio Perm 0.05v/c Ratio 0.51 0.62 0.06 0.41Uniform Delay, d1 47.2 4.1 2.1 3.2Progression Factor 1.00 1.00 1.00 0.28Incremental Delay, d2 1.3 0.6 0.1 0.3Delay (s) 48.5 4.6 2.2 1.2Level of Service D A A AApproach Delay (s) 48.5 0.0 4.6 1.2Approach LOS D A A A
Intersection SummaryHCM 2000 Control Delay 4.0 HCM 2000 Level of Service AHCM 2000 Volume to Capacity ratio 0.61Actuated Cycle Length (s) 105.0 Sum of lost time (s) 14.0Intersection Capacity Utilization 61.6% ICU Level of Service BAnalysis Period (min) 15c Critical Lane Group
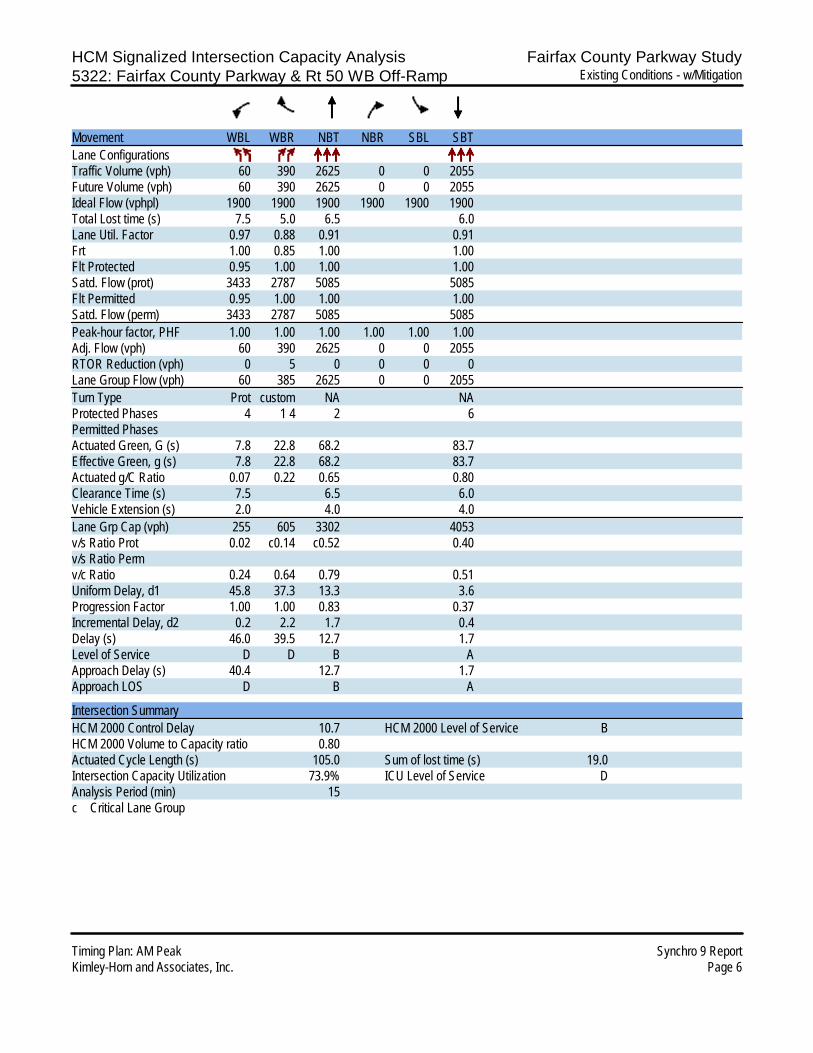
HCM Signalized Intersection Capacity Analysis Fairfax County Parkway Study5322: Fairfax County Parkway & Rt 50 WB Off-Ramp Existing Conditions - w/Mitigation
Timing Plan: AM Peak Synchro 9 ReportKimley-Horn and Associates, Inc. Page 6
Movement WBL WBR NBT NBR SBL SBTLane ConfigurationsTraffic Volume (vph) 60 390 2625 0 0 2055Future Volume (vph) 60 390 2625 0 0 2055Ideal Flow (vphpl) 1900 1900 1900 1900 1900 1900Total Lost time (s) 7.5 5.0 6.5 6.0Lane Util. Factor 0.97 0.88 0.91 0.91Frt 1.00 0.85 1.00 1.00Flt Protected 0.95 1.00 1.00 1.00Satd. Flow (prot) 3433 2787 5085 5085Flt Permitted 0.95 1.00 1.00 1.00Satd. Flow (perm) 3433 2787 5085 5085Peak-hour factor, PHF 1.00 1.00 1.00 1.00 1.00 1.00Adj. Flow (vph) 60 390 2625 0 0 2055RTOR Reduction (vph) 0 5 0 0 0 0Lane Group Flow (vph) 60 385 2625 0 0 2055Turn Type Prot custom NA NAProtected Phases 4 1 4 2 6Permitted PhasesActuated Green, G (s) 7.8 22.8 68.2 83.7Effective Green, g (s) 7.8 22.8 68.2 83.7Actuated g/C Ratio 0.07 0.22 0.65 0.80Clearance Time (s) 7.5 6.5 6.0Vehicle Extension (s) 2.0 4.0 4.0Lane Grp Cap (vph) 255 605 3302 4053v/s Ratio Prot 0.02 c0.14 c0.52 0.40v/s Ratio Permv/c Ratio 0.24 0.64 0.79 0.51Uniform Delay, d1 45.8 37.3 13.3 3.6Progression Factor 1.00 1.00 0.83 0.37Incremental Delay, d2 0.2 2.2 1.7 0.4Delay (s) 46.0 39.5 12.7 1.7Level of Service D D B AApproach Delay (s) 40.4 12.7 1.7Approach LOS D B A
Intersection SummaryHCM 2000 Control Delay 10.7 HCM 2000 Level of Service BHCM 2000 Volume to Capacity ratio 0.80Actuated Cycle Length (s) 105.0 Sum of lost time (s) 19.0Intersection Capacity Utilization 73.9% ICU Level of Service DAnalysis Period (min) 15c Critical Lane Group

HCM Signalized Intersection Capacity Analysis Fairfax County Parkway Study5421: Fairfax County Parkway & Rugby Rd Existing Conditions - w/Mitigation
Timing Plan: AM Peak Synchro 9 ReportKimley-Horn and Associates, Inc. Page 7
Movement EBL EBT EBR WBL WBT WBR NBL NBT NBR SBL SBT SBRLane ConfigurationsTraffic Volume (vph) 230 140 90 250 140 90 10 2220 790 150 1725 60Future Volume (vph) 230 140 90 250 140 90 10 2220 790 150 1725 60Ideal Flow (vphpl) 1900 1900 1900 1900 1900 1900 1900 1900 1900 1900 1900 1900Total Lost time (s) 5.5 5.5 5.5 6.5 6.5 8.0 9.0 6.5 6.5 8.0 6.0 5.5Lane Util. Factor 0.95 0.95 1.00 0.91 0.91 1.00 1.00 0.91 1.00 1.00 0.91 1.00Frt 1.00 1.00 0.85 1.00 1.00 0.85 1.00 1.00 0.85 1.00 1.00 0.85Flt Protected 0.95 0.99 1.00 0.95 0.99 1.00 0.95 1.00 1.00 0.95 1.00 1.00Satd. Flow (prot) 1681 1747 1583 3221 1682 1583 1770 5085 1583 1770 5085 1583Flt Permitted 0.95 0.99 1.00 0.95 0.99 1.00 0.95 1.00 1.00 0.95 1.00 1.00Satd. Flow (perm) 1681 1747 1583 3221 1682 1583 1770 5085 1583 1770 5085 1583Peak-hour factor, PHF 1.00 1.00 1.00 1.00 1.00 1.00 1.00 1.00 1.00 1.00 1.00 1.00Adj. Flow (vph) 230 140 90 250 140 90 10 2220 790 150 1725 60RTOR Reduction (vph) 0 0 79 0 0 37 0 0 94 0 0 15Lane Group Flow (vph) 182 188 11 225 165 53 10 2220 696 150 1725 45Turn Type Split NA Perm Split NA pm+ov Prot NA pm+ov Prot NA pm+ovProtected Phases 3 3 4 4 5 1 6 4 5 2 3Permitted Phases 3 4 6 2Actuated Green, G (s) 25.2 25.2 25.2 22.2 22.2 46.4 4.0 111.9 134.1 24.2 131.6 156.8Effective Green, g (s) 25.2 25.2 25.2 22.2 22.2 46.4 4.0 111.9 134.1 24.2 131.6 156.8Actuated g/C Ratio 0.12 0.12 0.12 0.11 0.11 0.22 0.02 0.53 0.64 0.12 0.63 0.75Clearance Time (s) 5.5 5.5 5.5 6.5 6.5 8.0 9.0 6.5 6.5 8.0 6.0 5.5Vehicle Extension (s) 3.0 3.0 3.0 3.0 3.0 5.0 5.0 3.0 3.0 5.0 3.0 3.0Lane Grp Cap (vph) 201 209 189 340 177 349 33 2709 1010 203 3186 1181v/s Ratio Prot c0.11 0.11 0.07 c0.10 0.02 0.01 c0.44 0.07 c0.08 0.34 0.00v/s Ratio Perm 0.01 0.02 0.37 0.02v/c Ratio 0.91 0.90 0.06 0.66 0.93 0.15 0.30 0.82 0.69 0.74 0.54 0.04Uniform Delay, d1 91.2 91.2 81.9 90.3 93.2 66.0 101.6 40.7 24.5 89.8 22.2 6.9Progression Factor 1.00 1.00 1.00 1.00 1.00 1.00 1.10 1.02 1.13 1.13 0.63 0.00Incremental Delay, d2 38.0 35.6 0.1 4.8 48.2 0.4 6.7 1.8 1.2 12.5 0.5 0.0Delay (s) 129.3 126.7 82.0 95.1 141.3 66.4 118.5 43.3 28.9 113.9 14.4 0.0Level of Service F F F F F E F D C F B AApproach Delay (s) 119.0 105.6 39.8 21.7Approach LOS F F D C
Intersection SummaryHCM 2000 Control Delay 45.4 HCM 2000 Level of Service DHCM 2000 Volume to Capacity ratio 0.84Actuated Cycle Length (s) 210.0 Sum of lost time (s) 27.0Intersection Capacity Utilization 90.7% ICU Level of Service EAnalysis Period (min) 15c Critical Lane Group
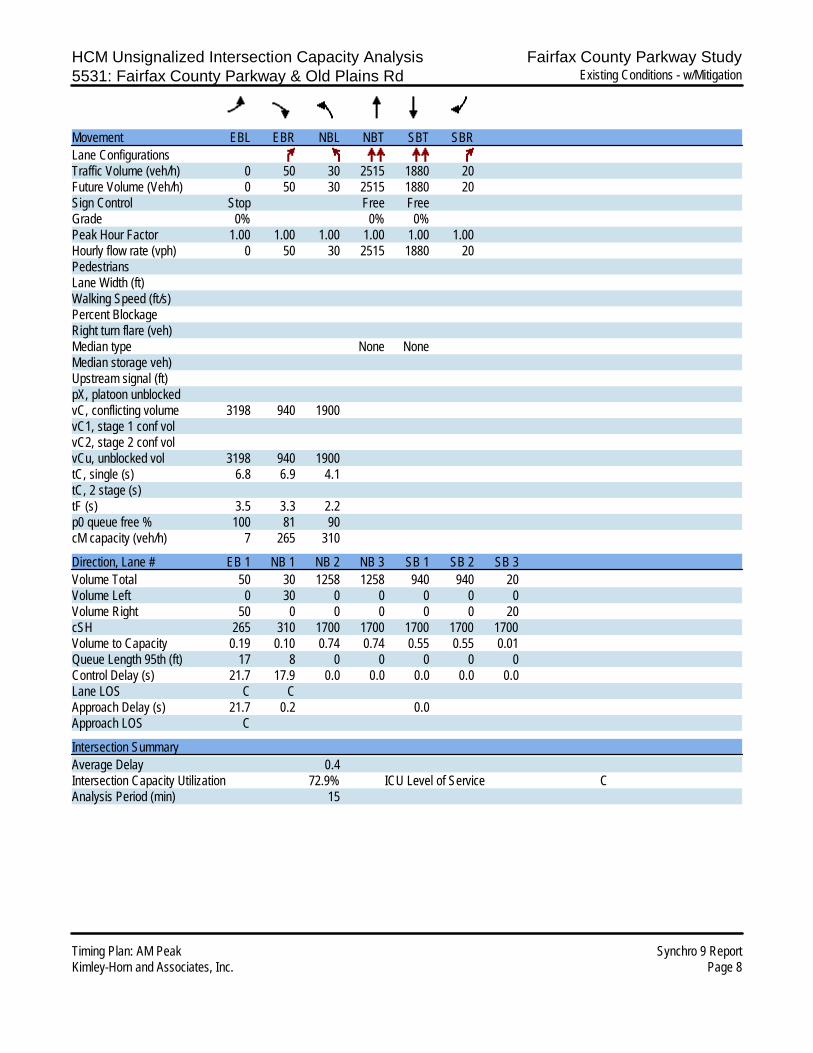
HCM Unsignalized Intersection Capacity Analysis Fairfax County Parkway Study5531: Fairfax County Parkway & Old Plains Rd Existing Conditions - w/Mitigation
Timing Plan: AM Peak Synchro 9 ReportKimley-Horn and Associates, Inc. Page 8
Movement EBL EBR NBL NBT SBT SBRLane ConfigurationsTraffic Volume (veh/h) 0 50 30 2515 1880 20Future Volume (Veh/h) 0 50 30 2515 1880 20Sign Control Stop Free FreeGrade 0% 0% 0%Peak Hour Factor 1.00 1.00 1.00 1.00 1.00 1.00Hourly flow rate (vph) 0 50 30 2515 1880 20PedestriansLane Width (ft)Walking Speed (ft/s)Percent BlockageRight turn flare (veh)Median type None NoneMedian storage veh)Upstream signal (ft)pX, platoon unblockedvC, conflicting volume 3198 940 1900vC1, stage 1 conf volvC2, stage 2 conf volvCu, unblocked vol 3198 940 1900tC, single (s) 6.8 6.9 4.1tC, 2 stage (s)tF (s) 3.5 3.3 2.2p0 queue free % 100 81 90cM capacity (veh/h) 7 265 310
Direction, Lane # EB 1 NB 1 NB 2 NB 3 SB 1 SB 2 SB 3Volume Total 50 30 1258 1258 940 940 20Volume Left 0 30 0 0 0 0 0Volume Right 50 0 0 0 0 0 20cSH 265 310 1700 1700 1700 1700 1700Volume to Capacity 0.19 0.10 0.74 0.74 0.55 0.55 0.01Queue Length 95th (ft) 17 8 0 0 0 0 0Control Delay (s) 21.7 17.9 0.0 0.0 0.0 0.0 0.0Lane LOS C CApproach Delay (s) 21.7 0.2 0.0Approach LOS C
Intersection SummaryAverage Delay 0.4Intersection Capacity Utilization 72.9% ICU Level of Service CAnalysis Period (min) 15
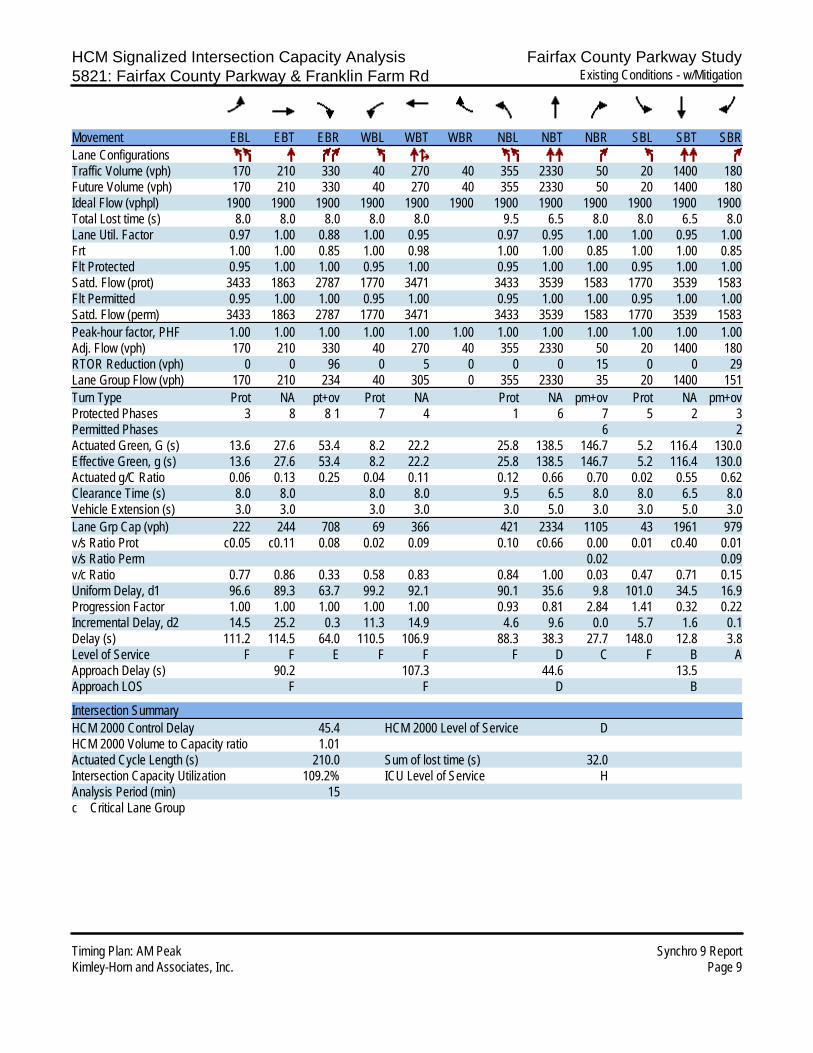
HCM Signalized Intersection Capacity Analysis Fairfax County Parkway Study5821: Fairfax County Parkway & Franklin Farm Rd Existing Conditions - w/Mitigation
Timing Plan: AM Peak Synchro 9 ReportKimley-Horn and Associates, Inc. Page 9
Movement EBL EBT EBR WBL WBT WBR NBL NBT NBR SBL SBT SBRLane ConfigurationsTraffic Volume (vph) 170 210 330 40 270 40 355 2330 50 20 1400 180Future Volume (vph) 170 210 330 40 270 40 355 2330 50 20 1400 180Ideal Flow (vphpl) 1900 1900 1900 1900 1900 1900 1900 1900 1900 1900 1900 1900Total Lost time (s) 8.0 8.0 8.0 8.0 8.0 9.5 6.5 8.0 8.0 6.5 8.0Lane Util. Factor 0.97 1.00 0.88 1.00 0.95 0.97 0.95 1.00 1.00 0.95 1.00Frt 1.00 1.00 0.85 1.00 0.98 1.00 1.00 0.85 1.00 1.00 0.85Flt Protected 0.95 1.00 1.00 0.95 1.00 0.95 1.00 1.00 0.95 1.00 1.00Satd. Flow (prot) 3433 1863 2787 1770 3471 3433 3539 1583 1770 3539 1583Flt Permitted 0.95 1.00 1.00 0.95 1.00 0.95 1.00 1.00 0.95 1.00 1.00Satd. Flow (perm) 3433 1863 2787 1770 3471 3433 3539 1583 1770 3539 1583Peak-hour factor, PHF 1.00 1.00 1.00 1.00 1.00 1.00 1.00 1.00 1.00 1.00 1.00 1.00Adj. Flow (vph) 170 210 330 40 270 40 355 2330 50 20 1400 180RTOR Reduction (vph) 0 0 96 0 5 0 0 0 15 0 0 29Lane Group Flow (vph) 170 210 234 40 305 0 355 2330 35 20 1400 151Turn Type Prot NA pt+ov Prot NA Prot NA pm+ov Prot NA pm+ovProtected Phases 3 8 8 1 7 4 1 6 7 5 2 3Permitted Phases 6 2Actuated Green, G (s) 13.6 27.6 53.4 8.2 22.2 25.8 138.5 146.7 5.2 116.4 130.0Effective Green, g (s) 13.6 27.6 53.4 8.2 22.2 25.8 138.5 146.7 5.2 116.4 130.0Actuated g/C Ratio 0.06 0.13 0.25 0.04 0.11 0.12 0.66 0.70 0.02 0.55 0.62Clearance Time (s) 8.0 8.0 8.0 8.0 9.5 6.5 8.0 8.0 6.5 8.0Vehicle Extension (s) 3.0 3.0 3.0 3.0 3.0 5.0 3.0 3.0 5.0 3.0Lane Grp Cap (vph) 222 244 708 69 366 421 2334 1105 43 1961 979v/s Ratio Prot c0.05 c0.11 0.08 0.02 0.09 0.10 c0.66 0.00 0.01 c0.40 0.01v/s Ratio Perm 0.02 0.09v/c Ratio 0.77 0.86 0.33 0.58 0.83 0.84 1.00 0.03 0.47 0.71 0.15Uniform Delay, d1 96.6 89.3 63.7 99.2 92.1 90.1 35.6 9.8 101.0 34.5 16.9Progression Factor 1.00 1.00 1.00 1.00 1.00 0.93 0.81 2.84 1.41 0.32 0.22Incremental Delay, d2 14.5 25.2 0.3 11.3 14.9 4.6 9.6 0.0 5.7 1.6 0.1Delay (s) 111.2 114.5 64.0 110.5 106.9 88.3 38.3 27.7 148.0 12.8 3.8Level of Service F F E F F F D C F B AApproach Delay (s) 90.2 107.3 44.6 13.5Approach LOS F F D B
Intersection SummaryHCM 2000 Control Delay 45.4 HCM 2000 Level of Service DHCM 2000 Volume to Capacity ratio 1.01Actuated Cycle Length (s) 210.0 Sum of lost time (s) 32.0Intersection Capacity Utilization 109.2% ICU Level of Service HAnalysis Period (min) 15c Critical Lane Group

HCM Signalized Intersection Capacity Analysis Fairfax County Parkway Study5921: Fairfax County Parkway & West Ox Rd Existing Conditions - w/Mitigation
Timing Plan: AM Peak Synchro 9 ReportKimley-Horn and Associates, Inc. Page 10
Movement EBL EBT EBR WBL WBT WBR NBL NBT NBR SBL SBT SBRLane ConfigurationsTraffic Volume (vph) 170 230 310 40 290 90 560 1930 50 50 1245 260Future Volume (vph) 170 230 310 40 290 90 560 1930 50 50 1245 260Ideal Flow (vphpl) 1900 1900 1900 1900 1900 1900 1900 1900 1900 1900 1900 1900Total Lost time (s) 8.0 8.0 9.5 8.0 8.0 9.5 6.5 6.5 8.0 6.0 4.0Lane Util. Factor 1.00 1.00 1.00 1.00 0.95 0.97 0.95 1.00 1.00 0.95 1.00Frt 1.00 1.00 0.85 1.00 0.96 1.00 1.00 0.85 1.00 1.00 0.85Flt Protected 0.95 1.00 1.00 0.95 1.00 0.95 1.00 1.00 0.95 1.00 1.00Satd. Flow (prot) 1770 1863 1583 1770 3413 3433 3539 1583 1770 3539 1583Flt Permitted 0.20 1.00 1.00 0.43 1.00 0.95 1.00 1.00 0.95 1.00 1.00Satd. Flow (perm) 379 1863 1583 802 3413 3433 3539 1583 1770 3539 1583Peak-hour factor, PHF 1.00 1.00 1.00 1.00 1.00 1.00 1.00 1.00 1.00 1.00 1.00 1.00Adj. Flow (vph) 170 230 310 40 290 90 560 1930 50 50 1245 260RTOR Reduction (vph) 0 0 65 0 15 0 0 0 20 0 0 0Lane Group Flow (vph) 170 230 245 40 365 0 560 1930 30 50 1245 260Turn Type pm+pt NA pm+ov pm+pt NA Prot NA Perm Prot NA FreeProtected Phases 3 8 1 7 4 1 6 5 2Permitted Phases 8 8 4 6 FreeActuated Green, G (s) 51.9 37.5 75.5 35.3 28.9 38.0 126.0 126.0 9.6 96.6 210.0Effective Green, g (s) 51.9 37.5 75.5 35.3 28.9 38.0 126.0 126.0 9.6 96.6 210.0Actuated g/C Ratio 0.25 0.18 0.36 0.17 0.14 0.18 0.60 0.60 0.05 0.46 1.00Clearance Time (s) 8.0 8.0 9.5 8.0 8.0 9.5 6.5 6.5 8.0 6.0Vehicle Extension (s) 3.0 3.0 3.0 3.0 3.0 3.0 3.0 3.0 3.0 3.0Lane Grp Cap (vph) 193 332 569 164 469 621 2123 949 80 1627 1583v/s Ratio Prot c0.06 c0.12 0.08 0.01 0.11 0.16 c0.55 0.03 c0.35v/s Ratio Perm c0.15 0.08 0.03 0.02 0.16v/c Ratio 0.88 0.69 0.43 0.24 0.78 0.90 0.91 0.03 0.62 0.77 0.16Uniform Delay, d1 69.6 80.9 51.0 74.5 87.5 84.2 37.0 17.1 98.4 47.2 0.0Progression Factor 1.00 1.00 1.00 1.00 1.00 1.12 0.50 1.00 0.86 0.71 1.00Incremental Delay, d2 34.1 6.1 0.5 0.8 8.0 6.4 2.6 0.0 11.8 2.9 0.2Delay (s) 103.7 87.0 51.5 75.3 95.5 100.7 20.9 17.1 96.6 36.6 0.2Level of Service F F D E F F C B F D AApproach Delay (s) 75.5 93.5 38.5 32.5Approach LOS E F D C
Intersection SummaryHCM 2000 Control Delay 46.1 HCM 2000 Level of Service DHCM 2000 Volume to Capacity ratio 0.94Actuated Cycle Length (s) 210.0 Sum of lost time (s) 31.5Intersection Capacity Utilization 103.2% ICU Level of Service GAnalysis Period (min) 15c Critical Lane Group
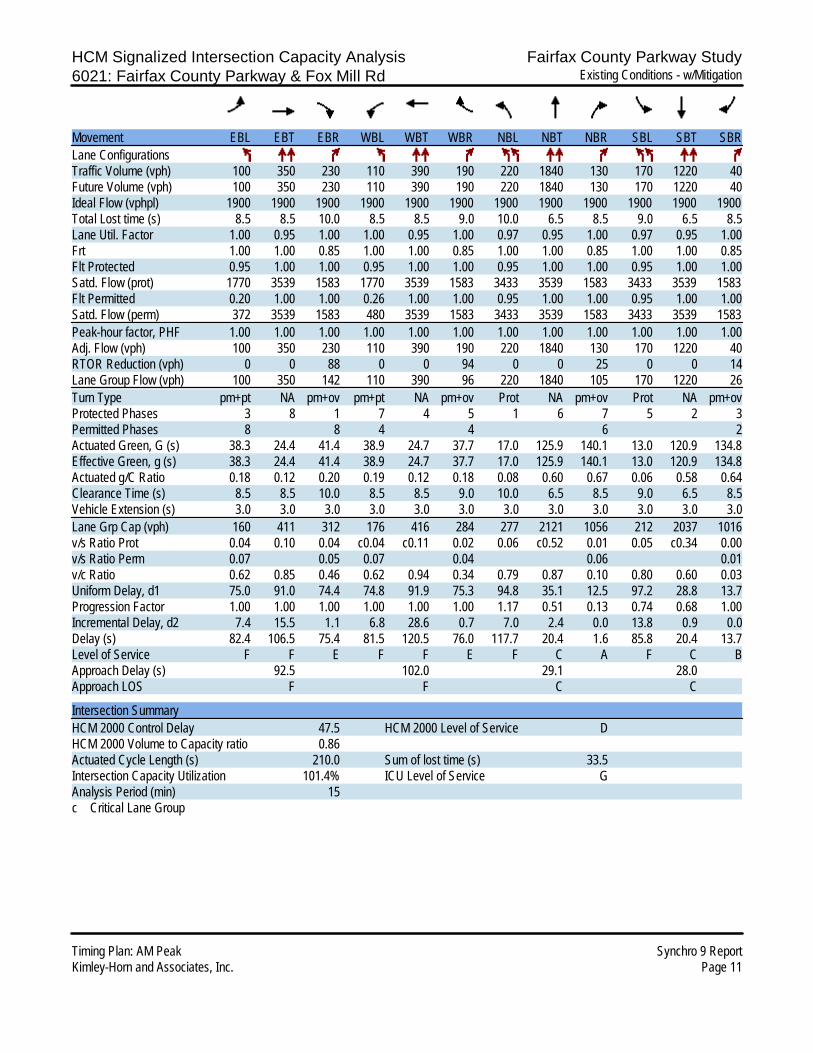
HCM Signalized Intersection Capacity Analysis Fairfax County Parkway Study6021: Fairfax County Parkway & Fox Mill Rd Existing Conditions - w/Mitigation
Timing Plan: AM Peak Synchro 9 ReportKimley-Horn and Associates, Inc. Page 11
Movement EBL EBT EBR WBL WBT WBR NBL NBT NBR SBL SBT SBRLane ConfigurationsTraffic Volume (vph) 100 350 230 110 390 190 220 1840 130 170 1220 40Future Volume (vph) 100 350 230 110 390 190 220 1840 130 170 1220 40Ideal Flow (vphpl) 1900 1900 1900 1900 1900 1900 1900 1900 1900 1900 1900 1900Total Lost time (s) 8.5 8.5 10.0 8.5 8.5 9.0 10.0 6.5 8.5 9.0 6.5 8.5Lane Util. Factor 1.00 0.95 1.00 1.00 0.95 1.00 0.97 0.95 1.00 0.97 0.95 1.00Frt 1.00 1.00 0.85 1.00 1.00 0.85 1.00 1.00 0.85 1.00 1.00 0.85Flt Protected 0.95 1.00 1.00 0.95 1.00 1.00 0.95 1.00 1.00 0.95 1.00 1.00Satd. Flow (prot) 1770 3539 1583 1770 3539 1583 3433 3539 1583 3433 3539 1583Flt Permitted 0.20 1.00 1.00 0.26 1.00 1.00 0.95 1.00 1.00 0.95 1.00 1.00Satd. Flow (perm) 372 3539 1583 480 3539 1583 3433 3539 1583 3433 3539 1583Peak-hour factor, PHF 1.00 1.00 1.00 1.00 1.00 1.00 1.00 1.00 1.00 1.00 1.00 1.00Adj. Flow (vph) 100 350 230 110 390 190 220 1840 130 170 1220 40RTOR Reduction (vph) 0 0 88 0 0 94 0 0 25 0 0 14Lane Group Flow (vph) 100 350 142 110 390 96 220 1840 105 170 1220 26Turn Type pm+pt NA pm+ov pm+pt NA pm+ov Prot NA pm+ov Prot NA pm+ovProtected Phases 3 8 1 7 4 5 1 6 7 5 2 3Permitted Phases 8 8 4 4 6 2Actuated Green, G (s) 38.3 24.4 41.4 38.9 24.7 37.7 17.0 125.9 140.1 13.0 120.9 134.8Effective Green, g (s) 38.3 24.4 41.4 38.9 24.7 37.7 17.0 125.9 140.1 13.0 120.9 134.8Actuated g/C Ratio 0.18 0.12 0.20 0.19 0.12 0.18 0.08 0.60 0.67 0.06 0.58 0.64Clearance Time (s) 8.5 8.5 10.0 8.5 8.5 9.0 10.0 6.5 8.5 9.0 6.5 8.5Vehicle Extension (s) 3.0 3.0 3.0 3.0 3.0 3.0 3.0 3.0 3.0 3.0 3.0 3.0Lane Grp Cap (vph) 160 411 312 176 416 284 277 2121 1056 212 2037 1016v/s Ratio Prot 0.04 0.10 0.04 c0.04 c0.11 0.02 0.06 c0.52 0.01 0.05 c0.34 0.00v/s Ratio Perm 0.07 0.05 0.07 0.04 0.06 0.01v/c Ratio 0.62 0.85 0.46 0.62 0.94 0.34 0.79 0.87 0.10 0.80 0.60 0.03Uniform Delay, d1 75.0 91.0 74.4 74.8 91.9 75.3 94.8 35.1 12.5 97.2 28.8 13.7Progression Factor 1.00 1.00 1.00 1.00 1.00 1.00 1.17 0.51 0.13 0.74 0.68 1.00Incremental Delay, d2 7.4 15.5 1.1 6.8 28.6 0.7 7.0 2.4 0.0 13.8 0.9 0.0Delay (s) 82.4 106.5 75.4 81.5 120.5 76.0 117.7 20.4 1.6 85.8 20.4 13.7Level of Service F F E F F E F C A F C BApproach Delay (s) 92.5 102.0 29.1 28.0Approach LOS F F C C
Intersection SummaryHCM 2000 Control Delay 47.5 HCM 2000 Level of Service DHCM 2000 Volume to Capacity ratio 0.86Actuated Cycle Length (s) 210.0 Sum of lost time (s) 33.5Intersection Capacity Utilization 101.4% ICU Level of Service GAnalysis Period (min) 15c Critical Lane Group
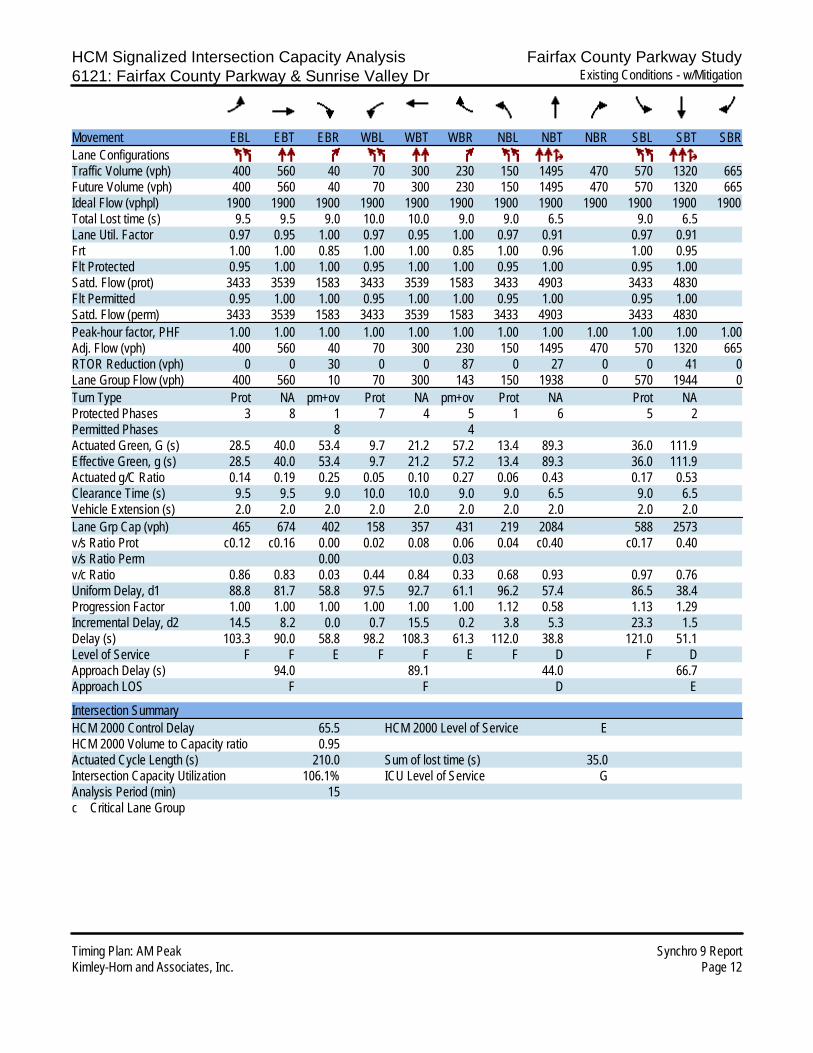
HCM Signalized Intersection Capacity Analysis Fairfax County Parkway Study6121: Fairfax County Parkway & Sunrise Valley Dr Existing Conditions - w/Mitigation
Timing Plan: AM Peak Synchro 9 ReportKimley-Horn and Associates, Inc. Page 12
Movement EBL EBT EBR WBL WBT WBR NBL NBT NBR SBL SBT SBRLane ConfigurationsTraffic Volume (vph) 400 560 40 70 300 230 150 1495 470 570 1320 665Future Volume (vph) 400 560 40 70 300 230 150 1495 470 570 1320 665Ideal Flow (vphpl) 1900 1900 1900 1900 1900 1900 1900 1900 1900 1900 1900 1900Total Lost time (s) 9.5 9.5 9.0 10.0 10.0 9.0 9.0 6.5 9.0 6.5Lane Util. Factor 0.97 0.95 1.00 0.97 0.95 1.00 0.97 0.91 0.97 0.91Frt 1.00 1.00 0.85 1.00 1.00 0.85 1.00 0.96 1.00 0.95Flt Protected 0.95 1.00 1.00 0.95 1.00 1.00 0.95 1.00 0.95 1.00Satd. Flow (prot) 3433 3539 1583 3433 3539 1583 3433 4903 3433 4830Flt Permitted 0.95 1.00 1.00 0.95 1.00 1.00 0.95 1.00 0.95 1.00Satd. Flow (perm) 3433 3539 1583 3433 3539 1583 3433 4903 3433 4830Peak-hour factor, PHF 1.00 1.00 1.00 1.00 1.00 1.00 1.00 1.00 1.00 1.00 1.00 1.00Adj. Flow (vph) 400 560 40 70 300 230 150 1495 470 570 1320 665RTOR Reduction (vph) 0 0 30 0 0 87 0 27 0 0 41 0Lane Group Flow (vph) 400 560 10 70 300 143 150 1938 0 570 1944 0Turn Type Prot NA pm+ov Prot NA pm+ov Prot NA Prot NAProtected Phases 3 8 1 7 4 5 1 6 5 2Permitted Phases 8 4Actuated Green, G (s) 28.5 40.0 53.4 9.7 21.2 57.2 13.4 89.3 36.0 111.9Effective Green, g (s) 28.5 40.0 53.4 9.7 21.2 57.2 13.4 89.3 36.0 111.9Actuated g/C Ratio 0.14 0.19 0.25 0.05 0.10 0.27 0.06 0.43 0.17 0.53Clearance Time (s) 9.5 9.5 9.0 10.0 10.0 9.0 9.0 6.5 9.0 6.5Vehicle Extension (s) 2.0 2.0 2.0 2.0 2.0 2.0 2.0 2.0 2.0 2.0Lane Grp Cap (vph) 465 674 402 158 357 431 219 2084 588 2573v/s Ratio Prot c0.12 c0.16 0.00 0.02 0.08 0.06 0.04 c0.40 c0.17 0.40v/s Ratio Perm 0.00 0.03v/c Ratio 0.86 0.83 0.03 0.44 0.84 0.33 0.68 0.93 0.97 0.76Uniform Delay, d1 88.8 81.7 58.8 97.5 92.7 61.1 96.2 57.4 86.5 38.4Progression Factor 1.00 1.00 1.00 1.00 1.00 1.00 1.12 0.58 1.13 1.29Incremental Delay, d2 14.5 8.2 0.0 0.7 15.5 0.2 3.8 5.3 23.3 1.5Delay (s) 103.3 90.0 58.8 98.2 108.3 61.3 112.0 38.8 121.0 51.1Level of Service F F E F F E F D F DApproach Delay (s) 94.0 89.1 44.0 66.7Approach LOS F F D E
Intersection SummaryHCM 2000 Control Delay 65.5 HCM 2000 Level of Service EHCM 2000 Volume to Capacity ratio 0.95Actuated Cycle Length (s) 210.0 Sum of lost time (s) 35.0Intersection Capacity Utilization 106.1% ICU Level of Service GAnalysis Period (min) 15c Critical Lane Group
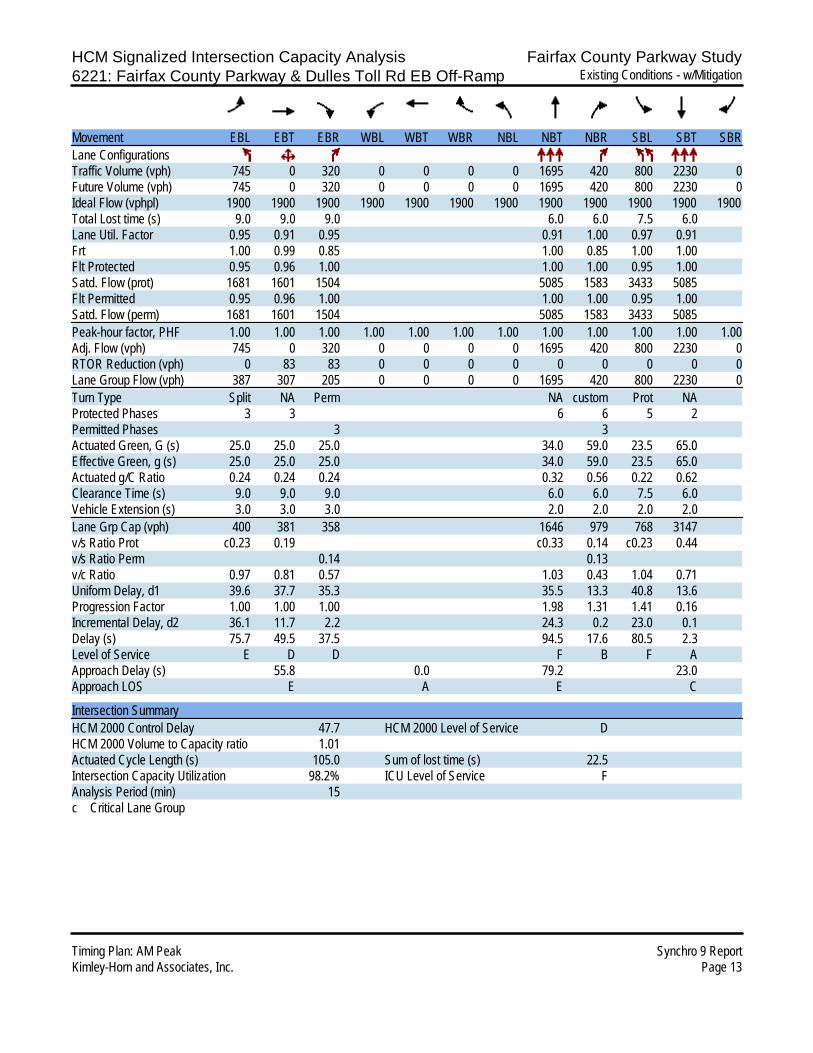
HCM Signalized Intersection Capacity Analysis Fairfax County Parkway Study6221: Fairfax County Parkway & Dulles Toll Rd EB Off-Ramp Existing Conditions - w/Mitigation
Timing Plan: AM Peak Synchro 9 ReportKimley-Horn and Associates, Inc. Page 13
Movement EBL EBT EBR WBL WBT WBR NBL NBT NBR SBL SBT SBRLane ConfigurationsTraffic Volume (vph) 745 0 320 0 0 0 0 1695 420 800 2230 0Future Volume (vph) 745 0 320 0 0 0 0 1695 420 800 2230 0Ideal Flow (vphpl) 1900 1900 1900 1900 1900 1900 1900 1900 1900 1900 1900 1900Total Lost time (s) 9.0 9.0 9.0 6.0 6.0 7.5 6.0Lane Util. Factor 0.95 0.91 0.95 0.91 1.00 0.97 0.91Frt 1.00 0.99 0.85 1.00 0.85 1.00 1.00Flt Protected 0.95 0.96 1.00 1.00 1.00 0.95 1.00Satd. Flow (prot) 1681 1601 1504 5085 1583 3433 5085Flt Permitted 0.95 0.96 1.00 1.00 1.00 0.95 1.00Satd. Flow (perm) 1681 1601 1504 5085 1583 3433 5085Peak-hour factor, PHF 1.00 1.00 1.00 1.00 1.00 1.00 1.00 1.00 1.00 1.00 1.00 1.00Adj. Flow (vph) 745 0 320 0 0 0 0 1695 420 800 2230 0RTOR Reduction (vph) 0 83 83 0 0 0 0 0 0 0 0 0Lane Group Flow (vph) 387 307 205 0 0 0 0 1695 420 800 2230 0Turn Type Split NA Perm NA custom Prot NAProtected Phases 3 3 6 6 5 2Permitted Phases 3 3Actuated Green, G (s) 25.0 25.0 25.0 34.0 59.0 23.5 65.0Effective Green, g (s) 25.0 25.0 25.0 34.0 59.0 23.5 65.0Actuated g/C Ratio 0.24 0.24 0.24 0.32 0.56 0.22 0.62Clearance Time (s) 9.0 9.0 9.0 6.0 6.0 7.5 6.0Vehicle Extension (s) 3.0 3.0 3.0 2.0 2.0 2.0 2.0Lane Grp Cap (vph) 400 381 358 1646 979 768 3147v/s Ratio Prot c0.23 0.19 c0.33 0.14 c0.23 0.44v/s Ratio Perm 0.14 0.13v/c Ratio 0.97 0.81 0.57 1.03 0.43 1.04 0.71Uniform Delay, d1 39.6 37.7 35.3 35.5 13.3 40.8 13.6Progression Factor 1.00 1.00 1.00 1.98 1.31 1.41 0.16Incremental Delay, d2 36.1 11.7 2.2 24.3 0.2 23.0 0.1Delay (s) 75.7 49.5 37.5 94.5 17.6 80.5 2.3Level of Service E D D F B F AApproach Delay (s) 55.8 0.0 79.2 23.0Approach LOS E A E C
Intersection SummaryHCM 2000 Control Delay 47.7 HCM 2000 Level of Service DHCM 2000 Volume to Capacity ratio 1.01Actuated Cycle Length (s) 105.0 Sum of lost time (s) 22.5Intersection Capacity Utilization 98.2% ICU Level of Service FAnalysis Period (min) 15c Critical Lane Group
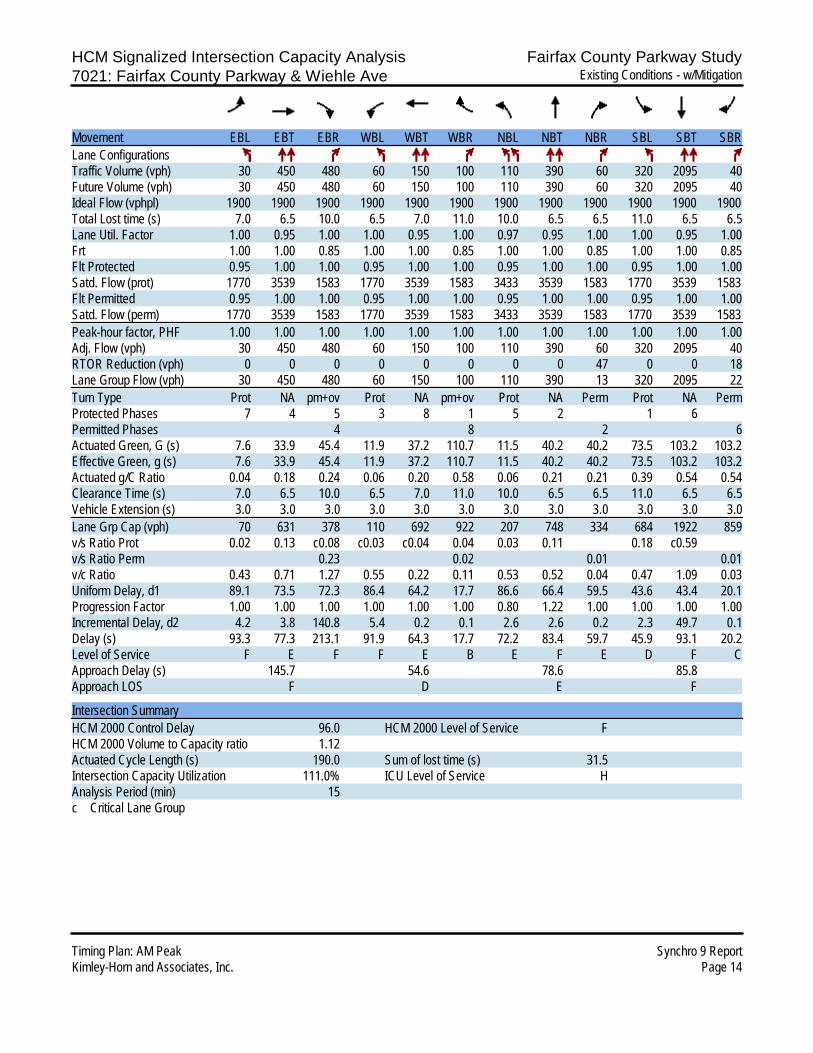
HCM Signalized Intersection Capacity Analysis Fairfax County Parkway Study7021: Fairfax County Parkway & Wiehle Ave Existing Conditions - w/Mitigation
Timing Plan: AM Peak Synchro 9 ReportKimley-Horn and Associates, Inc. Page 14
Movement EBL EBT EBR WBL WBT WBR NBL NBT NBR SBL SBT SBRLane ConfigurationsTraffic Volume (vph) 30 450 480 60 150 100 110 390 60 320 2095 40Future Volume (vph) 30 450 480 60 150 100 110 390 60 320 2095 40Ideal Flow (vphpl) 1900 1900 1900 1900 1900 1900 1900 1900 1900 1900 1900 1900Total Lost time (s) 7.0 6.5 10.0 6.5 7.0 11.0 10.0 6.5 6.5 11.0 6.5 6.5Lane Util. Factor 1.00 0.95 1.00 1.00 0.95 1.00 0.97 0.95 1.00 1.00 0.95 1.00Frt 1.00 1.00 0.85 1.00 1.00 0.85 1.00 1.00 0.85 1.00 1.00 0.85Flt Protected 0.95 1.00 1.00 0.95 1.00 1.00 0.95 1.00 1.00 0.95 1.00 1.00Satd. Flow (prot) 1770 3539 1583 1770 3539 1583 3433 3539 1583 1770 3539 1583Flt Permitted 0.95 1.00 1.00 0.95 1.00 1.00 0.95 1.00 1.00 0.95 1.00 1.00Satd. Flow (perm) 1770 3539 1583 1770 3539 1583 3433 3539 1583 1770 3539 1583Peak-hour factor, PHF 1.00 1.00 1.00 1.00 1.00 1.00 1.00 1.00 1.00 1.00 1.00 1.00Adj. Flow (vph) 30 450 480 60 150 100 110 390 60 320 2095 40RTOR Reduction (vph) 0 0 0 0 0 0 0 0 47 0 0 18Lane Group Flow (vph) 30 450 480 60 150 100 110 390 13 320 2095 22Turn Type Prot NA pm+ov Prot NA pm+ov Prot NA Perm Prot NA PermProtected Phases 7 4 5 3 8 1 5 2 1 6Permitted Phases 4 8 2 6Actuated Green, G (s) 7.6 33.9 45.4 11.9 37.2 110.7 11.5 40.2 40.2 73.5 103.2 103.2Effective Green, g (s) 7.6 33.9 45.4 11.9 37.2 110.7 11.5 40.2 40.2 73.5 103.2 103.2Actuated g/C Ratio 0.04 0.18 0.24 0.06 0.20 0.58 0.06 0.21 0.21 0.39 0.54 0.54Clearance Time (s) 7.0 6.5 10.0 6.5 7.0 11.0 10.0 6.5 6.5 11.0 6.5 6.5Vehicle Extension (s) 3.0 3.0 3.0 3.0 3.0 3.0 3.0 3.0 3.0 3.0 3.0 3.0Lane Grp Cap (vph) 70 631 378 110 692 922 207 748 334 684 1922 859v/s Ratio Prot 0.02 0.13 c0.08 c0.03 c0.04 0.04 0.03 0.11 0.18 c0.59v/s Ratio Perm 0.23 0.02 0.01 0.01v/c Ratio 0.43 0.71 1.27 0.55 0.22 0.11 0.53 0.52 0.04 0.47 1.09 0.03Uniform Delay, d1 89.1 73.5 72.3 86.4 64.2 17.7 86.6 66.4 59.5 43.6 43.4 20.1Progression Factor 1.00 1.00 1.00 1.00 1.00 1.00 0.80 1.22 1.00 1.00 1.00 1.00Incremental Delay, d2 4.2 3.8 140.8 5.4 0.2 0.1 2.6 2.6 0.2 2.3 49.7 0.1Delay (s) 93.3 77.3 213.1 91.9 64.3 17.7 72.2 83.4 59.7 45.9 93.1 20.2Level of Service F E F F E B E F E D F CApproach Delay (s) 145.7 54.6 78.6 85.8Approach LOS F D E F
Intersection SummaryHCM 2000 Control Delay 96.0 HCM 2000 Level of Service FHCM 2000 Volume to Capacity ratio 1.12Actuated Cycle Length (s) 190.0 Sum of lost time (s) 31.5Intersection Capacity Utilization 111.0% ICU Level of Service HAnalysis Period (min) 15c Critical Lane Group
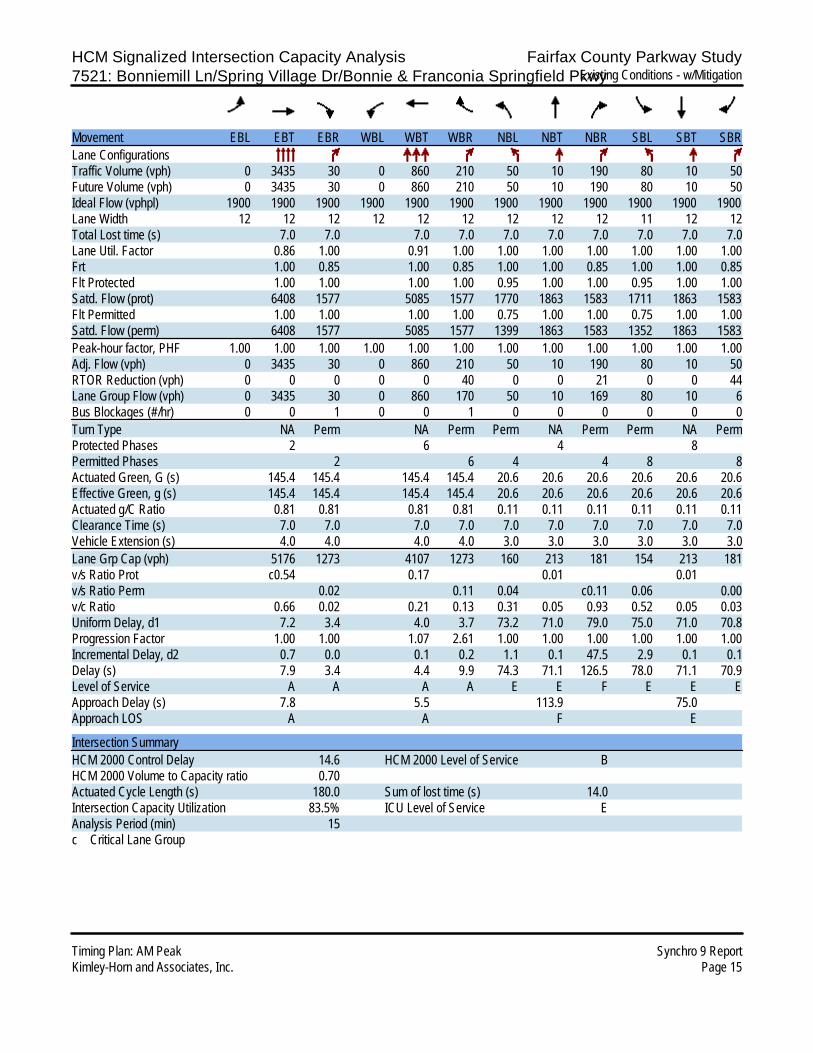
HCM Signalized Intersection Capacity Analysis Fairfax County Parkway Study7521: Bonniemill Ln/Spring Village Dr/Bonnie & Franconia Springfield PkwyExisting Conditions - w/Mitigation
Timing Plan: AM Peak Synchro 9 ReportKimley-Horn and Associates, Inc. Page 15
Movement EBL EBT EBR WBL WBT WBR NBL NBT NBR SBL SBT SBRLane ConfigurationsTraffic Volume (vph) 0 3435 30 0 860 210 50 10 190 80 10 50Future Volume (vph) 0 3435 30 0 860 210 50 10 190 80 10 50Ideal Flow (vphpl) 1900 1900 1900 1900 1900 1900 1900 1900 1900 1900 1900 1900Lane Width 12 12 12 12 12 12 12 12 12 11 12 12Total Lost time (s) 7.0 7.0 7.0 7.0 7.0 7.0 7.0 7.0 7.0 7.0Lane Util. Factor 0.86 1.00 0.91 1.00 1.00 1.00 1.00 1.00 1.00 1.00Frt 1.00 0.85 1.00 0.85 1.00 1.00 0.85 1.00 1.00 0.85Flt Protected 1.00 1.00 1.00 1.00 0.95 1.00 1.00 0.95 1.00 1.00Satd. Flow (prot) 6408 1577 5085 1577 1770 1863 1583 1711 1863 1583Flt Permitted 1.00 1.00 1.00 1.00 0.75 1.00 1.00 0.75 1.00 1.00Satd. Flow (perm) 6408 1577 5085 1577 1399 1863 1583 1352 1863 1583Peak-hour factor, PHF 1.00 1.00 1.00 1.00 1.00 1.00 1.00 1.00 1.00 1.00 1.00 1.00Adj. Flow (vph) 0 3435 30 0 860 210 50 10 190 80 10 50RTOR Reduction (vph) 0 0 0 0 0 40 0 0 21 0 0 44Lane Group Flow (vph) 0 3435 30 0 860 170 50 10 169 80 10 6Bus Blockages (#/hr) 0 0 1 0 0 1 0 0 0 0 0 0Turn Type NA Perm NA Perm Perm NA Perm Perm NA PermProtected Phases 2 6 4 8Permitted Phases 2 6 4 4 8 8Actuated Green, G (s) 145.4 145.4 145.4 145.4 20.6 20.6 20.6 20.6 20.6 20.6Effective Green, g (s) 145.4 145.4 145.4 145.4 20.6 20.6 20.6 20.6 20.6 20.6Actuated g/C Ratio 0.81 0.81 0.81 0.81 0.11 0.11 0.11 0.11 0.11 0.11Clearance Time (s) 7.0 7.0 7.0 7.0 7.0 7.0 7.0 7.0 7.0 7.0Vehicle Extension (s) 4.0 4.0 4.0 4.0 3.0 3.0 3.0 3.0 3.0 3.0Lane Grp Cap (vph) 5176 1273 4107 1273 160 213 181 154 213 181v/s Ratio Prot c0.54 0.17 0.01 0.01v/s Ratio Perm 0.02 0.11 0.04 c0.11 0.06 0.00v/c Ratio 0.66 0.02 0.21 0.13 0.31 0.05 0.93 0.52 0.05 0.03Uniform Delay, d1 7.2 3.4 4.0 3.7 73.2 71.0 79.0 75.0 71.0 70.8Progression Factor 1.00 1.00 1.07 2.61 1.00 1.00 1.00 1.00 1.00 1.00Incremental Delay, d2 0.7 0.0 0.1 0.2 1.1 0.1 47.5 2.9 0.1 0.1Delay (s) 7.9 3.4 4.4 9.9 74.3 71.1 126.5 78.0 71.1 70.9Level of Service A A A A E E F E E EApproach Delay (s) 7.8 5.5 113.9 75.0Approach LOS A A F E
Intersection SummaryHCM 2000 Control Delay 14.6 HCM 2000 Level of Service BHCM 2000 Volume to Capacity ratio 0.70Actuated Cycle Length (s) 180.0 Sum of lost time (s) 14.0Intersection Capacity Utilization 83.5% ICU Level of Service EAnalysis Period (min) 15c Critical Lane Group
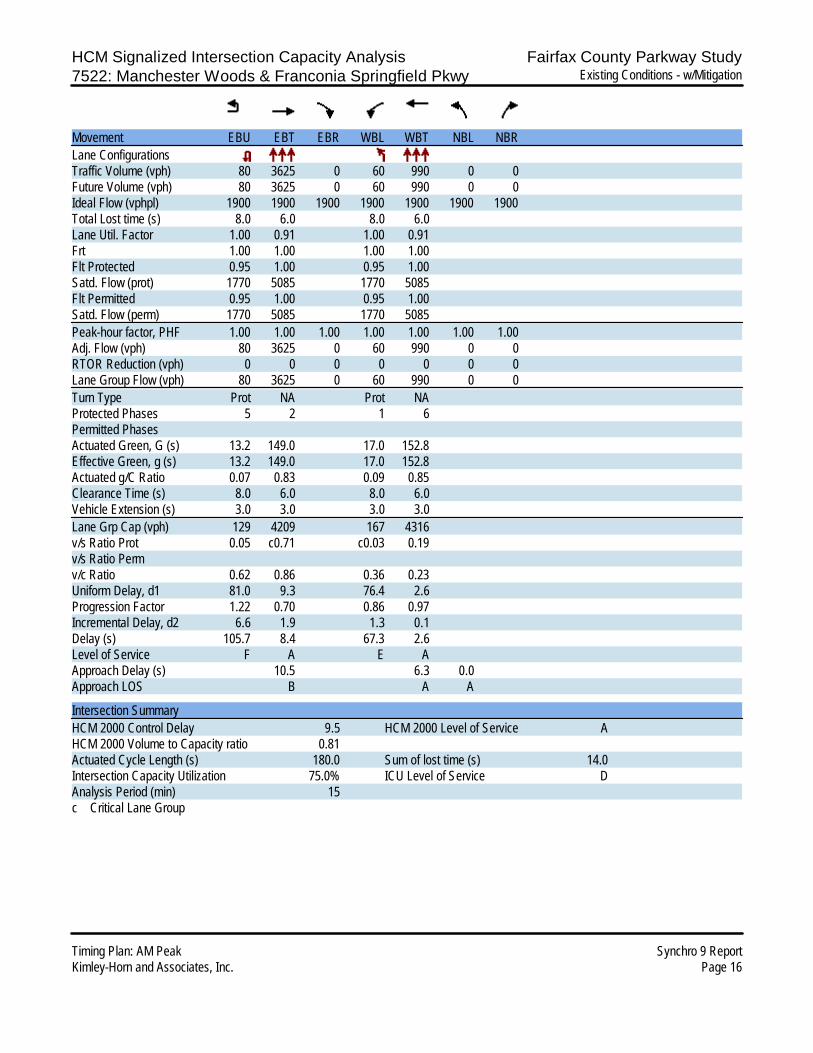
HCM Signalized Intersection Capacity Analysis Fairfax County Parkway Study7522: Manchester Woods & Franconia Springfield Pkwy Existing Conditions - w/Mitigation
Timing Plan: AM Peak Synchro 9 ReportKimley-Horn and Associates, Inc. Page 16
Movement EBU EBT EBR WBL WBT NBL NBRLane ConfigurationsTraffic Volume (vph) 80 3625 0 60 990 0 0Future Volume (vph) 80 3625 0 60 990 0 0Ideal Flow (vphpl) 1900 1900 1900 1900 1900 1900 1900Total Lost time (s) 8.0 6.0 8.0 6.0Lane Util. Factor 1.00 0.91 1.00 0.91Frt 1.00 1.00 1.00 1.00Flt Protected 0.95 1.00 0.95 1.00Satd. Flow (prot) 1770 5085 1770 5085Flt Permitted 0.95 1.00 0.95 1.00Satd. Flow (perm) 1770 5085 1770 5085Peak-hour factor, PHF 1.00 1.00 1.00 1.00 1.00 1.00 1.00Adj. Flow (vph) 80 3625 0 60 990 0 0RTOR Reduction (vph) 0 0 0 0 0 0 0Lane Group Flow (vph) 80 3625 0 60 990 0 0Turn Type Prot NA Prot NAProtected Phases 5 2 1 6Permitted PhasesActuated Green, G (s) 13.2 149.0 17.0 152.8Effective Green, g (s) 13.2 149.0 17.0 152.8Actuated g/C Ratio 0.07 0.83 0.09 0.85Clearance Time (s) 8.0 6.0 8.0 6.0Vehicle Extension (s) 3.0 3.0 3.0 3.0Lane Grp Cap (vph) 129 4209 167 4316v/s Ratio Prot 0.05 c0.71 c0.03 0.19v/s Ratio Permv/c Ratio 0.62 0.86 0.36 0.23Uniform Delay, d1 81.0 9.3 76.4 2.6Progression Factor 1.22 0.70 0.86 0.97Incremental Delay, d2 6.6 1.9 1.3 0.1Delay (s) 105.7 8.4 67.3 2.6Level of Service F A E AApproach Delay (s) 10.5 6.3 0.0Approach LOS B A A
Intersection SummaryHCM 2000 Control Delay 9.5 HCM 2000 Level of Service AHCM 2000 Volume to Capacity ratio 0.81Actuated Cycle Length (s) 180.0 Sum of lost time (s) 14.0Intersection Capacity Utilization 75.0% ICU Level of Service DAnalysis Period (min) 15c Critical Lane Group
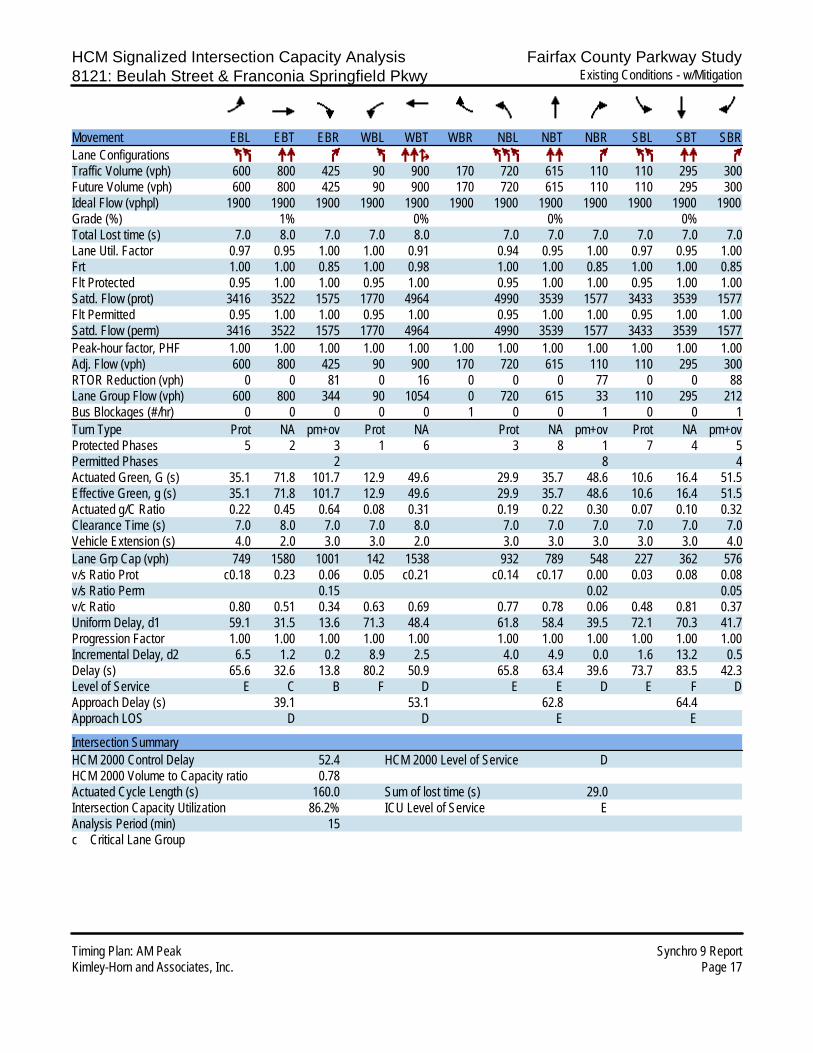
HCM Signalized Intersection Capacity Analysis Fairfax County Parkway Study8121: Beulah Street & Franconia Springfield Pkwy Existing Conditions - w/Mitigation
Timing Plan: AM Peak Synchro 9 ReportKimley-Horn and Associates, Inc. Page 17
Movement EBL EBT EBR WBL WBT WBR NBL NBT NBR SBL SBT SBRLane ConfigurationsTraffic Volume (vph) 600 800 425 90 900 170 720 615 110 110 295 300Future Volume (vph) 600 800 425 90 900 170 720 615 110 110 295 300Ideal Flow (vphpl) 1900 1900 1900 1900 1900 1900 1900 1900 1900 1900 1900 1900Grade (%) 1% 0% 0% 0%Total Lost time (s) 7.0 8.0 7.0 7.0 8.0 7.0 7.0 7.0 7.0 7.0 7.0Lane Util. Factor 0.97 0.95 1.00 1.00 0.91 0.94 0.95 1.00 0.97 0.95 1.00Frt 1.00 1.00 0.85 1.00 0.98 1.00 1.00 0.85 1.00 1.00 0.85Flt Protected 0.95 1.00 1.00 0.95 1.00 0.95 1.00 1.00 0.95 1.00 1.00Satd. Flow (prot) 3416 3522 1575 1770 4964 4990 3539 1577 3433 3539 1577Flt Permitted 0.95 1.00 1.00 0.95 1.00 0.95 1.00 1.00 0.95 1.00 1.00Satd. Flow (perm) 3416 3522 1575 1770 4964 4990 3539 1577 3433 3539 1577Peak-hour factor, PHF 1.00 1.00 1.00 1.00 1.00 1.00 1.00 1.00 1.00 1.00 1.00 1.00Adj. Flow (vph) 600 800 425 90 900 170 720 615 110 110 295 300RTOR Reduction (vph) 0 0 81 0 16 0 0 0 77 0 0 88Lane Group Flow (vph) 600 800 344 90 1054 0 720 615 33 110 295 212Bus Blockages (#/hr) 0 0 0 0 0 1 0 0 1 0 0 1Turn Type Prot NA pm+ov Prot NA Prot NA pm+ov Prot NA pm+ovProtected Phases 5 2 3 1 6 3 8 1 7 4 5Permitted Phases 2 8 4Actuated Green, G (s) 35.1 71.8 101.7 12.9 49.6 29.9 35.7 48.6 10.6 16.4 51.5Effective Green, g (s) 35.1 71.8 101.7 12.9 49.6 29.9 35.7 48.6 10.6 16.4 51.5Actuated g/C Ratio 0.22 0.45 0.64 0.08 0.31 0.19 0.22 0.30 0.07 0.10 0.32Clearance Time (s) 7.0 8.0 7.0 7.0 8.0 7.0 7.0 7.0 7.0 7.0 7.0Vehicle Extension (s) 4.0 2.0 3.0 3.0 2.0 3.0 3.0 3.0 3.0 3.0 4.0Lane Grp Cap (vph) 749 1580 1001 142 1538 932 789 548 227 362 576v/s Ratio Prot c0.18 0.23 0.06 0.05 c0.21 c0.14 c0.17 0.00 0.03 0.08 0.08v/s Ratio Perm 0.15 0.02 0.05v/c Ratio 0.80 0.51 0.34 0.63 0.69 0.77 0.78 0.06 0.48 0.81 0.37Uniform Delay, d1 59.1 31.5 13.6 71.3 48.4 61.8 58.4 39.5 72.1 70.3 41.7Progression Factor 1.00 1.00 1.00 1.00 1.00 1.00 1.00 1.00 1.00 1.00 1.00Incremental Delay, d2 6.5 1.2 0.2 8.9 2.5 4.0 4.9 0.0 1.6 13.2 0.5Delay (s) 65.6 32.6 13.8 80.2 50.9 65.8 63.4 39.6 73.7 83.5 42.3Level of Service E C B F D E E D E F DApproach Delay (s) 39.1 53.1 62.8 64.4Approach LOS D D E E
Intersection SummaryHCM 2000 Control Delay 52.4 HCM 2000 Level of Service DHCM 2000 Volume to Capacity ratio 0.78Actuated Cycle Length (s) 160.0 Sum of lost time (s) 29.0Intersection Capacity Utilization 86.2% ICU Level of Service EAnalysis Period (min) 15c Critical Lane Group
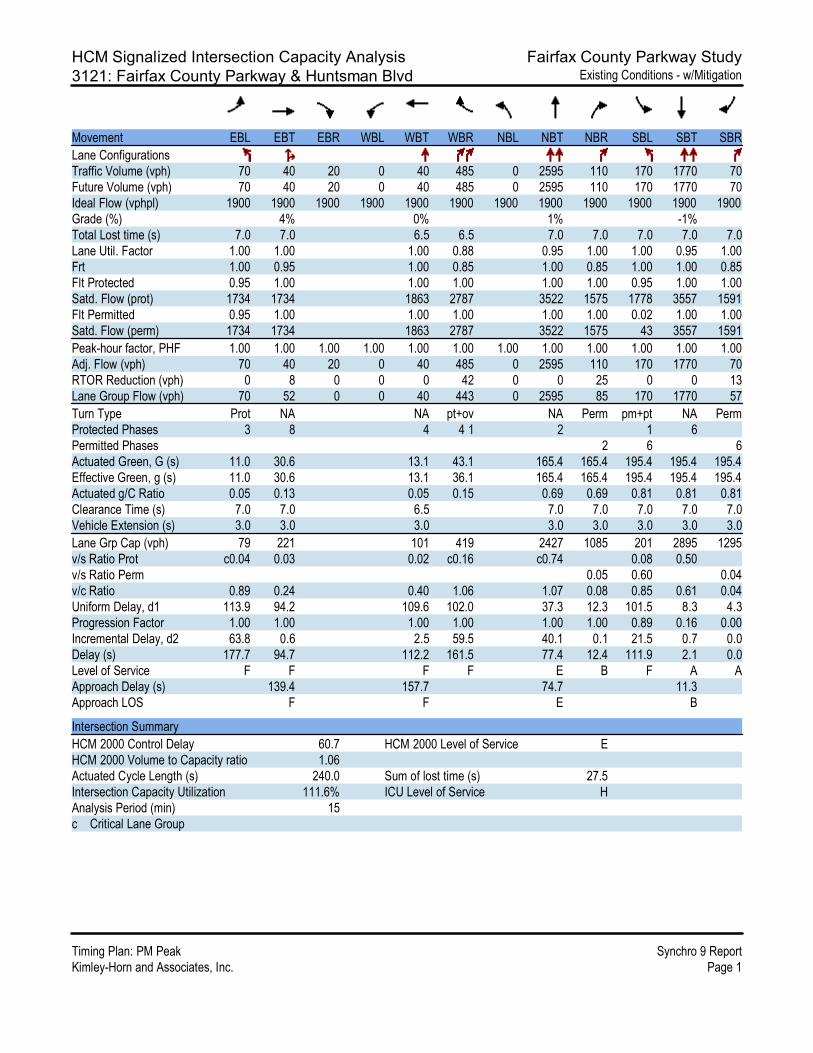
HCM Signalized Intersection Capacity Analysis Fairfax County Parkway Study3121: Fairfax County Parkway & Huntsman Blvd Existing Conditions - w/Mitigation
Timing Plan: PM Peak Synchro 9 ReportKimley-Horn and Associates, Inc. Page 1
Movement EBL EBT EBR WBL WBT WBR NBL NBT NBR SBL SBT SBRLane ConfigurationsTraffic Volume (vph) 70 40 20 0 40 485 0 2595 110 170 1770 70Future Volume (vph) 70 40 20 0 40 485 0 2595 110 170 1770 70Ideal Flow (vphpl) 1900 1900 1900 1900 1900 1900 1900 1900 1900 1900 1900 1900Grade (%) 4% 0% 1% -1%Total Lost time (s) 7.0 7.0 6.5 6.5 7.0 7.0 7.0 7.0 7.0Lane Util. Factor 1.00 1.00 1.00 0.88 0.95 1.00 1.00 0.95 1.00Frt 1.00 0.95 1.00 0.85 1.00 0.85 1.00 1.00 0.85Flt Protected 0.95 1.00 1.00 1.00 1.00 1.00 0.95 1.00 1.00Satd. Flow (prot) 1734 1734 1863 2787 3522 1575 1778 3557 1591Flt Permitted 0.95 1.00 1.00 1.00 1.00 1.00 0.02 1.00 1.00Satd. Flow (perm) 1734 1734 1863 2787 3522 1575 43 3557 1591Peak-hour factor, PHF 1.00 1.00 1.00 1.00 1.00 1.00 1.00 1.00 1.00 1.00 1.00 1.00Adj. Flow (vph) 70 40 20 0 40 485 0 2595 110 170 1770 70RTOR Reduction (vph) 0 8 0 0 0 42 0 0 25 0 0 13Lane Group Flow (vph) 70 52 0 0 40 443 0 2595 85 170 1770 57Turn Type Prot NA NA pt+ov NA Perm pm+pt NA PermProtected Phases 3 8 4 4 1 2 1 6Permitted Phases 2 6 6Actuated Green, G (s) 11.0 30.6 13.1 43.1 165.4 165.4 195.4 195.4 195.4Effective Green, g (s) 11.0 30.6 13.1 36.1 165.4 165.4 195.4 195.4 195.4Actuated g/C Ratio 0.05 0.13 0.05 0.15 0.69 0.69 0.81 0.81 0.81Clearance Time (s) 7.0 7.0 6.5 7.0 7.0 7.0 7.0 7.0Vehicle Extension (s) 3.0 3.0 3.0 3.0 3.0 3.0 3.0 3.0Lane Grp Cap (vph) 79 221 101 419 2427 1085 201 2895 1295v/s Ratio Prot c0.04 0.03 0.02 c0.16 c0.74 0.08 0.50v/s Ratio Perm 0.05 0.60 0.04v/c Ratio 0.89 0.24 0.40 1.06 1.07 0.08 0.85 0.61 0.04Uniform Delay, d1 113.9 94.2 109.6 102.0 37.3 12.3 101.5 8.3 4.3Progression Factor 1.00 1.00 1.00 1.00 1.00 1.00 0.89 0.16 0.00Incremental Delay, d2 63.8 0.6 2.5 59.5 40.1 0.1 21.5 0.7 0.0Delay (s) 177.7 94.7 112.2 161.5 77.4 12.4 111.9 2.1 0.0Level of Service F F F F E B F A AApproach Delay (s) 139.4 157.7 74.7 11.3Approach LOS F F E B
Intersection SummaryHCM 2000 Control Delay 60.7 HCM 2000 Level of Service EHCM 2000 Volume to Capacity ratio 1.06Actuated Cycle Length (s) 240.0 Sum of lost time (s) 27.5Intersection Capacity Utilization 111.6% ICU Level of Service HAnalysis Period (min) 15c Critical Lane Group
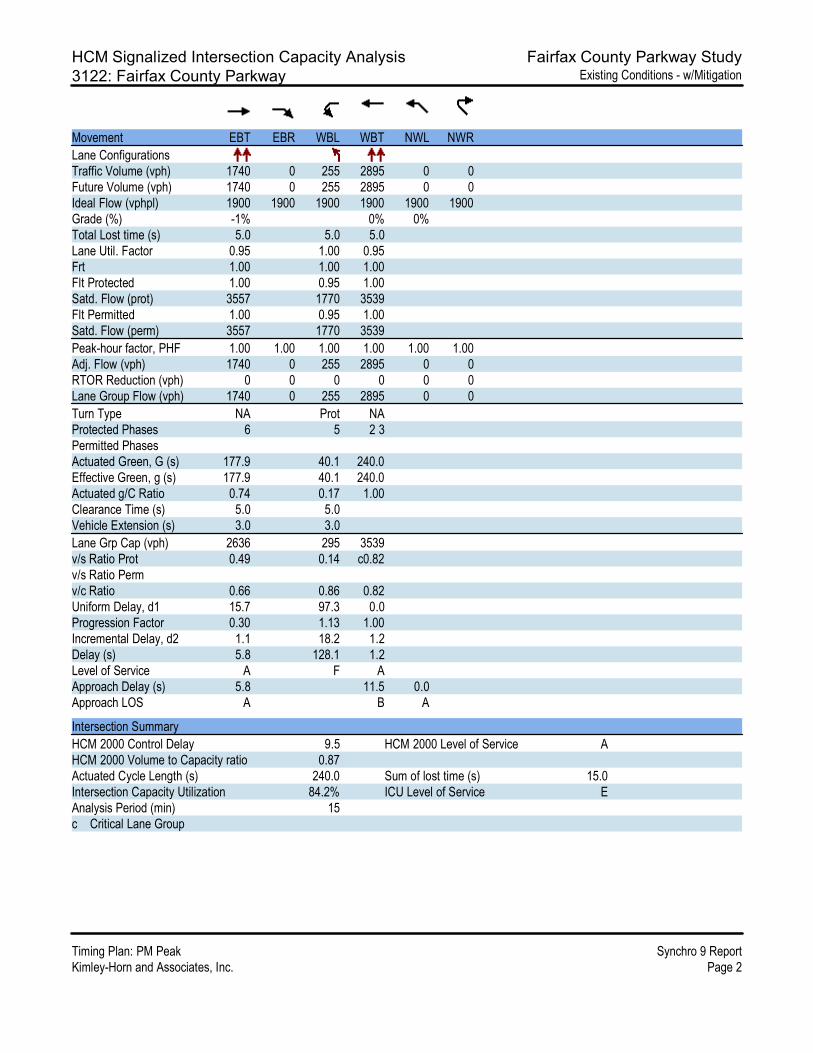
HCM Signalized Intersection Capacity Analysis Fairfax County Parkway Study3122: Fairfax County Parkway Existing Conditions - w/Mitigation
Timing Plan: PM Peak Synchro 9 ReportKimley-Horn and Associates, Inc. Page 2
Movement EBT EBR WBL WBT NWL NWRLane ConfigurationsTraffic Volume (vph) 1740 0 255 2895 0 0Future Volume (vph) 1740 0 255 2895 0 0Ideal Flow (vphpl) 1900 1900 1900 1900 1900 1900Grade (%) -1% 0% 0%Total Lost time (s) 5.0 5.0 5.0Lane Util. Factor 0.95 1.00 0.95Frt 1.00 1.00 1.00Flt Protected 1.00 0.95 1.00Satd. Flow (prot) 3557 1770 3539Flt Permitted 1.00 0.95 1.00Satd. Flow (perm) 3557 1770 3539Peak-hour factor, PHF 1.00 1.00 1.00 1.00 1.00 1.00Adj. Flow (vph) 1740 0 255 2895 0 0RTOR Reduction (vph) 0 0 0 0 0 0Lane Group Flow (vph) 1740 0 255 2895 0 0Turn Type NA Prot NAProtected Phases 6 5 2 3Permitted PhasesActuated Green, G (s) 177.9 40.1 240.0Effective Green, g (s) 177.9 40.1 240.0Actuated g/C Ratio 0.74 0.17 1.00Clearance Time (s) 5.0 5.0Vehicle Extension (s) 3.0 3.0Lane Grp Cap (vph) 2636 295 3539v/s Ratio Prot 0.49 0.14 c0.82v/s Ratio Permv/c Ratio 0.66 0.86 0.82Uniform Delay, d1 15.7 97.3 0.0Progression Factor 0.30 1.13 1.00Incremental Delay, d2 1.1 18.2 1.2Delay (s) 5.8 128.1 1.2Level of Service A F AApproach Delay (s) 5.8 11.5 0.0Approach LOS A B A
Intersection SummaryHCM 2000 Control Delay 9.5 HCM 2000 Level of Service AHCM 2000 Volume to Capacity ratio 0.87Actuated Cycle Length (s) 240.0 Sum of lost time (s) 15.0Intersection Capacity Utilization 84.2% ICU Level of Service EAnalysis Period (min) 15c Critical Lane Group
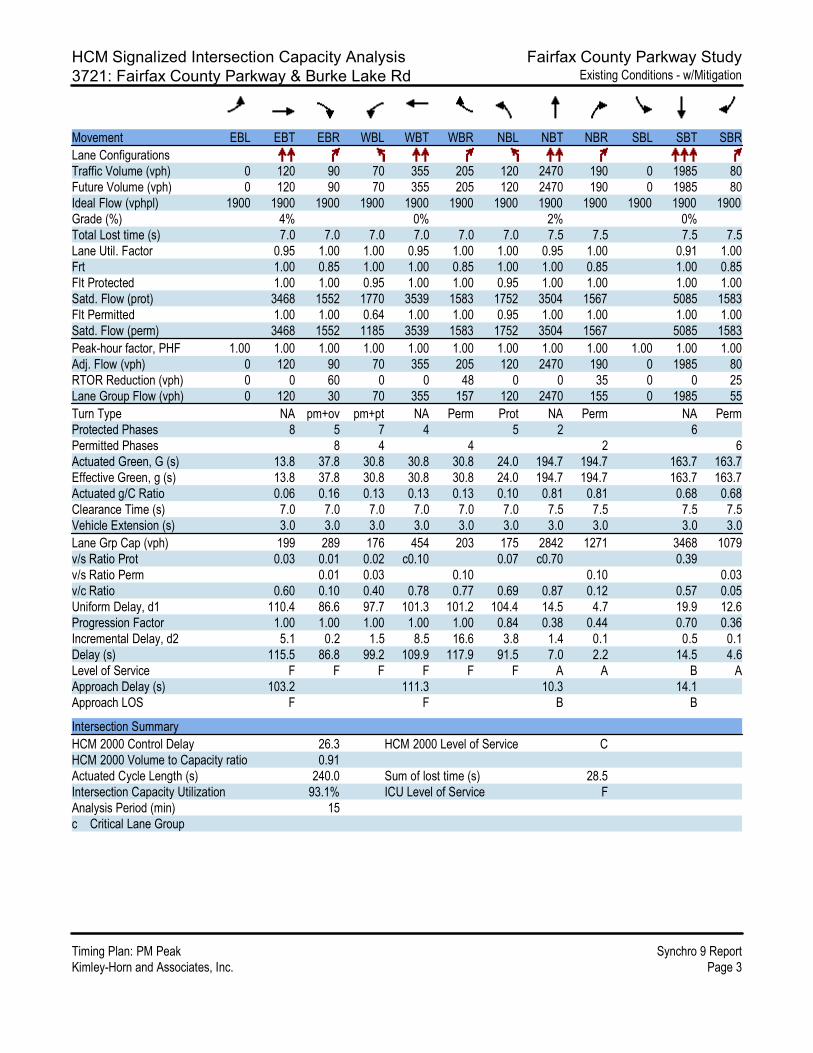
HCM Signalized Intersection Capacity Analysis Fairfax County Parkway Study3721: Fairfax County Parkway & Burke Lake Rd Existing Conditions - w/Mitigation
Timing Plan: PM Peak Synchro 9 ReportKimley-Horn and Associates, Inc. Page 3
Movement EBL EBT EBR WBL WBT WBR NBL NBT NBR SBL SBT SBRLane ConfigurationsTraffic Volume (vph) 0 120 90 70 355 205 120 2470 190 0 1985 80Future Volume (vph) 0 120 90 70 355 205 120 2470 190 0 1985 80Ideal Flow (vphpl) 1900 1900 1900 1900 1900 1900 1900 1900 1900 1900 1900 1900Grade (%) 4% 0% 2% 0%Total Lost time (s) 7.0 7.0 7.0 7.0 7.0 7.0 7.5 7.5 7.5 7.5Lane Util. Factor 0.95 1.00 1.00 0.95 1.00 1.00 0.95 1.00 0.91 1.00Frt 1.00 0.85 1.00 1.00 0.85 1.00 1.00 0.85 1.00 0.85Flt Protected 1.00 1.00 0.95 1.00 1.00 0.95 1.00 1.00 1.00 1.00Satd. Flow (prot) 3468 1552 1770 3539 1583 1752 3504 1567 5085 1583Flt Permitted 1.00 1.00 0.64 1.00 1.00 0.95 1.00 1.00 1.00 1.00Satd. Flow (perm) 3468 1552 1185 3539 1583 1752 3504 1567 5085 1583Peak-hour factor, PHF 1.00 1.00 1.00 1.00 1.00 1.00 1.00 1.00 1.00 1.00 1.00 1.00Adj. Flow (vph) 0 120 90 70 355 205 120 2470 190 0 1985 80RTOR Reduction (vph) 0 0 60 0 0 48 0 0 35 0 0 25Lane Group Flow (vph) 0 120 30 70 355 157 120 2470 155 0 1985 55Turn Type NA pm+ov pm+pt NA Perm Prot NA Perm NA PermProtected Phases 8 5 7 4 5 2 6Permitted Phases 8 4 4 2 6Actuated Green, G (s) 13.8 37.8 30.8 30.8 30.8 24.0 194.7 194.7 163.7 163.7Effective Green, g (s) 13.8 37.8 30.8 30.8 30.8 24.0 194.7 194.7 163.7 163.7Actuated g/C Ratio 0.06 0.16 0.13 0.13 0.13 0.10 0.81 0.81 0.68 0.68Clearance Time (s) 7.0 7.0 7.0 7.0 7.0 7.0 7.5 7.5 7.5 7.5Vehicle Extension (s) 3.0 3.0 3.0 3.0 3.0 3.0 3.0 3.0 3.0 3.0Lane Grp Cap (vph) 199 289 176 454 203 175 2842 1271 3468 1079v/s Ratio Prot 0.03 0.01 0.02 c0.10 0.07 c0.70 0.39v/s Ratio Perm 0.01 0.03 0.10 0.10 0.03v/c Ratio 0.60 0.10 0.40 0.78 0.77 0.69 0.87 0.12 0.57 0.05Uniform Delay, d1 110.4 86.6 97.7 101.3 101.2 104.4 14.5 4.7 19.9 12.6Progression Factor 1.00 1.00 1.00 1.00 1.00 0.84 0.38 0.44 0.70 0.36Incremental Delay, d2 5.1 0.2 1.5 8.5 16.6 3.8 1.4 0.1 0.5 0.1Delay (s) 115.5 86.8 99.2 109.9 117.9 91.5 7.0 2.2 14.5 4.6Level of Service F F F F F F A A B AApproach Delay (s) 103.2 111.3 10.3 14.1Approach LOS F F B B
Intersection SummaryHCM 2000 Control Delay 26.3 HCM 2000 Level of Service CHCM 2000 Volume to Capacity ratio 0.91Actuated Cycle Length (s) 240.0 Sum of lost time (s) 28.5Intersection Capacity Utilization 93.1% ICU Level of Service FAnalysis Period (min) 15c Critical Lane Group
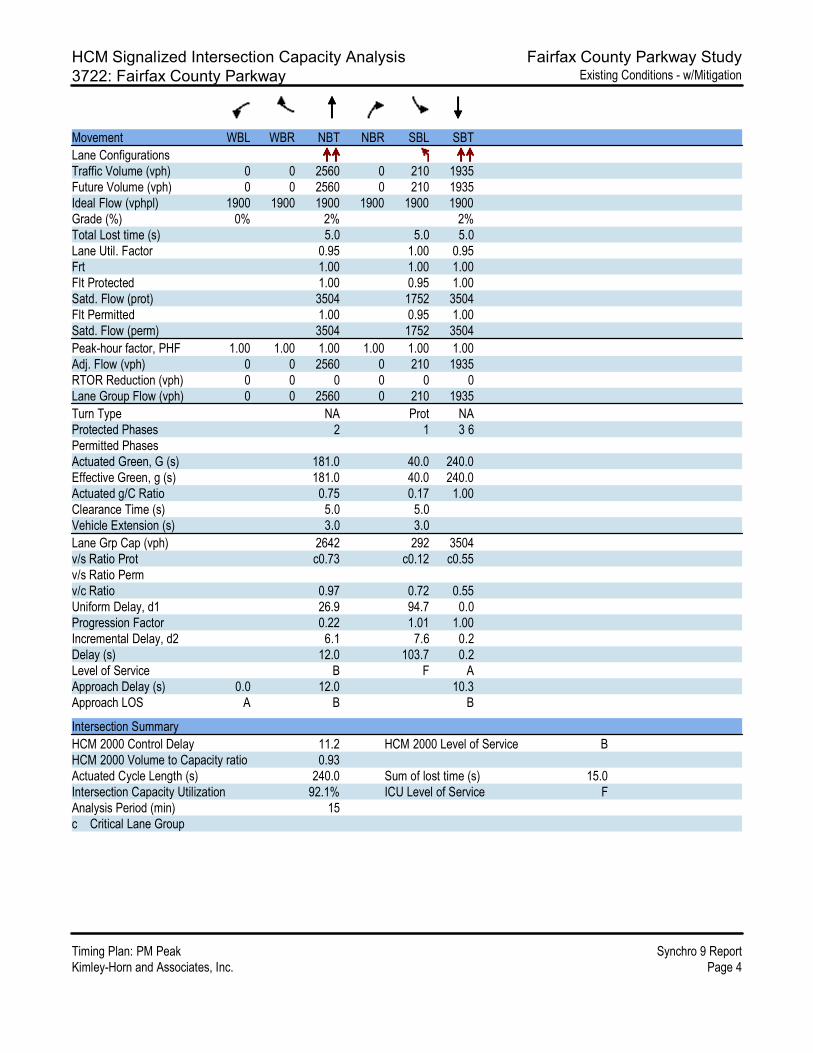
HCM Signalized Intersection Capacity Analysis Fairfax County Parkway Study3722: Fairfax County Parkway Existing Conditions - w/Mitigation
Timing Plan: PM Peak Synchro 9 ReportKimley-Horn and Associates, Inc. Page 4
Movement WBL WBR NBT NBR SBL SBTLane ConfigurationsTraffic Volume (vph) 0 0 2560 0 210 1935Future Volume (vph) 0 0 2560 0 210 1935Ideal Flow (vphpl) 1900 1900 1900 1900 1900 1900Grade (%) 0% 2% 2%Total Lost time (s) 5.0 5.0 5.0Lane Util. Factor 0.95 1.00 0.95Frt 1.00 1.00 1.00Flt Protected 1.00 0.95 1.00Satd. Flow (prot) 3504 1752 3504Flt Permitted 1.00 0.95 1.00Satd. Flow (perm) 3504 1752 3504Peak-hour factor, PHF 1.00 1.00 1.00 1.00 1.00 1.00Adj. Flow (vph) 0 0 2560 0 210 1935RTOR Reduction (vph) 0 0 0 0 0 0Lane Group Flow (vph) 0 0 2560 0 210 1935Turn Type NA Prot NAProtected Phases 2 1 3 6Permitted PhasesActuated Green, G (s) 181.0 40.0 240.0Effective Green, g (s) 181.0 40.0 240.0Actuated g/C Ratio 0.75 0.17 1.00Clearance Time (s) 5.0 5.0Vehicle Extension (s) 3.0 3.0Lane Grp Cap (vph) 2642 292 3504v/s Ratio Prot c0.73 c0.12 c0.55v/s Ratio Permv/c Ratio 0.97 0.72 0.55Uniform Delay, d1 26.9 94.7 0.0Progression Factor 0.22 1.01 1.00Incremental Delay, d2 6.1 7.6 0.2Delay (s) 12.0 103.7 0.2Level of Service B F AApproach Delay (s) 0.0 12.0 10.3Approach LOS A B B
Intersection SummaryHCM 2000 Control Delay 11.2 HCM 2000 Level of Service BHCM 2000 Volume to Capacity ratio 0.93Actuated Cycle Length (s) 240.0 Sum of lost time (s) 15.0Intersection Capacity Utilization 92.1% ICU Level of Service FAnalysis Period (min) 15c Critical Lane Group
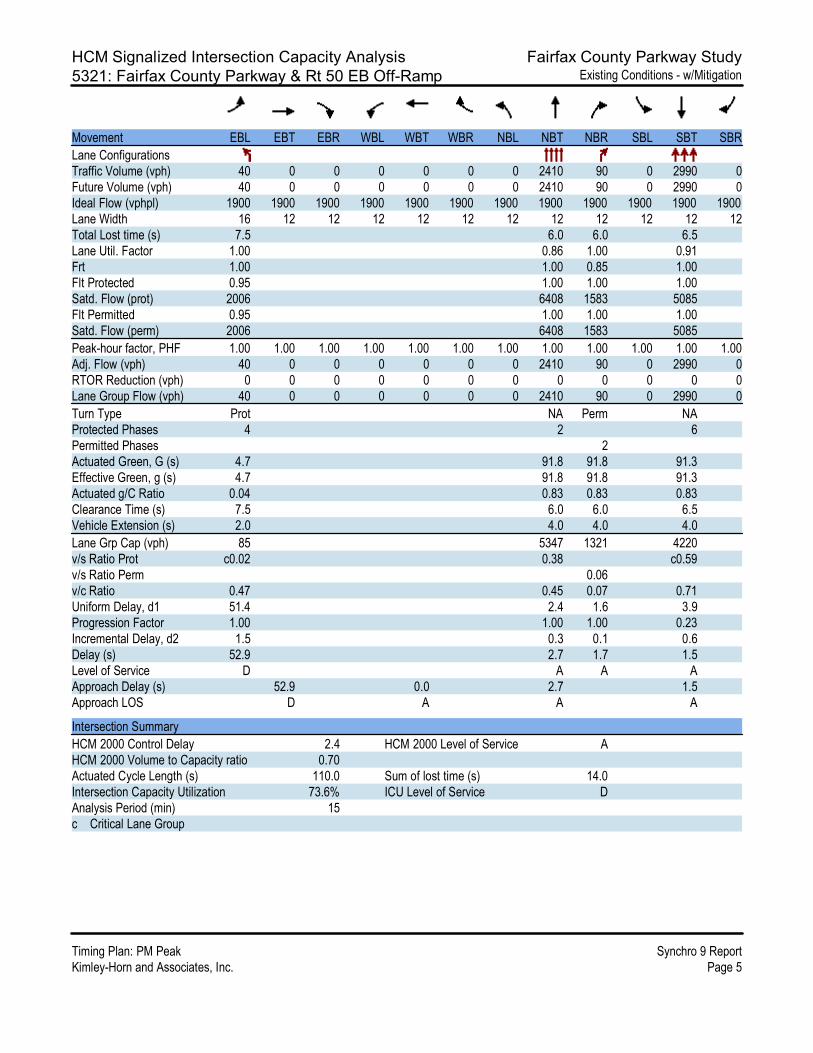
HCM Signalized Intersection Capacity Analysis Fairfax County Parkway Study5321: Fairfax County Parkway & Rt 50 EB Off-Ramp Existing Conditions - w/Mitigation
Timing Plan: PM Peak Synchro 9 ReportKimley-Horn and Associates, Inc. Page 5
Movement EBL EBT EBR WBL WBT WBR NBL NBT NBR SBL SBT SBRLane ConfigurationsTraffic Volume (vph) 40 0 0 0 0 0 0 2410 90 0 2990 0Future Volume (vph) 40 0 0 0 0 0 0 2410 90 0 2990 0Ideal Flow (vphpl) 1900 1900 1900 1900 1900 1900 1900 1900 1900 1900 1900 1900Lane Width 16 12 12 12 12 12 12 12 12 12 12 12Total Lost time (s) 7.5 6.0 6.0 6.5Lane Util. Factor 1.00 0.86 1.00 0.91Frt 1.00 1.00 0.85 1.00Flt Protected 0.95 1.00 1.00 1.00Satd. Flow (prot) 2006 6408 1583 5085Flt Permitted 0.95 1.00 1.00 1.00Satd. Flow (perm) 2006 6408 1583 5085Peak-hour factor, PHF 1.00 1.00 1.00 1.00 1.00 1.00 1.00 1.00 1.00 1.00 1.00 1.00Adj. Flow (vph) 40 0 0 0 0 0 0 2410 90 0 2990 0RTOR Reduction (vph) 0 0 0 0 0 0 0 0 0 0 0 0Lane Group Flow (vph) 40 0 0 0 0 0 0 2410 90 0 2990 0Turn Type Prot NA Perm NAProtected Phases 4 2 6Permitted Phases 2Actuated Green, G (s) 4.7 91.8 91.8 91.3Effective Green, g (s) 4.7 91.8 91.8 91.3Actuated g/C Ratio 0.04 0.83 0.83 0.83Clearance Time (s) 7.5 6.0 6.0 6.5Vehicle Extension (s) 2.0 4.0 4.0 4.0Lane Grp Cap (vph) 85 5347 1321 4220v/s Ratio Prot c0.02 0.38 c0.59v/s Ratio Perm 0.06v/c Ratio 0.47 0.45 0.07 0.71Uniform Delay, d1 51.4 2.4 1.6 3.9Progression Factor 1.00 1.00 1.00 0.23Incremental Delay, d2 1.5 0.3 0.1 0.6Delay (s) 52.9 2.7 1.7 1.5Level of Service D A A AApproach Delay (s) 52.9 0.0 2.7 1.5Approach LOS D A A A
Intersection SummaryHCM 2000 Control Delay 2.4 HCM 2000 Level of Service AHCM 2000 Volume to Capacity ratio 0.70Actuated Cycle Length (s) 110.0 Sum of lost time (s) 14.0Intersection Capacity Utilization 73.6% ICU Level of Service DAnalysis Period (min) 15c Critical Lane Group

HCM Signalized Intersection Capacity Analysis Fairfax County Parkway Study5322: Fairfax County Parkway & Rt 50 WB Off-Ramp Existing Conditions - w/Mitigation
Timing Plan: PM Peak Synchro 9 ReportKimley-Horn and Associates, Inc. Page 6
Movement WBL WBR NBT NBR SBL SBTLane ConfigurationsTraffic Volume (vph) 175 430 1710 0 0 3220Future Volume (vph) 175 430 1710 0 0 3220Ideal Flow (vphpl) 1900 1900 1900 1900 1900 1900Total Lost time (s) 7.5 5.0 6.5 6.0Lane Util. Factor 0.97 0.88 0.91 0.91Frt 1.00 0.85 1.00 1.00Flt Protected 0.95 1.00 1.00 1.00Satd. Flow (prot) 3433 2787 5085 5085Flt Permitted 0.95 1.00 1.00 1.00Satd. Flow (perm) 3433 2787 5085 5085Peak-hour factor, PHF 1.00 1.00 1.00 1.00 1.00 1.00Adj. Flow (vph) 175 430 1710 0 0 3220RTOR Reduction (vph) 0 22 0 0 0 0Lane Group Flow (vph) 175 408 1710 0 0 3220Turn Type Prot custom NA NAProtected Phases 4 1 4 2 6Permitted PhasesActuated Green, G (s) 10.5 27.2 71.3 86.0Effective Green, g (s) 10.5 19.7 71.3 86.0Actuated g/C Ratio 0.10 0.18 0.65 0.78Clearance Time (s) 7.5 6.5 6.0Vehicle Extension (s) 2.0 4.0 4.0Lane Grp Cap (vph) 327 499 3296 3975v/s Ratio Prot 0.05 c0.15 0.34 c0.63v/s Ratio Permv/c Ratio 0.54 0.82 0.52 0.81Uniform Delay, d1 47.4 43.4 10.3 7.1Progression Factor 1.00 1.00 0.82 1.15Incremental Delay, d2 0.8 10.0 0.5 0.8Delay (s) 48.3 53.4 9.0 9.0Level of Service D D A AApproach Delay (s) 51.9 9.0 9.0Approach LOS D A A
Intersection SummaryHCM 2000 Control Delay 13.7 HCM 2000 Level of Service BHCM 2000 Volume to Capacity ratio 0.86Actuated Cycle Length (s) 110.0 Sum of lost time (s) 19.0Intersection Capacity Utilization 78.5% ICU Level of Service DAnalysis Period (min) 15c Critical Lane Group
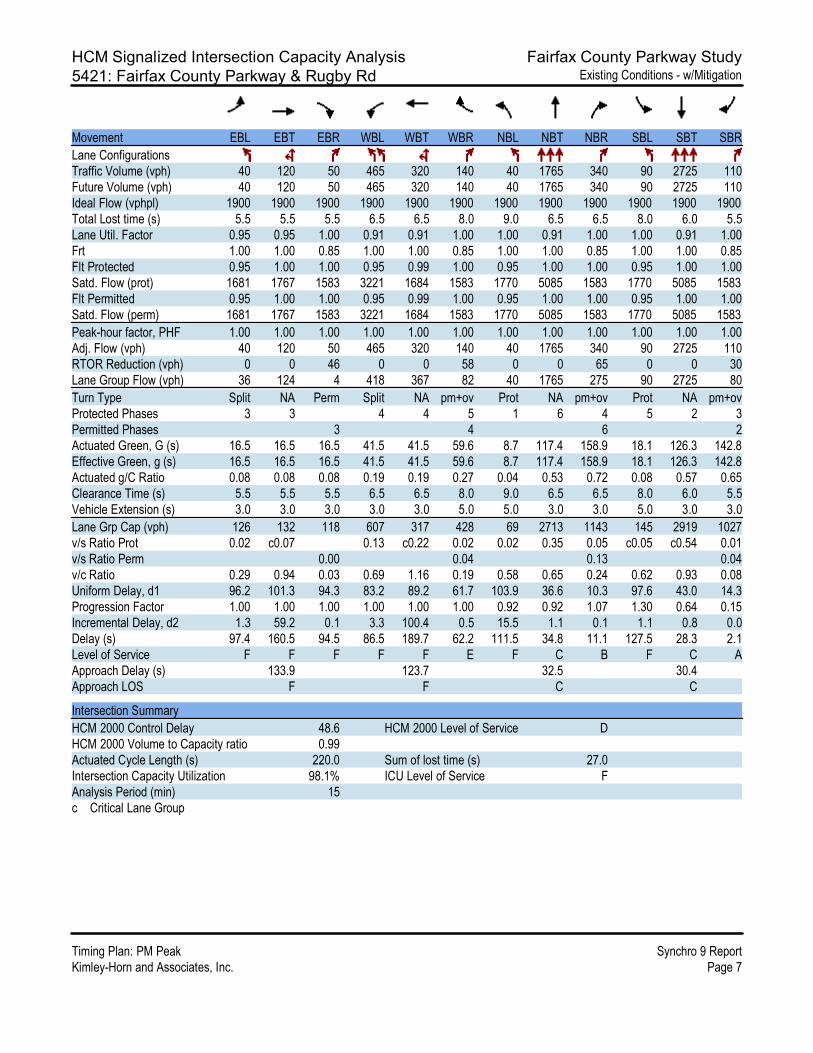
HCM Signalized Intersection Capacity Analysis Fairfax County Parkway Study5421: Fairfax County Parkway & Rugby Rd Existing Conditions - w/Mitigation
Timing Plan: PM Peak Synchro 9 ReportKimley-Horn and Associates, Inc. Page 7
Movement EBL EBT EBR WBL WBT WBR NBL NBT NBR SBL SBT SBRLane ConfigurationsTraffic Volume (vph) 40 120 50 465 320 140 40 1765 340 90 2725 110Future Volume (vph) 40 120 50 465 320 140 40 1765 340 90 2725 110Ideal Flow (vphpl) 1900 1900 1900 1900 1900 1900 1900 1900 1900 1900 1900 1900Total Lost time (s) 5.5 5.5 5.5 6.5 6.5 8.0 9.0 6.5 6.5 8.0 6.0 5.5Lane Util. Factor 0.95 0.95 1.00 0.91 0.91 1.00 1.00 0.91 1.00 1.00 0.91 1.00Frt 1.00 1.00 0.85 1.00 1.00 0.85 1.00 1.00 0.85 1.00 1.00 0.85Flt Protected 0.95 1.00 1.00 0.95 0.99 1.00 0.95 1.00 1.00 0.95 1.00 1.00Satd. Flow (prot) 1681 1767 1583 3221 1684 1583 1770 5085 1583 1770 5085 1583Flt Permitted 0.95 1.00 1.00 0.95 0.99 1.00 0.95 1.00 1.00 0.95 1.00 1.00Satd. Flow (perm) 1681 1767 1583 3221 1684 1583 1770 5085 1583 1770 5085 1583Peak-hour factor, PHF 1.00 1.00 1.00 1.00 1.00 1.00 1.00 1.00 1.00 1.00 1.00 1.00Adj. Flow (vph) 40 120 50 465 320 140 40 1765 340 90 2725 110RTOR Reduction (vph) 0 0 46 0 0 58 0 0 65 0 0 30Lane Group Flow (vph) 36 124 4 418 367 82 40 1765 275 90 2725 80Turn Type Split NA Perm Split NA pm+ov Prot NA pm+ov Prot NA pm+ovProtected Phases 3 3 4 4 5 1 6 4 5 2 3Permitted Phases 3 4 6 2Actuated Green, G (s) 16.5 16.5 16.5 41.5 41.5 59.6 8.7 117.4 158.9 18.1 126.3 142.8Effective Green, g (s) 16.5 16.5 16.5 41.5 41.5 59.6 8.7 117.4 158.9 18.1 126.3 142.8Actuated g/C Ratio 0.08 0.08 0.08 0.19 0.19 0.27 0.04 0.53 0.72 0.08 0.57 0.65Clearance Time (s) 5.5 5.5 5.5 6.5 6.5 8.0 9.0 6.5 6.5 8.0 6.0 5.5Vehicle Extension (s) 3.0 3.0 3.0 3.0 3.0 5.0 5.0 3.0 3.0 5.0 3.0 3.0Lane Grp Cap (vph) 126 132 118 607 317 428 69 2713 1143 145 2919 1027v/s Ratio Prot 0.02 c0.07 0.13 c0.22 0.02 0.02 0.35 0.05 c0.05 c0.54 0.01v/s Ratio Perm 0.00 0.04 0.13 0.04v/c Ratio 0.29 0.94 0.03 0.69 1.16 0.19 0.58 0.65 0.24 0.62 0.93 0.08Uniform Delay, d1 96.2 101.3 94.3 83.2 89.2 61.7 103.9 36.6 10.3 97.6 43.0 14.3Progression Factor 1.00 1.00 1.00 1.00 1.00 1.00 0.92 0.92 1.07 1.30 0.64 0.15Incremental Delay, d2 1.3 59.2 0.1 3.3 100.4 0.5 15.5 1.1 0.1 1.1 0.8 0.0Delay (s) 97.4 160.5 94.5 86.5 189.7 62.2 111.5 34.8 11.1 127.5 28.3 2.1Level of Service F F F F F E F C B F C AApproach Delay (s) 133.9 123.7 32.5 30.4Approach LOS F F C C
Intersection SummaryHCM 2000 Control Delay 48.6 HCM 2000 Level of Service DHCM 2000 Volume to Capacity ratio 0.99Actuated Cycle Length (s) 220.0 Sum of lost time (s) 27.0Intersection Capacity Utilization 98.1% ICU Level of Service FAnalysis Period (min) 15c Critical Lane Group

HCM Unsignalized Intersection Capacity Analysis Fairfax County Parkway Study5531: Fairfax County Parkway & Old Plains Rd Existing Conditions - w/Mitigation
Timing Plan: PM Peak Synchro 9 ReportKimley-Horn and Associates, Inc. Page 8
Movement EBL EBR NBL NBT SBT SBRLane ConfigurationsTraffic Volume (veh/h) 0 30 30 1905 2885 50Future Volume (Veh/h) 0 30 30 1905 2885 50Sign Control Stop Free FreeGrade 0% 0% 0%Peak Hour Factor 1.00 1.00 1.00 1.00 1.00 1.00Hourly flow rate (vph) 0 30 30 1905 2885 50PedestriansLane Width (ft)Walking Speed (ft/s)Percent BlockageRight turn flare (veh)Median type None NoneMedian storage veh)Upstream signal (ft)pX, platoon unblockedvC, conflicting volume 3898 1442 2935vC1, stage 1 conf volvC2, stage 2 conf volvCu, unblocked vol 3898 1442 2935tC, single (s) 6.8 6.9 4.1tC, 2 stage (s)tF (s) 3.5 3.3 2.2p0 queue free % 100 75 75cM capacity (veh/h) 2 122 120
Direction, Lane # EB 1 NB 1 NB 2 NB 3 SB 1 SB 2 SB 3Volume Total 30 30 952 952 1442 1442 50Volume Left 0 30 0 0 0 0 0Volume Right 30 0 0 0 0 0 50cSH 122 120 1700 1700 1700 1700 1700Volume to Capacity 0.25 0.25 0.56 0.56 0.85 0.85 0.03Queue Length 95th (ft) 23 23 0 0 0 0 0Control Delay (s) 44.1 44.7 0.0 0.0 0.0 0.0 0.0Lane LOS E EApproach Delay (s) 44.1 0.7 0.0Approach LOS E
Intersection SummaryAverage Delay 0.5Intersection Capacity Utilization 89.7% ICU Level of Service EAnalysis Period (min) 15

HCM Signalized Intersection Capacity Analysis Fairfax County Parkway Study5821: Fairfax County Parkway & Franklin Farm Rd Existing Conditions - w/Mitigation
Timing Plan: PM Peak Synchro 9 ReportKimley-Horn and Associates, Inc. Page 9
Movement EBL EBT EBR WBL WBT WBR NBL NBT NBR SBL SBT SBRLane ConfigurationsTraffic Volume (vph) 150 270 590 90 315 30 335 1605 80 30 2310 240Future Volume (vph) 150 270 590 90 315 30 335 1605 80 30 2310 240Ideal Flow (vphpl) 1900 1900 1900 1900 1900 1900 1900 1900 1900 1900 1900 1900Total Lost time (s) 8.0 8.0 8.0 8.0 8.0 9.5 6.5 8.0 8.0 6.5 8.0Lane Util. Factor 0.97 1.00 0.88 1.00 0.95 0.97 0.95 1.00 1.00 0.95 1.00Frt 1.00 1.00 0.85 1.00 0.99 1.00 1.00 0.85 1.00 1.00 0.85Flt Protected 0.95 1.00 1.00 0.95 1.00 0.95 1.00 1.00 0.95 1.00 1.00Satd. Flow (prot) 3433 1863 2787 1770 3493 3433 3539 1583 1770 3539 1583Flt Permitted 0.95 1.00 1.00 0.95 1.00 0.95 1.00 1.00 0.95 1.00 1.00Satd. Flow (perm) 3433 1863 2787 1770 3493 3433 3539 1583 1770 3539 1583Peak-hour factor, PHF 1.00 1.00 1.00 1.00 1.00 1.00 1.00 1.00 1.00 1.00 1.00 1.00Adj. Flow (vph) 150 270 590 90 315 30 335 1605 80 30 2310 240RTOR Reduction (vph) 0 0 78 0 4 0 0 0 23 0 0 24Lane Group Flow (vph) 150 270 512 90 341 0 335 1605 57 30 2310 216Turn Type Prot NA pt+ov Prot NA Prot NA pm+ov Prot NA pm+ovProtected Phases 3 8 8 1 7 4 1 6 7 5 2 3Permitted Phases 6 2Actuated Green, G (s) 13.3 25.0 42.1 12.0 23.7 17.1 144.6 156.6 7.9 133.9 147.2Effective Green, g (s) 13.3 25.0 42.1 12.0 23.7 17.1 144.6 156.6 7.9 133.9 147.2Actuated g/C Ratio 0.06 0.11 0.19 0.05 0.11 0.08 0.66 0.71 0.04 0.61 0.67Clearance Time (s) 8.0 8.0 8.0 8.0 9.5 6.5 8.0 8.0 6.5 8.0Vehicle Extension (s) 3.0 3.0 3.0 3.0 3.0 5.0 3.0 3.0 5.0 3.0Lane Grp Cap (vph) 207 211 533 96 376 266 2326 1126 63 2153 1059v/s Ratio Prot 0.04 c0.14 0.18 c0.05 0.10 c0.10 0.45 0.00 0.02 c0.65 0.01v/s Ratio Perm 0.03 0.12v/c Ratio 0.72 1.28 0.96 0.94 0.91 1.26 0.69 0.05 0.48 1.07 0.20Uniform Delay, d1 101.6 97.5 88.1 103.6 97.1 101.5 23.6 9.5 104.0 43.0 14.0Progression Factor 1.00 1.00 1.00 1.00 1.00 0.81 0.79 1.37 1.14 0.50 0.78Incremental Delay, d2 11.9 157.1 28.7 70.9 24.8 134.6 1.1 0.0 1.3 35.4 0.0Delay (s) 113.4 254.6 116.8 174.5 121.9 217.2 19.9 13.0 120.1 57.1 11.0Level of Service F F F F F F B B F E BApproach Delay (s) 153.1 132.8 52.3 53.5Approach LOS F F D D
Intersection SummaryHCM 2000 Control Delay 75.5 HCM 2000 Level of Service EHCM 2000 Volume to Capacity ratio 1.11Actuated Cycle Length (s) 220.0 Sum of lost time (s) 32.0Intersection Capacity Utilization 119.3% ICU Level of Service HAnalysis Period (min) 15c Critical Lane Group
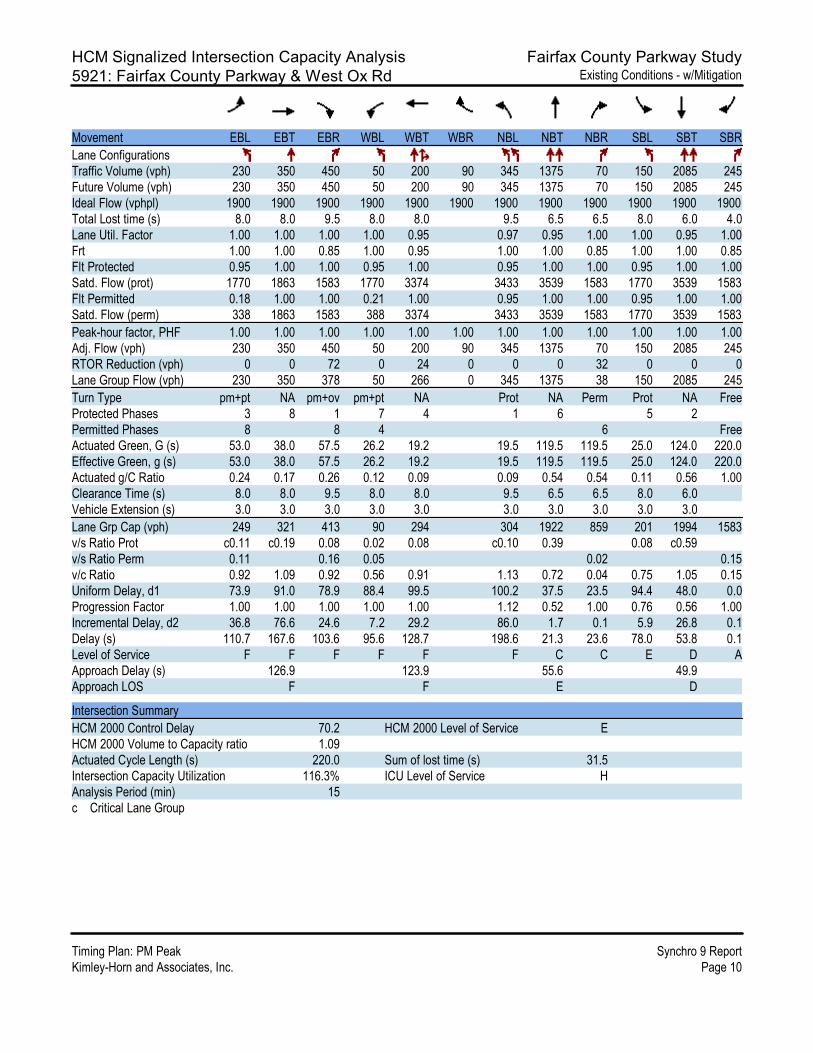
HCM Signalized Intersection Capacity Analysis Fairfax County Parkway Study5921: Fairfax County Parkway & West Ox Rd Existing Conditions - w/Mitigation
Timing Plan: PM Peak Synchro 9 ReportKimley-Horn and Associates, Inc. Page 10
Movement EBL EBT EBR WBL WBT WBR NBL NBT NBR SBL SBT SBRLane ConfigurationsTraffic Volume (vph) 230 350 450 50 200 90 345 1375 70 150 2085 245Future Volume (vph) 230 350 450 50 200 90 345 1375 70 150 2085 245Ideal Flow (vphpl) 1900 1900 1900 1900 1900 1900 1900 1900 1900 1900 1900 1900Total Lost time (s) 8.0 8.0 9.5 8.0 8.0 9.5 6.5 6.5 8.0 6.0 4.0Lane Util. Factor 1.00 1.00 1.00 1.00 0.95 0.97 0.95 1.00 1.00 0.95 1.00Frt 1.00 1.00 0.85 1.00 0.95 1.00 1.00 0.85 1.00 1.00 0.85Flt Protected 0.95 1.00 1.00 0.95 1.00 0.95 1.00 1.00 0.95 1.00 1.00Satd. Flow (prot) 1770 1863 1583 1770 3374 3433 3539 1583 1770 3539 1583Flt Permitted 0.18 1.00 1.00 0.21 1.00 0.95 1.00 1.00 0.95 1.00 1.00Satd. Flow (perm) 338 1863 1583 388 3374 3433 3539 1583 1770 3539 1583Peak-hour factor, PHF 1.00 1.00 1.00 1.00 1.00 1.00 1.00 1.00 1.00 1.00 1.00 1.00Adj. Flow (vph) 230 350 450 50 200 90 345 1375 70 150 2085 245RTOR Reduction (vph) 0 0 72 0 24 0 0 0 32 0 0 0Lane Group Flow (vph) 230 350 378 50 266 0 345 1375 38 150 2085 245Turn Type pm+pt NA pm+ov pm+pt NA Prot NA Perm Prot NA FreeProtected Phases 3 8 1 7 4 1 6 5 2Permitted Phases 8 8 4 6 FreeActuated Green, G (s) 53.0 38.0 57.5 26.2 19.2 19.5 119.5 119.5 25.0 124.0 220.0Effective Green, g (s) 53.0 38.0 57.5 26.2 19.2 19.5 119.5 119.5 25.0 124.0 220.0Actuated g/C Ratio 0.24 0.17 0.26 0.12 0.09 0.09 0.54 0.54 0.11 0.56 1.00Clearance Time (s) 8.0 8.0 9.5 8.0 8.0 9.5 6.5 6.5 8.0 6.0Vehicle Extension (s) 3.0 3.0 3.0 3.0 3.0 3.0 3.0 3.0 3.0 3.0Lane Grp Cap (vph) 249 321 413 90 294 304 1922 859 201 1994 1583v/s Ratio Prot c0.11 c0.19 0.08 0.02 0.08 c0.10 0.39 0.08 c0.59v/s Ratio Perm 0.11 0.16 0.05 0.02 0.15v/c Ratio 0.92 1.09 0.92 0.56 0.91 1.13 0.72 0.04 0.75 1.05 0.15Uniform Delay, d1 73.9 91.0 78.9 88.4 99.5 100.2 37.5 23.5 94.4 48.0 0.0Progression Factor 1.00 1.00 1.00 1.00 1.00 1.12 0.52 1.00 0.76 0.56 1.00Incremental Delay, d2 36.8 76.6 24.6 7.2 29.2 86.0 1.7 0.1 5.9 26.8 0.1Delay (s) 110.7 167.6 103.6 95.6 128.7 198.6 21.3 23.6 78.0 53.8 0.1Level of Service F F F F F F C C E D AApproach Delay (s) 126.9 123.9 55.6 49.9Approach LOS F F E D
Intersection SummaryHCM 2000 Control Delay 70.2 HCM 2000 Level of Service EHCM 2000 Volume to Capacity ratio 1.09Actuated Cycle Length (s) 220.0 Sum of lost time (s) 31.5Intersection Capacity Utilization 116.3% ICU Level of Service HAnalysis Period (min) 15c Critical Lane Group
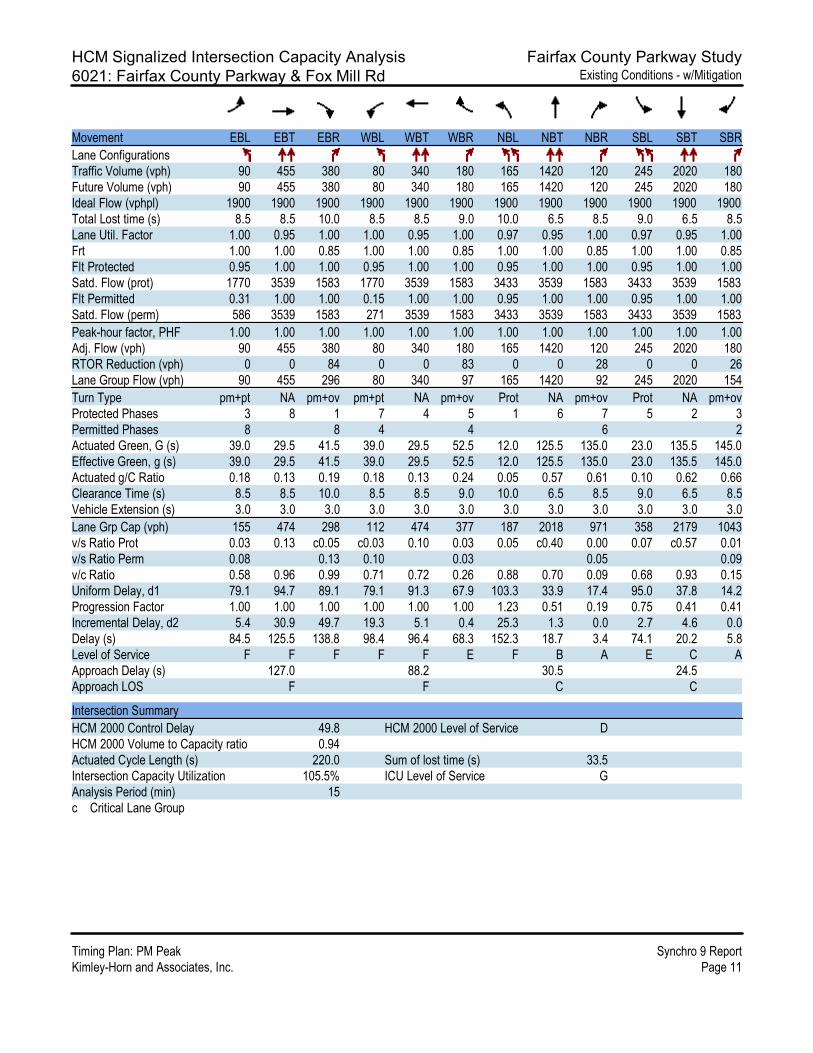
HCM Signalized Intersection Capacity Analysis Fairfax County Parkway Study6021: Fairfax County Parkway & Fox Mill Rd Existing Conditions - w/Mitigation
Timing Plan: PM Peak Synchro 9 ReportKimley-Horn and Associates, Inc. Page 11
Movement EBL EBT EBR WBL WBT WBR NBL NBT NBR SBL SBT SBRLane ConfigurationsTraffic Volume (vph) 90 455 380 80 340 180 165 1420 120 245 2020 180Future Volume (vph) 90 455 380 80 340 180 165 1420 120 245 2020 180Ideal Flow (vphpl) 1900 1900 1900 1900 1900 1900 1900 1900 1900 1900 1900 1900Total Lost time (s) 8.5 8.5 10.0 8.5 8.5 9.0 10.0 6.5 8.5 9.0 6.5 8.5Lane Util. Factor 1.00 0.95 1.00 1.00 0.95 1.00 0.97 0.95 1.00 0.97 0.95 1.00Frt 1.00 1.00 0.85 1.00 1.00 0.85 1.00 1.00 0.85 1.00 1.00 0.85Flt Protected 0.95 1.00 1.00 0.95 1.00 1.00 0.95 1.00 1.00 0.95 1.00 1.00Satd. Flow (prot) 1770 3539 1583 1770 3539 1583 3433 3539 1583 3433 3539 1583Flt Permitted 0.31 1.00 1.00 0.15 1.00 1.00 0.95 1.00 1.00 0.95 1.00 1.00Satd. Flow (perm) 586 3539 1583 271 3539 1583 3433 3539 1583 3433 3539 1583Peak-hour factor, PHF 1.00 1.00 1.00 1.00 1.00 1.00 1.00 1.00 1.00 1.00 1.00 1.00Adj. Flow (vph) 90 455 380 80 340 180 165 1420 120 245 2020 180RTOR Reduction (vph) 0 0 84 0 0 83 0 0 28 0 0 26Lane Group Flow (vph) 90 455 296 80 340 97 165 1420 92 245 2020 154Turn Type pm+pt NA pm+ov pm+pt NA pm+ov Prot NA pm+ov Prot NA pm+ovProtected Phases 3 8 1 7 4 5 1 6 7 5 2 3Permitted Phases 8 8 4 4 6 2Actuated Green, G (s) 39.0 29.5 41.5 39.0 29.5 52.5 12.0 125.5 135.0 23.0 135.5 145.0Effective Green, g (s) 39.0 29.5 41.5 39.0 29.5 52.5 12.0 125.5 135.0 23.0 135.5 145.0Actuated g/C Ratio 0.18 0.13 0.19 0.18 0.13 0.24 0.05 0.57 0.61 0.10 0.62 0.66Clearance Time (s) 8.5 8.5 10.0 8.5 8.5 9.0 10.0 6.5 8.5 9.0 6.5 8.5Vehicle Extension (s) 3.0 3.0 3.0 3.0 3.0 3.0 3.0 3.0 3.0 3.0 3.0 3.0Lane Grp Cap (vph) 155 474 298 112 474 377 187 2018 971 358 2179 1043v/s Ratio Prot 0.03 0.13 c0.05 c0.03 0.10 0.03 0.05 c0.40 0.00 0.07 c0.57 0.01v/s Ratio Perm 0.08 0.13 0.10 0.03 0.05 0.09v/c Ratio 0.58 0.96 0.99 0.71 0.72 0.26 0.88 0.70 0.09 0.68 0.93 0.15Uniform Delay, d1 79.1 94.7 89.1 79.1 91.3 67.9 103.3 33.9 17.4 95.0 37.8 14.2Progression Factor 1.00 1.00 1.00 1.00 1.00 1.00 1.23 0.51 0.19 0.75 0.41 0.41Incremental Delay, d2 5.4 30.9 49.7 19.3 5.1 0.4 25.3 1.3 0.0 2.7 4.6 0.0Delay (s) 84.5 125.5 138.8 98.4 96.4 68.3 152.3 18.7 3.4 74.1 20.2 5.8Level of Service F F F F F E F B A E C AApproach Delay (s) 127.0 88.2 30.5 24.5Approach LOS F F C C
Intersection SummaryHCM 2000 Control Delay 49.8 HCM 2000 Level of Service DHCM 2000 Volume to Capacity ratio 0.94Actuated Cycle Length (s) 220.0 Sum of lost time (s) 33.5Intersection Capacity Utilization 105.5% ICU Level of Service GAnalysis Period (min) 15c Critical Lane Group
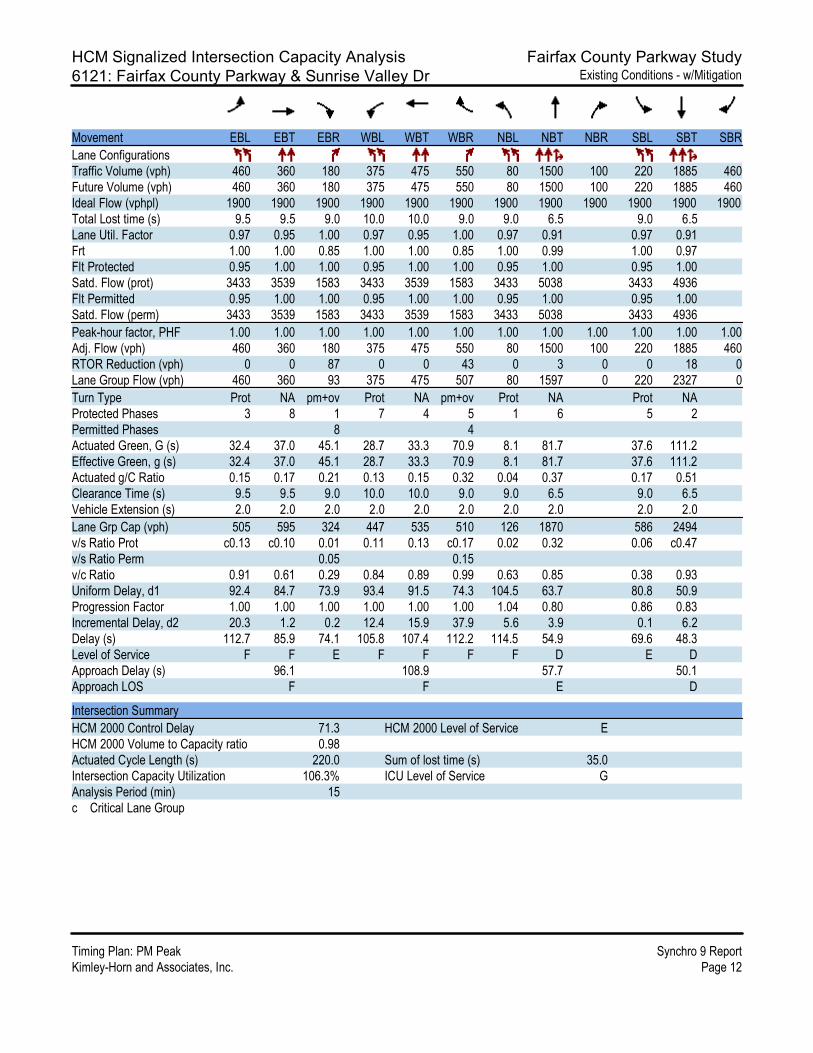
HCM Signalized Intersection Capacity Analysis Fairfax County Parkway Study6121: Fairfax County Parkway & Sunrise Valley Dr Existing Conditions - w/Mitigation
Timing Plan: PM Peak Synchro 9 ReportKimley-Horn and Associates, Inc. Page 12
Movement EBL EBT EBR WBL WBT WBR NBL NBT NBR SBL SBT SBRLane ConfigurationsTraffic Volume (vph) 460 360 180 375 475 550 80 1500 100 220 1885 460Future Volume (vph) 460 360 180 375 475 550 80 1500 100 220 1885 460Ideal Flow (vphpl) 1900 1900 1900 1900 1900 1900 1900 1900 1900 1900 1900 1900Total Lost time (s) 9.5 9.5 9.0 10.0 10.0 9.0 9.0 6.5 9.0 6.5Lane Util. Factor 0.97 0.95 1.00 0.97 0.95 1.00 0.97 0.91 0.97 0.91Frt 1.00 1.00 0.85 1.00 1.00 0.85 1.00 0.99 1.00 0.97Flt Protected 0.95 1.00 1.00 0.95 1.00 1.00 0.95 1.00 0.95 1.00Satd. Flow (prot) 3433 3539 1583 3433 3539 1583 3433 5038 3433 4936Flt Permitted 0.95 1.00 1.00 0.95 1.00 1.00 0.95 1.00 0.95 1.00Satd. Flow (perm) 3433 3539 1583 3433 3539 1583 3433 5038 3433 4936Peak-hour factor, PHF 1.00 1.00 1.00 1.00 1.00 1.00 1.00 1.00 1.00 1.00 1.00 1.00Adj. Flow (vph) 460 360 180 375 475 550 80 1500 100 220 1885 460RTOR Reduction (vph) 0 0 87 0 0 43 0 3 0 0 18 0Lane Group Flow (vph) 460 360 93 375 475 507 80 1597 0 220 2327 0Turn Type Prot NA pm+ov Prot NA pm+ov Prot NA Prot NAProtected Phases 3 8 1 7 4 5 1 6 5 2Permitted Phases 8 4Actuated Green, G (s) 32.4 37.0 45.1 28.7 33.3 70.9 8.1 81.7 37.6 111.2Effective Green, g (s) 32.4 37.0 45.1 28.7 33.3 70.9 8.1 81.7 37.6 111.2Actuated g/C Ratio 0.15 0.17 0.21 0.13 0.15 0.32 0.04 0.37 0.17 0.51Clearance Time (s) 9.5 9.5 9.0 10.0 10.0 9.0 9.0 6.5 9.0 6.5Vehicle Extension (s) 2.0 2.0 2.0 2.0 2.0 2.0 2.0 2.0 2.0 2.0Lane Grp Cap (vph) 505 595 324 447 535 510 126 1870 586 2494v/s Ratio Prot c0.13 c0.10 0.01 0.11 0.13 c0.17 0.02 0.32 0.06 c0.47v/s Ratio Perm 0.05 0.15v/c Ratio 0.91 0.61 0.29 0.84 0.89 0.99 0.63 0.85 0.38 0.93Uniform Delay, d1 92.4 84.7 73.9 93.4 91.5 74.3 104.5 63.7 80.8 50.9Progression Factor 1.00 1.00 1.00 1.00 1.00 1.00 1.04 0.80 0.86 0.83Incremental Delay, d2 20.3 1.2 0.2 12.4 15.9 37.9 5.6 3.9 0.1 6.2Delay (s) 112.7 85.9 74.1 105.8 107.4 112.2 114.5 54.9 69.6 48.3Level of Service F F E F F F F D E DApproach Delay (s) 96.1 108.9 57.7 50.1Approach LOS F F E D
Intersection SummaryHCM 2000 Control Delay 71.3 HCM 2000 Level of Service EHCM 2000 Volume to Capacity ratio 0.98Actuated Cycle Length (s) 220.0 Sum of lost time (s) 35.0Intersection Capacity Utilization 106.3% ICU Level of Service GAnalysis Period (min) 15c Critical Lane Group

HCM Signalized Intersection Capacity Analysis Fairfax County Parkway Study6221: Fairfax County Parkway & Dulles Toll Rd EB Off-Ramp Existing Conditions - w/Mitigation
Timing Plan: PM Peak Synchro 9 ReportKimley-Horn and Associates, Inc. Page 13
Movement EBL EBT EBR WBL WBT WBR NBL NBT NBR SBL SBT SBRLane ConfigurationsTraffic Volume (vph) 390 0 150 0 0 0 0 2255 250 325 2420 0Future Volume (vph) 390 0 150 0 0 0 0 2255 250 325 2420 0Ideal Flow (vphpl) 1900 1900 1900 1900 1900 1900 1900 1900 1900 1900 1900 1900Total Lost time (s) 9.0 9.0 9.0 6.0 6.0 7.5 6.0Lane Util. Factor 0.95 0.91 0.95 0.91 1.00 0.97 0.91Frt 1.00 0.99 0.85 1.00 0.85 1.00 1.00Flt Protected 0.95 0.96 1.00 1.00 1.00 0.95 1.00Satd. Flow (prot) 1681 1602 1504 5085 1583 3433 5085Flt Permitted 0.95 0.96 1.00 1.00 1.00 0.95 1.00Satd. Flow (perm) 1681 1602 1504 5085 1583 3433 5085Peak-hour factor, PHF 1.00 1.00 1.00 1.00 1.00 1.00 1.00 1.00 1.00 1.00 1.00 1.00Adj. Flow (vph) 390 0 150 0 0 0 0 2255 250 325 2420 0RTOR Reduction (vph) 0 87 87 0 0 0 0 0 0 0 0 0Lane Group Flow (vph) 203 115 48 0 0 0 0 2255 250 325 2420 0Turn Type Split NA Perm NA custom Prot NAProtected Phases 3 3 6 6 5 2Permitted Phases 3 3Actuated Green, G (s) 17.7 17.7 17.7 55.1 72.8 14.7 77.3Effective Green, g (s) 17.7 17.7 17.7 55.1 72.8 14.7 77.3Actuated g/C Ratio 0.16 0.16 0.16 0.50 0.66 0.13 0.70Clearance Time (s) 9.0 9.0 9.0 6.0 6.0 7.5 6.0Vehicle Extension (s) 3.0 3.0 3.0 2.0 2.0 2.0 2.0Lane Grp Cap (vph) 270 257 242 2547 1134 458 3573v/s Ratio Prot c0.12 0.07 c0.44 0.11 0.09 c0.48v/s Ratio Perm 0.03 0.05v/c Ratio 0.75 0.45 0.20 0.89 0.22 0.71 0.68Uniform Delay, d1 44.1 41.7 40.0 24.6 7.4 45.6 9.3Progression Factor 1.00 1.00 1.00 0.97 0.70 1.45 0.13Incremental Delay, d2 11.2 1.2 0.4 2.5 0.0 1.1 0.4Delay (s) 55.3 43.0 40.4 26.3 5.2 67.1 1.7Level of Service E D D C A E AApproach Delay (s) 46.9 0.0 24.2 9.4Approach LOS D A C A
Intersection SummaryHCM 2000 Control Delay 19.3 HCM 2000 Level of Service BHCM 2000 Volume to Capacity ratio 0.86Actuated Cycle Length (s) 110.0 Sum of lost time (s) 22.5Intersection Capacity Utilization 85.5% ICU Level of Service EAnalysis Period (min) 15c Critical Lane Group
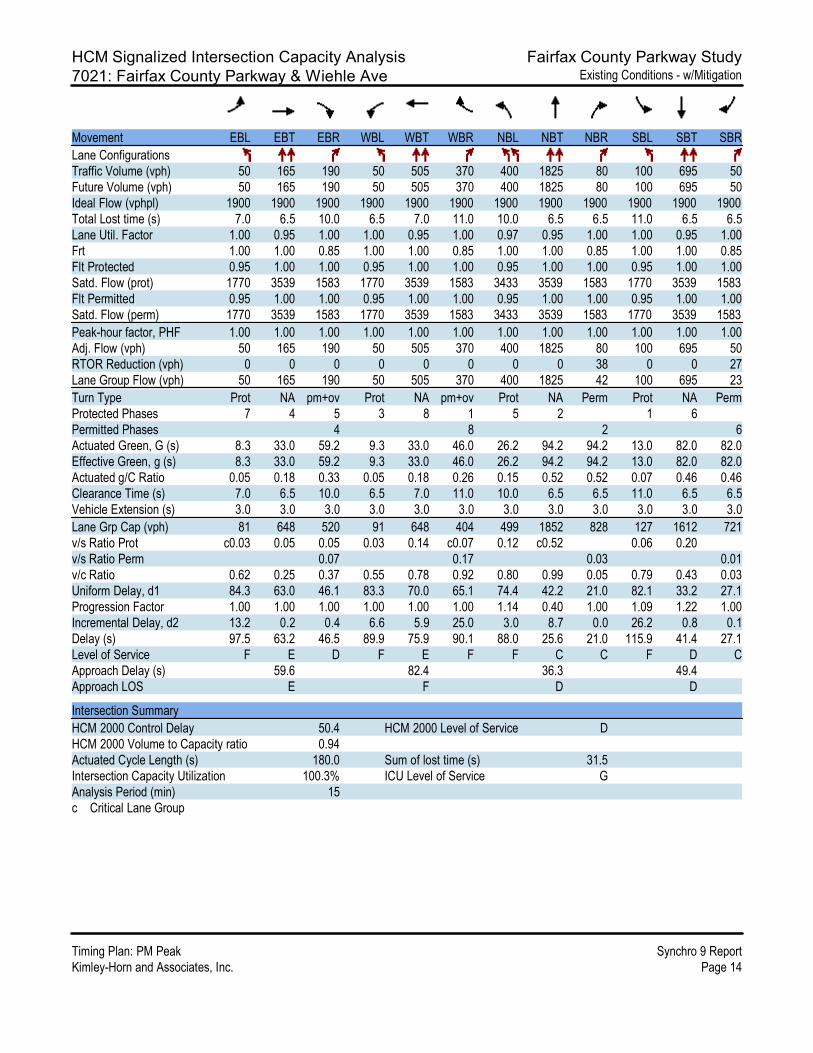
HCM Signalized Intersection Capacity Analysis Fairfax County Parkway Study7021: Fairfax County Parkway & Wiehle Ave Existing Conditions - w/Mitigation
Timing Plan: PM Peak Synchro 9 ReportKimley-Horn and Associates, Inc. Page 14
Movement EBL EBT EBR WBL WBT WBR NBL NBT NBR SBL SBT SBRLane ConfigurationsTraffic Volume (vph) 50 165 190 50 505 370 400 1825 80 100 695 50Future Volume (vph) 50 165 190 50 505 370 400 1825 80 100 695 50Ideal Flow (vphpl) 1900 1900 1900 1900 1900 1900 1900 1900 1900 1900 1900 1900Total Lost time (s) 7.0 6.5 10.0 6.5 7.0 11.0 10.0 6.5 6.5 11.0 6.5 6.5Lane Util. Factor 1.00 0.95 1.00 1.00 0.95 1.00 0.97 0.95 1.00 1.00 0.95 1.00Frt 1.00 1.00 0.85 1.00 1.00 0.85 1.00 1.00 0.85 1.00 1.00 0.85Flt Protected 0.95 1.00 1.00 0.95 1.00 1.00 0.95 1.00 1.00 0.95 1.00 1.00Satd. Flow (prot) 1770 3539 1583 1770 3539 1583 3433 3539 1583 1770 3539 1583Flt Permitted 0.95 1.00 1.00 0.95 1.00 1.00 0.95 1.00 1.00 0.95 1.00 1.00Satd. Flow (perm) 1770 3539 1583 1770 3539 1583 3433 3539 1583 1770 3539 1583Peak-hour factor, PHF 1.00 1.00 1.00 1.00 1.00 1.00 1.00 1.00 1.00 1.00 1.00 1.00Adj. Flow (vph) 50 165 190 50 505 370 400 1825 80 100 695 50RTOR Reduction (vph) 0 0 0 0 0 0 0 0 38 0 0 27Lane Group Flow (vph) 50 165 190 50 505 370 400 1825 42 100 695 23Turn Type Prot NA pm+ov Prot NA pm+ov Prot NA Perm Prot NA PermProtected Phases 7 4 5 3 8 1 5 2 1 6Permitted Phases 4 8 2 6Actuated Green, G (s) 8.3 33.0 59.2 9.3 33.0 46.0 26.2 94.2 94.2 13.0 82.0 82.0Effective Green, g (s) 8.3 33.0 59.2 9.3 33.0 46.0 26.2 94.2 94.2 13.0 82.0 82.0Actuated g/C Ratio 0.05 0.18 0.33 0.05 0.18 0.26 0.15 0.52 0.52 0.07 0.46 0.46Clearance Time (s) 7.0 6.5 10.0 6.5 7.0 11.0 10.0 6.5 6.5 11.0 6.5 6.5Vehicle Extension (s) 3.0 3.0 3.0 3.0 3.0 3.0 3.0 3.0 3.0 3.0 3.0 3.0Lane Grp Cap (vph) 81 648 520 91 648 404 499 1852 828 127 1612 721v/s Ratio Prot c0.03 0.05 0.05 0.03 0.14 c0.07 0.12 c0.52 0.06 0.20v/s Ratio Perm 0.07 0.17 0.03 0.01v/c Ratio 0.62 0.25 0.37 0.55 0.78 0.92 0.80 0.99 0.05 0.79 0.43 0.03Uniform Delay, d1 84.3 63.0 46.1 83.3 70.0 65.1 74.4 42.2 21.0 82.1 33.2 27.1Progression Factor 1.00 1.00 1.00 1.00 1.00 1.00 1.14 0.40 1.00 1.09 1.22 1.00Incremental Delay, d2 13.2 0.2 0.4 6.6 5.9 25.0 3.0 8.7 0.0 26.2 0.8 0.1Delay (s) 97.5 63.2 46.5 89.9 75.9 90.1 88.0 25.6 21.0 115.9 41.4 27.1Level of Service F E D F E F F C C F D CApproach Delay (s) 59.6 82.4 36.3 49.4Approach LOS E F D D
Intersection SummaryHCM 2000 Control Delay 50.4 HCM 2000 Level of Service DHCM 2000 Volume to Capacity ratio 0.94Actuated Cycle Length (s) 180.0 Sum of lost time (s) 31.5Intersection Capacity Utilization 100.3% ICU Level of Service GAnalysis Period (min) 15c Critical Lane Group
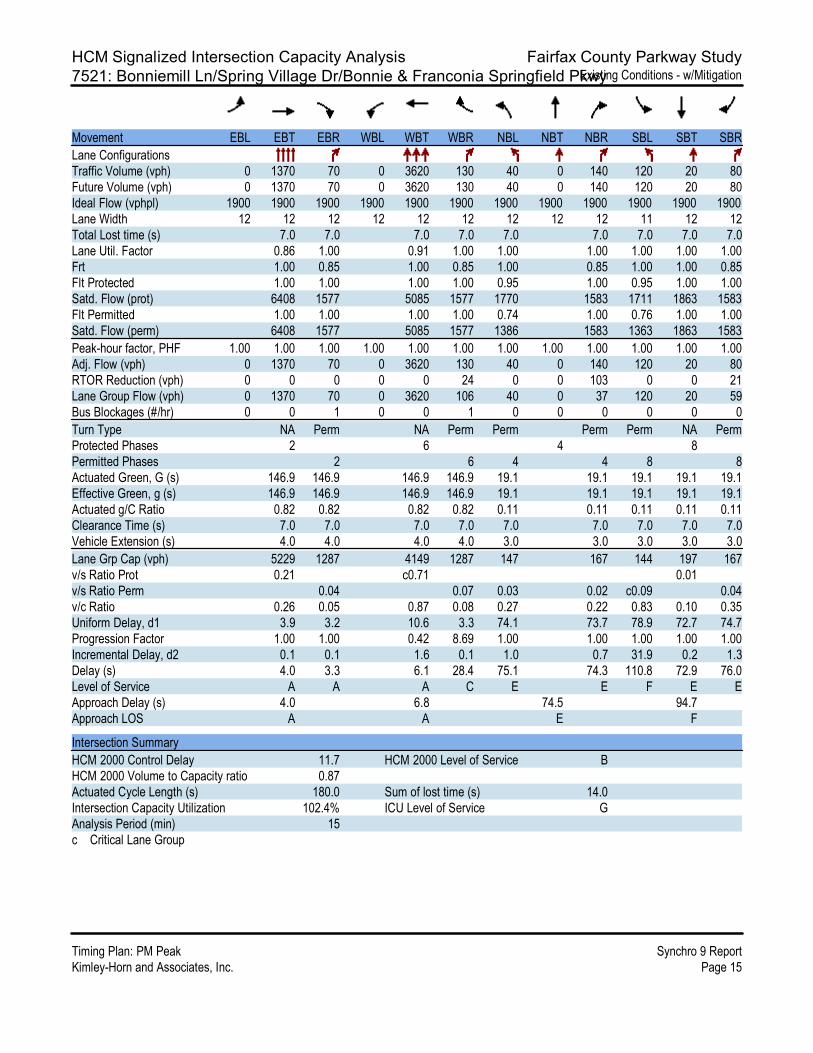
HCM Signalized Intersection Capacity Analysis Fairfax County Parkway Study7521: Bonniemill Ln/Spring Village Dr/Bonnie & Franconia Springfield PkwyExisting Conditions - w/Mitigation
Timing Plan: PM Peak Synchro 9 ReportKimley-Horn and Associates, Inc. Page 15
Movement EBL EBT EBR WBL WBT WBR NBL NBT NBR SBL SBT SBRLane ConfigurationsTraffic Volume (vph) 0 1370 70 0 3620 130 40 0 140 120 20 80Future Volume (vph) 0 1370 70 0 3620 130 40 0 140 120 20 80Ideal Flow (vphpl) 1900 1900 1900 1900 1900 1900 1900 1900 1900 1900 1900 1900Lane Width 12 12 12 12 12 12 12 12 12 11 12 12Total Lost time (s) 7.0 7.0 7.0 7.0 7.0 7.0 7.0 7.0 7.0Lane Util. Factor 0.86 1.00 0.91 1.00 1.00 1.00 1.00 1.00 1.00Frt 1.00 0.85 1.00 0.85 1.00 0.85 1.00 1.00 0.85Flt Protected 1.00 1.00 1.00 1.00 0.95 1.00 0.95 1.00 1.00Satd. Flow (prot) 6408 1577 5085 1577 1770 1583 1711 1863 1583Flt Permitted 1.00 1.00 1.00 1.00 0.74 1.00 0.76 1.00 1.00Satd. Flow (perm) 6408 1577 5085 1577 1386 1583 1363 1863 1583Peak-hour factor, PHF 1.00 1.00 1.00 1.00 1.00 1.00 1.00 1.00 1.00 1.00 1.00 1.00Adj. Flow (vph) 0 1370 70 0 3620 130 40 0 140 120 20 80RTOR Reduction (vph) 0 0 0 0 0 24 0 0 103 0 0 21Lane Group Flow (vph) 0 1370 70 0 3620 106 40 0 37 120 20 59Bus Blockages (#/hr) 0 0 1 0 0 1 0 0 0 0 0 0Turn Type NA Perm NA Perm Perm Perm Perm NA PermProtected Phases 2 6 4 8Permitted Phases 2 6 4 4 8 8Actuated Green, G (s) 146.9 146.9 146.9 146.9 19.1 19.1 19.1 19.1 19.1Effective Green, g (s) 146.9 146.9 146.9 146.9 19.1 19.1 19.1 19.1 19.1Actuated g/C Ratio 0.82 0.82 0.82 0.82 0.11 0.11 0.11 0.11 0.11Clearance Time (s) 7.0 7.0 7.0 7.0 7.0 7.0 7.0 7.0 7.0Vehicle Extension (s) 4.0 4.0 4.0 4.0 3.0 3.0 3.0 3.0 3.0Lane Grp Cap (vph) 5229 1287 4149 1287 147 167 144 197 167v/s Ratio Prot 0.21 c0.71 0.01v/s Ratio Perm 0.04 0.07 0.03 0.02 c0.09 0.04v/c Ratio 0.26 0.05 0.87 0.08 0.27 0.22 0.83 0.10 0.35Uniform Delay, d1 3.9 3.2 10.6 3.3 74.1 73.7 78.9 72.7 74.7Progression Factor 1.00 1.00 0.42 8.69 1.00 1.00 1.00 1.00 1.00Incremental Delay, d2 0.1 0.1 1.6 0.1 1.0 0.7 31.9 0.2 1.3Delay (s) 4.0 3.3 6.1 28.4 75.1 74.3 110.8 72.9 76.0Level of Service A A A C E E F E EApproach Delay (s) 4.0 6.8 74.5 94.7Approach LOS A A E F
Intersection SummaryHCM 2000 Control Delay 11.7 HCM 2000 Level of Service BHCM 2000 Volume to Capacity ratio 0.87Actuated Cycle Length (s) 180.0 Sum of lost time (s) 14.0Intersection Capacity Utilization 102.4% ICU Level of Service GAnalysis Period (min) 15c Critical Lane Group
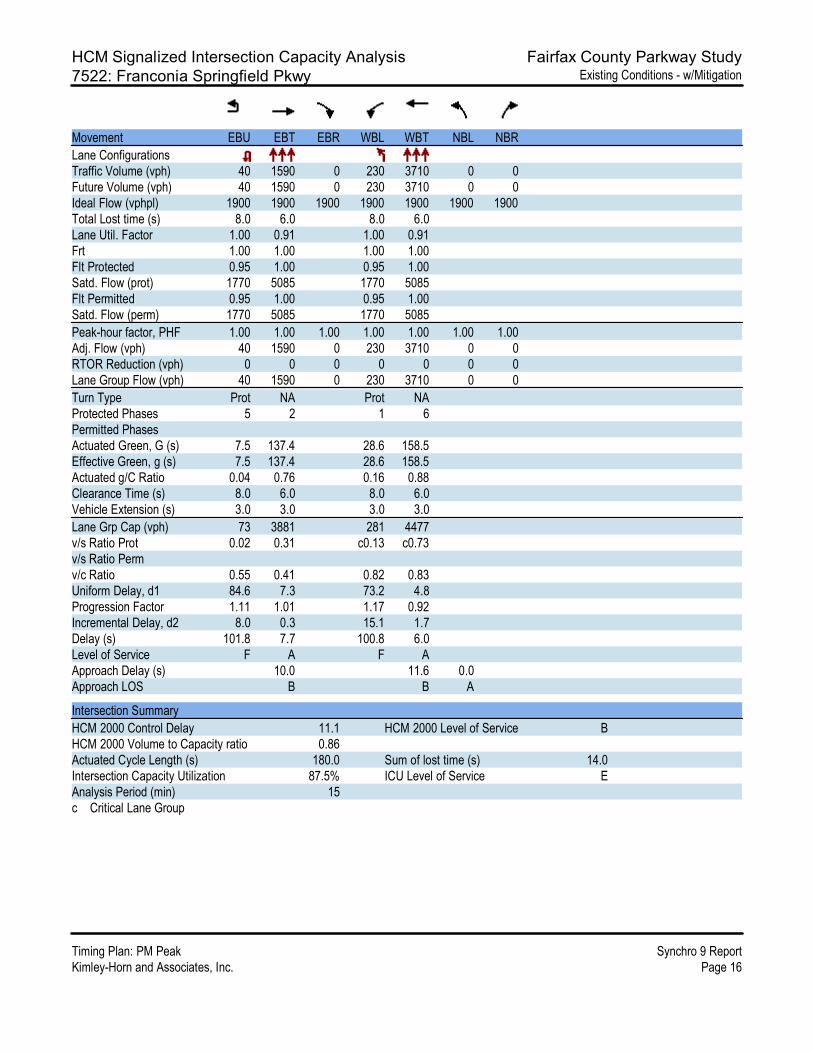
HCM Signalized Intersection Capacity Analysis Fairfax County Parkway Study7522: Franconia Springfield Pkwy Existing Conditions - w/Mitigation
Timing Plan: PM Peak Synchro 9 ReportKimley-Horn and Associates, Inc. Page 16
Movement EBU EBT EBR WBL WBT NBL NBRLane ConfigurationsTraffic Volume (vph) 40 1590 0 230 3710 0 0Future Volume (vph) 40 1590 0 230 3710 0 0Ideal Flow (vphpl) 1900 1900 1900 1900 1900 1900 1900Total Lost time (s) 8.0 6.0 8.0 6.0Lane Util. Factor 1.00 0.91 1.00 0.91Frt 1.00 1.00 1.00 1.00Flt Protected 0.95 1.00 0.95 1.00Satd. Flow (prot) 1770 5085 1770 5085Flt Permitted 0.95 1.00 0.95 1.00Satd. Flow (perm) 1770 5085 1770 5085Peak-hour factor, PHF 1.00 1.00 1.00 1.00 1.00 1.00 1.00Adj. Flow (vph) 40 1590 0 230 3710 0 0RTOR Reduction (vph) 0 0 0 0 0 0 0Lane Group Flow (vph) 40 1590 0 230 3710 0 0Turn Type Prot NA Prot NAProtected Phases 5 2 1 6Permitted PhasesActuated Green, G (s) 7.5 137.4 28.6 158.5Effective Green, g (s) 7.5 137.4 28.6 158.5Actuated g/C Ratio 0.04 0.76 0.16 0.88Clearance Time (s) 8.0 6.0 8.0 6.0Vehicle Extension (s) 3.0 3.0 3.0 3.0Lane Grp Cap (vph) 73 3881 281 4477v/s Ratio Prot 0.02 0.31 c0.13 c0.73v/s Ratio Permv/c Ratio 0.55 0.41 0.82 0.83Uniform Delay, d1 84.6 7.3 73.2 4.8Progression Factor 1.11 1.01 1.17 0.92Incremental Delay, d2 8.0 0.3 15.1 1.7Delay (s) 101.8 7.7 100.8 6.0Level of Service F A F AApproach Delay (s) 10.0 11.6 0.0Approach LOS B B A
Intersection SummaryHCM 2000 Control Delay 11.1 HCM 2000 Level of Service BHCM 2000 Volume to Capacity ratio 0.86Actuated Cycle Length (s) 180.0 Sum of lost time (s) 14.0Intersection Capacity Utilization 87.5% ICU Level of Service EAnalysis Period (min) 15c Critical Lane Group
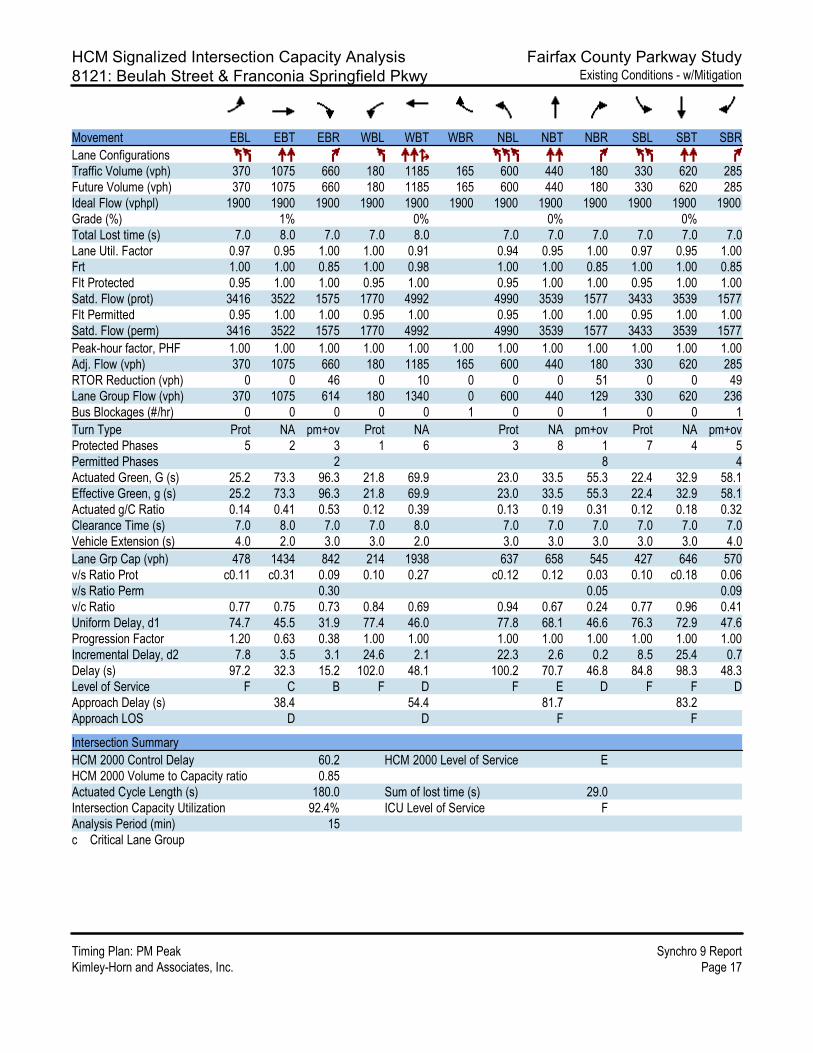
HCM Signalized Intersection Capacity Analysis Fairfax County Parkway Study8121: Beulah Street & Franconia Springfield Pkwy Existing Conditions - w/Mitigation
Timing Plan: PM Peak Synchro 9 ReportKimley-Horn and Associates, Inc. Page 17
Movement EBL EBT EBR WBL WBT WBR NBL NBT NBR SBL SBT SBRLane ConfigurationsTraffic Volume (vph) 370 1075 660 180 1185 165 600 440 180 330 620 285Future Volume (vph) 370 1075 660 180 1185 165 600 440 180 330 620 285Ideal Flow (vphpl) 1900 1900 1900 1900 1900 1900 1900 1900 1900 1900 1900 1900Grade (%) 1% 0% 0% 0%Total Lost time (s) 7.0 8.0 7.0 7.0 8.0 7.0 7.0 7.0 7.0 7.0 7.0Lane Util. Factor 0.97 0.95 1.00 1.00 0.91 0.94 0.95 1.00 0.97 0.95 1.00Frt 1.00 1.00 0.85 1.00 0.98 1.00 1.00 0.85 1.00 1.00 0.85Flt Protected 0.95 1.00 1.00 0.95 1.00 0.95 1.00 1.00 0.95 1.00 1.00Satd. Flow (prot) 3416 3522 1575 1770 4992 4990 3539 1577 3433 3539 1577Flt Permitted 0.95 1.00 1.00 0.95 1.00 0.95 1.00 1.00 0.95 1.00 1.00Satd. Flow (perm) 3416 3522 1575 1770 4992 4990 3539 1577 3433 3539 1577Peak-hour factor, PHF 1.00 1.00 1.00 1.00 1.00 1.00 1.00 1.00 1.00 1.00 1.00 1.00Adj. Flow (vph) 370 1075 660 180 1185 165 600 440 180 330 620 285RTOR Reduction (vph) 0 0 46 0 10 0 0 0 51 0 0 49Lane Group Flow (vph) 370 1075 614 180 1340 0 600 440 129 330 620 236Bus Blockages (#/hr) 0 0 0 0 0 1 0 0 1 0 0 1Turn Type Prot NA pm+ov Prot NA Prot NA pm+ov Prot NA pm+ovProtected Phases 5 2 3 1 6 3 8 1 7 4 5Permitted Phases 2 8 4Actuated Green, G (s) 25.2 73.3 96.3 21.8 69.9 23.0 33.5 55.3 22.4 32.9 58.1Effective Green, g (s) 25.2 73.3 96.3 21.8 69.9 23.0 33.5 55.3 22.4 32.9 58.1Actuated g/C Ratio 0.14 0.41 0.53 0.12 0.39 0.13 0.19 0.31 0.12 0.18 0.32Clearance Time (s) 7.0 8.0 7.0 7.0 8.0 7.0 7.0 7.0 7.0 7.0 7.0Vehicle Extension (s) 4.0 2.0 3.0 3.0 2.0 3.0 3.0 3.0 3.0 3.0 4.0Lane Grp Cap (vph) 478 1434 842 214 1938 637 658 545 427 646 570v/s Ratio Prot c0.11 c0.31 0.09 0.10 0.27 c0.12 0.12 0.03 0.10 c0.18 0.06v/s Ratio Perm 0.30 0.05 0.09v/c Ratio 0.77 0.75 0.73 0.84 0.69 0.94 0.67 0.24 0.77 0.96 0.41Uniform Delay, d1 74.7 45.5 31.9 77.4 46.0 77.8 68.1 46.6 76.3 72.9 47.6Progression Factor 1.20 0.63 0.38 1.00 1.00 1.00 1.00 1.00 1.00 1.00 1.00Incremental Delay, d2 7.8 3.5 3.1 24.6 2.1 22.3 2.6 0.2 8.5 25.4 0.7Delay (s) 97.2 32.3 15.2 102.0 48.1 100.2 70.7 46.8 84.8 98.3 48.3Level of Service F C B F D F E D F F DApproach Delay (s) 38.4 54.4 81.7 83.2Approach LOS D D F F
Intersection SummaryHCM 2000 Control Delay 60.2 HCM 2000 Level of Service EHCM 2000 Volume to Capacity ratio 0.85Actuated Cycle Length (s) 180.0 Sum of lost time (s) 29.0Intersection Capacity Utilization 92.4% ICU Level of Service FAnalysis Period (min) 15c Critical Lane Group