Embed Size (px)
Citation preview
Passaic River, New Jersey
Passaic River Tidal General Reevaluation Report
Lower Passaic River, New Jersey
Appendix J
Engineering and Design
DRAFT
September 2017
Passaic River Tidal, New Jersey, General Reevaluation Report
Draft GRR – September, 2017 J-i
Appendix J - Engineering and Design
TABLE OF CONTENTS
1 INTRODUCTION........................................................................................................... J-1 1.1 Storm Frequency ........................................................................................................... J-3
1.2 Survey and Datum ......................................................................................................... J-3
2 PROJECT PURPOSE .................................................................................................... J-3 3 PROJECT HISTORY .................................................................................................... J-4 4 NED PLAN DESCRIPTION ......................................................................................... J-5
5 TENTATIVELY SELECTED PLAN ........................................................................... J-7 5.1 Southwest Reach ........................................................................................................... J-7 5.2 I-95 Reach ..................................................................................................................... J-8 5.3 Minish Park Reach ........................................................................................................ J-8
6 HYDROLOGY AND HYDRAULICS .......................................................................... J-8 6.1 Passaic River and Newark Bay Stillwater ..................................................................... J-8
6.2 Waves and Overtopping ................................................................................................ J-9
6.2.1 Segments Subject to Waves ................................................................................. J-10 6.2.2 Upstream Segments ............................................................................................. J-11
6.3 Sea Level Change ........................................................................................................ J-12
6.4 Interior Drainage Analysis .......................................................................................... J-15
7 GEOTECHNICAL ANALYSIS .................................................................................. J-15 7.1 Previous Subsurface Investigation .............................................................................. J-16 7.2 Preliminary Information and Assumptions ................................................................. J-18 7.3 Levee Construction Determination ............................................................................. J-18
7.4 Floodwall Geotechnical Analysis................................................................................ J-18 7.5 Seepage and Deep-Seated Sliding Analysis ................................................................ J-19
7.6 Pile Bearing Capacity .................................................................................................. J-20
7.7 Pile Foundation Recommendations ............................................................................. J-20
7.8 Recommendations ....................................................................................................... J-20
8 SURVEYING, MAPPING AND OTHER GEOSPATIAL DATA ........................... J-21
9 FLOODWALL DESIGN .............................................................................................. J-21 9.1 General ........................................................................................................................ J-21 9.2 Codes and Standards ................................................................................................... J-22
9.3 General Design Load Parameters ................................................................................ J-22 9.3.1 Load Combinations .............................................................................................. J-22
9.3.2 Hydraulic Stages .................................................................................................. J-23 9.4 Load Cases .................................................................................................................. J-24
9.4.1 Dead Loads (D) .................................................................................................... J-24 9.4.2 Live Loads (L) ..................................................................................................... J-25 9.4.3 Live Load Surcharge (LS) ................................................................................... J-25
9.4.4 Soil Pressures (S) ................................................................................................. J-25 9.4.5 Hydrostatic Loads (H).......................................................................................... J-25
9.4.6 Uplift Loads (U) ................................................................................................... J-25 9.4.7 Wind Loads (W) .................................................................................................. J-25
9.5 Concrete Design Criteria ............................................................................................. J-25 9.6 Steel Design Criteria ................................................................................................... J-26 9.7 Pile Foundation Design Criteria .................................................................................. J-26 9.8 Construction and Vegetation-Free Zones .................................................................... J-27
Passaic River Tidal, New Jersey, General Reevaluation Report
Draft GRR – September, 2017 J-ii
Appendix J - Engineering and Design
9.9 Armoring ..................................................................................................................... J-28
10 CLOSURE GATE DESIGN......................................................................................... J-29 10.1 General ........................................................................................................................ J-29 10.2 Grouping...................................................................................................................... J-30 10.3 Gate Design ................................................................................................................. J-32
11 PUMP STATIONS ........................................................................................................ J-33 12 UTILTIES RELOCATION/PROTECTION ............................................................. J-33 13 DESIGN AND CONSTRUCTION SCHEDULE ....................................................... J-33 14 DRAWINGS .................................................................................................................. J-33
15 ADDITIONAL ANALYSES AND DATA COLLECTION ...................................... J-33 15.1 Future Geotechnical Needs ......................................................................................... J-33 15.2 Future Survey Needs ................................................................................................... J-33 15.3 Future Interior Drainage Analysis ............................................................................... J-34
16 PERMITS AND APPLICATIONS ............................................................................. J-34 17 EMERGENCY ACTION PLAN ................................................................................. J-34
18 OPERATION AND MAINTENANCE ....................................................................... J-34 19 REFERENCES .............................................................................................................. J-35
List of Tables
Table 1: Annual Chance of Exceedance ...................................................................................... J-3
Table 2: NACCS SWL Stage versus Frequency.......................................................................... J-9
Table 3: Flux Per Unit Length for Alternative Elevation of 14 feet NAVD ............................. J-11
Table 4: Flux Per Unit Length for Alternative Elevation of 16 feet NAVD ............................. J-11
Table 5: Flux Per Unit Length for Alternative Elevation of 18 feet NAVD ............................. J-11
Table 6: Flux Per Unit Length for Riverine Segments, 14 feet NAVD ..................................... J-12
Table 7: Flux Per Unit Length for Riverine Segments, 16 feet NAVD ..................................... J-12
Table 8: Flux Per Unit Length for Riverine Segments, 18 feet NAVD ..................................... J-12
Table 9: Sea Level Change, Passaic Tidal Project Area ............................................................ J-14
Table 10: Hydraulic Stage and Design Water Surface Elevations ............................................ J-24
Table 11: Unit Weights .............................................................................................................. J-24
Table 12: Gate Grouping Scenarios ........................................................................................... J-31
List of Figures
Figure 1: Passaic River Tidal Project Area – 1995 GDM Alignment ......................................... J-2
Figure 2: Passaic River Tidal Project, Locally Preferred Plan .................................................... J-2
Figure 3: Passaic Tidal Project Reaches ...................................................................................... J-6
Figure 4: Passaic Tidal NED Plan ............................................................................................... J-6
Figure 5: Passaic Tidal Project Reaches ...................................................................................... J-7
Figure 6: Segmentation of Levee / Floodwall System ............................................................... J-10
Figure 7: SLC Scenario Projections ........................................................................................... J-14
Figure 8: Existing Boring Data .................................................................................................. J-17
Figure 9: Geotechnical Segments .............................................................................................. J-17
Passaic River Tidal, New Jersey, General Reevaluation Report
Draft GRR – September, 2017 J-iii
Appendix J - Engineering and Design
Figure 10: Typical Floodwall Section........................................................................................ J-19
Figure 11: Typical Vegetation-Free Zone Configuration at Floodwall ..................................... J-28
Figure 12: Articulated Block Armoring ..................................................................................... J-29
List of Attachments
Attachment 1 – Geotechnical Analysis
Attachment 2 – T-wall Structural Calculations
Attachment 3 – Closure Gate Inventory and Calculations
Attachment 4 – Design and Construction Schedule
Attachment 5 – Drawings
Passaic River Tidal, New Jersey, General Reevaluation Report
Draft GRR – September, 2017 J-1
Appendix J - Engineering and Design
1 INTRODUCTION
The Engineering and Design Appendix presents the supporting technical information used in
updating the authorized design of features of the Passaic River, New Jersey, Tidal Flood Risk
Management Project presented in the General Reevaluation Report (GRR) as well as the
Tentatively Selected Plan (TSP), the Locally Preferred Plan (LPP). The New York District Corps
of Engineers (NYD) produced a Draft General Design Memorandum (GDM) in 1995 and the
first phase of a GRR for the entire Passaic River Watershed in 2013, both of which identified
hurricane/storm surge/tidal protection to help manage flood risks in portions of Harrison, Kearny
and Newark, New Jersey. The three “tidal” levees and floodwalls have since been separated out
from the Main Passaic Watershed GRR and have been identified for separate funding and
analysis as part of a series of Authorized but Unconstructed (ABU) Hurricane Sandy-related
projects. The Harrison, Kearny and Newark tidal levees were analyzed at a GRR level of study
making full use of the data acquired in 1995 and 2013, as well as the latest hydrologic, hydraulic,
topographic and structural information.
The ABU Hurricane Sandy-related project was evaluated by comparing design heights to each
other at a preliminary level of detail to compare costs and benefits to determine the optimum
design height. The alternatives analyzed included the 1995 draft GDM elevation and lines of
protection (LOP) with crest elevations 2 and 4 feet above the GDM elevation, as well as a
smaller plan set back from the shoreline that provided flood risk management for the interior of
the City of Newark. Preliminary typical levee and floodwall cross-sections were developed to
estimate comparative quantities and costs.
After consideration of the potential Hazardous, Toxic, and Radioactive Waste (HTRW) impacts,
potential environmental impacts, and the challenges associated with floodwall construction
adjacent to several Superfund sites, the New Jersey Department of Environmental Protection
(NJDEP), the non-Federal partner, selected a smaller alternative, known as the “Flanking Plan”,
as the LPP, which includes floodwall segments set back from the coastline.
This appendix provides the detailed cost estimate for the TSP, the LPP. The plan will provide
flood risk management along portions of the Passaic River, and includes parts of Newark Bay in
New Jersey.
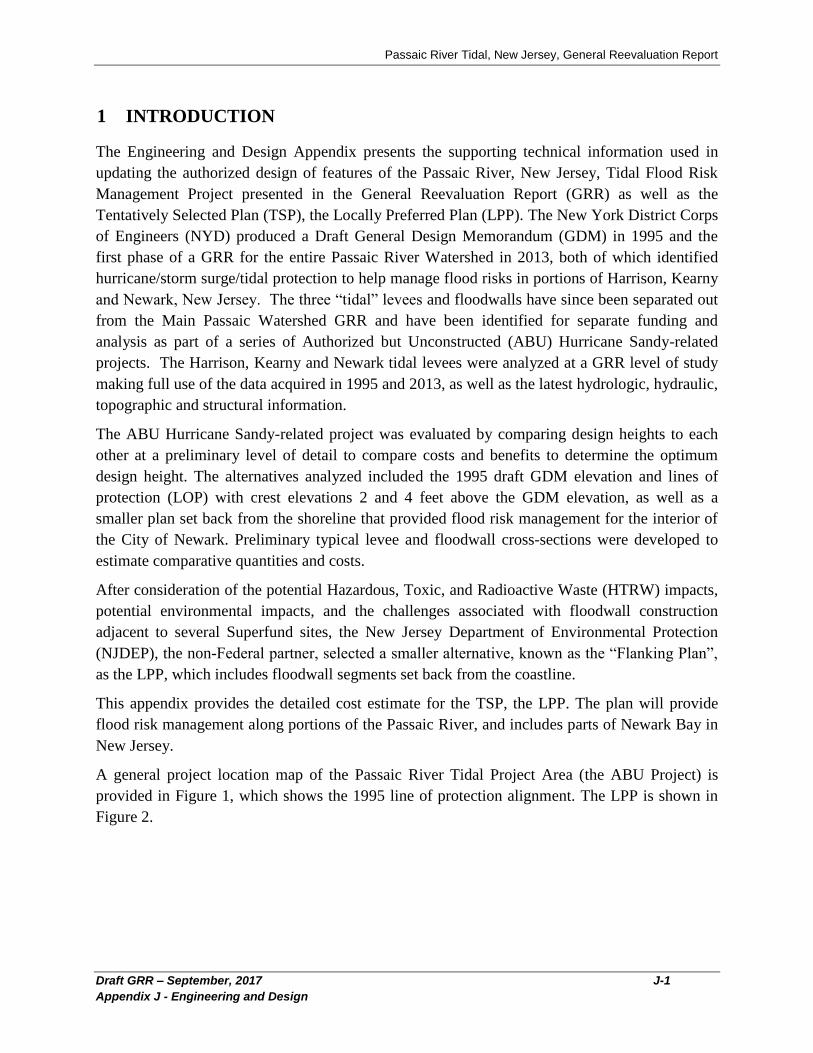
A general project location map of the Passaic River Tidal Project Area (the ABU Project) is
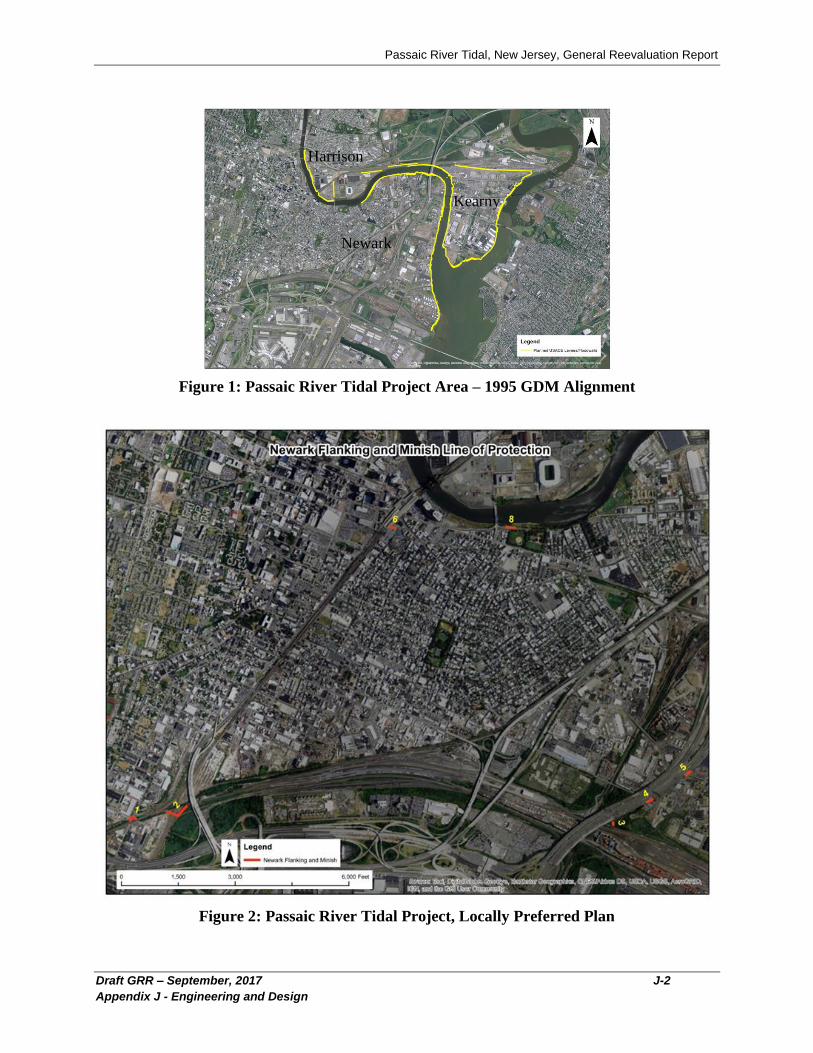
provided in Figure 1, which shows the 1995 line of protection alignment. The LPP is shown in
Figure 2.
Passaic River Tidal, New Jersey, General Reevaluation Report
Draft GRR – September, 2017 J-2
Appendix J - Engineering and Design
Figure 1: Passaic River Tidal Project Area – 1995 GDM Alignment
Figure 2: Passaic River Tidal Project, Locally Preferred Plan
Harrison
Newark
Kearny
Passaic River Tidal, New Jersey, General Reevaluation Report
Draft GRR – September, 2017 J-3
Appendix J - Engineering and Design
1.1 Storm Frequency
The probability of exceedance describes the likelihood of a specified flood or storm event being
exceeded in a given year. There are several ways to express the annual chance of exceedance
(ACE) or annual exceedance probability. The ACE is expressed as a percentage. An event
having a 1 in 100 chance of occurring in any single year would be described as the 1 percent
ACE event. This is the current accepted scientific terminology for expressing chance of
exceedance. The annual recurrence interval, or return period, has historically been used by
engineers to express probability of exceedance. For this document, due to the incorporation of
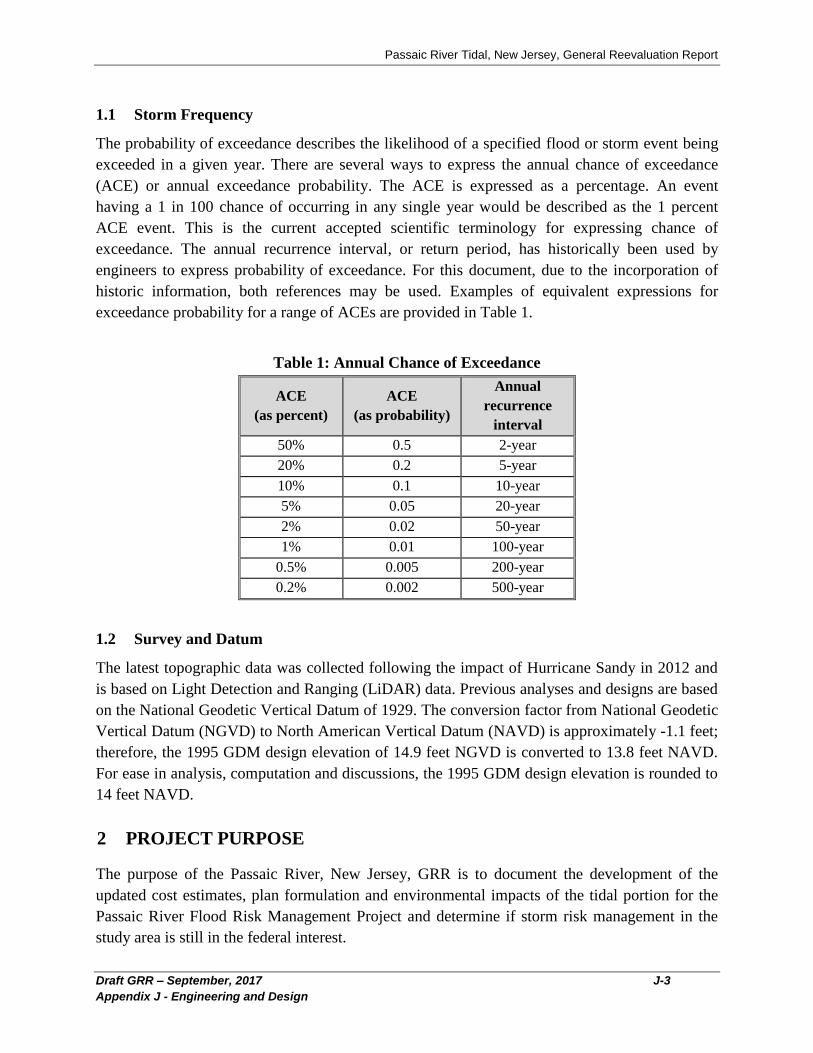
historic information, both references may be used. Examples of equivalent expressions for
exceedance probability for a range of ACEs are provided in Table 1.
Table 1: Annual Chance of Exceedance
ACE
(as percent)
ACE
(as probability)
Annual
recurrence
interval
50% 0.5 2-year
20% 0.2 5-year
10% 0.1 10-year
5% 0.05 20-year
2% 0.02 50-year
1% 0.01 100-year
0.5% 0.005 200-year
0.2% 0.002 500-year
1.2 Survey and Datum
The latest topographic data was collected following the impact of Hurricane Sandy in 2012 and
is based on Light Detection and Ranging (LiDAR) data. Previous analyses and designs are based
on the National Geodetic Vertical Datum of 1929. The conversion factor from National Geodetic
Vertical Datum (NGVD) to North American Vertical Datum (NAVD) is approximately -1.1 feet;
therefore, the 1995 GDM design elevation of 14.9 feet NGVD is converted to 13.8 feet NAVD.
For ease in analysis, computation and discussions, the 1995 GDM design elevation is rounded to
14 feet NAVD.
2 PROJECT PURPOSE
The purpose of the Passaic River, New Jersey, GRR is to document the development of the
updated cost estimates, plan formulation and environmental impacts of the tidal portion for the
Passaic River Flood Risk Management Project and determine if storm risk management in the
study area is still in the federal interest.
Passaic River Tidal, New Jersey, General Reevaluation Report
Draft GRR – September, 2017 J-4
Appendix J - Engineering and Design
3 PROJECT HISTORY
Flooding in the Passaic River Basin has been studied extensively over the past century at both
the state and federal level. The State of New Jersey has produced numerous documents
containing a variety of recommendation advancing flood storage as key to solving the problem in
the Passaic River Basin. None of the local solutions were implemented upstream such that would
reduce storm surge flooding in the tidal portion of the basin.
In 1936, the Corps of Engineers first became involved in the basin flood control planning effort
as a direct result of the passage of the Flood Control Acts. Since that time, the Corps has issued
reports containing recommendations eight times since 1939, the latest being 1995. Due to the
lack of widespread public support, none of the basin-wide plans were implemented. Opposition
was based on concerns of municipalities and various other interests throughout the basin.
The latest Feasibility Report was NYD’s ‘General Design Memorandum, Flood Protection
Feasibility Main Stem Passaic River, December 1987,” which was the basis for project
authorization. This project at the time included a system of levees and floodwalls with associated
closure structures, interior drainage and pump stations within the tidal portion of the Passaic
River Basin.
Since authorization, the planning and design efforts were conducted and presented in NYD’s
“Draft General Design Memorandum (DGDM), Passaic River Flood Damage Reduction Project,
Main Report and Supplement 1 to the Environmental Impact Statement, September 1995, and
associated appendices.” These efforts affirmed that the authorized project remained appropriate
for the Passaic River Basin based on the problems, needs, and planning and design criteria at the
time.
Since 1996, the State has requested that the Corps proceed with three element of the Passaic
River Basin project: the preservation of natural storage, the Joseph G. Minish Waterfront Park,
and the Harrison portion of the tidal project area. In 2007, the NYD prepared a draft Limited
Reevaluation Report (LRR) to reaffirm federal interest in construction of the tidal portion in
Harrison.
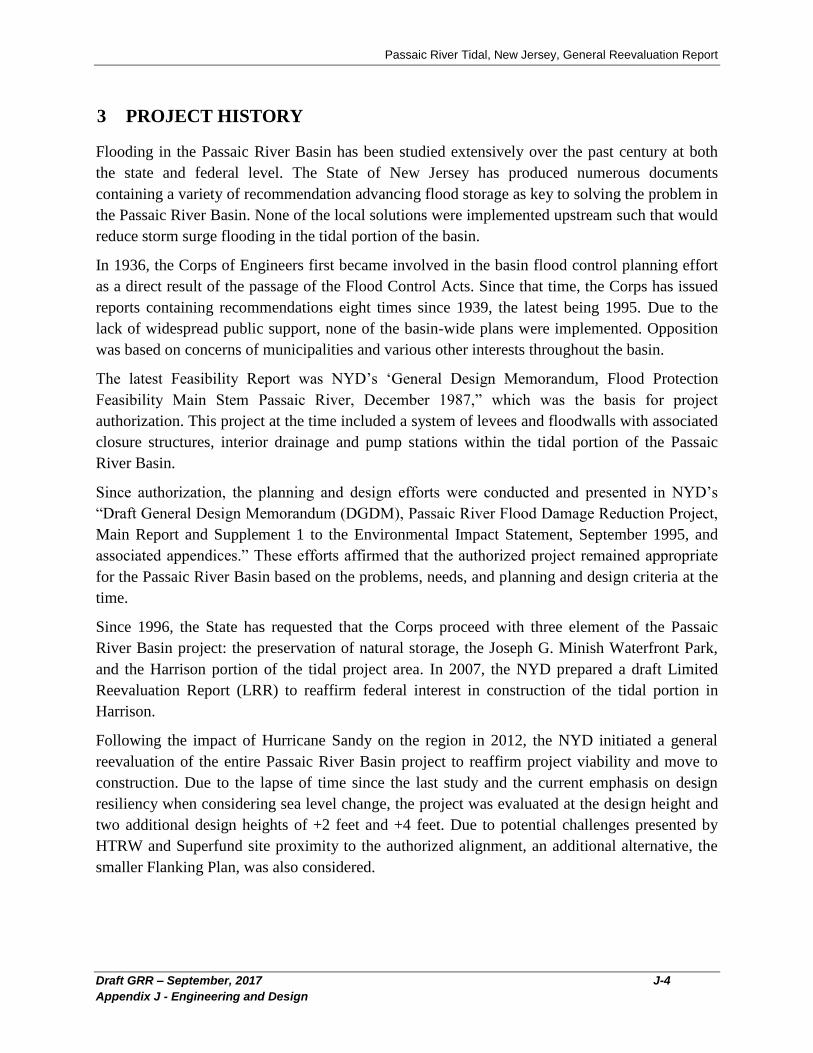
Following the impact of Hurricane Sandy on the region in 2012, the NYD initiated a general
reevaluation of the entire Passaic River Basin project to reaffirm project viability and move to
construction. Due to the lapse of time since the last study and the current emphasis on design
resiliency when considering sea level change, the project was evaluated at the design height and
two additional design heights of +2 feet and +4 feet. Due to potential challenges presented by
HTRW and Superfund site proximity to the authorized alignment, an additional alternative, the
smaller Flanking Plan, was also considered.
Passaic River Tidal, New Jersey, General Reevaluation Report
Draft GRR – September, 2017 J-5
Appendix J - Engineering and Design
4 NED PLAN DESCRIPTION
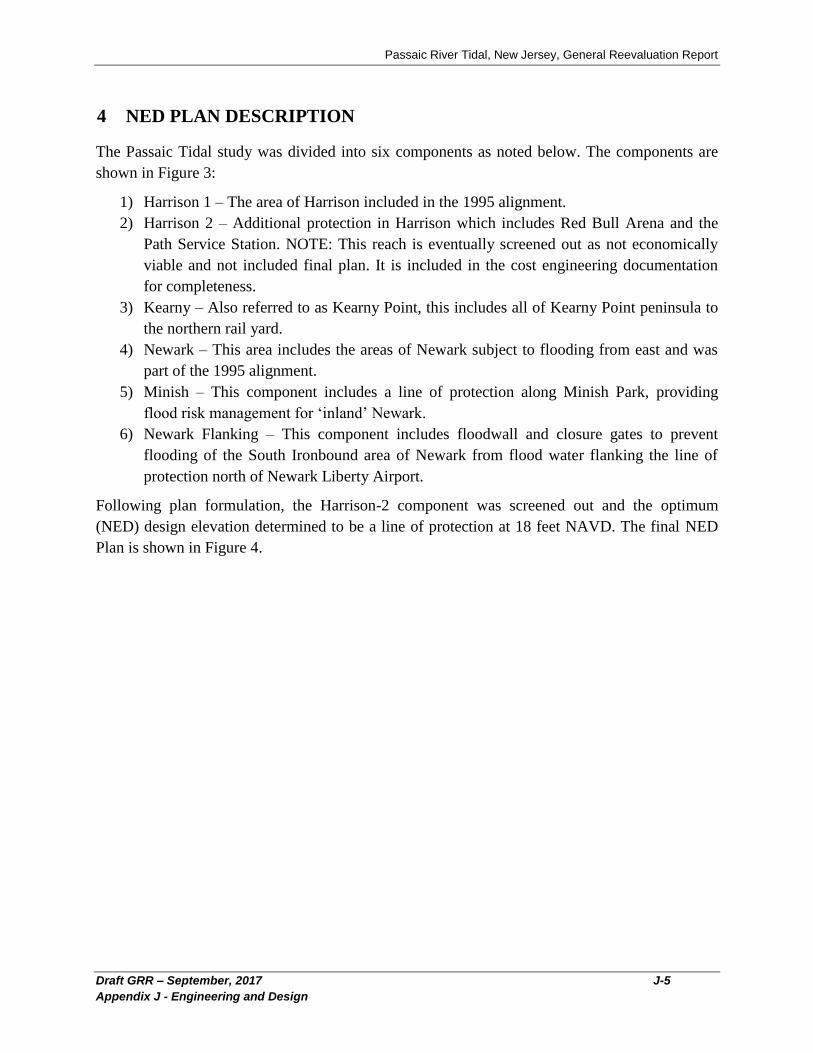
The Passaic Tidal study was divided into six components as noted below. The components are
shown in Figure 3:
1) Harrison 1 – The area of Harrison included in the 1995 alignment.
2) Harrison 2 – Additional protection in Harrison which includes Red Bull Arena and the
Path Service Station. NOTE: This reach is eventually screened out as not economically
viable and not included final plan. It is included in the cost engineering documentation
for completeness.
3) Kearny – Also referred to as Kearny Point, this includes all of Kearny Point peninsula to
the northern rail yard.
4) Newark – This area includes the areas of Newark subject to flooding from east and was
part of the 1995 alignment.
5) Minish – This component includes a line of protection along Minish Park, providing
flood risk management for ‘inland’ Newark.
6) Newark Flanking – This component includes floodwall and closure gates to prevent
flooding of the South Ironbound area of Newark from flood water flanking the line of
protection north of Newark Liberty Airport.
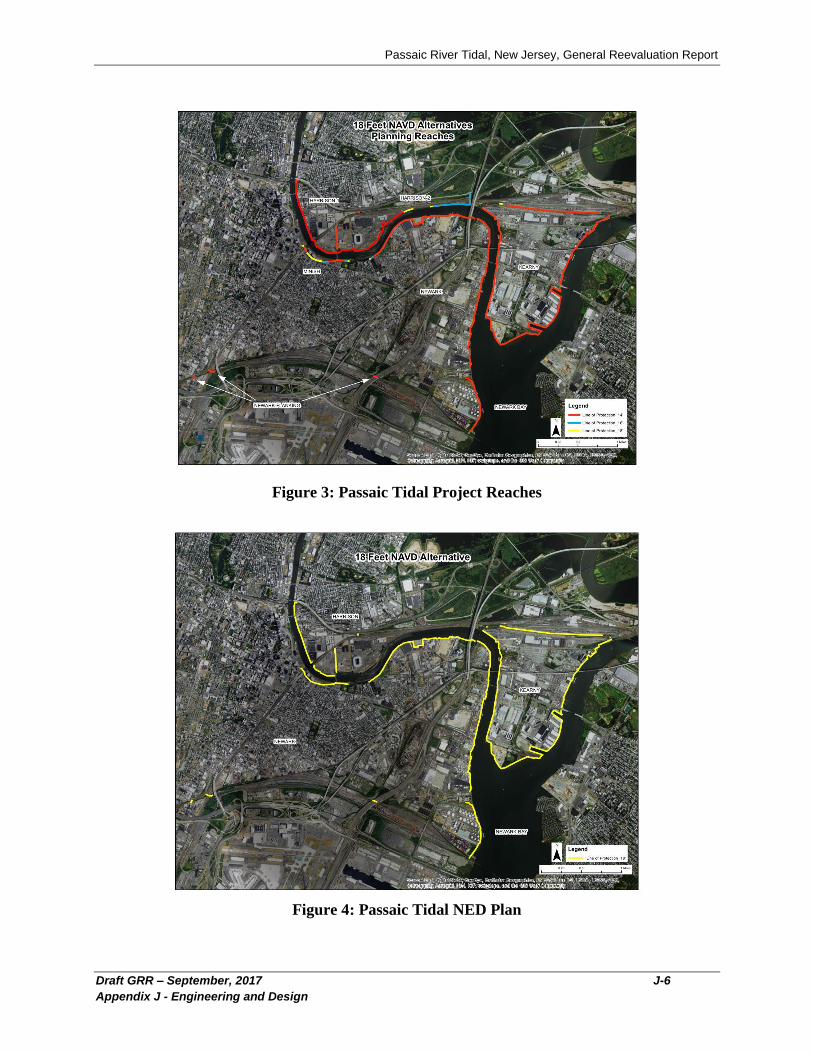
Following plan formulation, the Harrison-2 component was screened out and the optimum
(NED) design elevation determined to be a line of protection at 18 feet NAVD. The final NED
Plan is shown in Figure 4.
Passaic River Tidal, New Jersey, General Reevaluation Report
Draft GRR – September, 2017 J-6
Appendix J - Engineering and Design
Figure 3: Passaic Tidal Project Reaches
Figure 4: Passaic Tidal NED Plan
Passaic River Tidal, New Jersey, General Reevaluation Report
Draft GRR – September, 2017 J-7
Appendix J - Engineering and Design
5 TENTATIVELY SELECTED PLAN
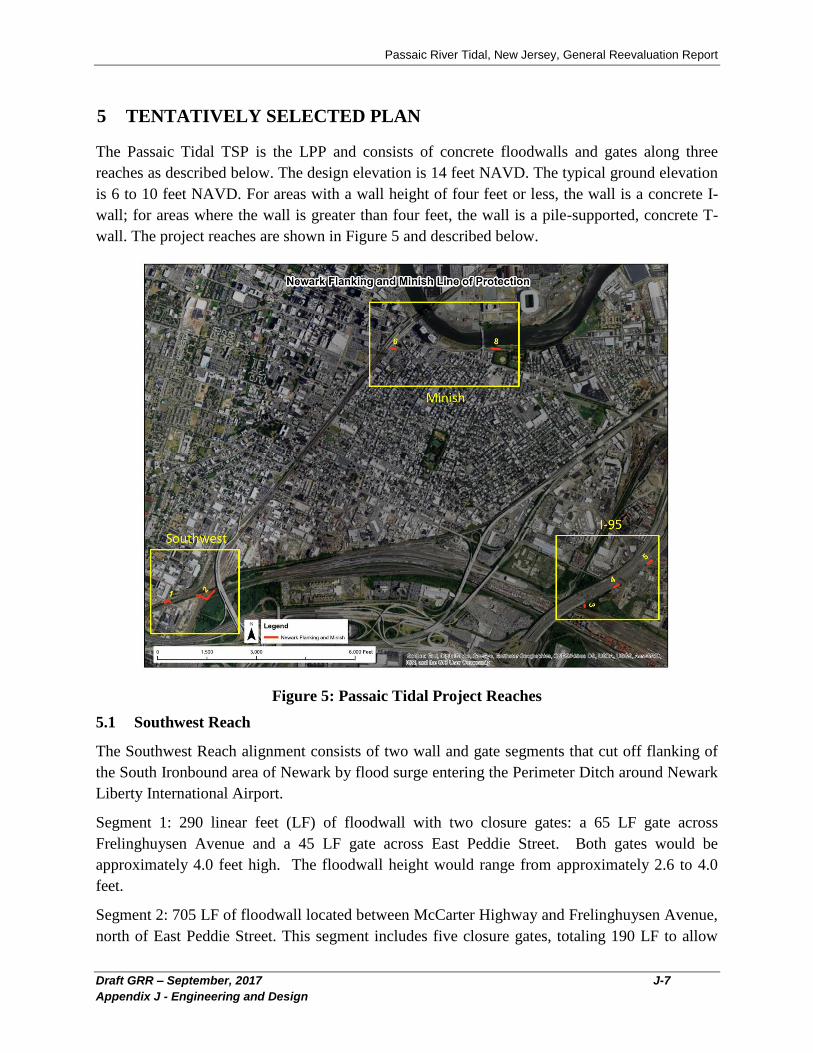
The Passaic Tidal TSP is the LPP and consists of concrete floodwalls and gates along three
reaches as described below. The design elevation is 14 feet NAVD. The typical ground elevation
is 6 to 10 feet NAVD. For areas with a wall height of four feet or less, the wall is a concrete I-
wall; for areas where the wall is greater than four feet, the wall is a pile-supported, concrete T-
wall. The project reaches are shown in Figure 5 and described below.
Figure 5: Passaic Tidal Project Reaches
5.1 Southwest Reach
The Southwest Reach alignment consists of two wall and gate segments that cut off flanking of
the South Ironbound area of Newark by flood surge entering the Perimeter Ditch around Newark
Liberty International Airport.
Segment 1: 290 linear feet (LF) of floodwall with two closure gates: a 65 LF gate across
Frelinghuysen Avenue and a 45 LF gate across East Peddie Street. Both gates would be
approximately 4.0 feet high. The floodwall height would range from approximately 2.6 to 4.0
feet.
Segment 2: 705 LF of floodwall located between McCarter Highway and Frelinghuysen Avenue,
north of East Peddie Street. This segment includes five closure gates, totaling 190 LF to allow
Passaic River Tidal, New Jersey, General Reevaluation Report
Draft GRR – September, 2017 J-8
Appendix J - Engineering and Design
passage along the numerous railroad tracks at this location. Floodwall and gate height along this
segment would vary from 4.8 to 8.2 feet.
5.2 I-95 Reach
The I-95 Reach includes three wall segments:
Segment 3: 139 LF of floodwall with a tide gate across an unnamed tidal creek just east of the
New Jersey Turnpike. The floodwall height of this segment will be a maximum of 9.4 feet. The
wall includes an outfall with a backflow prevention device.
Segment 4: 180 LF of floodwall across Delancy Street just east of the New Jersey Turnpike. The
closure gate across Delancy Street would be approximately 60 LF and the floodwall height
would range from approximately 4.1 to 4.8 feet.
Segment 5: 226 LF of floodwall across Wilson Avenue just east of the New Jersey Turnpike.
The closure gate across Wilson Ave would be approximately 60 LF and the floodwall height
would range from approximately 3.1 to 3.2 feet.
5.3 Minish Park Reach
The Minish Park Reach alignment includes one segment at Minish Park and one at Newark Penn
Station:
Segment 6: 204 LF of floodwall along Edison Place and across New Jersey Railroad Avenue at
Edison Place. The closure gate across NJRR Avenue would be approximately 24 LF and the
height of the floodwall would range from approximately 0.9 to 3.1 feet.
Segment 8: 297 LF of floodwall along the side of the off ramp from Raymond Blvd to Jackson
Street. This segment boarders the sidewalk adjacent to Riverfront Park and would have a height
ranging from approximately 1.3 to 3.4 feet.
The total LPP alignment length is approximately 2,040 LF feet and includes 8 closure gates and
a tidal culvert. Interior drainage features have not yet been identified.
6 HYDROLOGY AND HYDRAULICS
A summary of the hydrologic and hydraulic analyses completed as part of the general
reevaluation is included in Section 6. The analyses are presented in detail in Appendix B,
Hydrology and Hydraulics.
6.1 Passaic River and Newark Bay Stillwater
The Project is located near the mouth of the Passaic River and Hackensack River, and includes
parts of Newark Bay in New Jersey. Stillwater Elevation (SWL) data were obtained from the
recent North Atlantic Comprehensive Coastal Study (NACCS) coastal surge model.

Passaic River Tidal, New Jersey, General Reevaluation Report
Draft GRR – September, 2017 J-9
Appendix J - Engineering and Design
The NACCS model, finalized in 2015, computed the coastal storm hazard for the east coast
region from Maine to Virginia as a primary requirement for the NACCS project performance
evaluation. The primary focus was on storm winds, waves and water levels along the coast for
both tropical and extra-tropical storm events. The method for computing winds, waves and
water levels was to apply a suite of high-fidelity numerical models within the Coastal Storm
Modeling System. The storm events included in the model included over 1,000 synthetic
tropical events and 100 extra-tropical events computed at over 3 million computational locations.
The water levels were modeled to include the effects of storm surge, waves, and tides. The
NACCS model is discussed in more detail in the Hydrology and Hydraulics (H&H) Appendix.
The stage frequency curve for the Passaic Tidal project area is shown in Table 2.
Table 2: NACCS SWL Stage versus Frequency
SWL
Year Prob. (feet NAVD)
2-yr 0.5 5.8
5-yr 0.2 7.0
10-yr 0.1 7.9
20-yr 0.05 8.9
50-yr 0.02 10.4
100-yr 0.01 11.8
200-yr 0.005 13.2
500-yr 0.002 14.8
6.2 Waves and Overtopping
The study area is the shoreline along the Passaic River as it converges with the Hackensack
River and flows into Newark Bay, in addition to a section of the shoreline of the Hackensack
River at the same confluence. This area occupies parts of Hudson and Essex counties in New
Jersey. The 1995 and 2013 studies did not consider wave runup or wave overtopping. Wave
runup refers to the height above the water surface elevation reached by the swash. Runup is a
complex phenomenon known to depend on the incident wave conditions (height, period,
steepness, direction), and the nature of the beach, levee or wall being run up (e.g. slope,
reflectivity, height, permeability, roughness). Wave overtopping refers to the volumetric rate at
which runup flows over the top or crest of a slope the beach, levee, or vertical wall.
If not accounted for in the design, wave runup and overtopping may result in levee slope erosion
and possible levee/wall failure. Levees are often designed to limit wave overtopping below a
certain wave overtopping threshold.
The project coastline was segmented into 13 parts according to alignment and fetch exposure and
the segments are labeled in Figure 6. Levee/floodwall segments 10, 11, and 12 have exposures to
the long fetches across Newark Bay, and are assumed to be most susceptible to runup and
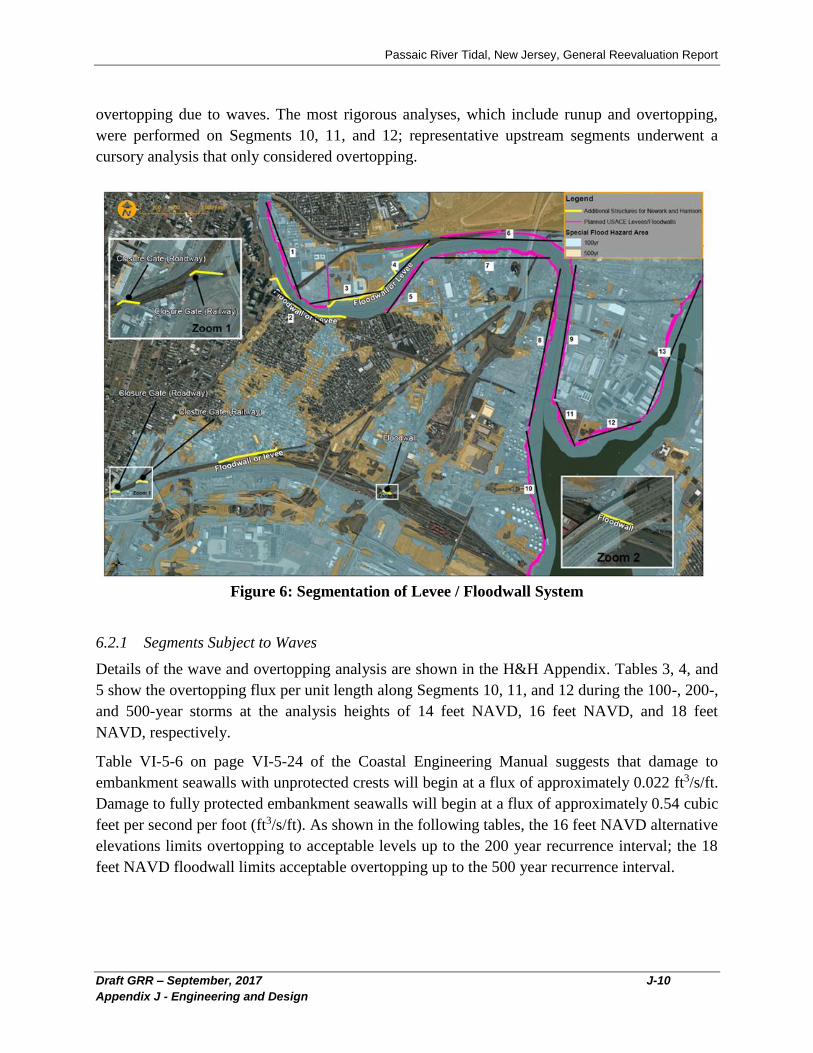
Passaic River Tidal, New Jersey, General Reevaluation Report
Draft GRR – September, 2017 J-10
Appendix J - Engineering and Design
overtopping due to waves. The most rigorous analyses, which include runup and overtopping,
were performed on Segments 10, 11, and 12; representative upstream segments underwent a
cursory analysis that only considered overtopping.
Figure 6: Segmentation of Levee / Floodwall System
6.2.1 Segments Subject to Waves
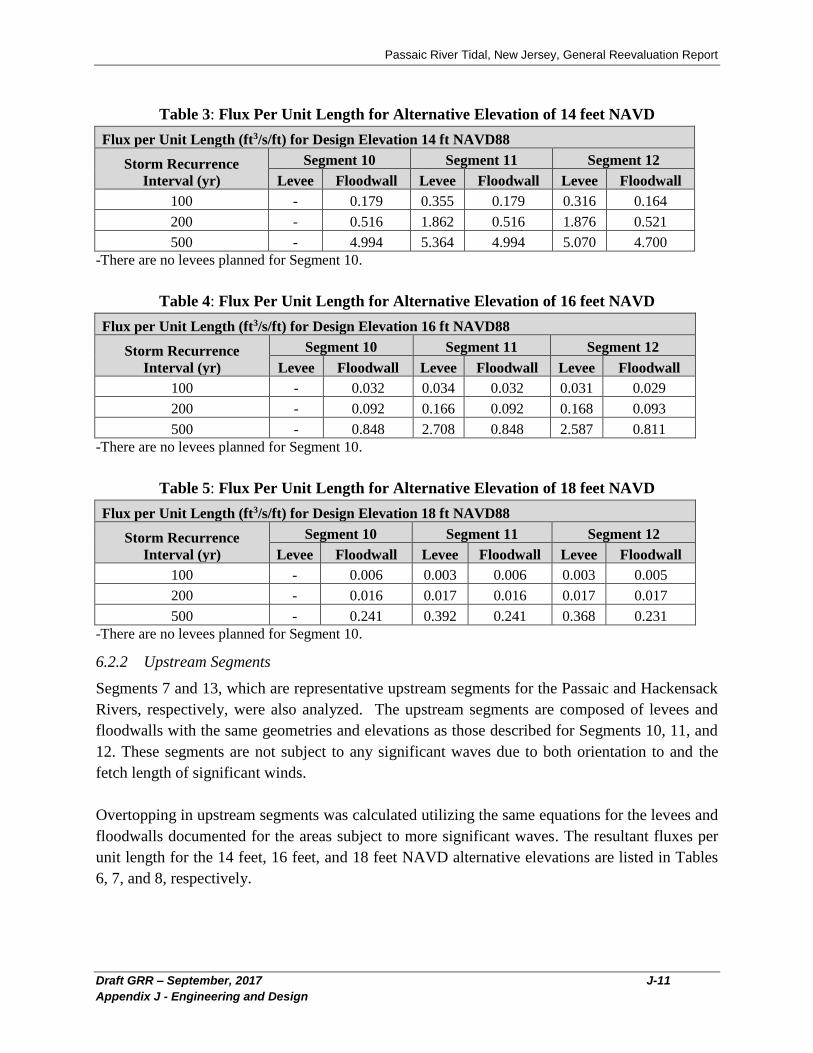
Details of the wave and overtopping analysis are shown in the H&H Appendix. Tables 3, 4, and
5 show the overtopping flux per unit length along Segments 10, 11, and 12 during the 100-, 200-,
and 500-year storms at the analysis heights of 14 feet NAVD, 16 feet NAVD, and 18 feet
NAVD, respectively.
Table VI-5-6 on page VI-5-24 of the Coastal Engineering Manual suggests that damage to
embankment seawalls with unprotected crests will begin at a flux of approximately 0.022 ft3/s/ft.
Damage to fully protected embankment seawalls will begin at a flux of approximately 0.54 cubic
feet per second per foot (ft3/s/ft). As shown in the following tables, the 16 feet NAVD alternative
elevations limits overtopping to acceptable levels up to the 200 year recurrence interval; the 18
feet NAVD floodwall limits acceptable overtopping up to the 500 year recurrence interval.
Passaic River Tidal, New Jersey, General Reevaluation Report
Draft GRR – September, 2017 J-11
Appendix J - Engineering and Design
Table 3: Flux Per Unit Length for Alternative Elevation of 14 feet NAVD
Flux per Unit Length (ft3/s/ft) for Design Elevation 14 ft NAVD88
Storm Recurrence
Interval (yr)
Segment 10 Segment 11 Segment 12
Levee Floodwall Levee Floodwall Levee Floodwall
100 - 0.179 0.355 0.179 0.316 0.164
200 - 0.516 1.862 0.516 1.876 0.521
500 - 4.994 5.364 4.994 5.070 4.700
-There are no levees planned for Segment 10.
Table 4: Flux Per Unit Length for Alternative Elevation of 16 feet NAVD
Flux per Unit Length (ft3/s/ft) for Design Elevation 16 ft NAVD88
Storm Recurrence
Interval (yr)
Segment 10 Segment 11 Segment 12
Levee Floodwall Levee Floodwall Levee Floodwall
100 - 0.032 0.034 0.032 0.031 0.029
200 - 0.092 0.166 0.092 0.168 0.093
500 - 0.848 2.708 0.848 2.587 0.811
-There are no levees planned for Segment 10.
Table 5: Flux Per Unit Length for Alternative Elevation of 18 feet NAVD
Flux per Unit Length (ft3/s/ft) for Design Elevation 18 ft NAVD88
Storm Recurrence
Interval (yr)
Segment 10 Segment 11 Segment 12
Levee Floodwall Levee Floodwall Levee Floodwall
100 - 0.006 0.003 0.006 0.003 0.005
200 - 0.016 0.017 0.016 0.017 0.017
500 - 0.241 0.392 0.241 0.368 0.231
-There are no levees planned for Segment 10.
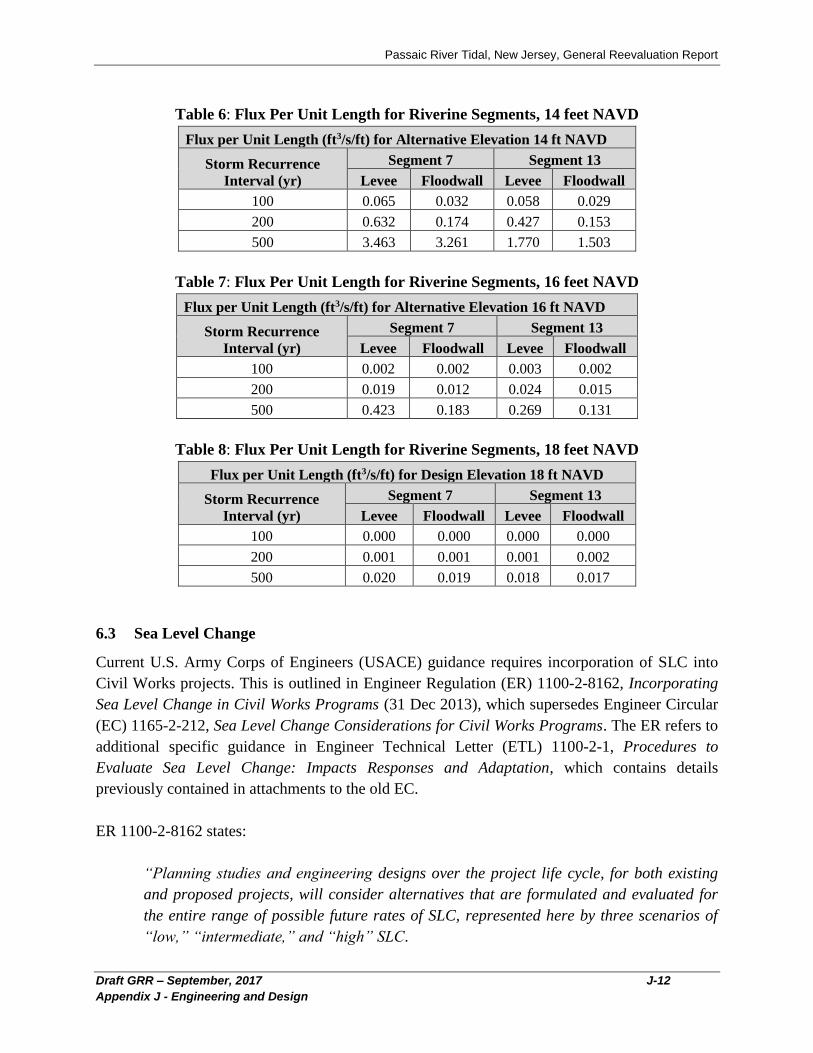
6.2.2 Upstream Segments
Segments 7 and 13, which are representative upstream segments for the Passaic and Hackensack
Rivers, respectively, were also analyzed. The upstream segments are composed of levees and
floodwalls with the same geometries and elevations as those described for Segments 10, 11, and
12. These segments are not subject to any significant waves due to both orientation to and the
fetch length of significant winds.
Overtopping in upstream segments was calculated utilizing the same equations for the levees and
floodwalls documented for the areas subject to more significant waves. The resultant fluxes per
unit length for the 14 feet, 16 feet, and 18 feet NAVD alternative elevations are listed in Tables
6, 7, and 8, respectively.
Passaic River Tidal, New Jersey, General Reevaluation Report
Draft GRR – September, 2017 J-12
Appendix J - Engineering and Design
Table 6: Flux Per Unit Length for Riverine Segments, 14 feet NAVD
Flux per Unit Length (ft3/s/ft) for Alternative Elevation 14 ft NAVD
Storm Recurrence
Interval (yr)
Segment 7 Segment 13
Levee Floodwall Levee Floodwall
100 0.065 0.032 0.058 0.029
200 0.632 0.174 0.427 0.153
500 3.463 3.261 1.770 1.503
Table 7: Flux Per Unit Length for Riverine Segments, 16 feet NAVD
Flux per Unit Length (ft3/s/ft) for Alternative Elevation 16 ft NAVD
Storm Recurrence
Interval (yr)
Segment 7 Segment 13
Levee Floodwall Levee Floodwall
100 0.002 0.002 0.003 0.002
200 0.019 0.012 0.024 0.015
500 0.423 0.183 0.269 0.131
Table 8: Flux Per Unit Length for Riverine Segments, 18 feet NAVD
Flux per Unit Length (ft3/s/ft) for Design Elevation 18 ft NAVD
Storm Recurrence
Interval (yr)
Segment 7 Segment 13
Levee Floodwall Levee Floodwall
100 0.000 0.000 0.000 0.000
200 0.001 0.001 0.001 0.002
500 0.020 0.019 0.018 0.017
6.3 Sea Level Change
Current U.S. Army Corps of Engineers (USACE) guidance requires incorporation of SLC into
Civil Works projects. This is outlined in Engineer Regulation (ER) 1100-2-8162, Incorporating
Sea Level Change in Civil Works Programs (31 Dec 2013), which supersedes Engineer Circular
(EC) 1165-2-212, Sea Level Change Considerations for Civil Works Programs. The ER refers to
additional specific guidance in Engineer Technical Letter (ETL) 1100-2-1, Procedures to
Evaluate Sea Level Change: Impacts Responses and Adaptation, which contains details
previously contained in attachments to the old EC.
ER 1100-2-8162 states:
“Planning studies and engineering designs over the project life cycle, for both existing
and proposed projects, will consider alternatives that are formulated and evaluated for
the entire range of possible future rates of SLC, represented here by three scenarios of
“low,” “intermediate,” and “high” SLC.
Passaic River Tidal, New Jersey, General Reevaluation Report
Draft GRR – September, 2017 J-13
Appendix J - Engineering and Design
…Once the three rates have been estimated, the next step is to determine how sensitive
alternative plans and designs are to these rates of future local mean SLC, how this
sensitivity affects calculated risk, and what design or operations and maintenance
measures should be implemented to adapt to SLC to minimize adverse consequences
while maximizing beneficial effects.”
Based on an expected project life of 50 years, SLC must be calculated for 2070 conditions from a
base year of 2020. USACE issued ER 1100-2-8162, Incorporating Sea Level Change in Civil
Works Programs. This ER spells out how SLC is to be computed and incorporated into levee
height calculations. To assist in the calculation of SLC mandated by ER 1100-2-8162, USACE
has created a tool to assist with the calculations. The tool is located at the website
http://www.corpsclimate.us/ccaceslcurves.cfm. This website uses information from ER 1100-2-
8162 and National Oceanic and Atmospheric Administration (NOAA) Technical Report OAR
CPO-1, Global Sea Level Rise Scenarios for the United States National Climate Assessment
published in December 2012. For the Newark Bay area, the Sandy Hook, New Jersey gauge was
used.
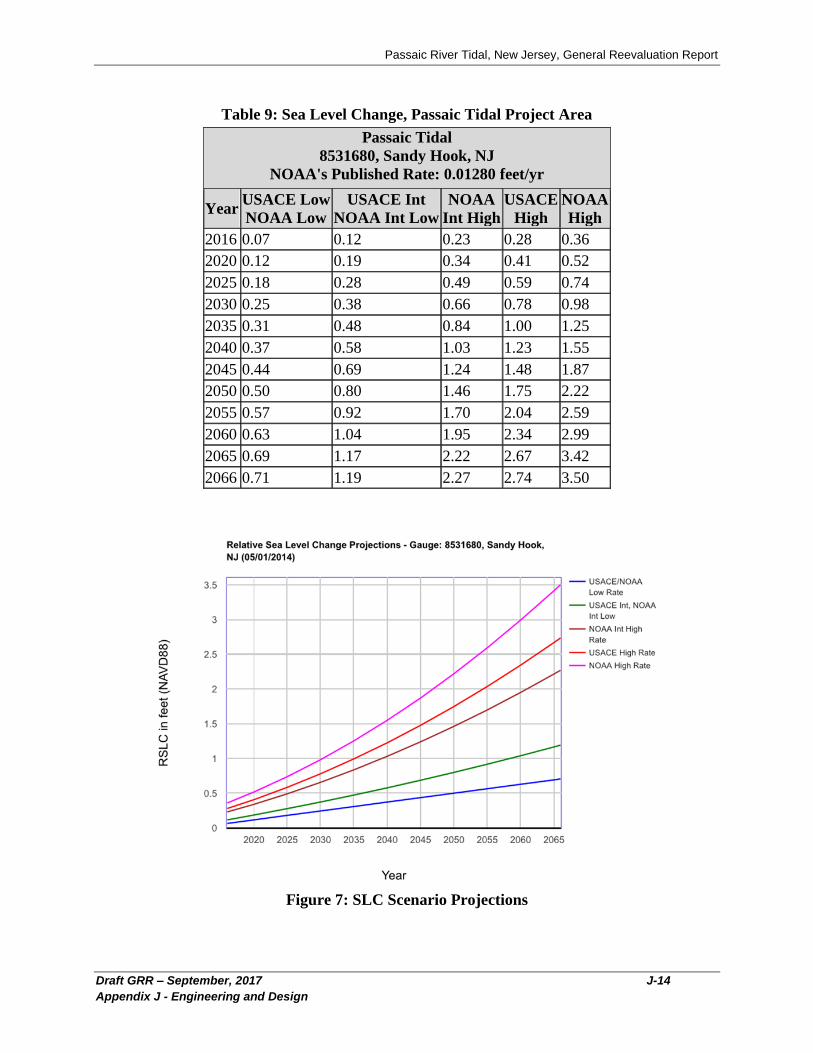
The generated curves are based on USACE and NOAA equations at a low, intermediate, and
high level. The output for the USACE and NOAA equations can be seen in Table 9. The
program also plots a chart of the sea level curves as seen in Figure 7. SLC is discussed in more
detail in the H&H Appendix.
The inclusion of SLC affects the design height performance and reliability, which can be
evaluated using the probability of non-exceedance (PNE). The PNE is discussed later in the
appendix.
Passaic River Tidal, New Jersey, General Reevaluation Report
Draft GRR – September, 2017 J-14
Appendix J - Engineering and Design
Table 9: Sea Level Change, Passaic Tidal Project Area
Passaic Tidal
8531680, Sandy Hook, NJ
NOAA's Published Rate: 0.01280 feet/yr
Year USACE Low
NOAA Low
USACE Int
NOAA Int Low
NOAA
Int High
USACE
High
NOAA
High
2016 0.07 0.12 0.23 0.28 0.36
2020 0.12 0.19 0.34 0.41 0.52
2025 0.18 0.28 0.49 0.59 0.74
2030 0.25 0.38 0.66 0.78 0.98
2035 0.31 0.48 0.84 1.00 1.25
2040 0.37 0.58 1.03 1.23 1.55
2045 0.44 0.69 1.24 1.48 1.87
2050 0.50 0.80 1.46 1.75 2.22
2055 0.57 0.92 1.70 2.04 2.59
2060 0.63 1.04 1.95 2.34 2.99
2065 0.69 1.17 2.22 2.67 3.42
2066 0.71 1.19 2.27 2.74 3.50
Figure 7: SLC Scenario Projections
Passaic River Tidal, New Jersey, General Reevaluation Report
Draft GRR – September, 2017 J-15
Appendix J - Engineering and Design
6.4 Interior Drainage Analysis
As part of the GRR, the interior drainage plan for the GDM Plan (NED Plan) was remodeled and
evaluated. The plan included 160 outfalls and six pump stations. The plan was not reformulated;
therefore, interior drainage alternatives were not considered. The following is a description of the
general components of the interior drainage features.
1) Outfalls: There are 160 outfalls ranging in size from 24 to 60 inches. Each outfall,
whether new or an extension of an existing outfall, includes a sluice gate, backflow
prevention, and a catch basin structures.
2) Pump Stations: There are six pump stations in the interior drainage plan. They range from
30 to 100 cubic feet per second (cfs).
A detailed description of the interior drainage model and results for the NED Plan is provided in
the H&H Appendix. An interior drainage analysis for the LPP, the Flanking Plan, has not yet
been conducted. While estimated costs for interior drainage features have been included in the
LPP First Costs, interior drainage features have not yet been identified. The interior drainage
analysis for the LPP will be completed prior to the final GRR.
The interior drainage modeling completed for the GRR and described in this appendix was
accomplished using a much more robust software platform (HEC-HMS, v4.1) than the 1995
study. However, it was a remodeling effort only and not a re-optimization of interior drainage
features. Therefore, with the new model and more detailed topographic mapping, a more refined
interior drainage analysis can be achieved, possibly resulting in the removal (or addition) of one
or more of the proposed pump stations. The receipt of detailed utilities and stormwater network
information will also help refine the future interior drainage analysis.
7 GEOTECHNICAL ANALYSIS
For the geotechnical analysis, the 10.5 miles of line of protection were divided into the following
segments:
1) Lister/Turnpike/Doremus Levee/Floodwall in Newark
2) South First Street Levee/Flood Wall in Harrison
3) Kearny Point Levee/Floodwall in Kearny
The three design elevations of 14.0 feet NAVD, 16.0 feet NAVD, and 18.0 feet NAVD were
analyzed. The ground level along the levee/floodwall alignment varied from approximately 6
feet NAVD to 8 feet NAVD. Thus, the design height of the levee/floodwall sections was
considered from 6.0 feet to 12.0 feet. For the 2013 report for Harrison, the geotechnical analysis
of the prior, existing data was updated based on the then-revised line of protection (LOP) height
of 16.0 feet NAVD. The results of the latest geotechnical analyses are summarized below and are
discussed in more detail in Attachment 1 – Geotechnical Report.
Passaic River Tidal, New Jersey, General Reevaluation Report
Draft GRR – September, 2017 J-16
Appendix J - Engineering and Design
Detailed analyses were not conducted for the Flanking Plan alignments, which are located inland
from the shoreline. However, to be conservative, the preliminary results of the geotechnical
analysis were considered applicable to these locations. More site specific analyses for the
Flanking Plan elements will be conducted prior to the final report.
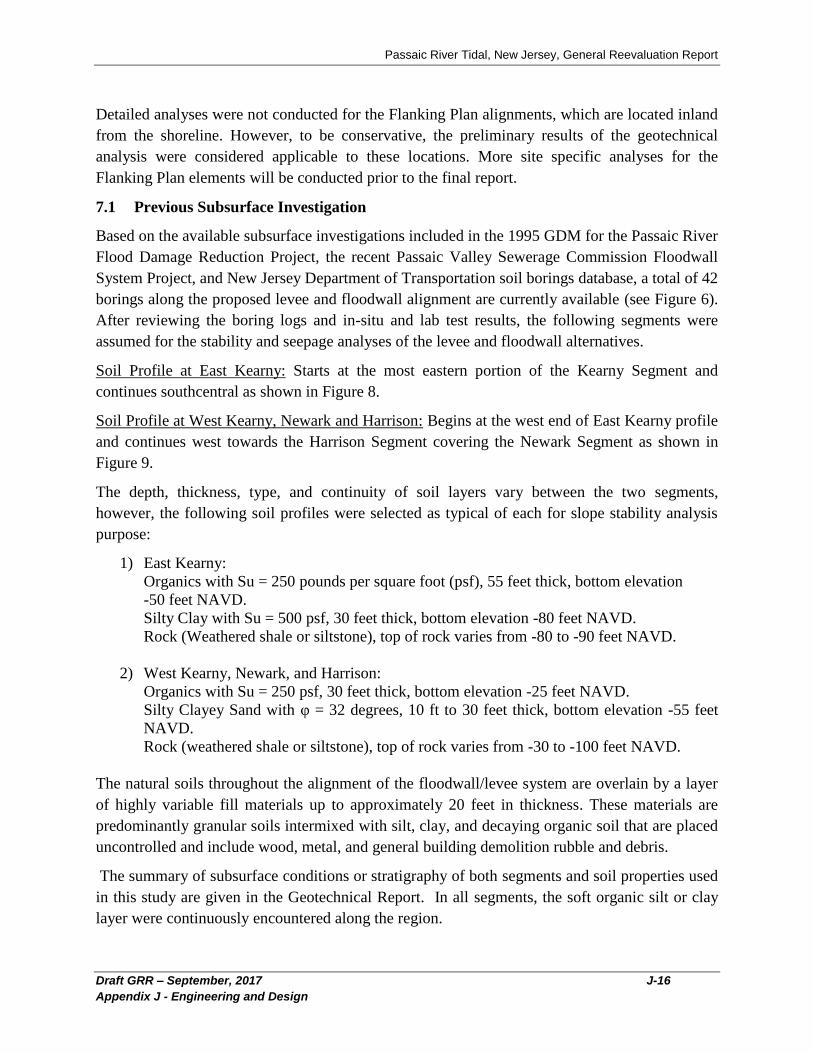
7.1 Previous Subsurface Investigation
Based on the available subsurface investigations included in the 1995 GDM for the Passaic River
Flood Damage Reduction Project, the recent Passaic Valley Sewerage Commission Floodwall
System Project, and New Jersey Department of Transportation soil borings database, a total of 42
borings along the proposed levee and floodwall alignment are currently available (see Figure 6).
After reviewing the boring logs and in-situ and lab test results, the following segments were
assumed for the stability and seepage analyses of the levee and floodwall alternatives.
Soil Profile at East Kearny: Starts at the most eastern portion of the Kearny Segment and
continues southcentral as shown in Figure 8.
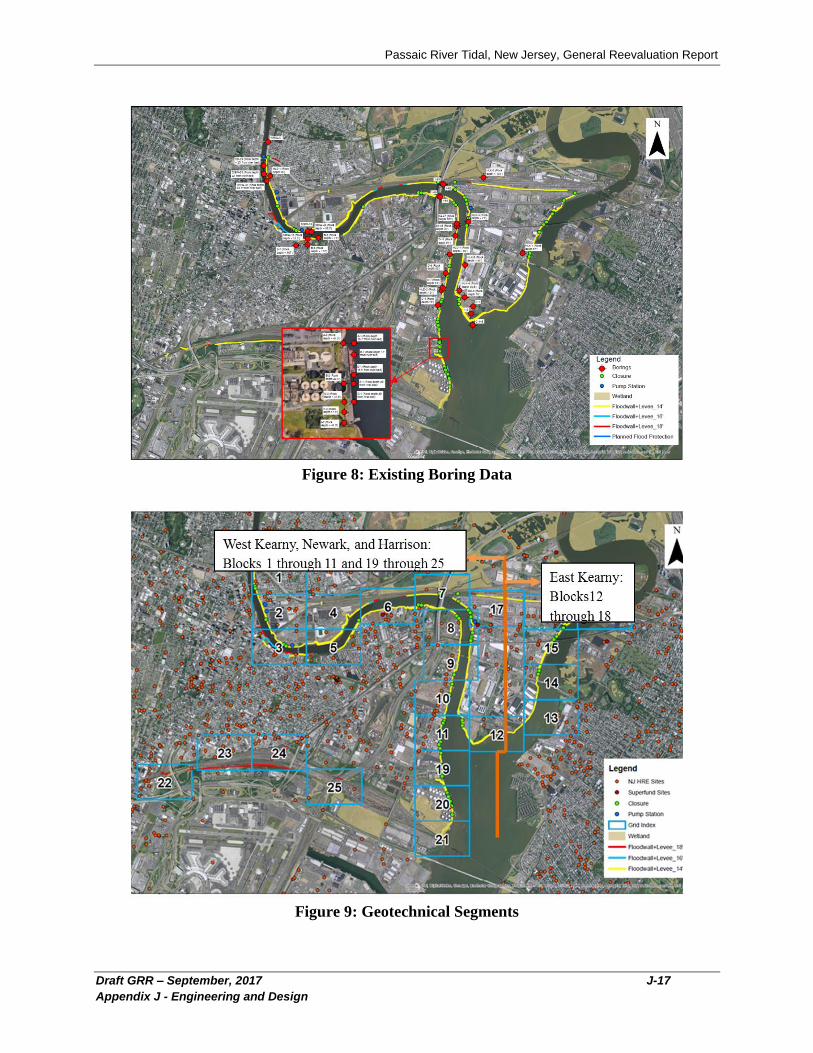
Soil Profile at West Kearny, Newark and Harrison: Begins at the west end of East Kearny profile
and continues west towards the Harrison Segment covering the Newark Segment as shown in
Figure 9.
The depth, thickness, type, and continuity of soil layers vary between the two segments,
however, the following soil profiles were selected as typical of each for slope stability analysis
purpose:
1) East Kearny:
Organics with Su = 250 pounds per square foot (psf), 55 feet thick, bottom elevation
-50 feet NAVD.
Silty Clay with Su = 500 psf, 30 feet thick, bottom elevation -80 feet NAVD.
Rock (Weathered shale or siltstone), top of rock varies from -80 to -90 feet NAVD.
2) West Kearny, Newark, and Harrison:
Organics with Su = 250 psf, 30 feet thick, bottom elevation -25 feet NAVD.
Silty Clayey Sand with φ = 32 degrees, 10 ft to 30 feet thick, bottom elevation -55 feet
NAVD.
Rock (weathered shale or siltstone), top of rock varies from -30 to -100 feet NAVD.
The natural soils throughout the alignment of the floodwall/levee system are overlain by a layer
of highly variable fill materials up to approximately 20 feet in thickness. These materials are
predominantly granular soils intermixed with silt, clay, and decaying organic soil that are placed
uncontrolled and include wood, metal, and general building demolition rubble and debris.
The summary of subsurface conditions or stratigraphy of both segments and soil properties used
in this study are given in the Geotechnical Report. In all segments, the soft organic silt or clay
layer were continuously encountered along the region.
Passaic River Tidal, New Jersey, General Reevaluation Report
Draft GRR – September, 2017 J-17
Appendix J - Engineering and Design
Figure 8: Existing Boring Data
Figure 9: Geotechnical Segments
Passaic River Tidal, New Jersey, General Reevaluation Report
Draft GRR – September, 2017 J-18
Appendix J - Engineering and Design
7.2 Preliminary Information and Assumptions
The preliminary information and assumptions made in the geotechnical analysis are summarized
below:
1) The analyses and calculations performed as part of this study are preliminary in nature
and all estimates were based on limited available data. The new subsurface investigation
and laboratory testing program as recommended later in this section are necessary to
meet USACE requirements for final design.
2) A layer of highly variable fill materials up to approximately 20 feet in thickness exists in
the area of protection. The fill material is intermixed with silt, clay, and decaying organic
soil that are placed uncontrolled and include wood, metal, and general building
demolition rubble and debris.
3) For pile depth calculations, rock depths vary along the line of protection but pile lengths
are assumed to be conservative (exceeding 100 feet in some locations).
7.3 Levee Construction Determination
Due to the presence of organic soils along the previously designed levee segments, excavation
and backfill of foundation material would be required in order to provide adequate stability for
the levee segments. Furthermore, liquefaction mitigation may be required pending further
geotechnical analysis. Therefore, based on the extreme uncertainty in levee foundation design
parameters and anticipated access limitations, all levee segments in the previous 1995 GDM
design were replaced with floodwall segments. The details of the levee analysis are included in
Attachment 1.
7.4 Floodwall Geotechnical Analysis
Because much of the proposed line of protection does not have adequate space or adequate
foundation for levee construction, a floodwall alternative is considered in those reaches. Due to
the unsatisfactory Factor of Safety obtained for a levee over 6 feet high and also the need to
remove unsuitable and uncontrolled existing fill material with varying thickness as discussed
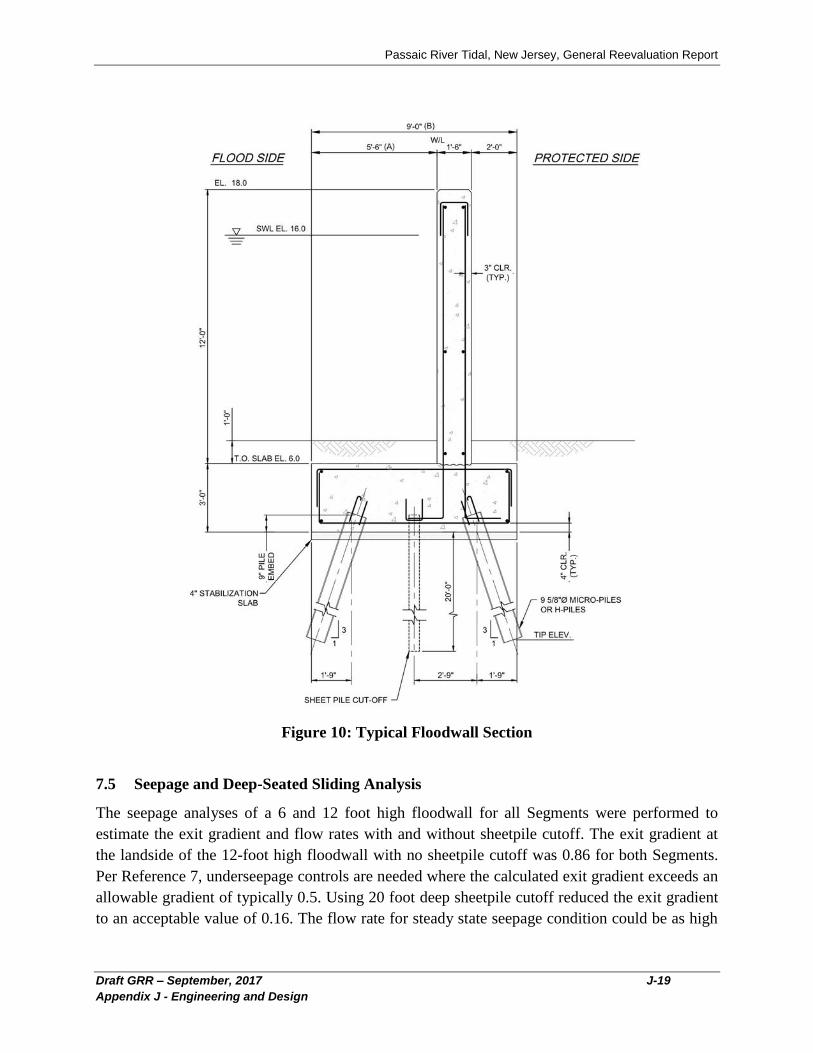
above, the floodwall alternative was considered for the entirety of each reach. A typical section
of floodwall with sheetpile cutoff is shown in Figure 10.
Passaic River Tidal, New Jersey, General Reevaluation Report
Draft GRR – September, 2017 J-19
Appendix J - Engineering and Design
Figure 10: Typical Floodwall Section
7.5 Seepage and Deep-Seated Sliding Analysis
The seepage analyses of a 6 and 12 foot high floodwall for all Segments were performed to
estimate the exit gradient and flow rates with and without sheetpile cutoff. The exit gradient at
the landside of the 12-foot high floodwall with no sheetpile cutoff was 0.86 for both Segments.
Per Reference 7, underseepage controls are needed where the calculated exit gradient exceeds an
allowable gradient of typically 0.5. Using 20 foot deep sheetpile cutoff reduced the exit gradient
to an acceptable value of 0.16. The flow rate for steady state seepage condition could be as high
Passaic River Tidal, New Jersey, General Reevaluation Report
Draft GRR – September, 2017 J-20
Appendix J - Engineering and Design
as 14 gallons/day per foot length of the wall. The details of floodwall seepage analyses are
provided in Attachment 1.
Deep-seated sliding analysis was performed to check the sliding within weak layers beneath the
sheetpile. The vertical water pressure due to the flood was conservatively assumed to be a
surcharge load on the ground surface. The minimum global stability safety factor obtained for
the critical slipping surface is 1.50 which meets the minimum required value per EM 1110-2-
2502 (Reference 7). In this analysis the lateral resistances of the foundation piles and sheetpile
were conservatively neglected.
7.6 Pile Bearing Capacity
Pile capacity analyses were performed on two different pile options: H-Piles (HP14x73) and
Caissons or Micropiles with 8 and 12 inch diameter rock sockets. ENSOFT Software “APILE”
was utilized for axial capacity analyses on driven H-piles. To be conservative, skin resistance for
the top 10 feet of the piles was eliminated. Downdrag effects were ignored due to limited
information and will be considered based on the results of additional borings and lab tests.
The compression and tension capacities of rock sockets for caissons were calculated using the
spreadsheets with details as provided in Attachment 1.
7.7 Pile Foundation Recommendations
Due to the existing soft or organic soil, proposed piles will be advanced to a stiffer or denser soil
stratum to achieve required compression and tension capacities. Based on the soil stratification
and results of the pile capacity analysis, an 80 foot long H-Pile (HP14x73) bearing on silty clay
can provide an ultimate compression and uplift capacity of approximately 95 kips at the East
Kearny Segment. In West Kearny, Newark, and Harrison Segment, a 60 foot long H-Pile
bearing on silty clayey sand can provide approximately 110 kips of ultimate compression
capacity and 100 kips of ultimate uplift capacity. For H-Piles bearing on a competent rock the
ultimate compression capacity will be determined by structural capacity with the limit of 200
kips.
The allowable compression and tension capacities of 20 foot long (12-inch O.D.) rock socket for
Caissons/Micropiles were estimated 240 and 150 tons, respectively.
The final design will include a study of pile group effect and pile deflections under lateral,
compression, and uplift loads, and potential downdrag effects.
7.8 Recommendations
In order to obtain a better understanding of the subsurface condition and more accurate
engineering and physical soil properties, additional field investigation and lab testing need to be
performed for the final design. The following are recommendations for additional analyses to
support final design:
Passaic River Tidal, New Jersey, General Reevaluation Report
Draft GRR – September, 2017 J-21
Appendix J - Engineering and Design
1) Additional soil borings will be performed, typically at every 200 to 300 feet. Soil profiles
typically with three borings in the traverse directions perpendicular to the levee-floodwall
alignment in each cross-section need to be developed. At least one test boring for each
soil profile should be drilled to a depth of bedrock or 100 feet for seismic site
classification purpose.
2) Additional disturbed and undisturbed samples are needed for soil properties interpretation
purposes.
3) Additional grain size analysis, unconsolidated-undrained test and consolidation tests need
to be performed.
4) It is also recommended that seismic cone penetration test soundings be performed for
every eight borings to obtain shear wave velocity of the subsurface soils. Seismic CPTs
may assist to better define the site class, shear wave velocity, and liquefaction potential of
the site.
5) Field permeability and/or field pumping test will be performed, as necessary, for
permeability estimation.
8 SURVEYING, MAPPING AND OTHER GEOSPATIAL DATA
Terrain data used to update the alignment was developed from 2012 LiDAR collected for the
USACE NACCS. The vertical datum for this study is the North American Vertical Datum of
1988 (NAVD). Horizontal datum is North American Datum of 1983 (NAD83).
9 FLOODWALL DESIGN
9.1 General
The design elements defined herein represent a preliminary design (i.e., 30-percent level) using
the best available information. The structural analysis was limited to stability. Pile foundations
provide stability against overturning, sliding and flotation resistance. Soil conditions along this
reach of the Passaic River were divided into two reaches, East Kearny and West Kearny (which
includes Harrison and Newark). The elevation of the bedrock was assumed based on current
limited information (see Section 7 – Geotechnical Analysis); pile lengths must be refined as
more soil data becomes available.
Micro piles and H-Piles were considered in Typical T-wall reaches. Design calculations for the
structural analysis can be found in Attachment 2. For cost comparison purposes, three wall
heights were considered: Top of Wall (TOW) elevations at 18.0 feet NAVD, 16.0 feet NAVD
and 14.0 feet NAVD. For the structural calculations, the SWL was assumed to be 2 feet below
the TOW elevation. The typical ground elevation was assumed to be 6 feet NAVD throughout
the project.
Passaic River Tidal, New Jersey, General Reevaluation Report
Draft GRR – September, 2017 J-22
Appendix J - Engineering and Design
9.2 Codes and Standards
The following is an abbreviated list of general USACE references, and industry codes and
standards which are applicable to structural and foundation design for this preliminary design
effort. Additional codes must be referenced for the final construction Plans & Specifications.
Considered in this design are:
1) AASHTO, American Association of State Highway and Transportation Officials, LRFD
Bridge Design 7th Edition, 2014.
2) ACI 318-14 American Concrete Institute, Building Code Requirements for Structural
Concrete.
3) ACI 350-06 American Concrete Institute, Environmental Engineering Concrete
Structures.
4) AISC, American Institute of Steel Construction, Inc., Manual of Steel Construction, 14th
Edition.
5) ASCE 7-10 American Society of Civil Engineers, Minimum Design Loads for Buildings
and Other Structures.
6) ASTM, American Society for Testing and Materials.
7) AWS D1.1-15 American Welding Society, Structural Welding Code, latest edition.
8) UFC 3-201-01, Civil Engineering.
9) USACE EM 1110-2-2104, Strength Design for Reinforced Concrete Hydraulic
Structures.
10) USACE EM 1110-2-2502, Retaining and Flood Walls.
11) USACE EM 1110-2-2906, Design of Pile Foundations.
12) USACE EM 1110-2-2909, Conduits, Culverts and Pipes.
13) USACE ETL 1110-2-584, Design of Hydraulic Steel Structures.
14) USACE ETL 1110-2-575, Evaluation of I-Walls.
9.3 General Design Load Parameters
9.3.1 Load Combinations
The preliminary design includes four Basic Load Cases; these are the loadings that typically
control floodwall designs. Other loadings must also be analyzed in the final design, including
Seismic Load Cases for both Operating and Maximum Earthquake conditions. Additionally,
sufficient hydraulic modeling should be performed as part of the future design to establish wave
properties and forces. Typically, on inland waterways, when the wall is overbuilt to include
Passaic River Tidal, New Jersey, General Reevaluation Report
Draft GRR – September, 2017 J-23
Appendix J - Engineering and Design
uncertainty and sea-level rise the static head to top of wall is similar in force to that imparted by
a wave; sufficiently close for this conceptual design. The load cases included in the design are
shown below. Detailed load calculations are shown in Attachment 2.
1a. Construction. Dead load of the concrete wall components, no earthen backfill, no
uplift. (A 17 percent overstress is permitted for this load case)
1b. Construction with Wind. Dead load of the concrete wall components, no earthen
backfill, no uplift; a conservative wind load of 50 psf is applied to the wall stem. ( A 33 percent
overstress is permitted for this load case.)
2a. Flood Stage at Still Water, Impervious Cutoff. Dead load of concrete wall, At-Rest
lateral earth pressures, and hydrostatic loading for water to the SWL; Uplift forces assume the
sheet pile to be impervious. Wave force is not included.
2b. Flood Stage at Still Water, Pervious Cutoff. Dead load of concrete wall, At-Rest
lateral earth pressures, and hydrostatic loading for water to the SWL; Uplift forces assume the
sheet pile to be pervious varying linearly from flood side SWL to the ground water elevation on
the Protected Side. Wave force is not included.
3a. Flood Stage with Water to Top of Wall, Impervious Cutoff. Dead load of concrete
wall, At-Rest lateral earth pressures, and hydrostatic loading for water to the TOW; Uplift forces
assume the sheet pile to be impervious. Wave force is not included. (A 33 percent overstress is
permitted.)
3b. Flood Stage with Water to Top of Wall, Pervious Cutoff. Dead load of concrete
wall, At-Rest lateral earth pressures, and hydrostatic loading for water to the TOW; Uplift forces
assume the sheet pile to be pervious varying linearly from flood side TOW elevation to the
ground water elevation on the Protected Side. Wave force is not included. ( )4a. Flood Stage at
Still Water, Debris Impact Load, Impervious Cutoff. Loadilude: Dead load of concrete wall, At-
Rest lateral earth pressures, and hydrostatic loading for water to the SWL. Uplift forces assume
the sheet pile to be impervious. A debris load of 500 pounds per linear foot is applied at the
SWL. Wave force is not included. (A 33 percent overstress is permitted.)
The overstress factors listed in each load case above reflect the stress levels permitted in the
HSDRRS design guidance that was developed for the New Orleans District post-Katrina and
considered applicable for this flood protection project. The overstress was used to normalize
loads in the calculations found in Appendices 2 and 3. In the Detailed Design the load factors
found in EM 1110-2-2104 for concrete design and ETL 1110-2-584 for steel design shall be used
in lieu of the overstress.
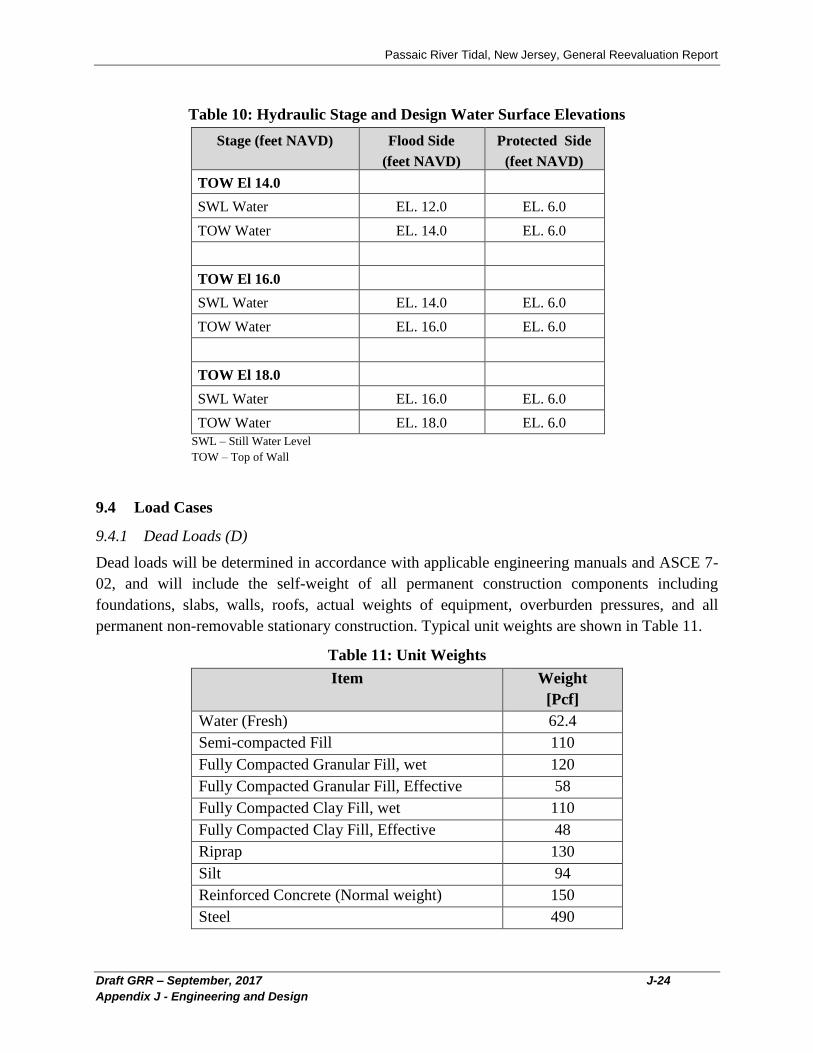
9.3.2 Hydraulic Stages
Water and ground surface elevations for the structural analysis are shown in Table 10.
Passaic River Tidal, New Jersey, General Reevaluation Report
Draft GRR – September, 2017 J-24
Appendix J - Engineering and Design
Table 10: Hydraulic Stage and Design Water Surface Elevations
Stage (feet NAVD) Flood Side
(feet NAVD)
Protected Side
(feet NAVD)
TOW El 14.0
SWL Water EL. 12.0 EL. 6.0
TOW Water EL. 14.0 EL. 6.0
TOW El 16.0
SWL Water EL. 14.0 EL. 6.0
TOW Water EL. 16.0 EL. 6.0
TOW El 18.0
SWL Water EL. 16.0 EL. 6.0
TOW Water EL. 18.0 EL. 6.0
SWL – Still Water Level
TOW – Top of Wall
9.4 Load Cases
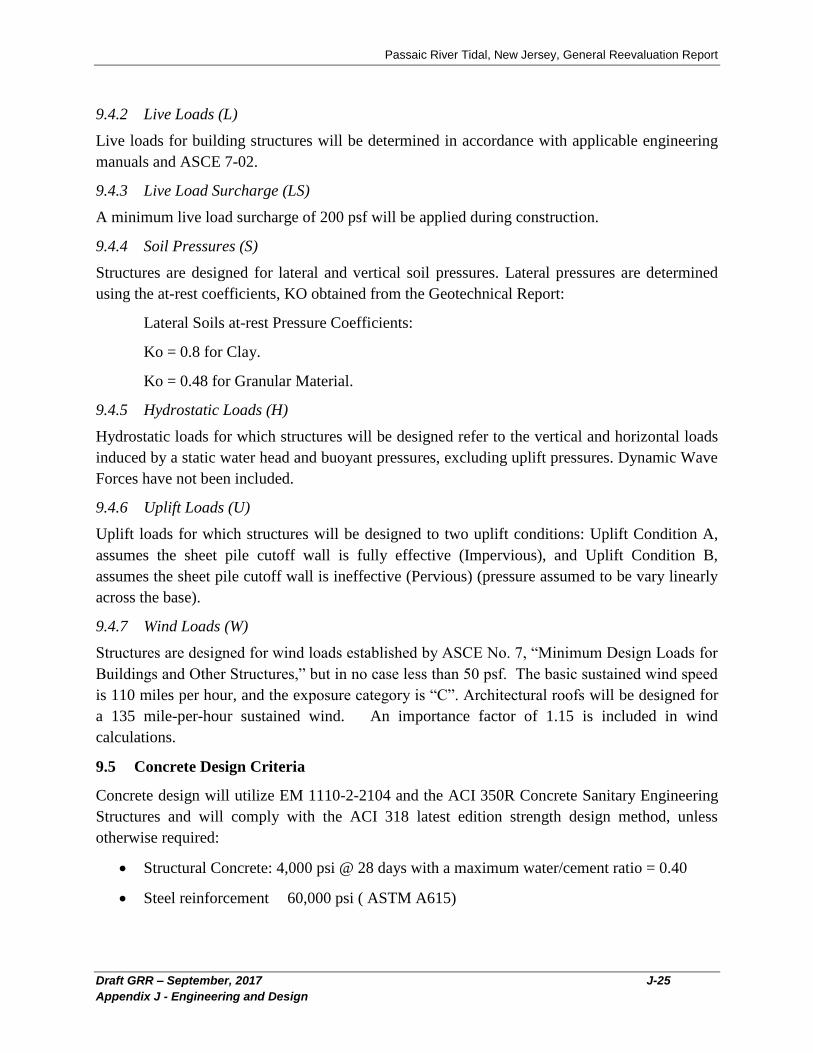
9.4.1 Dead Loads (D)
Dead loads will be determined in accordance with applicable engineering manuals and ASCE 7-
02, and will include the self-weight of all permanent construction components including
foundations, slabs, walls, roofs, actual weights of equipment, overburden pressures, and all
permanent non-removable stationary construction. Typical unit weights are shown in Table 11.
Table 11: Unit Weights
Item Weight
[Pcf]
Water (Fresh) 62.4
Semi-compacted Fill 110
Fully Compacted Granular Fill, wet 120
Fully Compacted Granular Fill, Effective 58
Fully Compacted Clay Fill, wet 110
Fully Compacted Clay Fill, Effective 48
Riprap 130
Silt 94
Reinforced Concrete (Normal weight) 150
Steel 490
Passaic River Tidal, New Jersey, General Reevaluation Report
Draft GRR – September, 2017 J-25
Appendix J - Engineering and Design
9.4.2 Live Loads (L)
Live loads for building structures will be determined in accordance with applicable engineering
manuals and ASCE 7-02.
9.4.3 Live Load Surcharge (LS)
A minimum live load surcharge of 200 psf will be applied during construction.
9.4.4 Soil Pressures (S)
Structures are designed for lateral and vertical soil pressures. Lateral pressures are determined
using the at-rest coefficients, KO obtained from the Geotechnical Report:
Lateral Soils at-rest Pressure Coefficients:
Ko = 0.8 for Clay.
Ko = 0.48 for Granular Material.
9.4.5 Hydrostatic Loads (H)
Hydrostatic loads for which structures will be designed refer to the vertical and horizontal loads
induced by a static water head and buoyant pressures, excluding uplift pressures. Dynamic Wave
Forces have not been included.
9.4.6 Uplift Loads (U)
Uplift loads for which structures will be designed to two uplift conditions: Uplift Condition A,
assumes the sheet pile cutoff wall is fully effective (Impervious), and Uplift Condition B,
assumes the sheet pile cutoff wall is ineffective (Pervious) (pressure assumed to be vary linearly
across the base).
9.4.7 Wind Loads (W)
Structures are designed for wind loads established by ASCE No. 7, “Minimum Design Loads for
Buildings and Other Structures,” but in no case less than 50 psf. The basic sustained wind speed
is 110 miles per hour, and the exposure category is “C”. Architectural roofs will be designed for
a 135 mile-per-hour sustained wind. An importance factor of 1.15 is included in wind
calculations.
9.5 Concrete Design Criteria
Concrete design will utilize EM 1110-2-2104 and the ACI 350R Concrete Sanitary Engineering
Structures and will comply with the ACI 318 latest edition strength design method, unless
otherwise required:
Structural Concrete: 4,000 psi @ 28 days with a maximum water/cement ratio = 0.40
Steel reinforcement 60,000 psi ( ASTM A615)
Passaic River Tidal, New Jersey, General Reevaluation Report
Draft GRR – September, 2017 J-26
Appendix J - Engineering and Design
9.6 Steel Design Criteria
Steel design will utilize the ETL 1110-2-584 and the AISC Steel Construction Manual, 14th
edition. Load combinations will be in accordance with ASCE 7-02. Typical design values
are as follows unless otherwise noted:
(a) Structural steel rolled shapes ASTM 572, Grade 50
ASTM A992, Grade 50
(b) Plates ASTM A992, Grade 36
(c) Bolts and nuts ASTM A325, minimum ¾ inch
ASTM A490
(d) Anchor Bolts ASTM A449, (¾ inch diameter and greater)
(e) Corrosion stainless steel ASTM A304 (freshwater)
ASTM A316 (saltwater)
(f) Sheet Piles ASTM A328, Grade 50
ASTM A572, Grade 50
(g) Stainless Steel Embedded ASTM A276
Anchors or UNS S21800
Normally, components that will be exposed to the elements are either hot-dipped galvanized or
primed, painted and sealed with coats of (10 mils min.) epoxy. Vertical lift gates and steel sheet
pile structures will be painted with an epoxy painting system.
9.7 Pile Foundation Design Criteria
All forces applied to T-Wall structures are resisted by the pile foundation. T-wall monoliths are
assumed to act independent of adjacent monoliths, no load transfer is considered between
monoliths. Pile designs are based on a soil structure interactive analysis with the pile supports
input in accordance with EM 1110-2-2906. Lateral resistance of the soil is based on the soil
horizontal subgrade modulus. In future designs, pile capacities will be determined utilizing
springs based on P-Y and T-Z curves generated by geotechnical analysis. Factors for group
effects have been included in this analysis. Pile capacities have been determined using all-
friction and a combination of friction and end bearing. Micropiles will be considered where
bedrock is reasonably shallow (e.g., <50 feet). Micro-pile capacities include a 10 foot deep rock
socket. H-Pile capacities mainly consider friction; very little end bearing was included. Piles
embedded the standard 6”-9” were analyzed as both fixed and pinned pile heads. Recent research
conducted by the New Orleans and St. Paul districts has indicated that piles with minimal
embedment act as partially fixed, more fixed than pinned. As such, recent practice is to bracket
the connection design with a pinned and fixed analysis. Monoliths with all vertical piles were
Passaic River Tidal, New Jersey, General Reevaluation Report
Draft GRR – September, 2017 J-27
Appendix J - Engineering and Design
rigidly connected to the base and only analyzed as fixed. In order to assure a very rigid
connection, these piles were embedded two pile diameters into the base.
Piles may be Micropiles with continuous casings to bedrock, steel pipe piles, or steel H piles.
Pipe piles satisfy ASTM A252 with minimum yield strength of 45 ksi. H-piles satisfy Grade 50
Steel. Steel piles are designed structurally per AISC ASD, 14th Edition, as modified by EM
1110-2-2906. Combined axial and bending are considered when analyzing the stresses in the
piles.
Vertical piles were used only where space restraints prevented the installation of the more
efficient battered pile. This condition mainly occurred were the floodwall alignment was
sandwiched between the Passaic River/Hackensack River/Newark Bay and buildings located
near the top of bank. Cross sections of the bank and infrastructure were not available; therefore,
it was assumed that a 15 feet top of bank crown at 8 feet NAVD exists with a flood side bank
slope down to the thalwag of the river. The vertical pile design used only a fixed pile head. To
assure this fixity occurred, the piles were embedded a minimum of two pile diameters into the
base. The pile foundation can be used for bearing and also to stabilize the bank slope, similar to
soil nailing, if stability factors of safety are low.
CPGA pile design software was used for this preliminary design. Settlement and ground
instability were not considered to be a factor. Forces from downdrag and unbalanced loads were
not included in the pile design. It was assumed that pile load tests will be conducted in advance
of construction, a Factor of Safety = 2.0 was included for normal load cases and 1.5 for unusual
load cases.
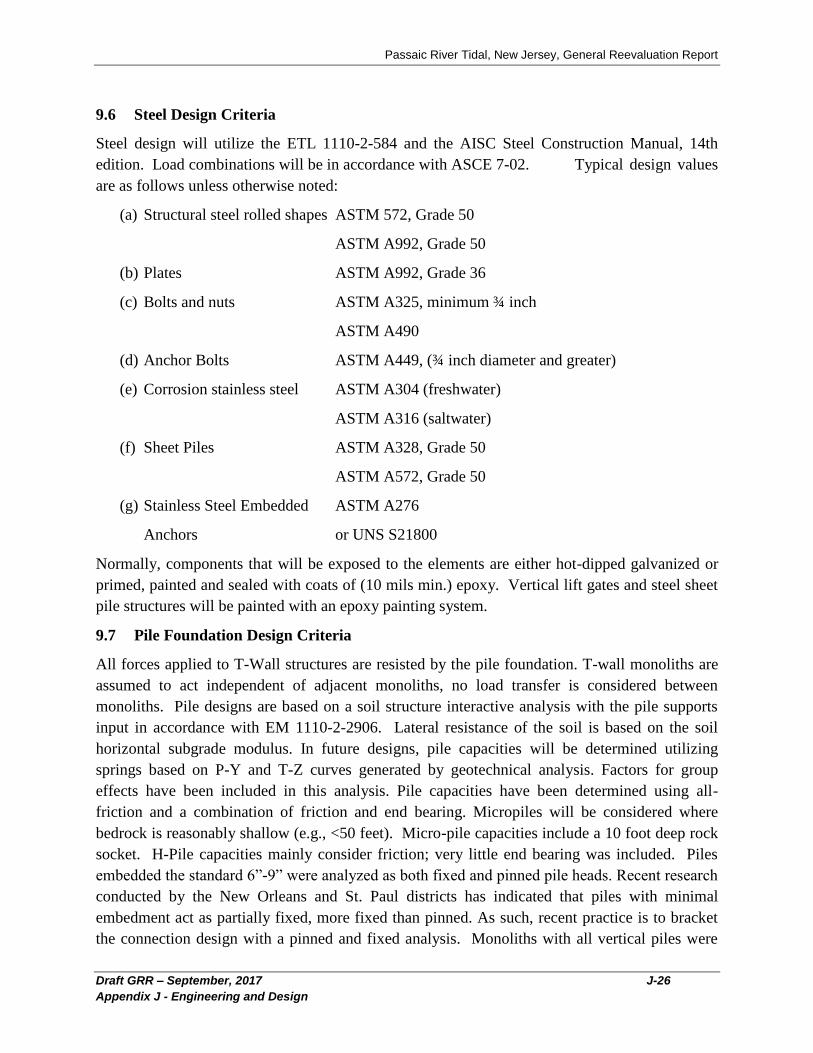
9.8 Construction and Vegetation-Free Zones
Project easements were reviewed for compliance with respect to the USACE’s vegetation
management policy, ETL 1110-2-583, 30 April 2014, Guidelines for Landscape Planting and
Vegetation Management at Levees, Floodwalls, Embankment Dams and Appurtenant Structures.
The current vegetation management guidelines were not in place when the 1995 GDM was
completed. The new guidance requires 15 feet from levee toes, drains or structural features and
15 feet from the faces of floodwalls and a minimum of 8 feet beyond the footing.
This allows for operation and maintenance, surveillance, and access during high-water events.
Vegetation has potential to impact the operations and degrade the performance of the system.
The root-free zone provides a margin of safety between the greatest expected extent of plant
roots critical to the performance and reliability of the flood damage risk reduction system. The
typical configuration for a floodwall, as set forth under USACE’s vegetation management policy,
is shown in Figure 11.
Passaic River Tidal, New Jersey, General Reevaluation Report
Draft GRR – September, 2017 J-28
Appendix J - Engineering and Design
Figure 11: Typical Vegetation-Free Zone Configuration at Floodwall
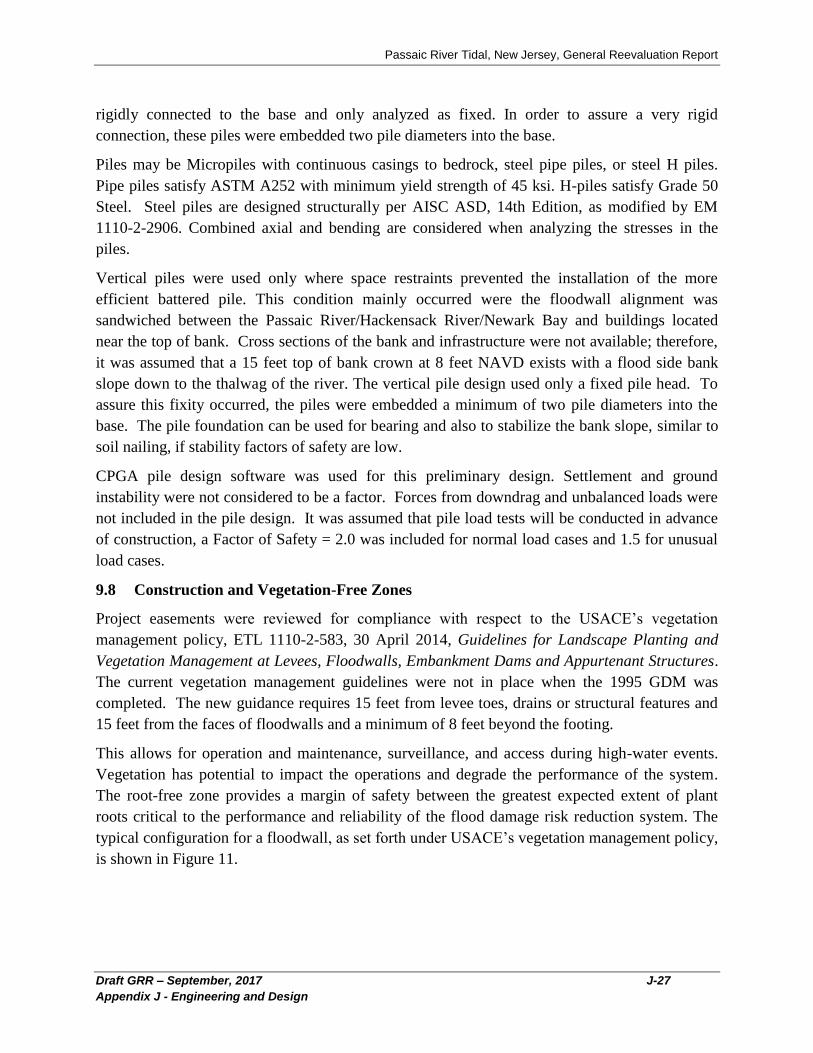
9.9 Armoring
The potential for sizeable waves along the three Newark Bay reaches of the NED Plan line of
protection may necessitate armoring the exterior of the floodwall to help prevent wave-induced
erosion. Articulated block armoring (such as ArmorFlex®) can provide needed protection while
also allowing for grass cover within the block openings for better aesthetic appearance and a
more natural, environmentally friendly surface. Typical articulated block armoring installation is
shown in Figure 12.
Passaic River Tidal, New Jersey, General Reevaluation Report
Draft GRR – September, 2017 J-29
Appendix J - Engineering and Design
Image courtesy CONTECH Engineered Solutions
Figure 12: Articulated Block Armoring
10 CLOSURE GATE DESIGN
10.1 General
There are 64 closure gates in the current NED Plan line of protection and eight in the LPP. The
gates are mostly exterior gates associated with access through the line of protection to the
waterfront. The inventory of gates is shown in Attachment 3 and the project drawings. The
closure gates were grouped into several different categories based on gate openings, heights and
types. The gate types used were predominantly swing gates with the exception of roller gates for
openings of 50 feet or larger. The gates are assumed a mix of closures to span railroads,
highways and pedestrian crossings.
The current design level includes four basic load cases which are loadings that typically control
floodwall/closure gate structures designs. A full array of load cases for each gate will need to be
investigated in the final design phase. The load cases included in the current design are:
1) Construction + Wind: Dead load of the concrete monolith and steel gate, a conservative
wind load of 50 psf, no earthen backfill, no uplift, no construction surcharge. A 33
percent overstress is permitted for this load case.
2) Flood stage at still water (SWL) at 2 feet below top of gate structure with debris impact
loading of 500 lbs/ft applied at the SWL. A 33 percent overstress is permitted for this
load case.
Passaic River Tidal, New Jersey, General Reevaluation Report
Draft GRR – September, 2017 J-30
Appendix J - Engineering and Design
3) Flood stage at water to top of gate (TOG).Wave force is not included. A 33 percent
overstress is permitted for this load case.
4) Flood stage at SWL at two feet below top of gate structure. A 0 percent overstress is
permitted for this load case.
The gate members (girders, intercostals, and skin plates), concrete monolith
(abutments/footings), and foundations were sized to carry these anticipated loads as mentioned
above for all different gate categories which have been selected. Secondary gate features such as
any hinge assemblies, connections, casters, trolleys, or hanger systems were conceptually shown
based on previous similar projects and engineering judgment. Calculations were not performed
to size these types of features. Wave loadings are expected to be minimal due to topographic
conditions and lack of proximity/exposure to full coastal storm surge associated with hurricanes.
It is also assumed, per technical discussions, that there will be no unbalanced loading or
downdrag forces seen by the gates at this level of design. This will require more in-depth
analysis and can be fully vetted during later design stages. Complex pile group analysis;
therefore, was not required. Seismic forces were not considered to govern and were not applied
at this level of design.
For the design effort, the following codes and standards were used, as well as the applicable
portions of the HSDRRSDG (Hurricane Storm Damage Risk Reduction System Design
Guidelines) and the existing project GDM:
EM 1110-2-2705 – Structural Design of Closure Structures for Local Flood Protection
Projects
EM 1110-2-2104 – Strength Design for Concrete Hydraulic Structures
EM 1110-2-2105 – Strength Design for Hydraulic Steel Structures.
Once the preliminary gate designs were compiled for all different gate selections, costs were
developed based on the major contributing “bid” items that would typically be present in final
documents such as: concrete monolith structure (abutments and footings), structural steel gate
(gate overall weight plus detail factor), concrete reinforcing for monolith structure, and pile
foundation (total pile length for the gates). Items such as steel embeds, seals, turnbuckles,
casters, hinge assemblies, access ladders, etc. were included in the structural steel gate item.
Unit prices were based on recent, similar construction projects and adjusted for any regional
effects and applied to the various bid item quantities.
10.2 Grouping
The final closure gate inventory has 64 closure gate structures that fluctuate in gate opening
width and gate height. The gate heights for all 64 closure gates were determined based on the
design water elevation of 14 feet NAVD and their respective existing grade elevations. In
addition, evaluations were completed for gate heights 2 and 4 feet above the 14-foot elevation.

Passaic River Tidal, New Jersey, General Reevaluation Report
Draft GRR – September, 2017 J-31
Appendix J - Engineering and Design
All gates were grouped into several scenarios based on gate openings and heights as shown in
Table 12. The Kearny, Newark and Flanking areas consist of H-pile foundation whereas the
Harrison area consists of concrete micropile foundation. Any opening width equal to 10-feet or
smaller was grouped with the 10-foot gate opening. The 20-foot gate opening was grouped with
a series of opening widths ranging from 15 to 20 feet. The majority of opening widths in the
inventory was for the 30-foot width. The 30-foot gate opening was grouped from 25 to 30 feet.
The 35-foot, 40-foot, 45-foot and 50-foot gate openings were grouped individually, since their
gate opening width is considered to be on the larger end of the swinging gate spectrum.
Table 12: Gate Grouping Scenarios
GATE
OPENING
(Feet)
SWING GATE(H-Pile Foundation)
GATE HEIGHTS(Feet)
10 6 8 10 12 14 16 - - -
20 5 7 9 11 13 - - - -
30 2 4 6 8 10 12 14 16 18
35 9 11 13 15 17 - - - -
40 10 12 14 - - - - - -
45 5 7 9 - - - - - -
50 6 8 10 - - - - - -
GATE
OPENING
(Feet)
SWING GATE(Micro Pile Foundation, Harrison Area)
GATE HEIGHTS(Feet)
30 11 13 15 17 - - - - -
40 2 4 6 8 10 12 - - -
GATE
OPENING
(Feet)
ROLLER GATE
GATE HEIGHTS(Feet)
50 10 12 14 16 - - - - -
Once the gates were group as described above, the smallest gate height and the tallest gate height
for each respective group was determined and a 2-feet incremental height increase was
implemented starting from the minimum to the maximum gate heights. Typically gates for
openings larger than 38 feet would be considered at the threshold for the swing gates. Roller
gates predominantly are seen for openings larger than 38 feet. The gate opening width identified
in the flanking area of the final closure structure inventory ranged from 40 to 150 feet. After
further assessment of the gate openings in the flanking area, the roller gate option will not be
feasible due to the limited space in this area which does not facilitate the construction of the
larger concrete monolith structure. Therefore, the 150 feet opening was divided into three swing
gates with an opening of 50 feet. The inventory list also includes four gate widths opening of 50
feet which have been grouped together as roller gates since the vicinity permitted a larger
concrete monolith structure. The same grouping procedure described above was followed with
respect to gate heights.
Passaic River Tidal, New Jersey, General Reevaluation Report
Draft GRR – September, 2017 J-32
Appendix J - Engineering and Design
10.3 Gate Design
The structural design of the swing/roller gate includes the layout and design of the major
structural elements of the concrete monolith structure and floodgate. This includes the gate steel
members, the concrete gate bay walls and support columns, base slab and the pile foundations.
The structural steel gate members include top and bottom girders spanning horizontally between
concrete bay columns, vertical intercostal framing spaced at approximately 2 feet on center and
spanning between top and bottom girders, steel skin plate spanning between the vertical
intercostal, and steel cross bracing and horizontal bracing. The concrete monoliths are comprised
of two concrete gate bay walls/columns on either side which are formed into the base slab and
pile foundation. The concrete monoliths are supported by the pile foundations. Steel H-piles and
concrete micropiles were applied during design for consistency with the floodwall team. It is
assumed that each gate monolith structure will be flanked by the floodwall structures in the
adjacent reaches. The floodgate drawings are included in the drawing set. The sections and views
on the drawings are grouped as described in Table 12. Based on the gate width and heights, the
design elements will vary in size, location and spacing accordingly.
The analysis of the steel gate and concrete monolith was performed based on the load cases
noted in the introduction. The governing load case was typically the flood stage with water at the
top of the gate. Loads were applied as hydrostatic pressures corresponding to the water surface
elevations on the flood-side. A debris impact uniform loading (500 lbs/ft) was applied at the
appropriate water surface elevations. The skin plate was designed as a fixed end beam spanning
between the vertical intercostals and the deflection was limited to 0.4 of the thickness to ensure
that the flat plate theory is applicable. The horizontal girders were designed as larger wide flange
simply supported beams spanning between the bearing points on the concrete columns making
them true beam elements allowing for flexural stresses. The vertical intercostals were designed
as simple beams spanning between horizontal girders. The vertical intercostals consist of a WT
section welded to the skin plate and were designed as a combined section utilizing the steel skin
plate as the tension flange of the total combined section. The analysis of the reinforced concrete
monolith walls and columns was performed considering fixed support at the interface of the
bottom of the wall and top of slab. The wall analysis considered a 1 foot unit width of the wall
acting as a cantilever and connected only to the base slab. The column analysis considered half
of the gate width and width of the column loading on the column acting as a cantilever and
connected only to the base slab. The entire analysis for the floodgate and concrete monolith was
carried out by hand calculations for one gate width and height which than an excel spreadsheet
program was developed to generated the analysis design for all chosen gate scenarios listed in
Table 12. Gate calculations are provided in Attachment 3.
Gate cost estimates were developed based on the results of the analysis above. The cost estimate
was broken down into four items corresponding to each individual gate width and height. The
four cost items are the structural steel gate, concrete monolith structure, concrete reinforcing and
pile foundation with a final total project cost.
Passaic River Tidal, New Jersey, General Reevaluation Report
Draft GRR – September, 2017 J-33
Appendix J - Engineering and Design
11 PUMP STATIONS
The 1995 GDM includes six pump stations for interior drainage, ranging from 30 to 100 cfs. The
GRR did not include conceptual design of the pump stations; rather, the pump station costs were
updated based on a cost curve developed from a range of pump station sizes.
12 UTILTIES RELOCATION/PROTECTION
Similar to the pump stations, there is insufficient detail to estimate the scope and cost for utilities
relocations and/or protections for features passing through the line of protection. However, a cost
allotment for utilities relocation was included in the cost estimate. Features such a pipe sleeves
through or under the floodwall were considered in the Abbreviated Risk Analysis.
13 DESIGN AND CONSTRUCTION SCHEDULE
The preliminary design and construction schedule is shown in Attachment 4.
14 DRAWINGS
The TSP (LPP) drawings are provided as Attachment 5.
15 ADDITIONAL ANALYSES AND DATA COLLECTION
Additional analyses and data collection are required to finalize the project design. These work
efforts will be conducted as part of the next phase of the project or during the development of
Plans and Specifications (P&S) and include:
15.1 Future Geotechnical Needs
In order to obtain a better understanding of the subsurface condition and more accurate soil
physical properties, additional field investigation and lab testing need to be performed for the
final design. The recommendations listed below may be considered to augment the previous
investigations:
1) Additional soil borings will be performed typically every 200 feet, and in the traverse
direction perpendicular to the floodwall alignment.
15.2 Future Survey Needs
The following survey efforts are required in order to produce final P&S:
Passaic River Tidal, New Jersey, General Reevaluation Report
Draft GRR – September, 2017 J-34
Appendix J - Engineering and Design
1) Additional detailed topographic surveys along the authorized LOP and in the locations of
project features will be required to support 30-scale design drawings.
2) Detailed utilities surveys along the LOP and near project features will also be required.
15.3 Future Interior Drainage Analysis
Due to the availability of more robust modeling software and more detailed topographic
mapping, a more refined interior drainage analysis can be achieved, possibly resulting in the
removal of one or more of the proposed pump stations. The receipt of detailed utilities and
stormwater network information will also help refine the analysis.
An interior drainage analysis for the LPP, the Flanking Plan, has not yet been conducted. While
estimated costs for interior drainage features have been included in the LPP First Costs, interior
drainage features have not yet been identified. The interior drainage analysis for the LPP will be
completed prior to the final GRR.
16 PERMITS AND APPLICATIONS
Permits and applications will be identified and developed as part of the development of P&S.
The following is a list of permits required for construction; however, this list is not exclusive:
1) New Jersey Flood Hazard Area
2) Individual Freshwater Wetlands
3) General Permit 12 (GP-12), Survey and Investigating
4) Soil Erosion and Sediment Control
5) New Jersey Pollutant Discharge Elimination System
6) New Jersey Dept. of Transportation permits
7) Treatment Works Approval (TWA) for any modifications to existing sanitary sewers
17 EMERGENCY ACTION PLAN
An Emergency Action Plan will be developed during the Plans and Specifications Phase of the
project. The coordination of this effort will include the non-Federal partner, county and
municipalities.
18 OPERATION AND MAINTENANCE
Development of an Operation, Maintenance, Repair, Replacement and Rehabilitation Manual
will be performed during the Construction Phase of the project.
Passaic River Tidal, New Jersey, General Reevaluation Report
Draft GRR – September, 2017 J-35
Appendix J - Engineering and Design
19 REFERENCES
1. USACE (1995), General Design Memorandum (GDM), Passaic River Flood Damage
Reduction Project, Appendix E- Geotechnical Design, Levees, Floodwalls and
Miscellaneous, United States Army Corps of Engineers, dated September 1995.
2. “Design and Construction of Levees”, EM1110-2-1913, United States Army Corps of
Engineers, dated April 30, 2000.
3. Idriss, I. M., & Boulanger, R. W. (2008). Soil liquefaction during earthquakes. Earthquake
engineering research institute.
4. “http://earthquake.usgs.gov/hazards/products/conterminous/2008/”, Accessed December 14,
2015.
5. “AASHTO LRFD Bridge Design Specifications”, 7th ed., American Association of State
Highway and Transportation Officials, dated 2014.
6. Das, B. M. (2006). Principles of geotechnical engineering, Nelson, Ontario, Canada, 686 p.
7. “Retaining & Flood Walls”, EM 1110-2-2502, United States Army Corps of Engineers, dated
September 29, 1989.
8. “Design Guidance for Levee Underseepage”, ETL-1110-2-569, United States Army Corps of
Engineers, dated May a, 2005.

Passaic River Tidal, New Jersey, General Reevaluation Report
Draft GRR – September, 2017
Appendix J - Engineering and Design
ATTACHMENT 1
GEOTECHNICAL ANALYSIS
Passaic River Tidal, New Jersey, General Reevaluation Report
Draft GRR – September, 2017
Appendix J - Engineering and Design
ATTACHMENT 2
T-WALL STRUCTURAL ANALYSIS
Passaic River Tidal, New Jersey, General Reevaluation Report
Draft GRR – September, 2017
Appendix J - Engineering and Design
ATTACHMENT 3
CLOSURE GATE INVENTORY AND CALCULATIONS
Passaic River Tidal, New Jersey, General Reevaluation Report
Draft GRR – September, 2017
Appendix J - Engineering and Design
ATTACHMENT 4
DESIGN AND CONSTRUCTION SCHEDULE
Passaic River Tidal, New Jersey, General Reevaluation Report
Draft GRR – September, 2017
Appendix J - Engineering and Design
ATTACHMENT 5
DRAWINGS


![Draft Environmental Impact Report Appendix L · SEPTEMBER 2016 Draft Environmental Impact Report (DRAFT EIR) [STATE CLEARINGHOUSE NO. 2015021014] ... This appendix presents the hydrology](https://img.pdfslide.us/doc/110x75/5eda3e90b3745412b57103f4/draft-environmental-impact-report-appendix-l-september-2016-draft-environmental.jpg)